Downloaded 73 times


![Esther LaVielle SurveyAnalytics http://www.surveyanalytics.com [email_address] Andrew Jeavons [email_address] Questions? Conclusion](https://image.slidesharecdn.com/surveyanalyticsconjointanalysis1-110223140055-phpapp02/75/Survey-analytics-conjointanalysis_1-30-2048.jpg)

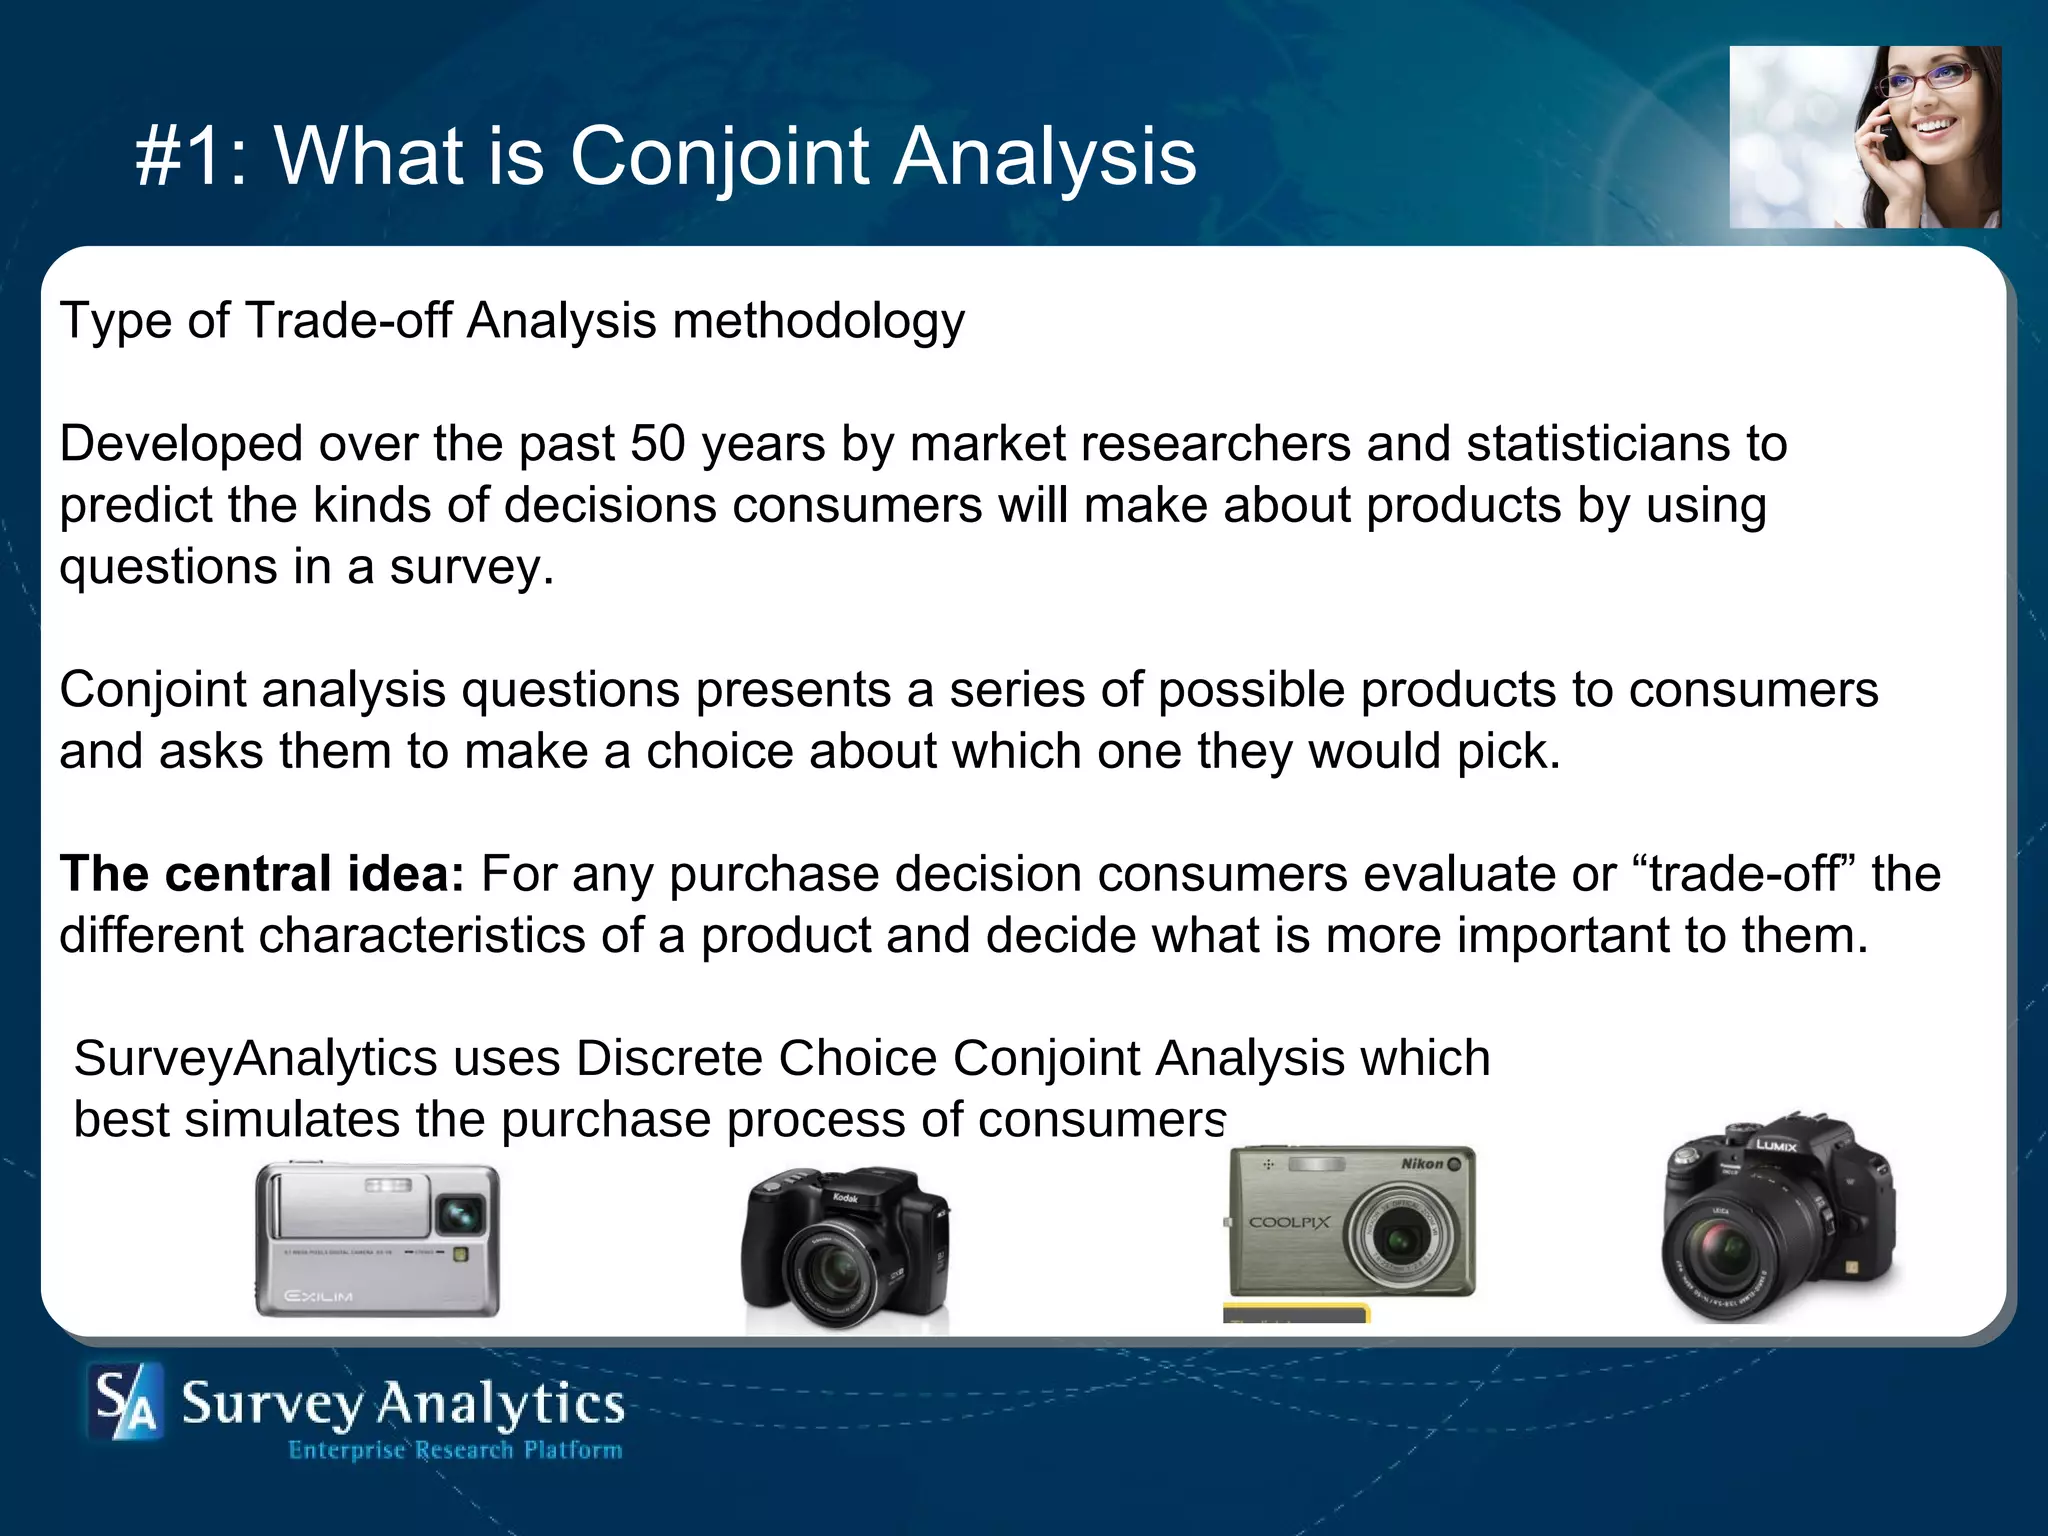
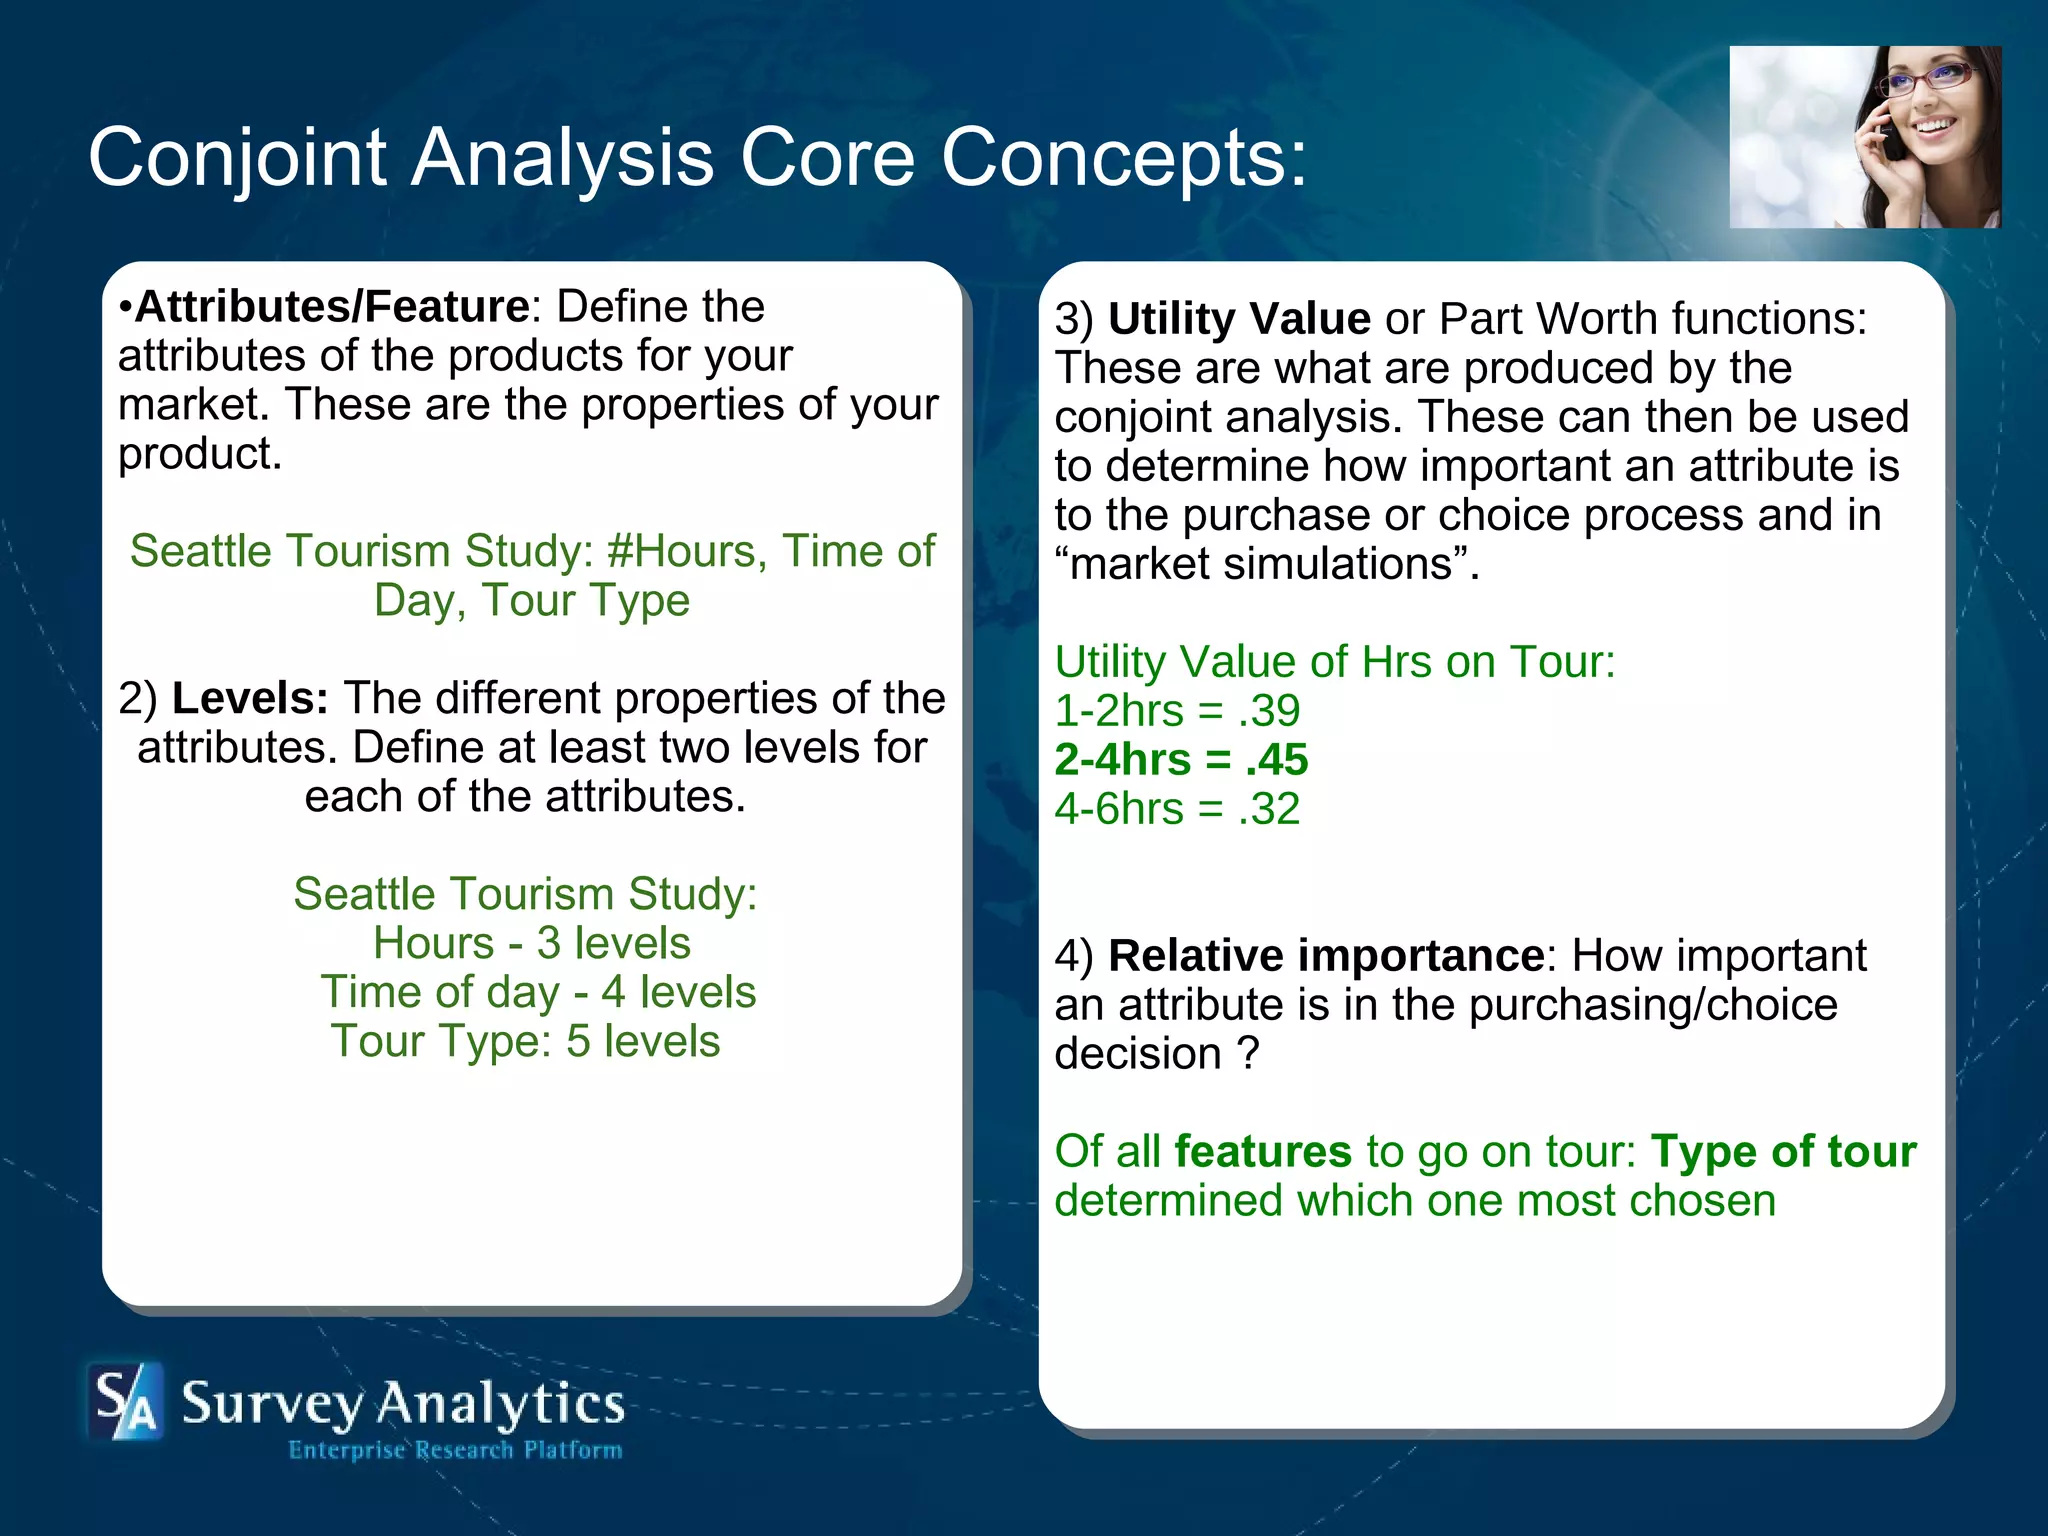
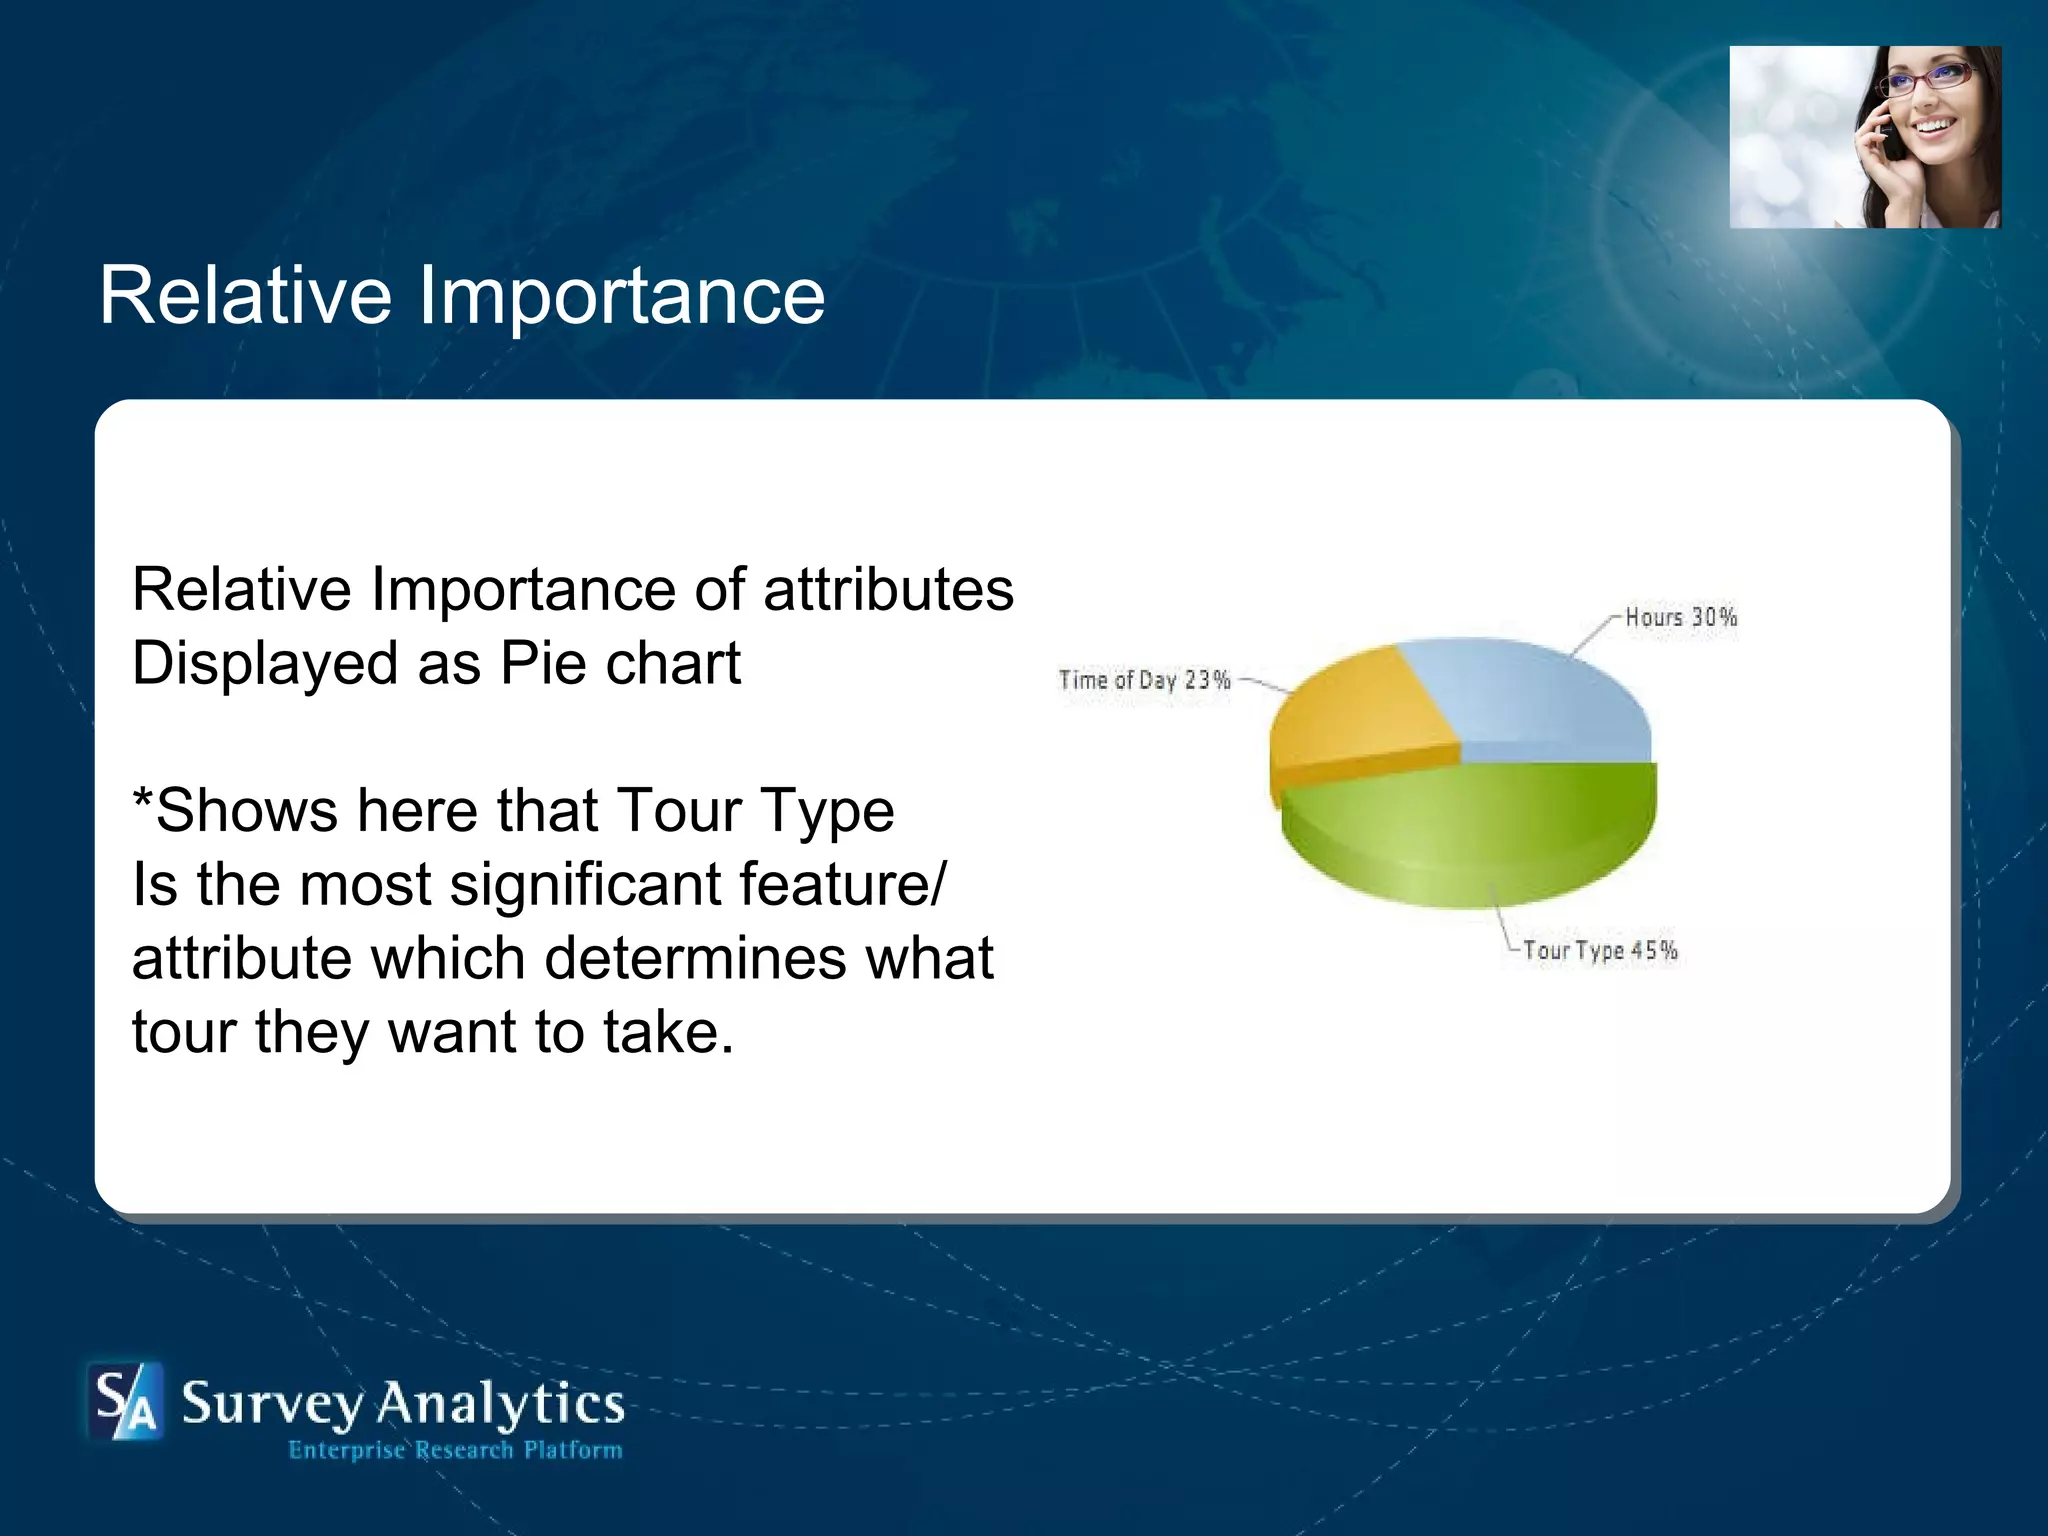
1) The document provides an overview of a webinar on conducting discrete choice conjoint analysis projects using SurveyAnalytics software. 2) It discusses key aspects of setting up a conjoint analysis study such as defining attributes and levels, sample size considerations, and best practices for survey design. 3) The webinar demonstrates how to interpret conjoint analysis outputs including relative importance scores and market simulations.


