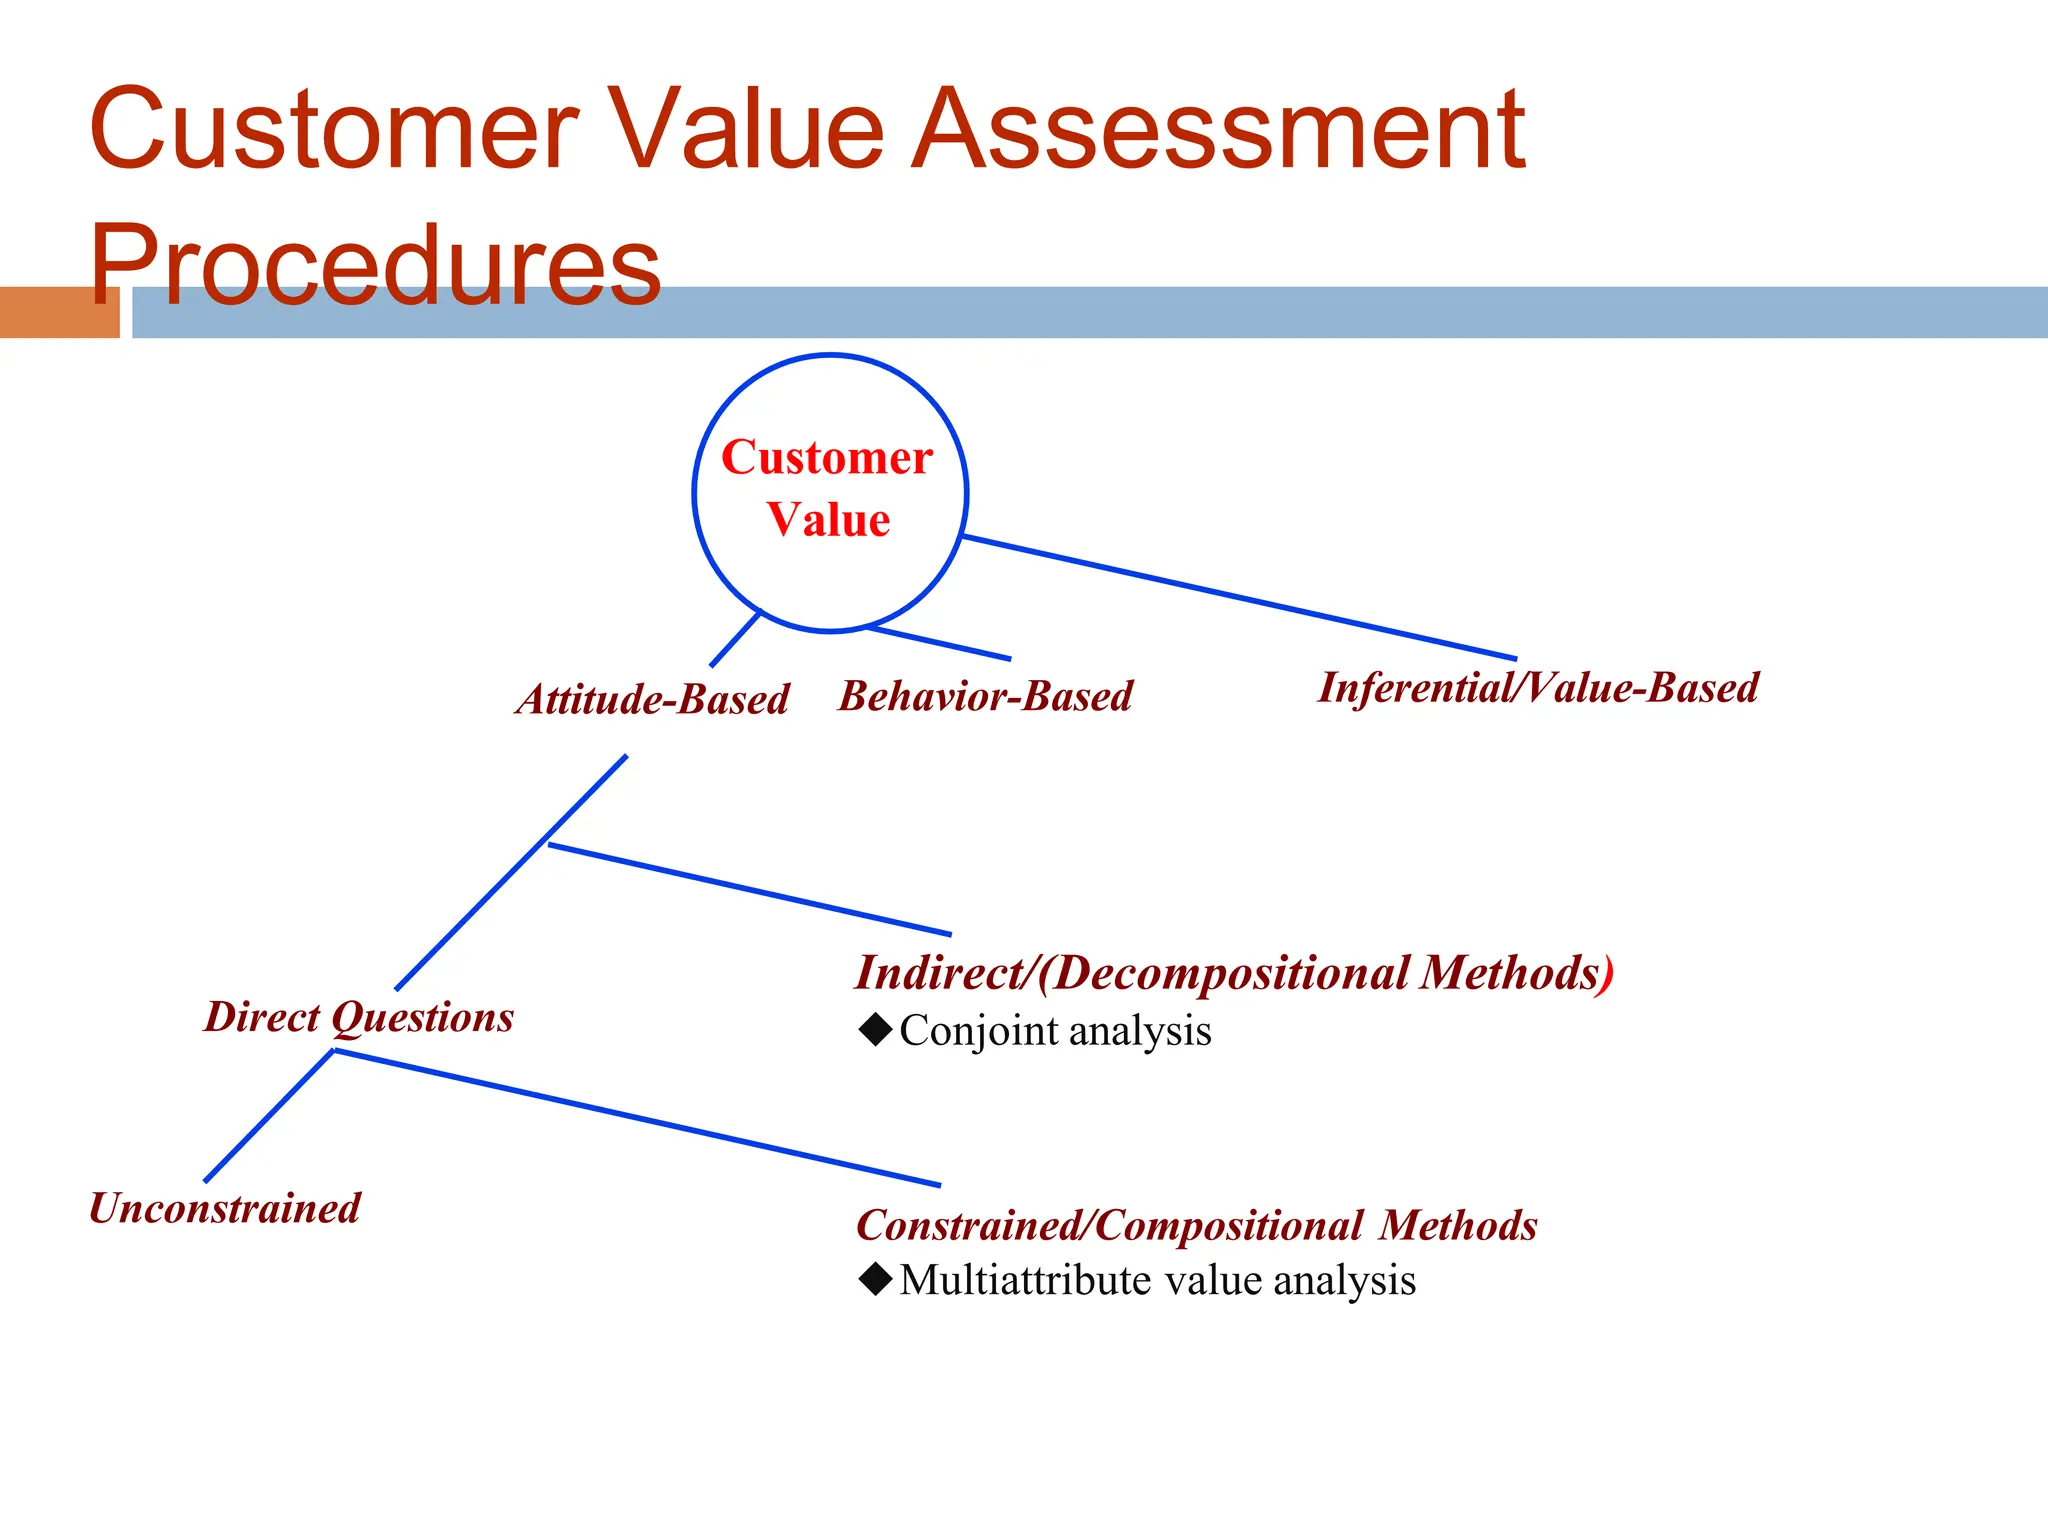
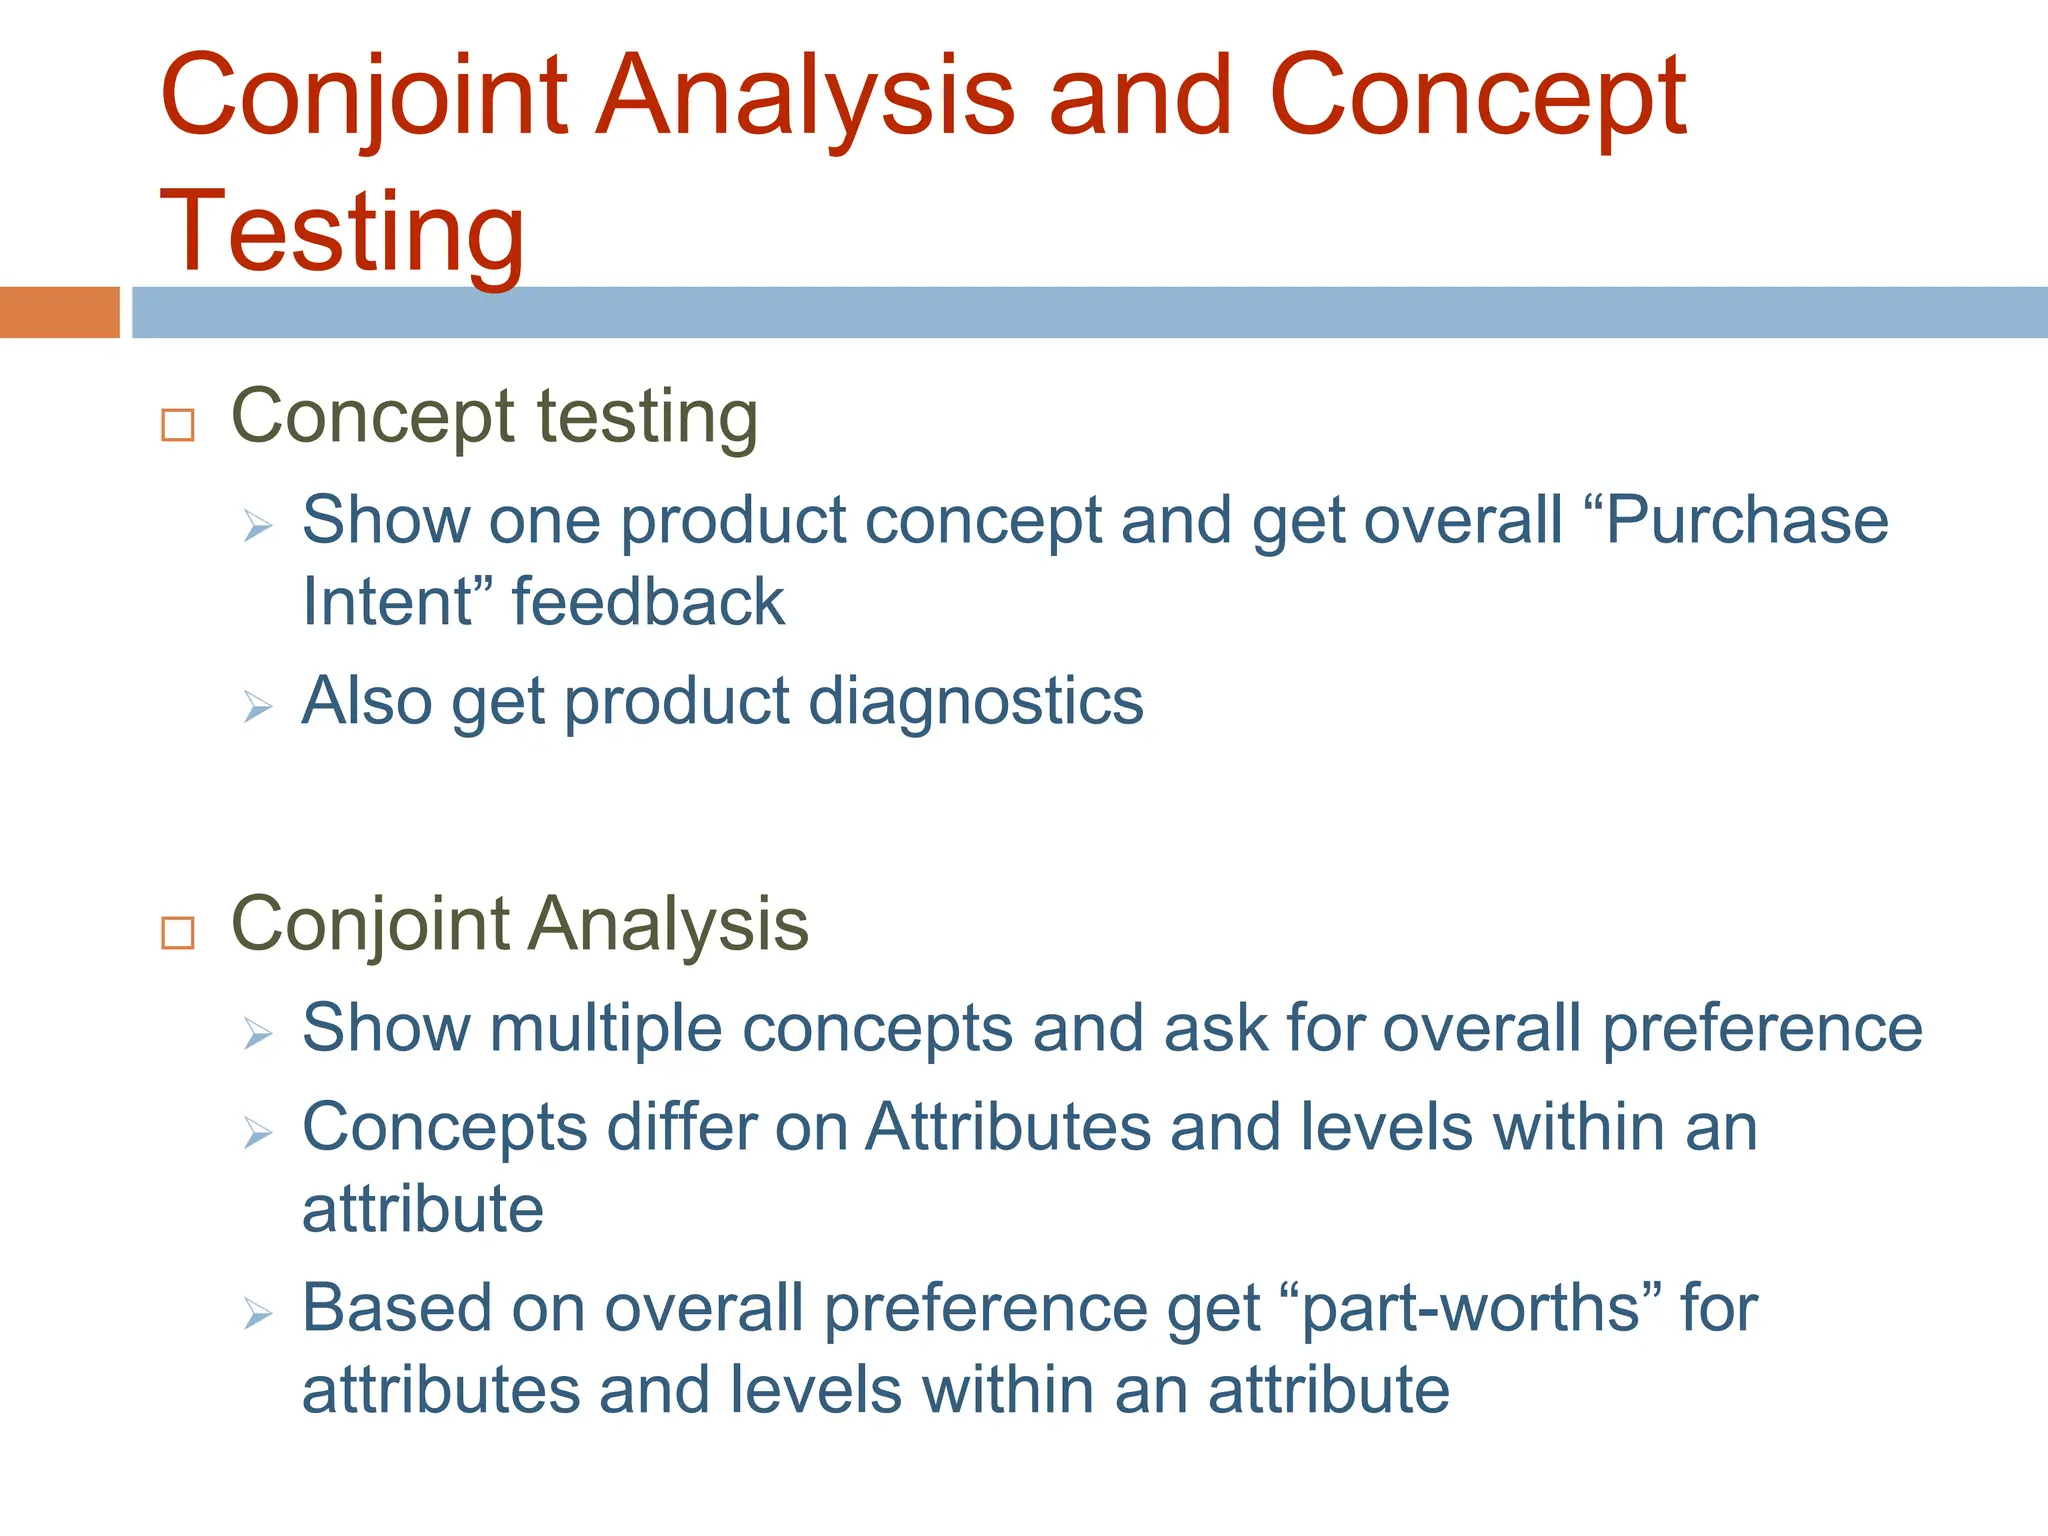
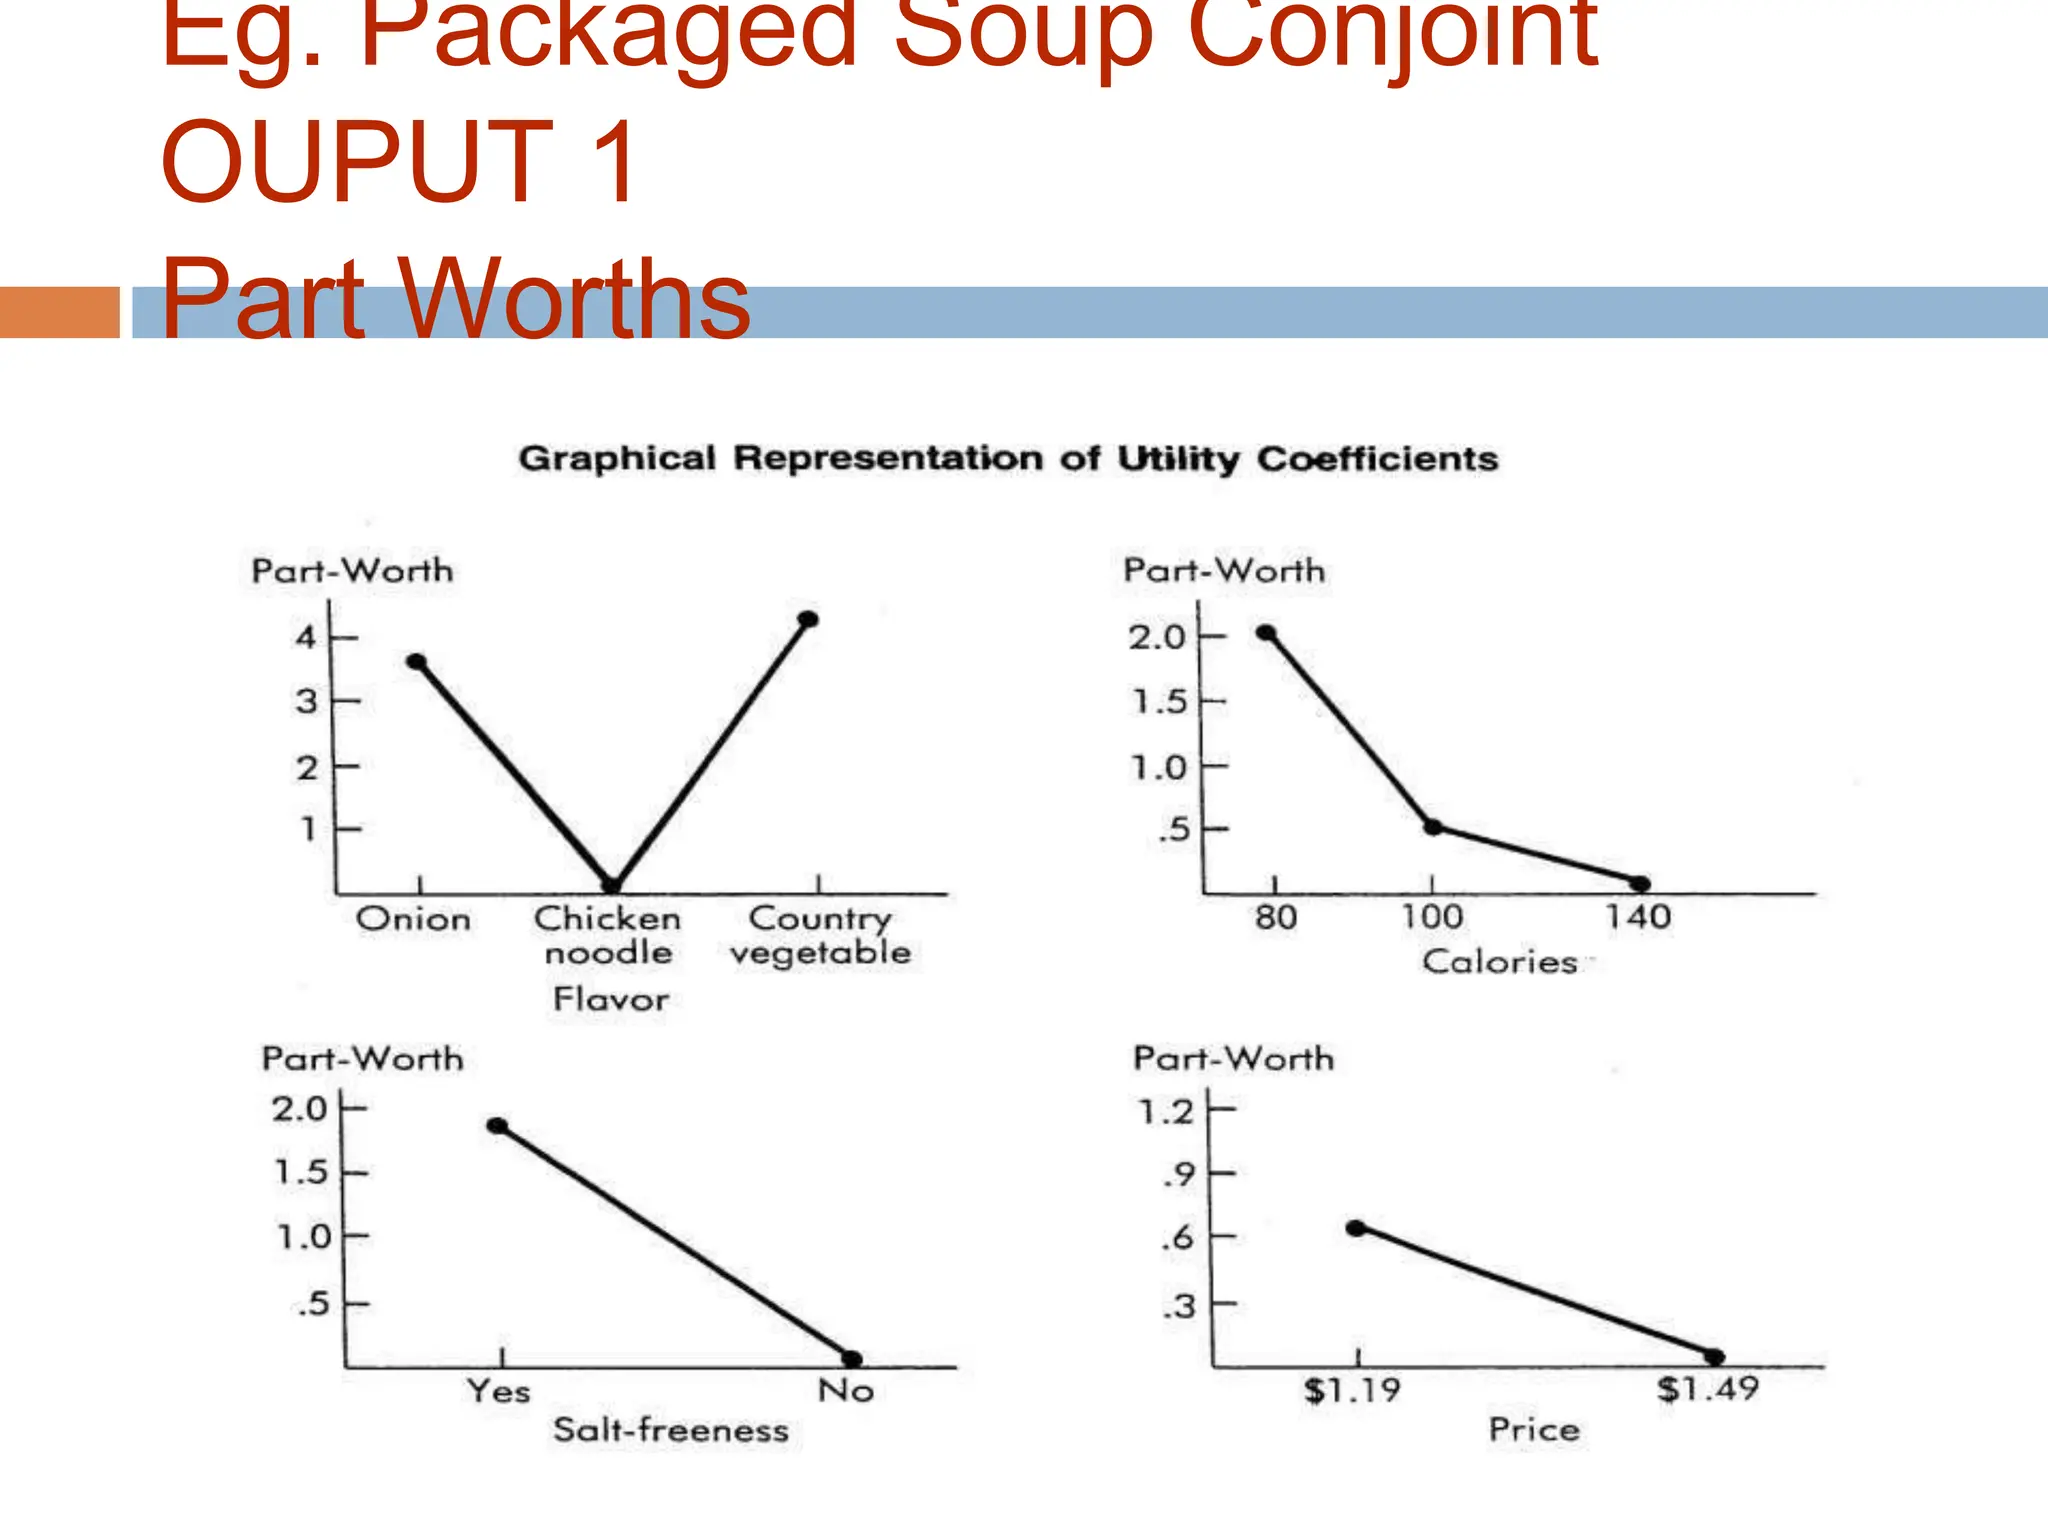
CONJOINT ANALYSIS
Customer Value Assessment
Procedures
Customer
Value
Attitude-Based
Direct Questions
Unconstrained Constrained/Compositional Methods
Multiattribute value analysis
Indirect/(Decompositional Methods)
Conjoint analysis
Behavior-Based Inferential/Value-Based
Conjoint Analysis and Concept
Testing
 Concept testing
 Show one product concept and get overall “Purchase
Intent” feedback
 Also get product diagnostics
 Conjoint Analysis
 Show multiple concepts and ask for overall preference
 Concepts differ on Attributes and levels within an
attribute
 Based on overall preference get “part-worths” for
attributes and levels within an attribute
A Survey
 Familiarity & usage of value assessment methods
 58 industrial firms in the top 125 of the Fortune 500
list
 16 market research firms from the top 40
Survey Results
Method Industrial Market Research
Familiarity % Usage % Familiarity % Usage %
Internal Engg.
Assessment
61.3 42.5 - -
Field value-in-use 63.8 36.3 25 5
Focus group 92.5 60 90 60
Direct survey 91.3 48.8 85 55
Benchmarks 83.8 27.5 80 25
Conjoint 75 28.8 90 60
Compositional
methods
45 10 40 5
Conjoint Analysis in Product
Design
Should we offer our business travelers more room space or a
fax machine in their room?
Given a target cost for a product, should we enhance product
reliability or its performance?
Should we use a steel or aluminum casing to increase
customer preference for the new equipment?
P&G and Disposable Diapers
 Question: What value do consumers associate with two
improved features in disposable diapers:
 Improved absorbency
 Elastic waistband
Conjoint Analysis Assumption
 Products can be defined by their individual
attributes and levels within the attribute
 Consumer responses to the overall preference
can be then partitioned to attributes
Eg. Packaged Soup
Eg. Packaged Soup individual
concept
Eg. Packaged Soup Conjoint
INPUT
Cards and Ratings
Eg. Packaged Soup Conjoint
OUPUT 1
Part Worths
Eg. Packaged Soup Conjoint
OUPUT 1
Part Worths
 Flavor 45%
 Calories 25%
 Salt Freeness 22%
 Price 8%
Eg. Packaged Soup Conjoint
OUPUT 2
Importance
 Weights of Attributes
How were the part-worths calculated and
how was the importance determined?
How does one use
Part Worths?
Importance?
The Black box
The Conjoint Model
utilities
attributes
U u(a1) u(a2) ...
Notebook computer example
Processing speed:
2) Hard drive:
3) Memory:
1.5 GHz or 2.5 GHz
120 GB or 160 GB
1 GB or 2 GB RAM
There are 8 different combinations of notebook - defined as product profiles:
One respondent’s preference
Input to computer system – dummy variable
regression
Part Worth Estimation
Regression of ranks vs the attributes
U = a + b1*Processor + b2*Hard Drive + b3*Memory
The intution
U 1 a b1 0 b2 0 b3 0 a
U 2 a b1 1 b2 0 b3 0 a b1
U 3 a b1 0 b2 1 b3 0 a b2
U 4 a b1 0 b2 0 b 3 1 a b3
a U 1 1
b1 U 2 U 1 5 1 4
b2 U 3 U 1 3 1 2
b3 U 4 U 1 2 1 1
Forecast preferences to check
accuracy
U5 a b1 1 b2 1 b3 0 7
U6 a b1 0 b2 1 b3 1 4
U7 a b1 1 b2 0 b3 1 6
U8 a b1 1 b2 1 b3 1 8
Weightage and Relative Importance of Each Attribute
b1 4
b1 b2 b3 7
b2 2
b1 b2 b3 7
b3 1
b1 b2 b3 7
Processo
r Speed
Hard
Drive
Memory
= 57%
= 29%
= 14%
Segment consumers based on
preferences
Are there segments in terms of preferences?
Here preference is the “basis” and “age” could be
the descriptor
Eg. Packaged Soup
Which is the most important attribute & which is the best product to
introduce?
Conjoint Simulation - The Motivation
1. What share can the new brand obtain?
2. Where does this share will come from?
Conjoint Simulation - The Principle
Before introduction share: A=40%, B=60%.
After introduction share: A=20%,B=50%, and New=30%.
Other ways of getting responses
Stage 1—Design the conjoint study:
Step 1.1:
Step 1.2:
Step 1.3:
Select attributes relevant to the product or service category,
Select levels for each attribute, and
Develop the product bundles to be evaluated.
Stage 2—Obtain data from a sample of respondents:
Step 2.1:
Step 2.2:
Design a data-collection procedure, and
Select a computation method for obtaining part-worth
functions.
Stage 3—Evaluate product design options:
Step 3.1:
Step 3.2:
Step 3.3:
Segment customers based on their part-worth functions,
Design market simulations, and
Select choice rule.
Conjoint Study Process
29
Attributes Should Be…
 Determinant
 Easily measured and communicated
 Controllable by the company
 Realistic
 Such that there will be preferences for some
levels over others
 Compensatory
 As a set, sufficient to define the choice
situation
 Without built-in redundancies
30
How Many Levels per Attribute?
 Levels and range should be
meaningful, informative, and realistic to
consumers and producers
 Avoiding absurd configurations
 Marginal increases in levels can greatly
increase respondent’s task
31
Which Data Collection Method?
 Full profile: Show complete list of attributes
 Limited to 6-7 attributes
 Pair-wise: Show pairs of attributes in matrix; each cell
rated from most to least preferred
 Lacks realism
 Inconsistent responses likely
Designing a Frozen Pizza – Paired
Comparison Approach
1. Crust 2. Type of Cheese 3. Price
Pan Romano $ 9.99
Thin Mixed cheese $ 8.99
Thick Mozzeralla $ 7.99
4. Topping
Pineapple
Veggie
Sausage
Pepperoni
5. Amount of Cheese
2 oz.
4 oz.
6 oz.
A total of 324 (3 * 4 * 3 * 3 * 3) different pizzas can be developed from these options!

Conjoint Analysis.pptx

  • 1.
  • 2.
    Customer Value Assessment Procedures Customer Value Attitude-Based DirectQuestions Unconstrained Constrained/Compositional Methods Multiattribute value analysis Indirect/(Decompositional Methods) Conjoint analysis Behavior-Based Inferential/Value-Based
  • 3.
    Conjoint Analysis andConcept Testing  Concept testing  Show one product concept and get overall “Purchase Intent” feedback  Also get product diagnostics  Conjoint Analysis  Show multiple concepts and ask for overall preference  Concepts differ on Attributes and levels within an attribute  Based on overall preference get “part-worths” for attributes and levels within an attribute
  • 4.
    A Survey  Familiarity& usage of value assessment methods  58 industrial firms in the top 125 of the Fortune 500 list  16 market research firms from the top 40
  • 5.
    Survey Results Method IndustrialMarket Research Familiarity % Usage % Familiarity % Usage % Internal Engg. Assessment 61.3 42.5 - - Field value-in-use 63.8 36.3 25 5 Focus group 92.5 60 90 60 Direct survey 91.3 48.8 85 55 Benchmarks 83.8 27.5 80 25 Conjoint 75 28.8 90 60 Compositional methods 45 10 40 5
  • 6.
    Conjoint Analysis inProduct Design Should we offer our business travelers more room space or a fax machine in their room? Given a target cost for a product, should we enhance product reliability or its performance? Should we use a steel or aluminum casing to increase customer preference for the new equipment?
  • 7.
    P&G and DisposableDiapers  Question: What value do consumers associate with two improved features in disposable diapers:  Improved absorbency  Elastic waistband
  • 8.
    Conjoint Analysis Assumption Products can be defined by their individual attributes and levels within the attribute  Consumer responses to the overall preference can be then partitioned to attributes
  • 9.
  • 10.
    Eg. Packaged Soupindividual concept
  • 11.
    Eg. Packaged SoupConjoint INPUT Cards and Ratings
  • 12.
    Eg. Packaged SoupConjoint OUPUT 1 Part Worths
  • 13.
    Eg. Packaged SoupConjoint OUPUT 1 Part Worths
  • 14.
     Flavor 45% Calories 25%  Salt Freeness 22%  Price 8% Eg. Packaged Soup Conjoint OUPUT 2 Importance  Weights of Attributes
  • 15.
    How were thepart-worths calculated and how was the importance determined? How does one use Part Worths? Importance? The Black box
  • 16.
  • 17.
    Notebook computer example Processingspeed: 2) Hard drive: 3) Memory: 1.5 GHz or 2.5 GHz 120 GB or 160 GB 1 GB or 2 GB RAM There are 8 different combinations of notebook - defined as product profiles:
  • 18.
  • 19.
    Input to computersystem – dummy variable regression
  • 20.
    Part Worth Estimation Regressionof ranks vs the attributes U = a + b1*Processor + b2*Hard Drive + b3*Memory The intution U 1 a b1 0 b2 0 b3 0 a U 2 a b1 1 b2 0 b3 0 a b1 U 3 a b1 0 b2 1 b3 0 a b2 U 4 a b1 0 b2 0 b 3 1 a b3 a U 1 1 b1 U 2 U 1 5 1 4 b2 U 3 U 1 3 1 2 b3 U 4 U 1 2 1 1
  • 21.
    Forecast preferences tocheck accuracy U5 a b1 1 b2 1 b3 0 7 U6 a b1 0 b2 1 b3 1 4 U7 a b1 1 b2 0 b3 1 6 U8 a b1 1 b2 1 b3 1 8
  • 22.
    Weightage and RelativeImportance of Each Attribute b1 4 b1 b2 b3 7 b2 2 b1 b2 b3 7 b3 1 b1 b2 b3 7 Processo r Speed Hard Drive Memory = 57% = 29% = 14%
  • 23.
    Segment consumers basedon preferences Are there segments in terms of preferences? Here preference is the “basis” and “age” could be the descriptor
  • 24.
    Eg. Packaged Soup Whichis the most important attribute & which is the best product to introduce?
  • 25.
    Conjoint Simulation -The Motivation 1. What share can the new brand obtain? 2. Where does this share will come from?
  • 26.
    Conjoint Simulation -The Principle Before introduction share: A=40%, B=60%. After introduction share: A=20%,B=50%, and New=30%.
  • 27.
    Other ways ofgetting responses
  • 28.
    Stage 1—Design theconjoint study: Step 1.1: Step 1.2: Step 1.3: Select attributes relevant to the product or service category, Select levels for each attribute, and Develop the product bundles to be evaluated. Stage 2—Obtain data from a sample of respondents: Step 2.1: Step 2.2: Design a data-collection procedure, and Select a computation method for obtaining part-worth functions. Stage 3—Evaluate product design options: Step 3.1: Step 3.2: Step 3.3: Segment customers based on their part-worth functions, Design market simulations, and Select choice rule. Conjoint Study Process
  • 29.
    29 Attributes Should Be… Determinant  Easily measured and communicated  Controllable by the company  Realistic  Such that there will be preferences for some levels over others  Compensatory  As a set, sufficient to define the choice situation  Without built-in redundancies
  • 30.
    30 How Many Levelsper Attribute?  Levels and range should be meaningful, informative, and realistic to consumers and producers  Avoiding absurd configurations  Marginal increases in levels can greatly increase respondent’s task
  • 31.
    31 Which Data CollectionMethod?  Full profile: Show complete list of attributes  Limited to 6-7 attributes  Pair-wise: Show pairs of attributes in matrix; each cell rated from most to least preferred  Lacks realism  Inconsistent responses likely
  • 32.
    Designing a FrozenPizza – Paired Comparison Approach 1. Crust 2. Type of Cheese 3. Price Pan Romano $ 9.99 Thin Mixed cheese $ 8.99 Thick Mozzeralla $ 7.99 4. Topping Pineapple Veggie Sausage Pepperoni 5. Amount of Cheese 2 oz. 4 oz. 6 oz. A total of 324 (3 * 4 * 3 * 3 * 3) different pizzas can be developed from these options!