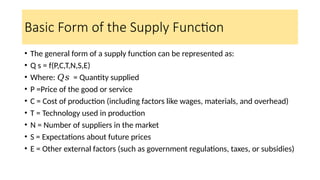
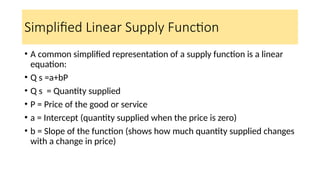
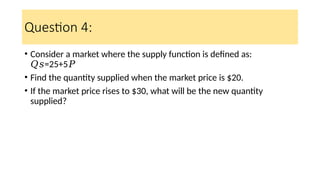
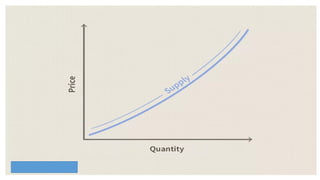
supply function
supply function
• A supply function is a mathematical representation that describes the
relationship between the quantity of a good or service that producers
are willing and able to sell and the price of that good or service, along
with other factors that may influence supply.
• It is an essential component of microeconomic theory and is often
used to analyze market behavior.
Basic Form of the Supply Function
• The general form of a supply function can be represented as:
• Q s = f(P,C,T,N,S,E)
• Where: = Quantity supplied
š‘„š‘ 
• P =Price of the good or service
• C = Cost of production (including factors like wages, materials, and overhead)
• T = Technology used in production
• N = Number of suppliers in the market
• S = Expectations about future prices
• E = Other external factors (such as government regulations, taxes, or subsidies)
Simplified Linear Supply Function
• A common simplified representation of a supply function is a linear
equation:
• Q s =a+bP
• Q s = Quantity supplied
• P = Price of the good or service
• a = Intercept (quantity supplied when the price is zero)
• b = Slope of the function (shows how much quantity supplied changes
with a change in price)
Example of a Supply Function
• Suppose the supply function for a specific product is given by: = 20
š‘„š‘ 
+ 3 š‘ƒ
• ​=20+3P
• In this case: When the price ( ) is $0, the quantity supplied ( ​) is
š‘ƒ š‘„š‘ 
20 units.
• For every $1 increase in price, the quantity supplied increases by 3
units.
Conclusion
• The supply function is crucial for understanding how different factors
influence the quantity of goods that producers are willing to offer for
sale at various prices. It plays a significant role in market analysis,
helping to determine equilibrium price and quantity in conjunction
with the demand function.
Characteristics of the Supply Function
• Positive Relationship: Typically, the supply function has a positive slope, indicating
that as the price increases, the quantity supplied also increases. This reflects the
law of supply.
• Shift Factors: The supply function can shift due to changes in non-price factors:
• Increase in Costs: If production costs rise (e.g., due to higher wages), the supply
function shifts to the left, indicating a decrease in supply at all price levels.
• Technological Advances: Improvements in technology can lower production costs
and increase supply, shifting the supply function to the right.
• Number of Suppliers: An increase in the number of suppliers in the market can
lead to an increase in overall supply, shifting the supply function to the right.
Question 1:
• A company's supply function for a product is given by the equation
Q s ​=10+2P
• Where Q s​ is the quantity supplied and
š‘„š‘  š‘ƒ
• P is the price of the product.
• Calculate the quantity supplied when the price is $15.
• What would be the quantity supplied if the price increases to $25?
• Step 1: Calculate the Quantity Supplied at a Price of $15
• Substitute = 15 P=15 into the supply function:
š‘ƒ
• š‘„š‘ = 10 + 2 ( 15 ) = 40
• So, when the price is $15, the quantity supplied is 40 units.
Step 2: Calculate the Quantity Supplied at a Price of $25
Substitute
P=25 into the supply function:
š‘„š‘ =10+2(25) = 60
• So, when the price increases to $25, the quantity supplied is 60 units.
• Summary
• Quantity supplied at $15: 40 units
• Quantity supplied at $25: 60 units
Question 2:
• The supply function for a specific good is represented by the
equation: Q s =5Pāˆ’10
• Where is the quantity supplied and is the price.
š‘„š‘  š‘ƒ
• Determine the quantity supplied when the price is $10.
• If the price decreases to $5, what is the new quantity supplied?
Question 3:
• A farmer's supply function for apples is described by the equation:
• Q s =4+3P
• Calculate the quantity of apples supplied when the price per pound is
$8.
• If the price rises to $12, how many pounds of apples will the farmer
supply?
Question 4:
• Consider a market where the supply function is defined as:
=25+5
š‘„š‘  š‘ƒ
• Find the quantity supplied when the market price is $20.
• If the market price rises to $30, what will be the new quantity
supplied?
Supply Curve?
• The supply curve illustrates the correlation between the cost of a
product or service and the quantity of it that is available. The supply
curve is shown in a graph with the price on the left vertical axis and
the quantity supplied on the horizontal axis.
• The supply curve can be seen as a visual demonstration of how the
law of supply and demand works. Prices increase when supply is low.
Key Takeaways
• A supply curve can often show if a commodity will experience a price
increase or decrease based on demand, and vice versa.
• The supply curve is shallower (closer to horizontal) for products with
more elastic supply and steeper (closer to vertical) for products with
less elastic supply.
• The supply curve, along with the demand curve, are the key
components of the law of supply and demand.
How a Supply Curve Works
• The supply curve will move upward from left to right, illustrating the
law of supply: As the price of a given commodity increases, the
quantity supplied will increase (all else being equal).
• Note that this formulation implies that price is the independent
variable, and quantity is the dependent variable. In most disciplines,
the independent variable appears on the horizontal or x-axis, but
economics is an exception to this rule.
• If a factor besides price or quantity changes, a new supply curve
needs to be drawn. For example, say that more soybean farmers enter
the market, clearing forests and increasing the amount of land
devoted to soybean cultivation.
• In this scenario, more soybeans will be produced even if the price
remains the same, meaning that the supply curve itself shifts to the
right (S2) in the graph below. In other words, supply will increase.
• Other factors can shift the supply curve as well, such as a change in
the price of production. If a drought causes water prices to spike, the
curve will shift to the left (S3). If the price of a substitute crop such as
corn increases, farmers will shift to growing that instead, and the
supply of soybeans will decrease (S3).
• If a new technology, such as a pest-resistant seed, increases yields,
the supply curve will shift right (S2). If the future price of soybeans is
higher than the current price, the supply will temporarily shift to the
left (S3), since producers have an incentive to wait to sell.
Supply Curve Example
• Should the price of soybeans rise, farmers will have an incentive to plant less corn and
more soybeans, and the total quantity of soybeans on the market will increase.
• The degree to which rising prices translate into rising quantity is called supply elasticity
or price elasticity of supply. If a 50% rise in soybean prices causes the number of
soybeans produced to rise by 50%, the supply elasticity of soybeans is 1.
• On the other hand, if a 50% rise in soybean prices only increases the quantity supplied
by 10%, the supply elasticity is 0.2.
• The supply curve is shallower (closer to horizontal) for products with more elastic supply
and steeper (closer to vertical) for products with less elastic supply.

supply function of indian management.pptx

  • 1.
  • 2.
    supply function • Asupply function is a mathematical representation that describes the relationship between the quantity of a good or service that producers are willing and able to sell and the price of that good or service, along with other factors that may influence supply. • It is an essential component of microeconomic theory and is often used to analyze market behavior.
  • 3.
    Basic Form ofthe Supply Function • The general form of a supply function can be represented as: • Q s = f(P,C,T,N,S,E) • Where: = Quantity supplied š‘„š‘  • P =Price of the good or service • C = Cost of production (including factors like wages, materials, and overhead) • T = Technology used in production • N = Number of suppliers in the market • S = Expectations about future prices • E = Other external factors (such as government regulations, taxes, or subsidies)
  • 4.
    Simplified Linear SupplyFunction • A common simplified representation of a supply function is a linear equation: • Q s =a+bP • Q s = Quantity supplied • P = Price of the good or service • a = Intercept (quantity supplied when the price is zero) • b = Slope of the function (shows how much quantity supplied changes with a change in price)
  • 5.
    Example of aSupply Function • Suppose the supply function for a specific product is given by: = 20 š‘„š‘  + 3 š‘ƒ • ​=20+3P • In this case: When the price ( ) is $0, the quantity supplied ( ​) is š‘ƒ š‘„š‘  20 units. • For every $1 increase in price, the quantity supplied increases by 3 units.
  • 6.
    Conclusion • The supplyfunction is crucial for understanding how different factors influence the quantity of goods that producers are willing to offer for sale at various prices. It plays a significant role in market analysis, helping to determine equilibrium price and quantity in conjunction with the demand function.
  • 7.
    Characteristics of theSupply Function • Positive Relationship: Typically, the supply function has a positive slope, indicating that as the price increases, the quantity supplied also increases. This reflects the law of supply. • Shift Factors: The supply function can shift due to changes in non-price factors: • Increase in Costs: If production costs rise (e.g., due to higher wages), the supply function shifts to the left, indicating a decrease in supply at all price levels. • Technological Advances: Improvements in technology can lower production costs and increase supply, shifting the supply function to the right. • Number of Suppliers: An increase in the number of suppliers in the market can lead to an increase in overall supply, shifting the supply function to the right.
  • 8.
    Question 1: • Acompany's supply function for a product is given by the equation Q s ​=10+2P • Where Q s​ is the quantity supplied and š‘„š‘  š‘ƒ • P is the price of the product. • Calculate the quantity supplied when the price is $15. • What would be the quantity supplied if the price increases to $25?
  • 9.
    • Step 1:Calculate the Quantity Supplied at a Price of $15 • Substitute = 15 P=15 into the supply function: š‘ƒ • š‘„š‘ = 10 + 2 ( 15 ) = 40 • So, when the price is $15, the quantity supplied is 40 units. Step 2: Calculate the Quantity Supplied at a Price of $25 Substitute P=25 into the supply function: š‘„š‘ =10+2(25) = 60
  • 10.
    • So, whenthe price increases to $25, the quantity supplied is 60 units. • Summary • Quantity supplied at $15: 40 units • Quantity supplied at $25: 60 units
  • 11.
    Question 2: • Thesupply function for a specific good is represented by the equation: Q s =5Pāˆ’10 • Where is the quantity supplied and is the price. š‘„š‘  š‘ƒ • Determine the quantity supplied when the price is $10. • If the price decreases to $5, what is the new quantity supplied?
  • 12.
    Question 3: • Afarmer's supply function for apples is described by the equation: • Q s =4+3P • Calculate the quantity of apples supplied when the price per pound is $8. • If the price rises to $12, how many pounds of apples will the farmer supply?
  • 13.
    Question 4: • Considera market where the supply function is defined as: =25+5 š‘„š‘  š‘ƒ • Find the quantity supplied when the market price is $20. • If the market price rises to $30, what will be the new quantity supplied?
  • 14.
    Supply Curve? • Thesupply curve illustrates the correlation between the cost of a product or service and the quantity of it that is available. The supply curve is shown in a graph with the price on the left vertical axis and the quantity supplied on the horizontal axis. • The supply curve can be seen as a visual demonstration of how the law of supply and demand works. Prices increase when supply is low.
  • 15.
    Key Takeaways • Asupply curve can often show if a commodity will experience a price increase or decrease based on demand, and vice versa. • The supply curve is shallower (closer to horizontal) for products with more elastic supply and steeper (closer to vertical) for products with less elastic supply. • The supply curve, along with the demand curve, are the key components of the law of supply and demand.
  • 17.
    How a SupplyCurve Works • The supply curve will move upward from left to right, illustrating the law of supply: As the price of a given commodity increases, the quantity supplied will increase (all else being equal). • Note that this formulation implies that price is the independent variable, and quantity is the dependent variable. In most disciplines, the independent variable appears on the horizontal or x-axis, but economics is an exception to this rule.
  • 19.
    • If afactor besides price or quantity changes, a new supply curve needs to be drawn. For example, say that more soybean farmers enter the market, clearing forests and increasing the amount of land devoted to soybean cultivation. • In this scenario, more soybeans will be produced even if the price remains the same, meaning that the supply curve itself shifts to the right (S2) in the graph below. In other words, supply will increase.
  • 20.
    • Other factorscan shift the supply curve as well, such as a change in the price of production. If a drought causes water prices to spike, the curve will shift to the left (S3). If the price of a substitute crop such as corn increases, farmers will shift to growing that instead, and the supply of soybeans will decrease (S3). • If a new technology, such as a pest-resistant seed, increases yields, the supply curve will shift right (S2). If the future price of soybeans is higher than the current price, the supply will temporarily shift to the left (S3), since producers have an incentive to wait to sell.
  • 22.
    Supply Curve Example •Should the price of soybeans rise, farmers will have an incentive to plant less corn and more soybeans, and the total quantity of soybeans on the market will increase. • The degree to which rising prices translate into rising quantity is called supply elasticity or price elasticity of supply. If a 50% rise in soybean prices causes the number of soybeans produced to rise by 50%, the supply elasticity of soybeans is 1. • On the other hand, if a 50% rise in soybean prices only increases the quantity supplied by 10%, the supply elasticity is 0.2. • The supply curve is shallower (closer to horizontal) for products with more elastic supply and steeper (closer to vertical) for products with less elastic supply.