
Recommended
More Related Content
Similar to Demand and all it's indepth knowledge about itself
Similar to Demand and all it's indepth knowledge about itself (20)
More from kumarsinghrahul232
More from kumarsinghrahul232 (12)
Recently uploaded
Recently uploaded (20)
Demand and all it's indepth knowledge about itself
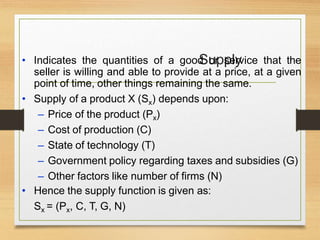
- 1. Supply • Indicates the quantities of a good or service that the seller is willing and able to provide at a price, at a given point of time, other things remaining the same. • Supply of a product X (Sx) depends upon: – Price of the product (Px) – Cost of production (C) – State of technology (T) – Government policy regarding taxes and subsidies (G) – Other factors like number of firms (N) • Hence the supply function is given as: Sx = (Px, C, T, G, N)
- 2. Law of Supply Law of Supply states that other things remaining the same, the higher the price of a commodity the greater is the quantity supplied. Price of the product is revenue to the supplier; therefore higher price means greater revenue to the supplier and hence greater is the incentive to supply. Supply bears a positive relation to the price of the commodity. Point on Supply Curve Price (Rs. Per cup) Supply (‘000 cups per month) a 15 10 b 20 20 c 25 30 d 30 45 e 35 60 Supply Schedule c e d Supply Curve 10 20 30 40 50 60 20 15 35 30 25 Quantity of Coffee 0 b a
- 3. Change in Supply Shift in the supply curve from • S0 to S1 More is supplied at each • price (Q1>Q0) Increase in supply caused by: S2 S1 S0 Price Quantity O Improvements in the technology Fall in the price of inputs Shift in the supply curve from S0 to S2 Less is supplied at each price (Q2<Q0) Decrease in supply caused by: A rise in the price of inputs Change in government policy (VAT) Q2 P Q0 Q1
- 4. Market Equilibrium D Equilibrium occurs at the price where the quantity demanded and the quantity supplied are equal to each other. At point E demand is equal to supply hence 25 is equilibrium price Price S Quantity O 25 E 30 Price (Rs) Supply (‘000 cups/ month) Demand (‘000 cups/ month) 15 10 50 20 15 40 25 30 30 30 45 15 35 70 10
- 5. Let’s Analyze Imagine that there is a drought in the nation. Discuss the possible implications of drought on the demand and supply of food grains in the nation.
- 6. Let’s Analyze Suggest the impact of a liberal monetary policy on supply of the goods in an economy.
- 7. Market Equilibrium Quantity O 30 Price (Rs) Supply (‘000 cups/ month) Demand (‘000 cups/ month) 15 10 50 20 15 40 25 30 30 30 45 15 35 70 10 For prices below the equilibrium, Quantity demanded exceeds quantity supplied (D>S) – Price pulled upward For prices above the equilibrium, Quantity demanded is less than quantity supplied (D<S) – Price pulled downward. At point E demand is equal to supply hence 25 is equilibrium price. Price S 30 E 25 20 D
- 8. Changes in Market Equilibrium (Shifts in Supply Curve) E2 S2 S2 E D1 D1 S1 S1 Price Quantity O E0 P0 P P2 Q0 Q Q2 S0 S0
- 9. Q1 E1 D2 Q* E2 Changes in Market Equilibrium (Shifts in Demand Curve) D0 D1 D0 D1 S1 S1 Price D2 Quantity O E P1 P P* Q
- 10. Change in Both Demand and Supply P2 Q2 E2 S2 D1 D1 Quantity Price O S1 S2 S1 D2 D2 Q1 P1 E1 D2 D2 E0
- 11. Elasticity of Demand • Mathematically, it is the percentage change in quantity demanded of a commodity to a percentage change in any of the (independent) variables that determine demand for the commodity. • Four major types of elasticity: – Price elasticity, – Income elasticity, – Cross elasticity – Advertising (or promotional) elasticity.
- 12. Price Elasticity of Demand •Price elasticity of demand means the sensitivity of quantity demanded of a commodity to a given change in its own price.
- 13. Slope of demand curve is used to display price elasticity of demand Perfectly elastic demand • ep=∞ (in absolute terms). • Horizontal demand curve • Unlimited quantities of the commodity can be sold at the prevailing price • A negligible increase in price would result in zero quantity demanded • Perfectly inelastic demand • The other extreme of the elasticity range • ep=0 (in absolute terms) • Vertical demand curve • Quantity demanded of a commodity remains the same, irrespective of any change in the price • Such goods are termed neutral. Degrees of Price Elasticity Price Quantity O P D Q1 Q2 Price Quantity O P1 P2 D Q1
- 14. Degrees of Price Elasticity Highly elastic demand • Proportionate change in quantity demanded is more than a given change in price • ep >1 (in absolute terms) • Demand curve is flatter Unitary elastic demand • Proportionate change in price brings about an equal proportionate change in quantity demanded p • e =1 (in absolute terms). • Demand curves are shaped like a rectangular hyperbola, asymptotic to the axes Relatively inelastic demand • Proportionate change in quantity demanded is less than a proportionate change in price p • e <1 (in absolute terms) • Demand curve is steep Price O D D Q2 Quantity Q1 P1 P2 Quantity Price D O D P1 Q1 Q2 P2 Price Quantity O P1 P2 Q1 Q2 D D Contd.
- 15. • Nature of commodity • Availability and proximity of substitutes • Alternative uses of the commodity • Proportion of income spent on the commodity • Time • Durability of the commodity • Items of addiction Determinants of Price Elasticity of Demand
- 16. Income Elasticity of Demand (ey) • ey measures the degree of responsiveness of demand for a good to a given change in income, ceteris paribus. • Degrees: – Positive income elasticity • Demand rises as income rises and vice versa • Normal good – Negative income elasticity • Demand falls as income rises and vice versa • Inferior good Proportionate change in income of consumer = Proportionate change in quantity demanded of commodity X ey
- 17. Cross Elasticity of Demand • ec measures the responsiveness of demand of one good to changes in the price of a related good • Degrees – Negative Cross Elasticity • Complementary goods – Positive Cross Elasticity • Substitute goods Proportionate change in price of commodity Y = Proportionate change in quantity demanded of commodity X ec
- 18. • Degrees – Zero Cross Elasticity
- 19. Promotional Elasticity of Demand • Advertising (or promotional) elasticity of demand (ea) measures the effect of incurring an “expenditure” on advertising, vis-à-vis an increase in demand, ceteris paribus. • Some goods (like consumer goods) are more responsive to advertising than others (like heavy capital equipments). • Degrees – ea>1 • Firm should go for heavy expenditure on advertisement. – ea <1 • Firm should not spend too much on advertisement Proportionate change in advertising expenditure = Proportionate changein quantity demanded (or sales) of commodity X ea
- 20. Importance of Elasticity • Determination of price • Basis of price discrimination • Determination of rewards of factors of production • Government policies of taxation
- 21. Thank You