Downloaded 88 times
![19Marek.Piatkowski@Rogers.com
Supply Chain
Management Strategy
Thinkingwin, Win, WIN
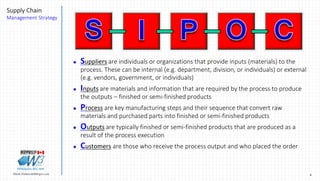
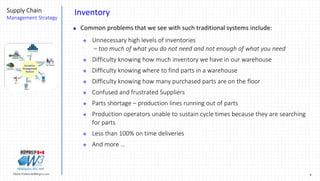
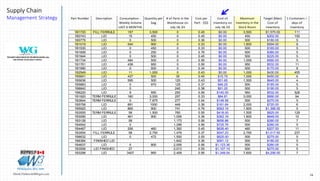
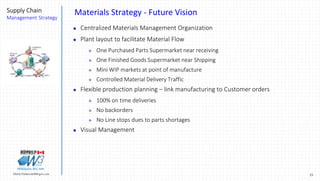
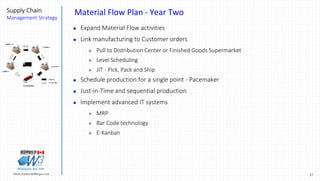
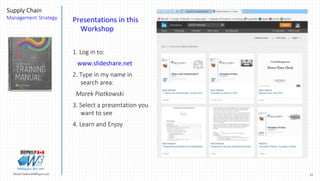
Komora "411" / Cavity "411"
0
200
400
600
800
1000
1200
1400
1 3 5 7 9 11 13 15 17 19 21 23 25 27 29 31 33 35 37 39
Zapas[szt]/Stock[pcs]
Supermarket Inventory Reduction](https://image.slidesharecdn.com/1-161120160517/85/Supply-chain-management-strategy-November-2016-19-320.jpg)
![20Marek.Piatkowski@Rogers.com
Supply Chain
Management Strategy
Thinkingwin, Win, WIN
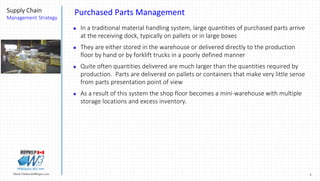
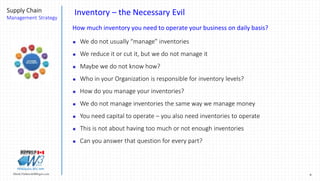
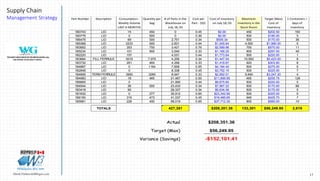
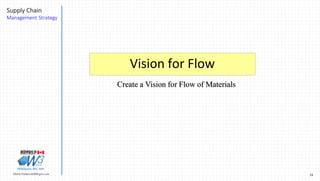
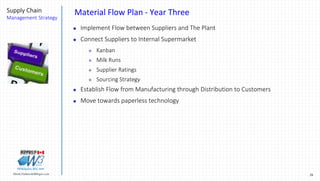
Komora "321" / Cavity "321"
0
200
400
600
800
1000
1200
1 3 5 7 9 11 13 15 17 19 21 23 25 27 29 31 33 35 37 39
Zapas[szt]/Stock[pcs]
Supermarket Inventory Reduction](https://image.slidesharecdn.com/1-161120160517/85/Supply-chain-management-strategy-November-2016-20-320.jpg)
![21Marek.Piatkowski@Rogers.com
Supply Chain
Management Strategy
Thinkingwin, Win, WIN
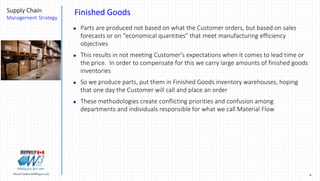
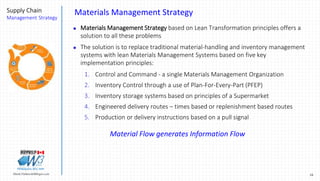
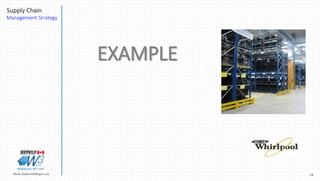
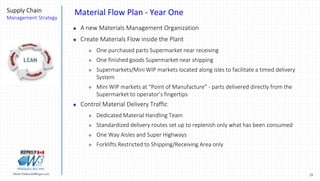
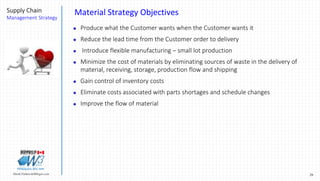
Wszystkie komory / All cavities
0
1000
2000
3000
4000
5000
1 3 5 7 9 11 13 15 17 19 21 23 25 27 29
Zapas[szt]/Stock[pcs]
Charts of inventory in supermarket
> 50% Reduction
of Inventory](https://image.slidesharecdn.com/1-161120160517/85/Supply-chain-management-strategy-November-2016-21-320.jpg)

The document is a presentation by Marek Piatkowski on supply chain management strategy and materials management strategy based on lean transformation principles. It discusses traditional issues with materials handling, purchasing, inventory management and production practices. It proposes implementing a materials management strategy and organization based on 5 key principles: control and command, inventory control using plan for every part, supermarket-style inventory storage, engineered delivery routes, and production/delivery based on a pull signal. The objectives are to produce what customers want when they want it with minimal waste and inventory costs.


