Download as PDF, PPTX


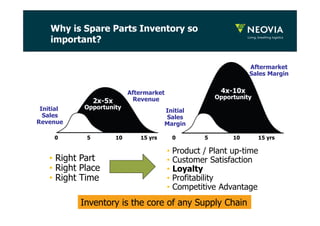
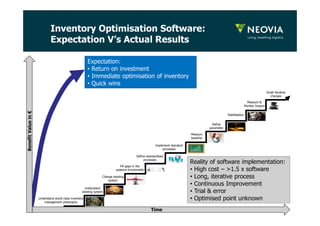
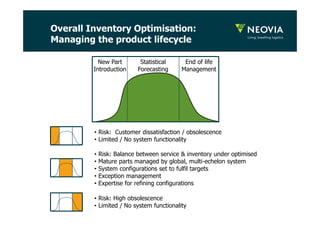
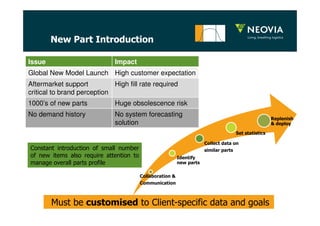

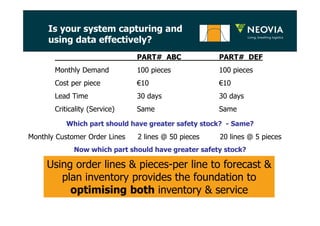
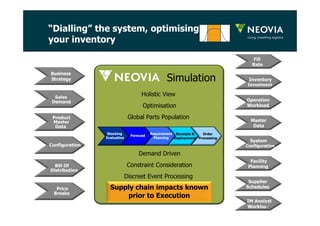
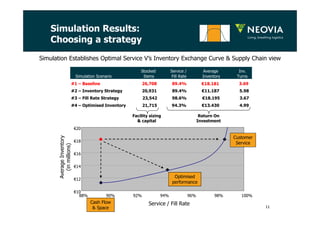


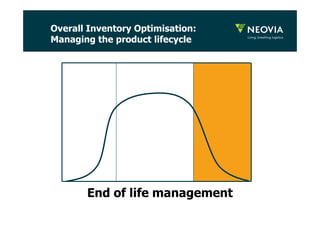
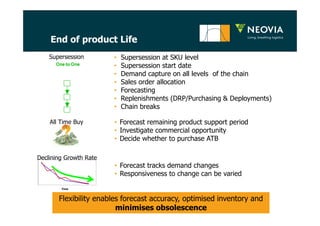
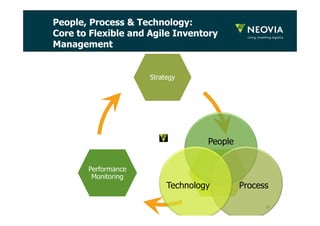


The document discusses the importance of an agile and optimized inventory management strategy for businesses, emphasizing how effective inventory control can lead to increased customer satisfaction, loyalty, and profitability. It addresses the challenges of implementing inventory optimization software, including costs and the need for continuous improvement, while highlighting the significance of managing the product lifecycle and utilizing data for forecasting. The document concludes with a focus on the role of people, processes, and technology in achieving a successful inventory management strategy.


