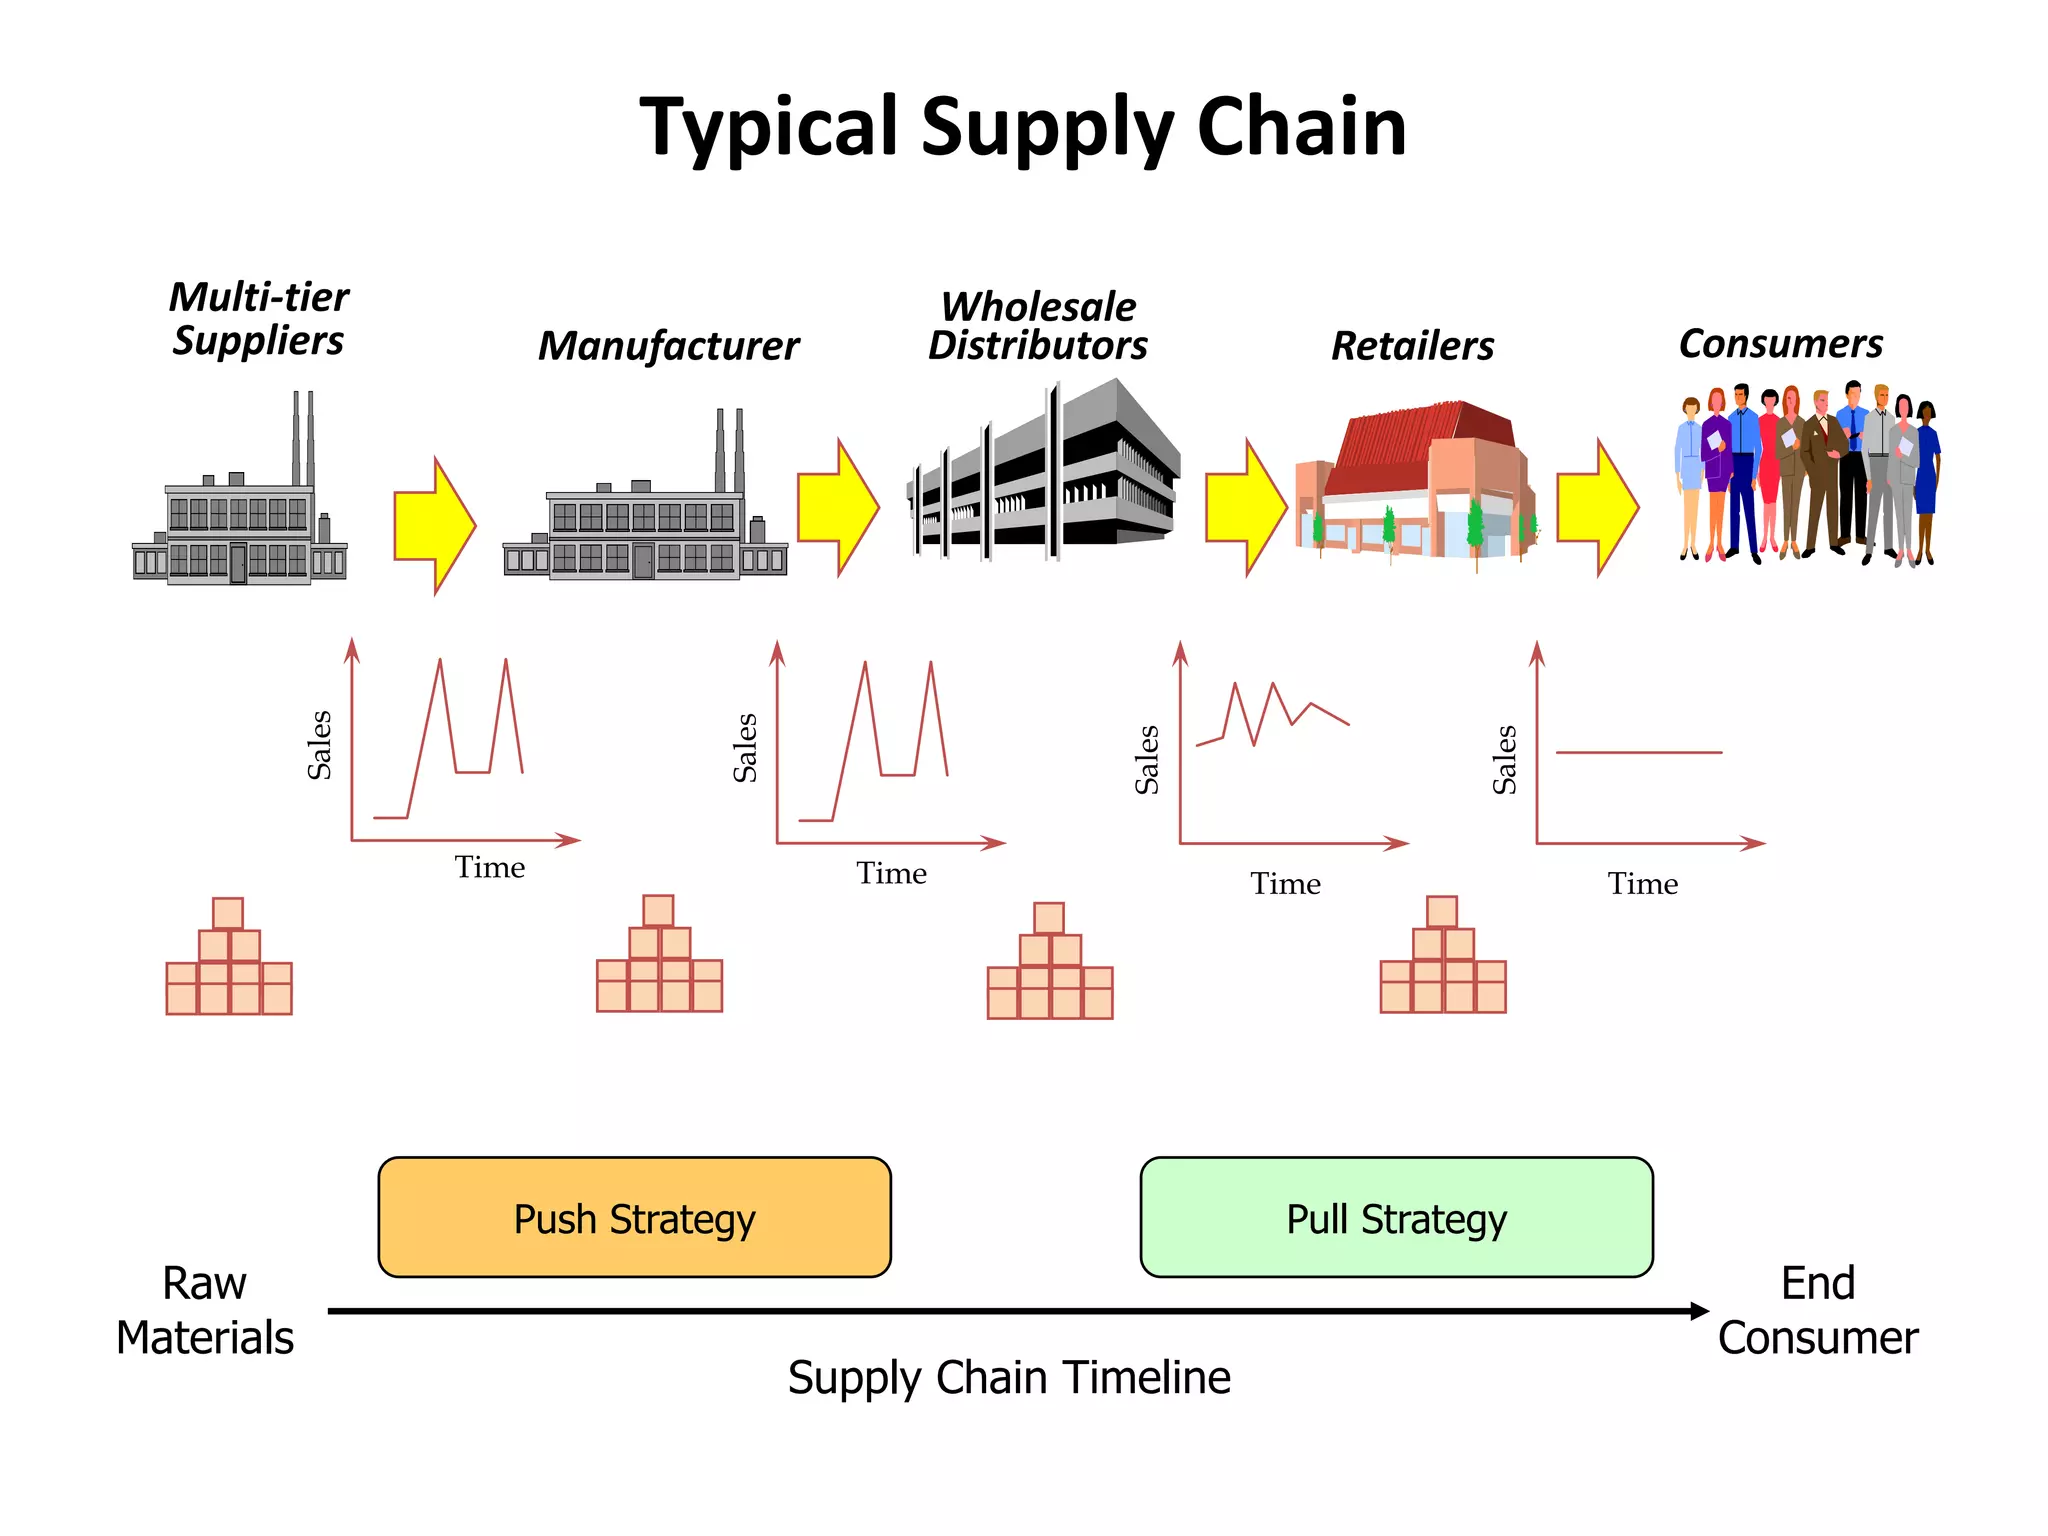
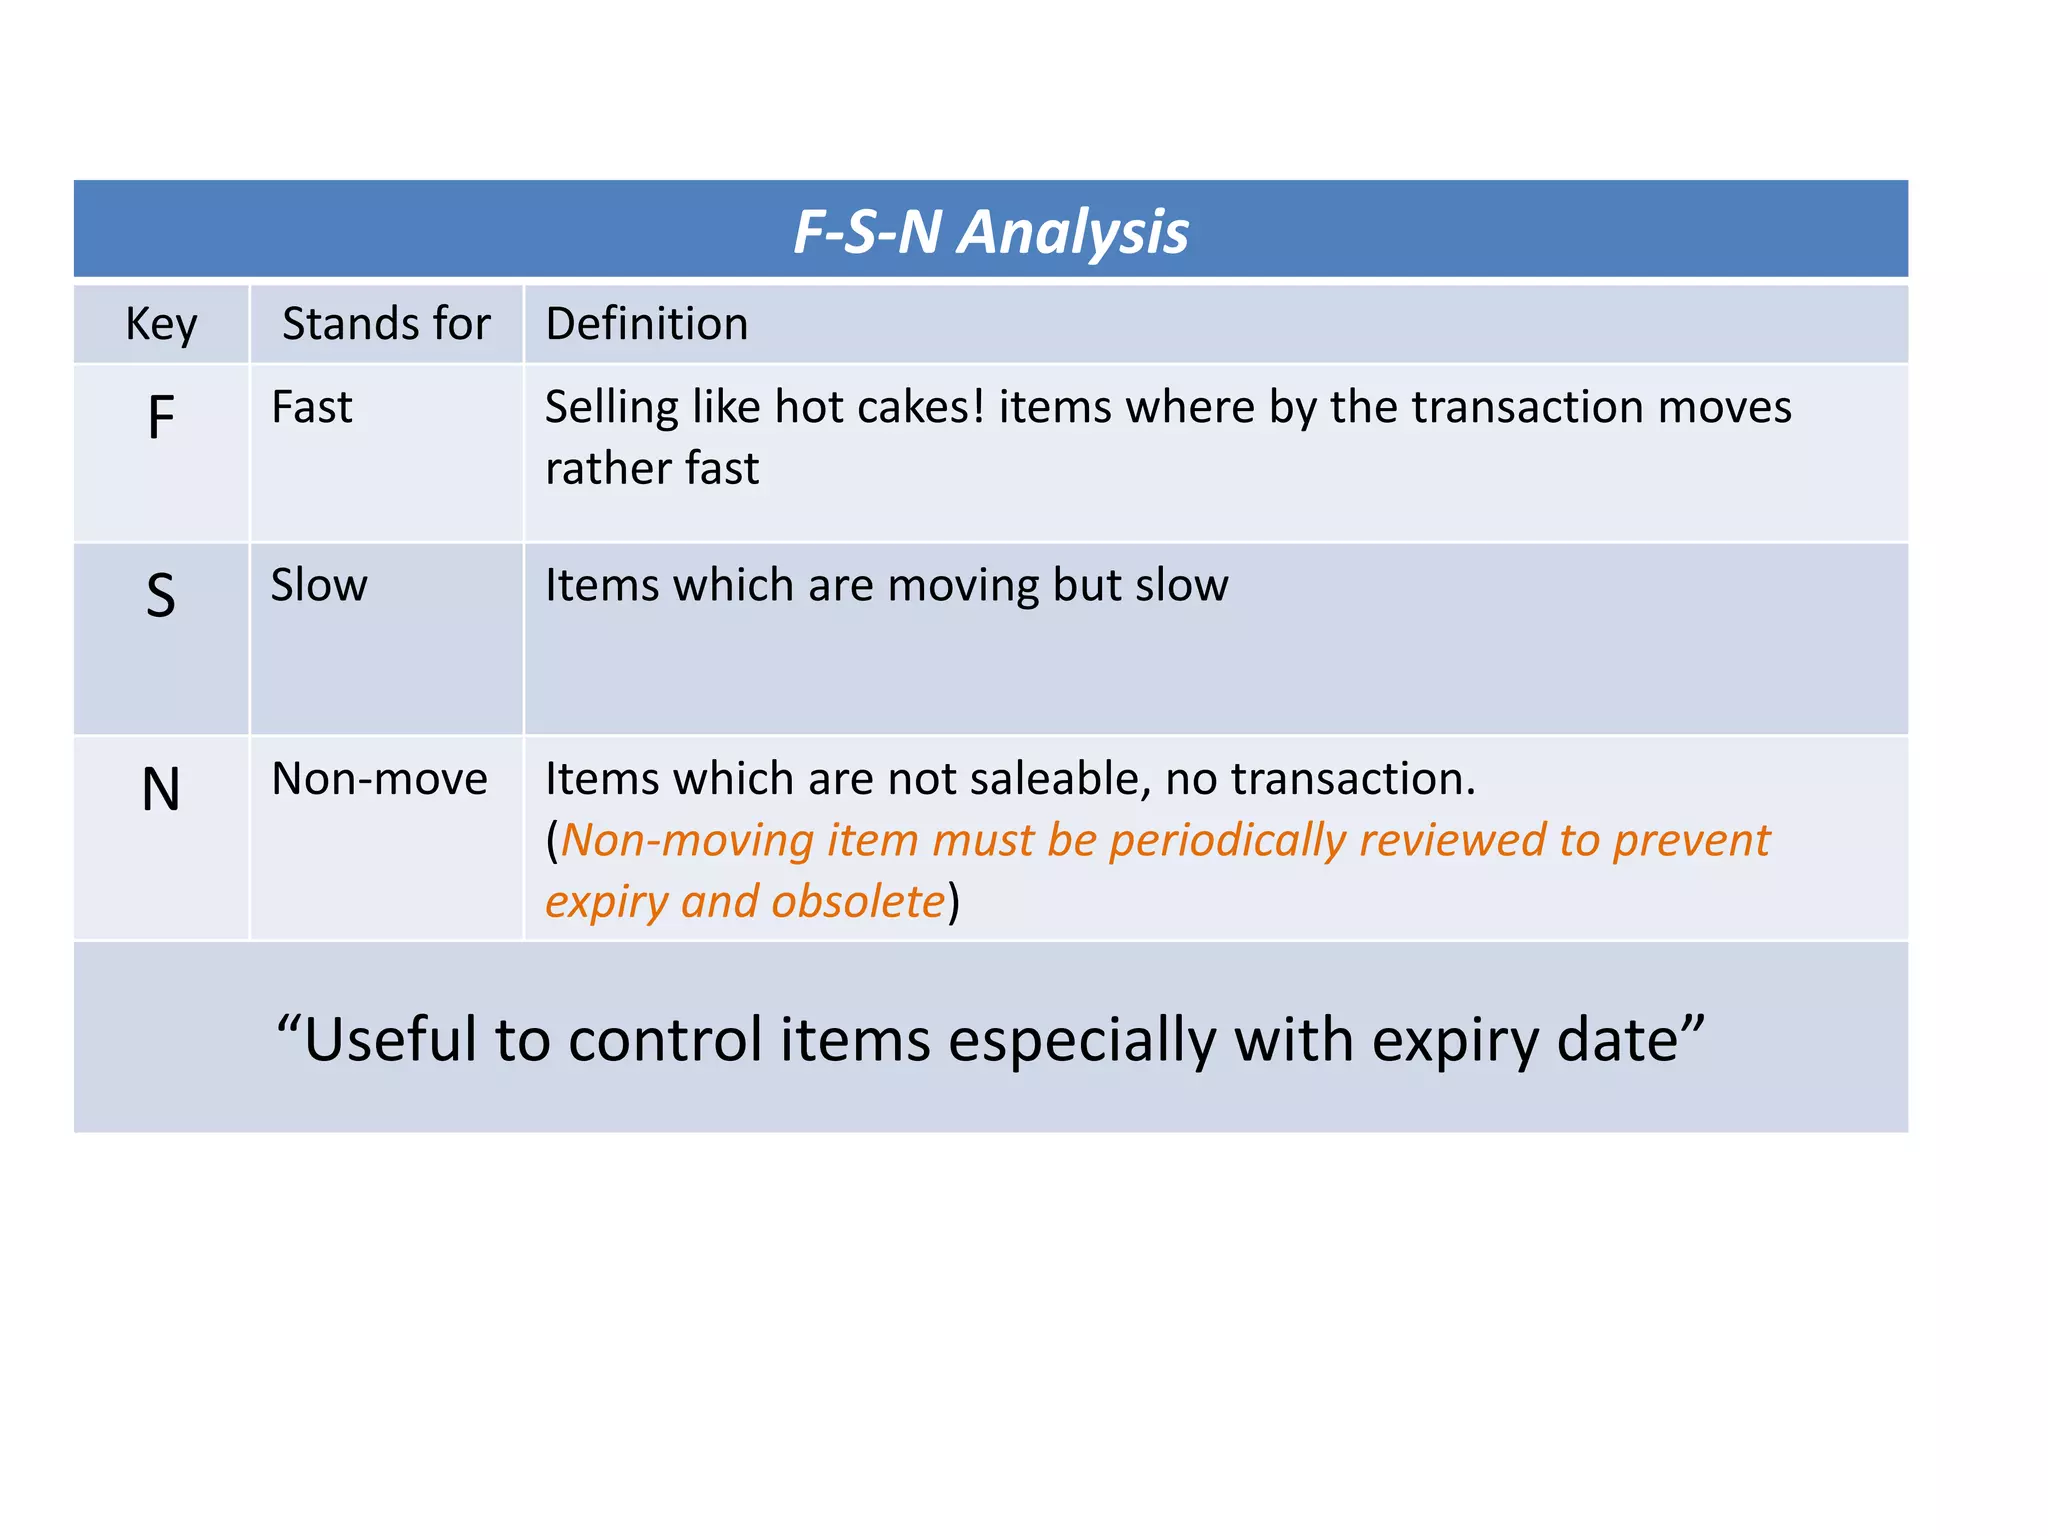
Basic Introduction
Supply Chain Management
Manufacturer
Wholesale
Distributors Consumers
Multi-tier
Suppliers Retailers
Time
Sales
Sales
Time
Sales
Time
Sales
Time
Supply Chain Timeline
Raw
Materials
End
Consumer
Push Strategy Pull Strategy
Typical Supply Chain
Actual demand from a customer is 8 units
The retailer may then order 10 units from
the distributor; an extra 2 units are to
ensure they don’t run out of floor stock.
Supplier then orders 20 units from the
manufacturer; allowing them to buy in
bulk so they have enough stock to
guarantee timely shipment of goods to the
retailer.
The manufacturer then receives the order and then orders from their supplier in bulk;
ordering 40 units to ensure economy of scale in production to meet demand.
Now 40 units have been produced for a demand of only 8 units; meaning the retailer will
have to increase demand by dropping prices or finding more customers by marketing and
advertising.
Purchasing vs. Procurement
Purchasing Procurement
Process of ordering and receiving goods
and services.
Refers to the process involved > Ordering
goods > Request approval > Issue purchase
order (PO) > Receiving of goods.
More strategic and focuses on the ('why'
and 'how').
Identify the needs and tries to align with
the organisational strategy rather than just
process orders and 'buy things'.
Simply, Purchasing is an “Act” Of Buying
an item at a price.
Remember 5-Rs !!
To procure….
1) The RIGHT material
2) With the RIGHT quality with along
with the RIGHT quantity
3) At the RIGHT time
4) For the RIGHT price
5) From the RIGHT source.
Supply Chain Management
Logistic Management
Stock Ctrl
Purchasing
Transport
Warehouse Invoicing
Customer
Prod Dev
SourcingDemand
Supply
Order
Fulfilment
Supplier
Suppliers sourcing
Criteria that influences supplier’s selection
Price Location /
Delivery period
Lead time
Capacity Warranty Payment Term
Client based
(Reputation)
Service
(Aft sales)
Response Time
Technology Area of expertise MOQ
Item Spec compliance Quality Cert. Green initiative
Delivery term
(door to door, FOB, CIF)
Technical Support /
Technical capabilities
Recover plan
(Backup)
Vision & Mission Core Business Management Team
HR
(Absenteeism)
Purchasing Policy
(ethics, transparency, gifts, open
tender, vendor rating, etc. )
Logistic Mgmt
(warehouse facilities)
Selection of supplier
Why negotiation fail?
- Not prepared
- Lack of confident
- No target
- Lack of knowledge – Product Knowledge
– Market Knowledge
– Process Knowledge
Pre-Nego Preparation
Knowledge
Company background Product Process
Past
Can substitute?
(replaceable)
How this item being
made?
Present
Future
Bargaining Analysis
Influencing Factors
L-M-H
Position
What if
L ?
What if
M ?
What if
H ?
Action Action Action
Quantity, MOQ
Low
e.g. Blanket order
e.g. Combine order
Single Source
Low
e.g. Look for alternative
e.g. Good pay master
Market Demand
High
e.g. Substitution
e.g. Future buying
Sourcing
Substitute
Planning
Relationship
Lead Time
Supplier Profile to keep (for reference):
(2) Liaison personnel
Influencing Power
Price Delivery
General Mgr
Finance Mgr
Production Mgr
Sales Mgr
(1) Supplier Capacity
(3) Costing
Analysis Qty (BOM)
Source
(e.g. country /
brandname)
Wastage
Raw mat
item
ABC Analysis (Pareto Analysis/ 80.20 Rules)
Or literally means “Always Better Control”
Cat. Highest
consumption
value
Total Inventory
Item
Frequency of
Control
Cycle Count
A 70% - 80% 10% - 20% Frequent review Every Quarterly
B 15% - 25% 30% Regular review Every Half Yearly
C 5% 50% Intermittent review Annually
A
B
C
High
Low
Few ManyNos. of items
$ Value of
items
Input Results
Item Sold Qty Unit Price Sold Amount
% of Shares
Sold
Portion Cumulative % Classification
A 5000 30.00 150,000.00 48.91% 78.25% 48.91% A
B 200 450.00 90,000.00 29.34% 78.25% A
C 2000 10.00 20,000.00 6.52% 15.00% 84.77% B
D 800 20.00 16,000.00 5.22% 89.99% B
E 1000 10.00 10,000.00 3.26% 93.25% B
F 1200 5.00 6,000.00 1.96% 6.75% 95.21% C
G 1300 4.00 5,200.00 1.70% 96.90% C
H 2500 2.00 5,000.00 1.63% 98.53% C
I 3500 1.00 3,500.00 1.14% 99.67% C
J 500 2.00 1,000.00 0.33% 100.00% C
Total 306,700.00 100.00%
Example:
Other Purchasing methods:
S-D-E Analysis
Key Stands for Definition
S Scarce These materials are always in shortage and difficult in
procurement. These materials sometimes require government
approvals, procurement through government agencies.
Normally one has to make the payment in advance for sourcing
these materials.
D Difficult These materials though not easy to procure but are available at
a longer lead times and source of supply may be very far from
the consumption. Procurement of these materials requires
planning and scheduling in advance.
E Easy These materials are normally standard items and easily available
in the market and can be purchased anytime.
F-S-N Analysis
Key Stands for Definition
F Fast Selling like hot cakes! items where by the transaction moves
rather fast
S Slow Items which are moving but slow
N Non-move Items which are not saleable, no transaction.
(Non-moving item must be periodically reviewed to prevent
expiry and obsolete)
“Useful to control items especially with expiry date”
F-S-N Analysis
Case Example: Item Code - A1
A B C D E F
Date
Receipt
Qty
Return
Qty
Adjustment
Qty
Issue
Qty
Closing
Bal
Inventory
Holding Days
Opening Bal 50
01/01/2016 10 0 0 0 60 60
02/01/2016 15 7 0 15 67 127
03/01/2016 0 0 0 0 67 194
04/01/2016 0 0 0 0 67 261
05/01/2016 0 0 5 0 72 333
06/01/2016 20 0 0 0 92 425
07/01/2016 0 0 0 12 80 505
08/01/2016 0 4 0 0 84 589
09/01/2016 0 0 0 0 84 673
10/01/2016 10 0 0 7 87 760
11/01/2016 0 0 0 0 87 847
12/01/2016 0 0 0 12 75 922
13/01/2016 0 0 0 0 75 997
14/01/2016 10 0 -3 0 82 1079
15/01/2016 0 0 0 0 82 1161
65 11 2 46 - -
E = (last closing bal;E+A+B)-(C+D)
Average Stay of Item = Cumulative nos. of Inventory Holding Days
(Total Qty Received + Opening Balance)
= 1161 / (65+50)
= 1161 / 115
= 10.09 days
Consumption Rate = Total Issue Quantity
Total Period Duration
= 46 / 15
= 3.06 pcs per day
A9
A10
Average Stay
10.09
7.5
8.23
4.2
Item Code
A1
A2
A3
A4
A5
Consumption Rate
3.06
5.2
4.71
2
5.16
12
8
9.11
11.2
7.21
A6
A7
A8
5.76
3.98
4.48
5.23
4
Average
Stay
Cum. Average
Stay
% Average Stay
FSN
Classification
12 12 14.36% S
11.2 23.2 27.77% S
10.09 33.29 39.85% S
9.11 42.4 50.75% S
8.23 50.63 60.61% S
8 58.63 70.18% S
7.5 66.13 79.16% N
7.21 73.34 87.79% N
6 79.34 94.97% F
4.2 83.54 100.00% F
A10
A5
A4
A7
A2
A6
A9
A1
A8
A3
Item Code
Consumption
Rate
Cum. Consump
Rate
% Consumption
Rate
FSN
Classification
5.76 5.76 13.24% F
5.23 10.99 25.25% F
5.2 16.19 37.20% F
5.1 21.29 48.92% F
4.71 26 59.74% F
4.48 30.48 70.04% F
4 34.48 79.23% N
3.98 38.46 88.37% N
3.06 41.52 95.40% S
2 43.52 100.00% S
A10
A7
A1
A4
A6
A9
A2
A5
A3
A8
Item Code
Procurement Cost
Holding Cost
Total Cost
= Purchase cost + Ordering Cost + Holding Cost
Qty
Cost
EOQ
Economic Ordering Quantity
EOQ
formula
2 (Annual usage/demand) x (Cost per order)
Annual Holding cost per unit
Combination of order costs and inventory carrying costs are the least.
The result is the most cost effective quantity to order.
Raymond would like to sell Item A:
Cost per PC = RM 2.00
Selling Price = RM 15.00
Sales projection = 144,000 pcs / year (1,200 pcs per month)
However, there is one problem, whenever Raymond order from supplier,
Supplier shall charge Raymond an ordering fee/ Set-up Cost amounting
RM 80.00 per order.
(If Raymond put an order every month from the supplier,
then RM 80.00 x 12 = RM 960.00 per year!!!)
So, Raymond had an instant solution!
“Why don’t I order 144,000pcs whole lot to avoid paying high Set-up cost!”
“But then again…..
With such huge quantity, how do I store them?, I need SPACE !!!”
And to rent a space will cost RM 2.00 per pc in the warehouse .
(Holding Cost)
Then how much (RIGHT) quantity that I should order to save my ordering
cost and the holding cost?
DISCLAIMER
However, EOQ is not applicable IF:
a) The demand fluctuates
b) There is a long Lead time after order
c) Quantity ordered too small hence not able to get bulk discount.
2 (Annual usage/demand) x (Cost per order)
Annual Holding cost per unit
2 (144,000) x (80.00)
2.00
=
23,040,000
2.00
=
= 115200000
= 3394.1
EOQ is 3,394 pcs Per Order
How to Calculate?
Lead time Demand
Safety Stock
Re-Order Point
Trader placed an order with the manufacturer from China
Trader need to have enough stock-on-hand to cover these 47 days of sales
Let's say trader sold about 800 per month, (800/31 = 26pcs per day)
Lead time Demand
= Lead Time x Average Daily Sold
= 47 x 26
= 1,222 pcs
Meaning trader will need at least 1,222pcs to tide them over until their next
shipment arrives, “if nothing unexpected happens.”
Example:
Process Time Today days
Pick & Pack 2
Arrange Truck to receiving port 5
Shipping from China to M’sia 30
Arrival & Customs processing 7
Delivery to warehouse 3
Overall days spent 47
Safety Stock
= (Max. Daily sold x Max. Lead time) - (Avrg. Daily sold x Avrg. Lead time)
= (36 x 54) - (26 x 47)
= 722pcs
Re-Order Point
= Lead time Demand + Safety Stock
= 1,222 + 722
= 1,944
So once their stock hits 1,944pcs, trader will need to place a new order with their supplier.
At 1,944pcs, they’ll have enough to last them as they wait for new stock to arrive (1,222pcs),
while holding enough stock (722pcs) as a buffer against an unexpected surge in demand or
supply chain problems.
Description Days Remark
Manufacturer’s goods to Trader 47 Avrg. lead time
Manufacturer’s goods to Trader 54 Max. lead time (Due to holidays / Unforeseen events)
Trader sells to customer 26 per day Daily Average (On Weekdays)
Trader sells to customer 36 per day Daily Average (On Weekends/ P. Holidays)
Trader sold about 202 Per week 26pcs (Mon-Fri), 36pcs (Sat-Sun)
722pcs safety stock last about = 722 / 202 3.57weeks -
Thank You!

Supply Chain Mgmt Course

  • 1.
  • 2.
    Manufacturer Wholesale Distributors Consumers Multi-tier Suppliers Retailers Time Sales Sales Time Sales Time Sales Time SupplyChain Timeline Raw Materials End Consumer Push Strategy Pull Strategy Typical Supply Chain
  • 3.
    Actual demand froma customer is 8 units The retailer may then order 10 units from the distributor; an extra 2 units are to ensure they don’t run out of floor stock. Supplier then orders 20 units from the manufacturer; allowing them to buy in bulk so they have enough stock to guarantee timely shipment of goods to the retailer. The manufacturer then receives the order and then orders from their supplier in bulk; ordering 40 units to ensure economy of scale in production to meet demand. Now 40 units have been produced for a demand of only 8 units; meaning the retailer will have to increase demand by dropping prices or finding more customers by marketing and advertising.
  • 4.
    Purchasing vs. Procurement PurchasingProcurement Process of ordering and receiving goods and services. Refers to the process involved > Ordering goods > Request approval > Issue purchase order (PO) > Receiving of goods. More strategic and focuses on the ('why' and 'how'). Identify the needs and tries to align with the organisational strategy rather than just process orders and 'buy things'. Simply, Purchasing is an “Act” Of Buying an item at a price. Remember 5-Rs !! To procure…. 1) The RIGHT material 2) With the RIGHT quality with along with the RIGHT quantity 3) At the RIGHT time 4) For the RIGHT price 5) From the RIGHT source.
  • 5.
    Supply Chain Management LogisticManagement Stock Ctrl Purchasing Transport Warehouse Invoicing Customer Prod Dev SourcingDemand Supply Order Fulfilment Supplier
  • 6.
    Suppliers sourcing Criteria thatinfluences supplier’s selection Price Location / Delivery period Lead time Capacity Warranty Payment Term Client based (Reputation) Service (Aft sales) Response Time Technology Area of expertise MOQ Item Spec compliance Quality Cert. Green initiative Delivery term (door to door, FOB, CIF) Technical Support / Technical capabilities Recover plan (Backup) Vision & Mission Core Business Management Team HR (Absenteeism) Purchasing Policy (ethics, transparency, gifts, open tender, vendor rating, etc. ) Logistic Mgmt (warehouse facilities)
  • 7.
    Selection of supplier Whynegotiation fail? - Not prepared - Lack of confident - No target - Lack of knowledge – Product Knowledge – Market Knowledge – Process Knowledge Pre-Nego Preparation Knowledge Company background Product Process Past Can substitute? (replaceable) How this item being made? Present Future
  • 8.
    Bargaining Analysis Influencing Factors L-M-H Position Whatif L ? What if M ? What if H ? Action Action Action Quantity, MOQ Low e.g. Blanket order e.g. Combine order Single Source Low e.g. Look for alternative e.g. Good pay master Market Demand High e.g. Substitution e.g. Future buying Sourcing Substitute Planning Relationship Lead Time
  • 9.
    Supplier Profile tokeep (for reference): (2) Liaison personnel Influencing Power Price Delivery General Mgr Finance Mgr Production Mgr Sales Mgr (1) Supplier Capacity (3) Costing Analysis Qty (BOM) Source (e.g. country / brandname) Wastage Raw mat item
  • 10.
    ABC Analysis (ParetoAnalysis/ 80.20 Rules) Or literally means “Always Better Control” Cat. Highest consumption value Total Inventory Item Frequency of Control Cycle Count A 70% - 80% 10% - 20% Frequent review Every Quarterly B 15% - 25% 30% Regular review Every Half Yearly C 5% 50% Intermittent review Annually A B C High Low Few ManyNos. of items $ Value of items
  • 11.
    Input Results Item SoldQty Unit Price Sold Amount % of Shares Sold Portion Cumulative % Classification A 5000 30.00 150,000.00 48.91% 78.25% 48.91% A B 200 450.00 90,000.00 29.34% 78.25% A C 2000 10.00 20,000.00 6.52% 15.00% 84.77% B D 800 20.00 16,000.00 5.22% 89.99% B E 1000 10.00 10,000.00 3.26% 93.25% B F 1200 5.00 6,000.00 1.96% 6.75% 95.21% C G 1300 4.00 5,200.00 1.70% 96.90% C H 2500 2.00 5,000.00 1.63% 98.53% C I 3500 1.00 3,500.00 1.14% 99.67% C J 500 2.00 1,000.00 0.33% 100.00% C Total 306,700.00 100.00% Example:
  • 12.
    Other Purchasing methods: S-D-EAnalysis Key Stands for Definition S Scarce These materials are always in shortage and difficult in procurement. These materials sometimes require government approvals, procurement through government agencies. Normally one has to make the payment in advance for sourcing these materials. D Difficult These materials though not easy to procure but are available at a longer lead times and source of supply may be very far from the consumption. Procurement of these materials requires planning and scheduling in advance. E Easy These materials are normally standard items and easily available in the market and can be purchased anytime.
  • 13.
    F-S-N Analysis Key Standsfor Definition F Fast Selling like hot cakes! items where by the transaction moves rather fast S Slow Items which are moving but slow N Non-move Items which are not saleable, no transaction. (Non-moving item must be periodically reviewed to prevent expiry and obsolete) “Useful to control items especially with expiry date”
  • 14.
    F-S-N Analysis Case Example:Item Code - A1 A B C D E F Date Receipt Qty Return Qty Adjustment Qty Issue Qty Closing Bal Inventory Holding Days Opening Bal 50 01/01/2016 10 0 0 0 60 60 02/01/2016 15 7 0 15 67 127 03/01/2016 0 0 0 0 67 194 04/01/2016 0 0 0 0 67 261 05/01/2016 0 0 5 0 72 333 06/01/2016 20 0 0 0 92 425 07/01/2016 0 0 0 12 80 505 08/01/2016 0 4 0 0 84 589 09/01/2016 0 0 0 0 84 673 10/01/2016 10 0 0 7 87 760 11/01/2016 0 0 0 0 87 847 12/01/2016 0 0 0 12 75 922 13/01/2016 0 0 0 0 75 997 14/01/2016 10 0 -3 0 82 1079 15/01/2016 0 0 0 0 82 1161 65 11 2 46 - - E = (last closing bal;E+A+B)-(C+D)
  • 15.
    Average Stay ofItem = Cumulative nos. of Inventory Holding Days (Total Qty Received + Opening Balance) = 1161 / (65+50) = 1161 / 115 = 10.09 days Consumption Rate = Total Issue Quantity Total Period Duration = 46 / 15 = 3.06 pcs per day A9 A10 Average Stay 10.09 7.5 8.23 4.2 Item Code A1 A2 A3 A4 A5 Consumption Rate 3.06 5.2 4.71 2 5.16 12 8 9.11 11.2 7.21 A6 A7 A8 5.76 3.98 4.48 5.23 4
  • 16.
    Average Stay Cum. Average Stay % AverageStay FSN Classification 12 12 14.36% S 11.2 23.2 27.77% S 10.09 33.29 39.85% S 9.11 42.4 50.75% S 8.23 50.63 60.61% S 8 58.63 70.18% S 7.5 66.13 79.16% N 7.21 73.34 87.79% N 6 79.34 94.97% F 4.2 83.54 100.00% F A10 A5 A4 A7 A2 A6 A9 A1 A8 A3 Item Code Consumption Rate Cum. Consump Rate % Consumption Rate FSN Classification 5.76 5.76 13.24% F 5.23 10.99 25.25% F 5.2 16.19 37.20% F 5.1 21.29 48.92% F 4.71 26 59.74% F 4.48 30.48 70.04% F 4 34.48 79.23% N 3.98 38.46 88.37% N 3.06 41.52 95.40% S 2 43.52 100.00% S A10 A7 A1 A4 A6 A9 A2 A5 A3 A8 Item Code
  • 17.
    Procurement Cost Holding Cost TotalCost = Purchase cost + Ordering Cost + Holding Cost Qty Cost EOQ Economic Ordering Quantity EOQ formula 2 (Annual usage/demand) x (Cost per order) Annual Holding cost per unit Combination of order costs and inventory carrying costs are the least. The result is the most cost effective quantity to order.
  • 18.
    Raymond would liketo sell Item A: Cost per PC = RM 2.00 Selling Price = RM 15.00 Sales projection = 144,000 pcs / year (1,200 pcs per month) However, there is one problem, whenever Raymond order from supplier, Supplier shall charge Raymond an ordering fee/ Set-up Cost amounting RM 80.00 per order. (If Raymond put an order every month from the supplier, then RM 80.00 x 12 = RM 960.00 per year!!!) So, Raymond had an instant solution! “Why don’t I order 144,000pcs whole lot to avoid paying high Set-up cost!”
  • 19.
    “But then again….. Withsuch huge quantity, how do I store them?, I need SPACE !!!” And to rent a space will cost RM 2.00 per pc in the warehouse . (Holding Cost) Then how much (RIGHT) quantity that I should order to save my ordering cost and the holding cost?
  • 20.
    DISCLAIMER However, EOQ isnot applicable IF: a) The demand fluctuates b) There is a long Lead time after order c) Quantity ordered too small hence not able to get bulk discount. 2 (Annual usage/demand) x (Cost per order) Annual Holding cost per unit 2 (144,000) x (80.00) 2.00 = 23,040,000 2.00 = = 115200000 = 3394.1 EOQ is 3,394 pcs Per Order
  • 21.
    How to Calculate? Leadtime Demand Safety Stock Re-Order Point
  • 22.
    Trader placed anorder with the manufacturer from China Trader need to have enough stock-on-hand to cover these 47 days of sales Let's say trader sold about 800 per month, (800/31 = 26pcs per day) Lead time Demand = Lead Time x Average Daily Sold = 47 x 26 = 1,222 pcs Meaning trader will need at least 1,222pcs to tide them over until their next shipment arrives, “if nothing unexpected happens.” Example: Process Time Today days Pick & Pack 2 Arrange Truck to receiving port 5 Shipping from China to M’sia 30 Arrival & Customs processing 7 Delivery to warehouse 3 Overall days spent 47
  • 23.
    Safety Stock = (Max.Daily sold x Max. Lead time) - (Avrg. Daily sold x Avrg. Lead time) = (36 x 54) - (26 x 47) = 722pcs Re-Order Point = Lead time Demand + Safety Stock = 1,222 + 722 = 1,944 So once their stock hits 1,944pcs, trader will need to place a new order with their supplier. At 1,944pcs, they’ll have enough to last them as they wait for new stock to arrive (1,222pcs), while holding enough stock (722pcs) as a buffer against an unexpected surge in demand or supply chain problems. Description Days Remark Manufacturer’s goods to Trader 47 Avrg. lead time Manufacturer’s goods to Trader 54 Max. lead time (Due to holidays / Unforeseen events) Trader sells to customer 26 per day Daily Average (On Weekdays) Trader sells to customer 36 per day Daily Average (On Weekends/ P. Holidays) Trader sold about 202 Per week 26pcs (Mon-Fri), 36pcs (Sat-Sun) 722pcs safety stock last about = 722 / 202 3.57weeks -
  • 24.