Contract Risk Assessment by using integrated systems
•
1 like•835 views

This document discusses an integrated risk assessment system for contract risk management using integrated systems. It begins with an introduction and agenda, then discusses industry performance trends, success factors in major projects, and the traditional risk assessment approach versus a "risk driver" method. It proposes an integrated risk assessment system that links estimate, work breakdown structure, time, cost, and risk. It provides examples of project information sheets and discusses validation of scope, cost, schedule, and risk registers. The document emphasizes an integrated approach linking scope, risk, cost, and time for more effective contract risk assessment.

Recommended
More Related Content
What's hot
What's hot (19)
Similar to Contract Risk Assessment by using integrated systems
Similar to Contract Risk Assessment by using integrated systems (20)
More from Pedram Danesh-Mand
More from Pedram Danesh-Mand (13)
Contract Risk Assessment by using integrated systems
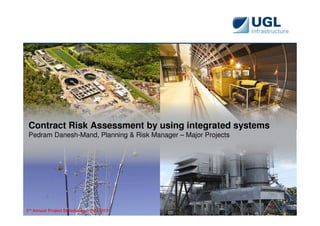
- 1. Contract Risk Assessment by using integrated systems Pedram Danesh-Mand, Planning & Risk Manager – Major Projects 3rd Annual Project Scheduling – Feb 2012 QMTRA-01 Rev 3.0
- 2. Agenda Brief Introduction Planning & Risk Manager – Major Projects, UGL Infrastructure Power Generation, Water & Wastewater, Transport and Telecommunication Industry performance worldwide Current Industry Trends Success Factors in Major Projects “Risk Driver” Method vs Traditional Approach Integrated Risk Assessment System Estimate Work Breakdown Structure (WBS) Time Cost Risk 2
- 3. Project Delivery: Myths We have a good PM system in place, don’t worry. Trust our very experienced team. Everything’s fine. No problem, everything is under control. No worries, we have been there, done that. Please, we don’t need anything new. Another new system, another tool, again! O.K. Let’s have a look in the performance of some major projects worldwide, shall we? 3
- 4. Performance of Major Projects Engineering Projects Oil and Gas Projects 42% behind schedule 81% behind schedule Ref: Managing the Risk of Delayed Completion in the 21st Century, Survey by Chartered Institute of Building (CIOB), 2007 4
- 5. Performance of Major Projects Power Generation Projects 66% behind schedule Ref: Managing the Risk of Delayed Completion in the 21st Century, Survey by Chartered Institute of Building (CIOB), 2007 5
- 6. Current Industry Trends Increasing demand for efficient and technologically complex solutions in shorter timescales and within tighter financial constraints; High demand for an accurate completion date, as required by many commercial and public benefit projects; A growing trend for employers to require the contractor to take more of the risk that is traditionally taken by the employer; A growth in the use of Design & Build (D&B), Guaranteed Maximum Price (GMP) and Engineer Procure and Construct Contracts (EPC); and Potentially devastating consequences of the failure to manage time in construction projects. O.K. To identify the success factors, we need to understand why projects fail! Ref: Managing the Risk of Delayed Completion in the 21st Century, Survey by Chartered Institute of Building (CIOB), 2007 6
- 7. Top 5 Causes of Failure REQUIREMENTS: Unclear, lack of agreement, lack of priority, contradictory, ambiguous, imprecise RESOURCES: Lack of resources, resource conflicts, turnover of key resources, poor planning SCHEDULES: Too tight, unrealistic, overly optimistic PLANNING: Based on insufficient data, missing items, insufficient details, poor estimate RISKS & OPPORTUNITIES: Unidentified or assumed, not managed Ref: Strategies for Project Recovery, A PM Solutions Research Report, pmsolutions survey, 2011 7
- 8. Successful EPC Contractor R&O Quality T&C Scope 8
- 9. Traditional Approach EPC Contract Estimate Scheduling R&O 9
- 10. Traditional Approach PROJECT INFORM ATION M onday, 16 January 2012 % of Cost % of Sell VALUE RECOVERY TENDER NO: TC-3218 Total m an Hours Man Hours PROJECT TITLE: Weddell Unit 3 Civil 3,364 CONSULTANT/CLIENT: Pow er & Water Corporation, NT Mech 11,854 POST TENDER NEGOTIATION DATE: 16-Jan-12 Elect 6,164 CONSTRUCTION PROGRAMME DURATION (Weeks) 34 8 Months M anning Average Peak CONSTRUCTION SITE DURATION (Weeks) 34 8 Months Civil 10 16 DEFECTS LIABILITY PERIOD (Weeks) 104 24 Months Mech 28 45 REVISION AND ISSUE REVA0-1 Elect 17 28 Value Recovery (1-4) TOTAL DIRECT JOB COSTS (items 1-4) TOTAL COST DJC (items 1-5) 51.17% 44.85% $6,338,802.81 (1) PROJECT ELEMENTS, DIRECT COSTS Total for section (1) 40.79% 35.75% $5,053,352.81 1.1 Civil Works Input f rom File 07-Jun-11 9.13% 8.00% $1,131,041.30 1.2 Mechanical Input f rom File 30-May-11 18.16% 15.92% $2,249,906.72 1.3 Electrical Input f rom File 01-Jun-11 12.79% 11.21% $1,584,404.79 1.4 Recruitment 1.4 Final Negotiation f igure generally f or w et w eather increase 0.71% 0.62% $88,000.00 1.5 File (2) ENGINEERING (Refer SHT-2) Total for section (2) 8.12% 7.12% $1,005,350.00 2.1 UGL Engineering Engineering 09-May-11 7.62% 6.68% $943,522.00 2.2 Geotechnical Report & O&M Manuals 09-May-11 0.50% 0.44% $61,828.00 (3) General Specification Requirements (Refer SHT-3) Total for section (3) 0.81% 0.71% $100,100.00 3.1 Preliminary Costs UGLi Prelims File 0.81% 0.71% $100,100.00 3.2 Preliminary Costs other File (4) COMM ISSIONING (Refer SHT-4) Total for section (4) 1.45% 1.27% $180,000.00 4.1 Commissioning costs UGLi Admin Included in Admin below 4.2 Commissioning Materials Comissioning File 1.45% 1.27% $180,000.00 4.3 Commissioning costs other File (5-9) TOTAL INDIRECT JOB COSTS (item s 5-9) TOTAL COST INDIRECTS (item s 5-9) 42.79% 37.49% $5,302,192.18 (5) ADMINISTRATION (Refer SHT-5) Total for section (6) 28.90% 25.33% $3,580,535.30 5.1 Site Admin and Site Supervision Costs Admin 10.92% 9.57% $1,352,868.94 5.2 Site Engineering and Site Support Staf f Admin 7.44% 6.52% $921,581.16 5.3 Site Commissioning labour Costs Admin 7.71% 6.76% $955,220.13 5.4 Head Off ice Support Admin 2.44% 2.14% $302,654.86 5.5 Other admin costs Recruitment Costs 0.39% 0.34% $48,210.20 (6) MOBILISATION Plant & Buildings (Refer SHT-6) Total for section (7) 12.75% 11.16% $1,579,350.00 6.1 ( 7a) MOBILISATION & DEMOBILSA TION Mob & Demob 8.04% 7.05% $996,060.00 6.2 (7bi) SITE BUILDINGS 0.69% 0.60% $85,010.00 6.3 (7bii) SITE CONNECTIONS 1.00% 0.87% $123,550.00 6.4 (7biii) PLANT AND TOOLS 2.09% 1.83% $258,880.00 6.5 (7biv) VEHICLES 0.23% 0.20% $28,900.00 6.6 (7bv) SITE RUNNING COSTS 0.44% 0.38% $54,150.00 6.6 Other - Principal's Site Of fice + Utility Pow er & Water Connections (PWC Mtg Darw in Addition) 0.26% 0.23% $32,800.00 (7) COMM UNITY & ENVIRONMENT (Refer SHT-7) Comm & Env Total for section (8) 0.09% 0.08% $11,700.00 (8) HEALTH & SAFETY EQUIPM ENT (Refer SHT-8) Health & Saf ety Total for section (9) 1.05% 0.92% $130,606.88 Hedging Not (9) HEDGING (refer to SHT-9) BG & Hedge Total for section (10) Consi dered (10-13) TOTAL ALLOWANCES (item s 10-13) TOTAL COST ALLOWANCES (item s 10-13) 4.33% 3.79% $535,918.23 (10) ESCALATION (refer to SHT-10) Escalation Total for section (11) $93,861.25 0.76% 0.66% 10.1 Escallation f or Project Management and Supervision 0.57% 0.50% $70,900.00 10.2 Escallation f or Engineering 0.19% 0.16% $22,961.25 10.3 Escallation f or Labour (Not req'd - Mid Point calc) 10.4 Escallation f or Materials (Not req'd) (11) Contingency R&O Total for section (12) 3.07% 2.69% $379,643.29 (12) Wet Weather Allow ance (Refer to SHT-12) Wet Weather Total for section (13) 0.50% 0.44% $62,413.69 12.1 CIVIL WET WEA THER ALLOWANCE 0.20% 0.18% $25,358.59 12.2 ELECTRICA L WET WEATHER ALLOWANCE 0.08% 0.07% $10,323.82 12.3 MECHANICAL WET WEATHER A LLOWANCE 0.15% 0.13% $18,006.91 12.4 SUPERV ISION WET WEA THER ALLOWANCE 0.07% 0.06% $8,724.38 12.5 OTHER WET WEATHER ALLOWANCE (13) PROVISIONAL SUM S Total for section (14) (14) MISC COSTS (LSL, BONDS, INSURANCES ETC) TOTAL COST MISC ITEM (14) 1.69% 1.49% $209,427.60 Liability Charges "U" uncapped Liability (1%), "A" Contract sum Liability (.5%) "B".5 of 14.1 contract sum liability (.25%) A 0.57% 0.50% $70,160.00 14.2 14.3 Long Service Levy (LSL) .35 % on contract value (inc GST) 0.50% 0.62% 0.55% $77,176.00 14.4 Securities Bonds Insert Final Total Selling Price $14,032,000 0.22% 0.19% $27,011.60 14.5 Warranty Provision .25 % on contract value (inc GST) 0.25% 0.28% 0.25% $35,080.00 Insurances excluding construction risk / construction w orks "A" .45% of CV, Including construction risk / 14.6 construction w orks "B" .9% of CV (Worn by Business) 14.7 Other costs TOTAL COST (items 1-14) PROJECT TOTAL COST ITEM S 1 TO 14 100% 87.62% $12,386,340.82 (15) OVER-HEADS & M argin (item 15) 12.00% TOTAL O-H and M argin ITEM (15) 12.35% $1,745,046.48 15.1 UGLi Overheads 54.17% 6.50% of Selling Mark up 7.39% 6.47% $914,900.17 $914,900.17 15.2 UGLi Profit 45.83% 5.50% of Selling Mark up 6.25% 5.48% $774,146.30 $774,146.30 15.3 Additional Recovery FX Rate 0.45% 0.40% $56,000.00 $56,000.00 15.4 Mark up 15.5 Partner 3 Profit & O/H Mark up (16) TOTAL SELLING (items 1-15) (16) TOTAL SELLING PRICE EXCLUDING GST 100% $14,131,387.30 $1,745,046.48 GST Value $1,413,138.73 PRICE APPROVED BY : DATE : 16-Jan-12 RECOVERY TO COST : 14.09% Tender No : TC-3218 Estimator :GRG / RS RECOVERY TO SELLING : 12.35% Estimate Risk (mainly $) Scheduling 10
- 11. Risk Driver Approach EPC Contract R&O Estimate Scheduling R&O T&C Impact Mitigation 11
- 12. Risk Driver Approach EPC SCOPE – WBS R & O – RBS / WBS Estimate – CBS / WBS Schedule WBS Integration of SCOPE, RISK, COST and TIME 12
- 13. Scope/Cost/Schedule/Risk Available data gathering and validation WBS Development of full Scope Risks & Opportunities Workshop/s (team approach) S/C/R Integration R&O Register incl. both Uncertainties and Events Schedule Cost Risk Model Simulation Results and Discussions Re-Modelling Monitoring & Controls 13
- 14. Scope Validation The 100% Rule (PMI Standard) Validation of the WBS includes 100% of the work defined by the project scope and captures ALL deliverables – internal, external, and interim – in terms of work to be completed, including project management. 14
- 15. Cost / Schedule Validation How to review the deterministic Schedule & Cost? Validation of Quantities (most likely) Productivity Rates (most likely) Durations (most likely) Resource Cost Rates (most likely) Constraints (Contractual or Management) Logic network and Work Statements, and Reasonable Critical Path 15
- 16. Risk Register Validation How to review the Risk Register? Validation of The identified risks & opportunities Likelihood of the identified risks and opportunities Impacted WBS element/s Schedule and/or Cost Impact/s Schedule and/or Cost Variations Correlation of risks and opportunities to one another Notes, etc. 16
- 17. Special Conditions Special conditions that require extra attention: Probabilistic Branching – which considers the situation where the outcome of an event can cause two or multiple possible courses of activities Correlation between risks Positive Correlation: occurs when one risk goes higher, so must the other. Negative or Adverse Correlation: occurs when one risk increases, the other must decrease. Inclement Weather or other external influences O.K. Let’s simulate the model, shall we? 17
- 18. Case Study Project: EPC Power Station Contract $100m Project excluding two Gas Turbines Scope: 2 GT’s and auxiliary equipment; Required Balanced of Plant (BOP); Power Station sewage system; and Roads & drainage. 18
- 19. Schedule Review Confidential 19
- 20. Risk Driver Approach EPC SCOPE – WBS R & O – RBS / WBS Estimate – CBS / WBS Schedule WBS WBS WBS RBS CBS 20
- 21. R&O Register For the confidentiality reasons, this image does not present the project’s actual R&O Register. 21
- 22. S/C/S/R Model* For the confidentiality reasons, this image does not present the project’s actual S/C/S/R Model. 22
- 23. MCS Modelling* Confidential Confidential For the confidentiality reasons, this image does not present the project’s actual S/C/S/R Model. 23
- 24. Results* Confidential For the confidentiality reasons, this image does not present the project’s actual results. 24
- 25. Results* Confidential Always CRITICAL For the confidentiality reasons, this image does not present the project’s actual results. 25
- 26. Results* For the confidentiality reasons, this image does not present the project’s actual results. 26
- 27. Benefits to bottom line Increase certainty in achieving project outcomes Proper planning of Scope, Time, Cost, & Risk Learn from lessons Mitigate risks and maximise Opportunities Drive proactively Increase efficiency and optimise Scope, Time, Cost, & Risk Management 27
- 28. Any question, comment? 28