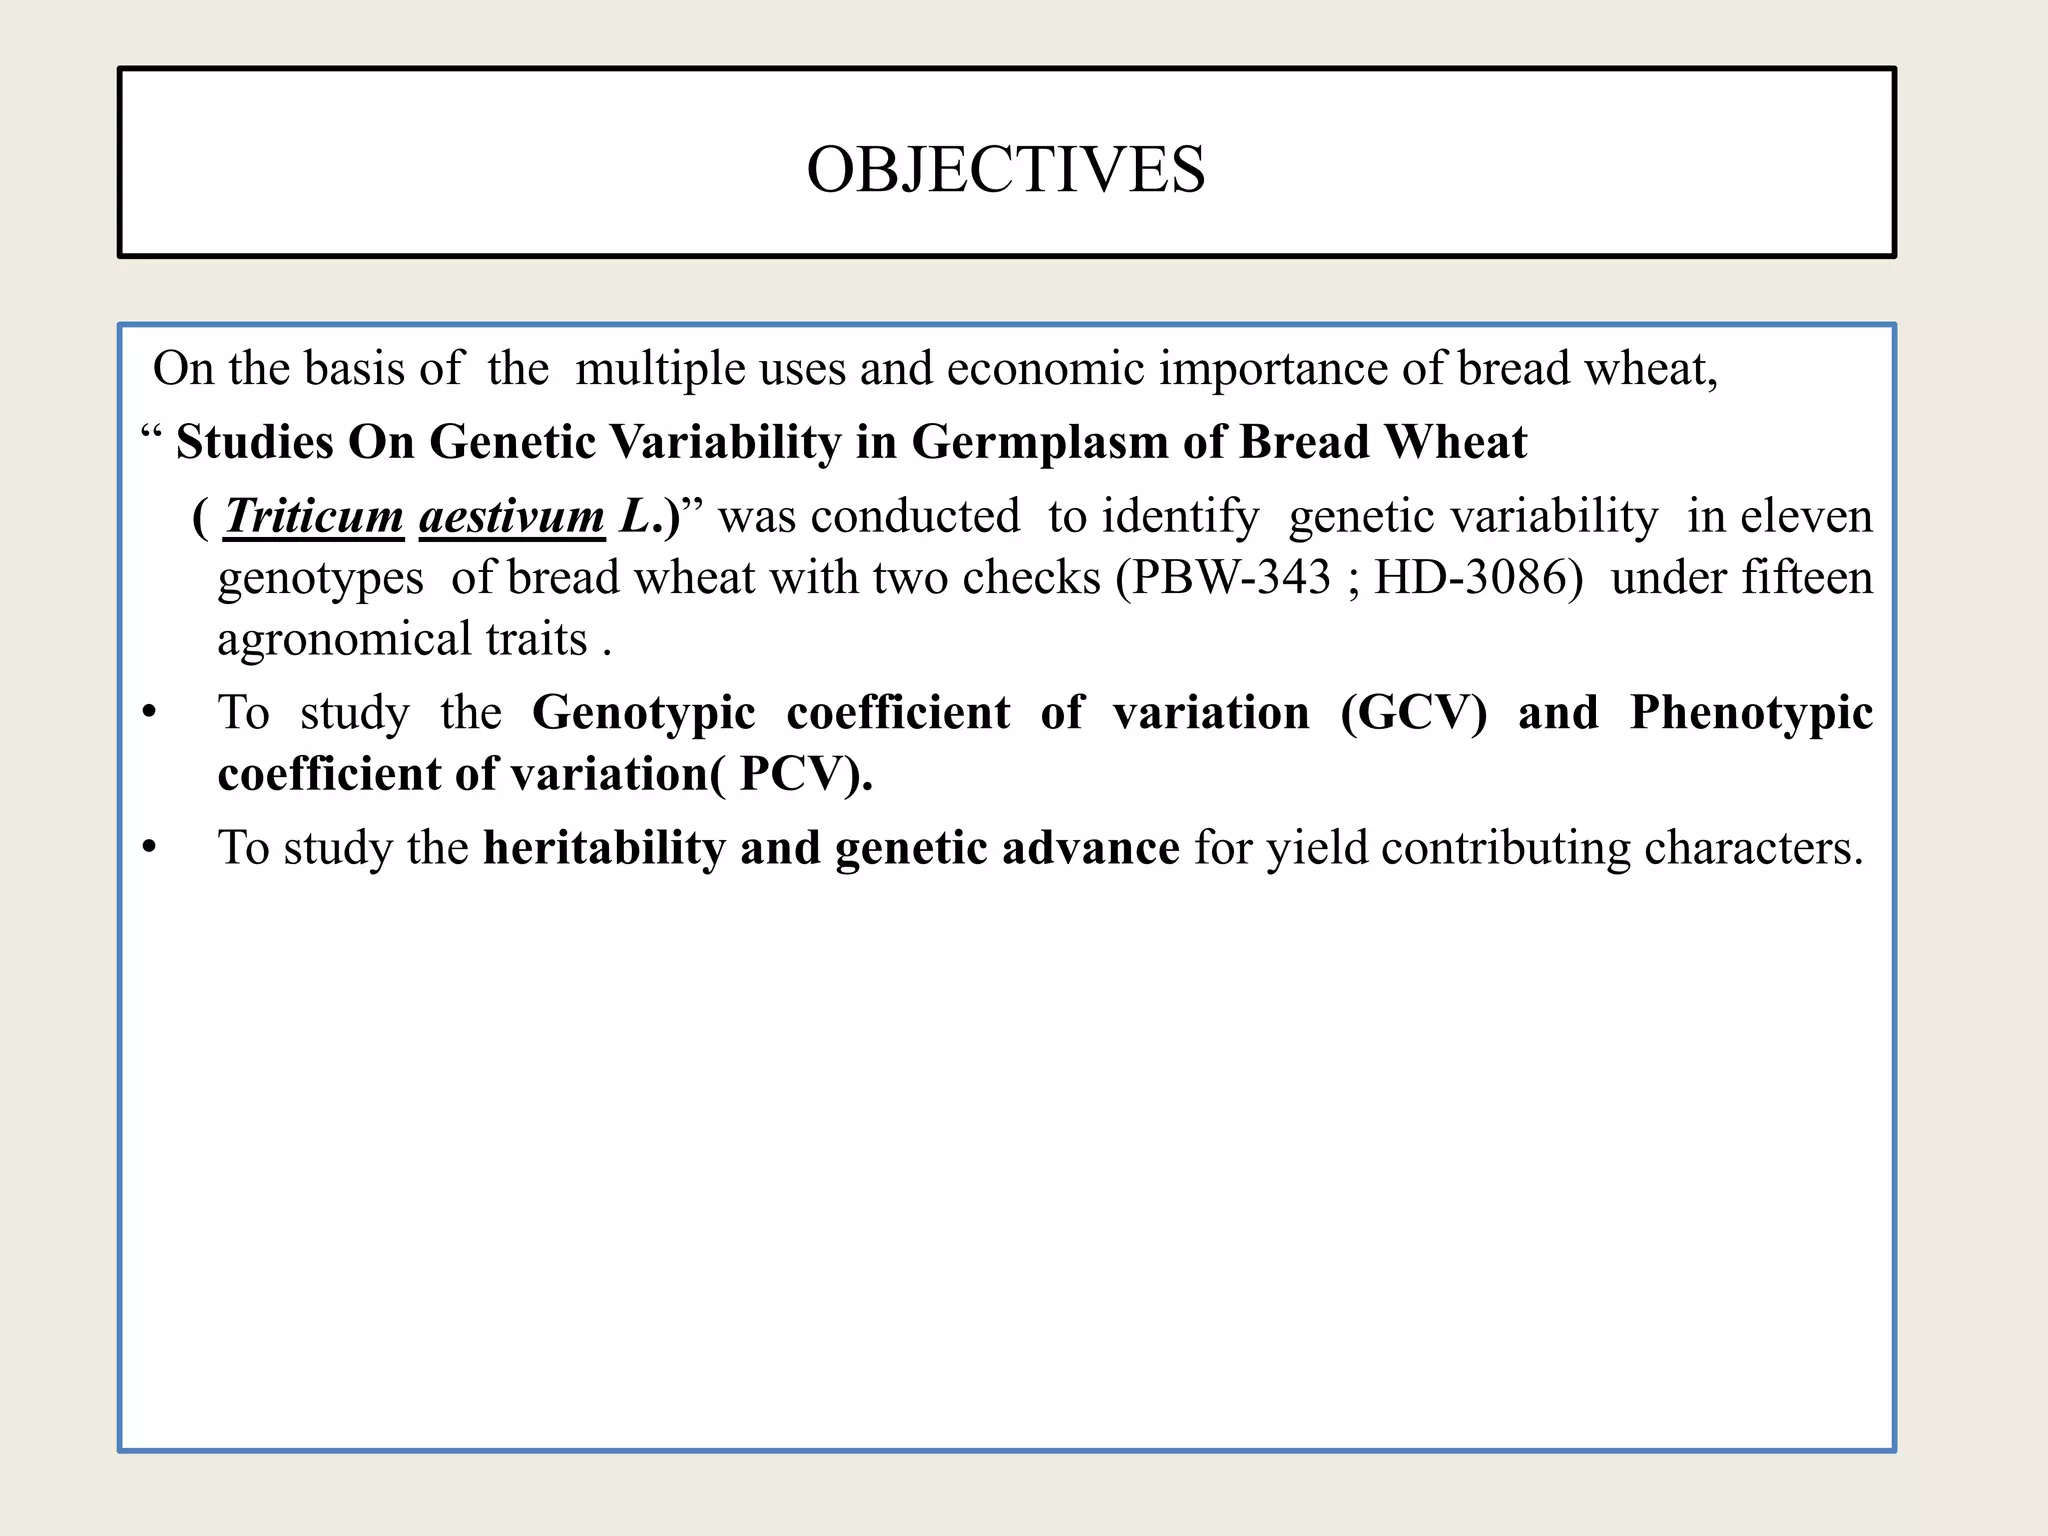
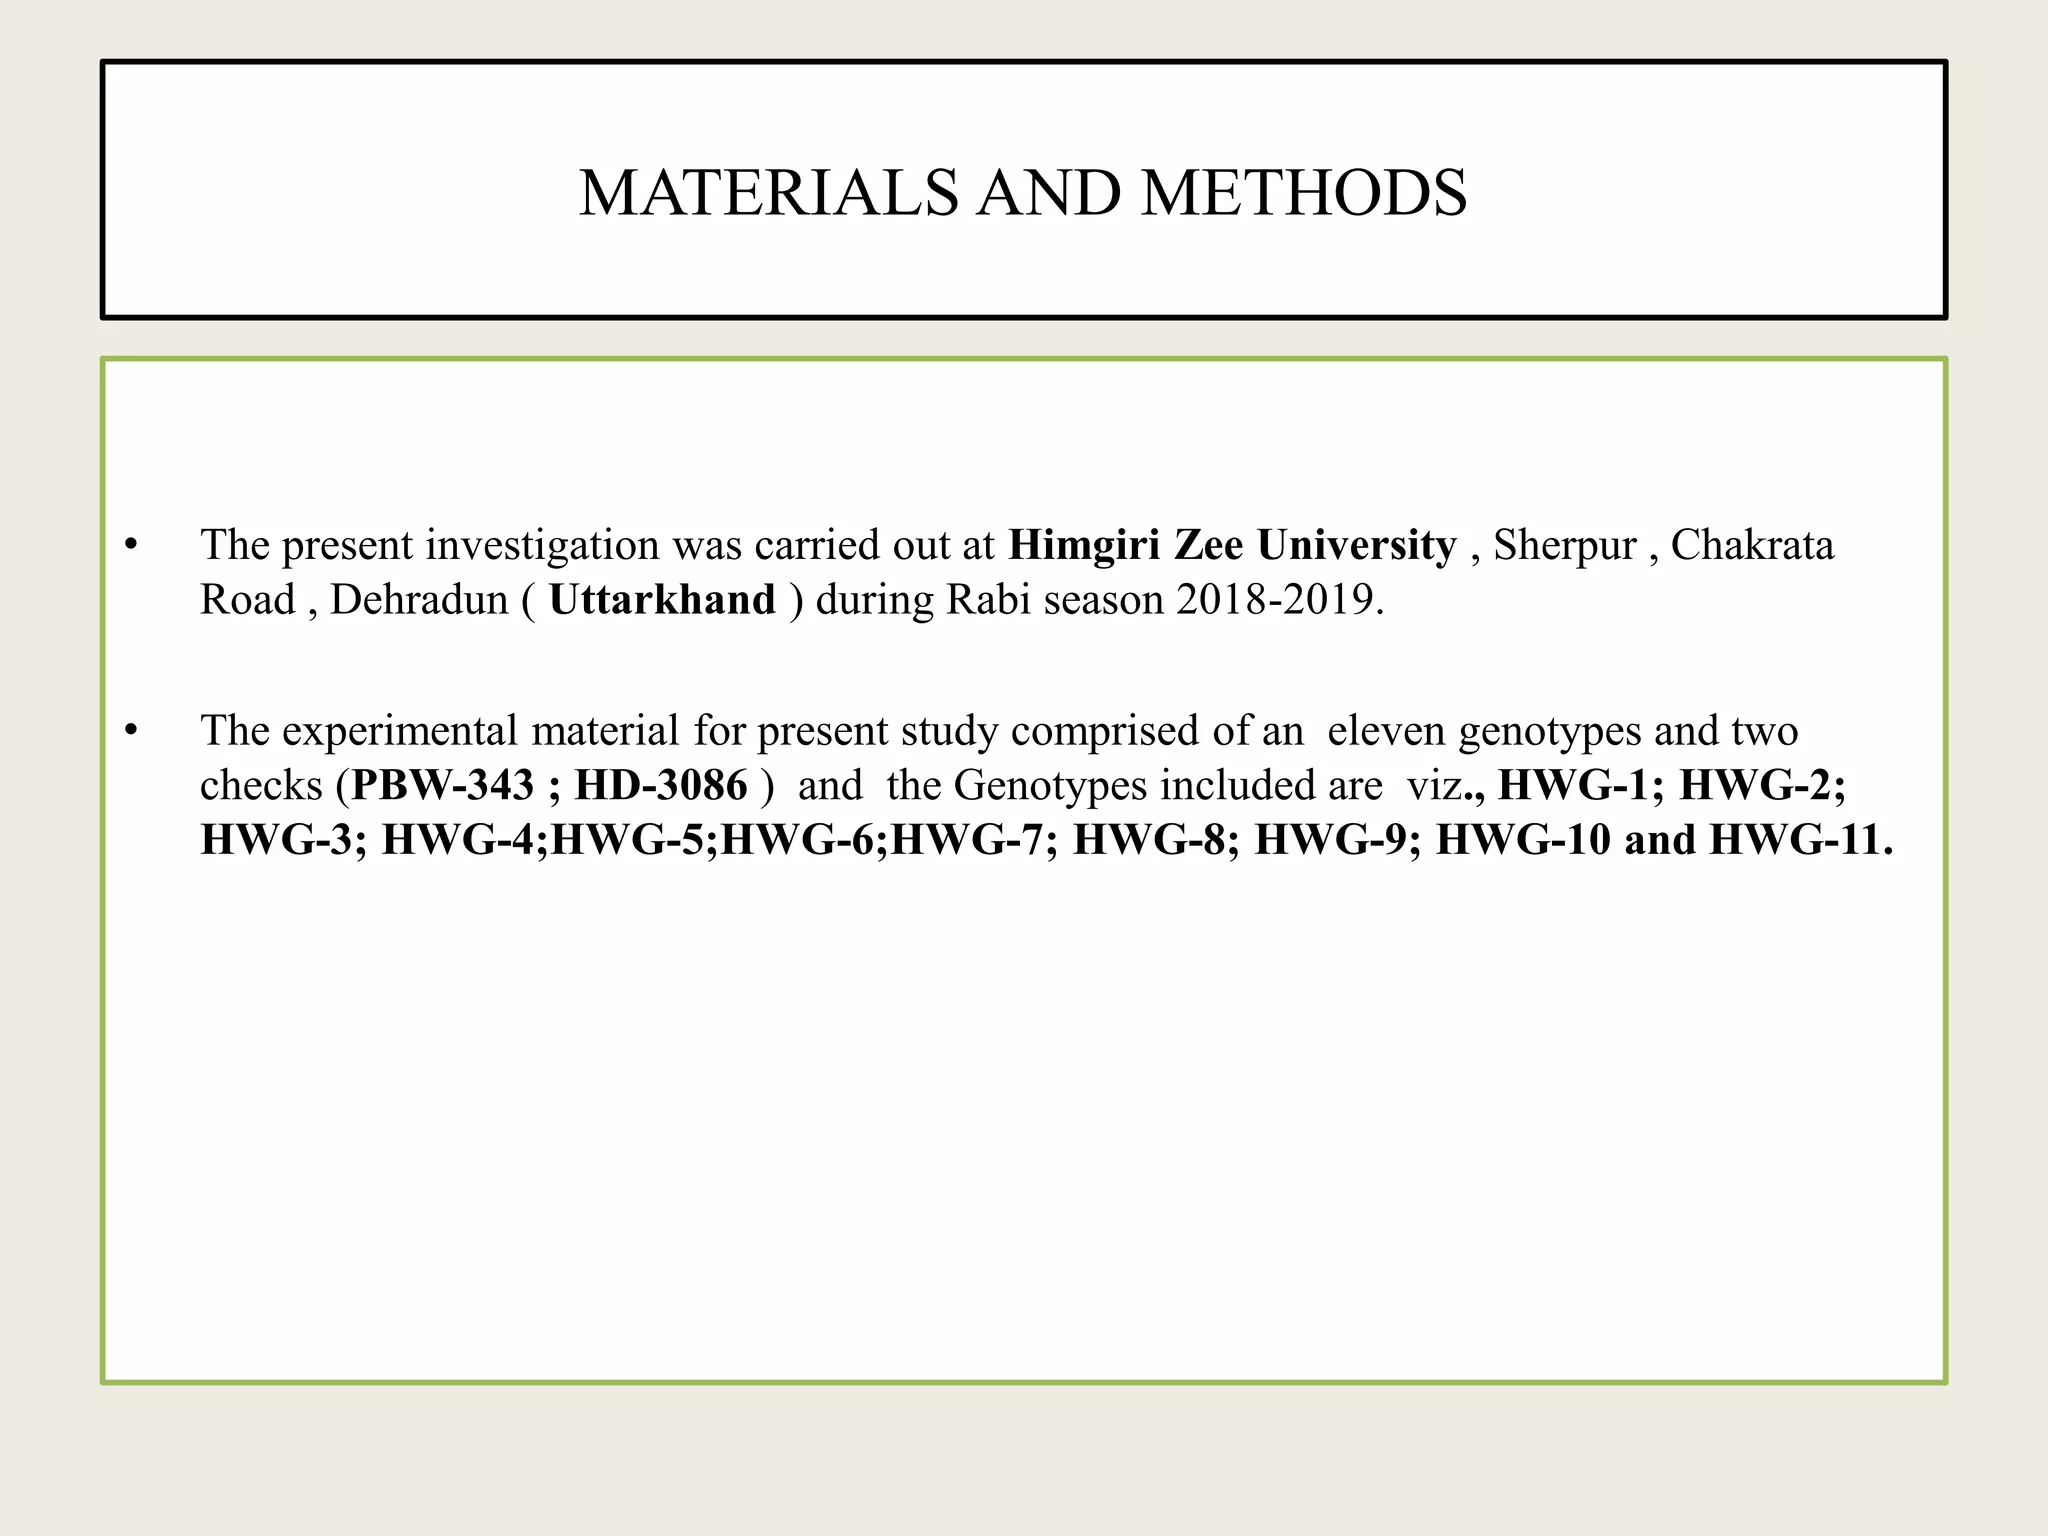
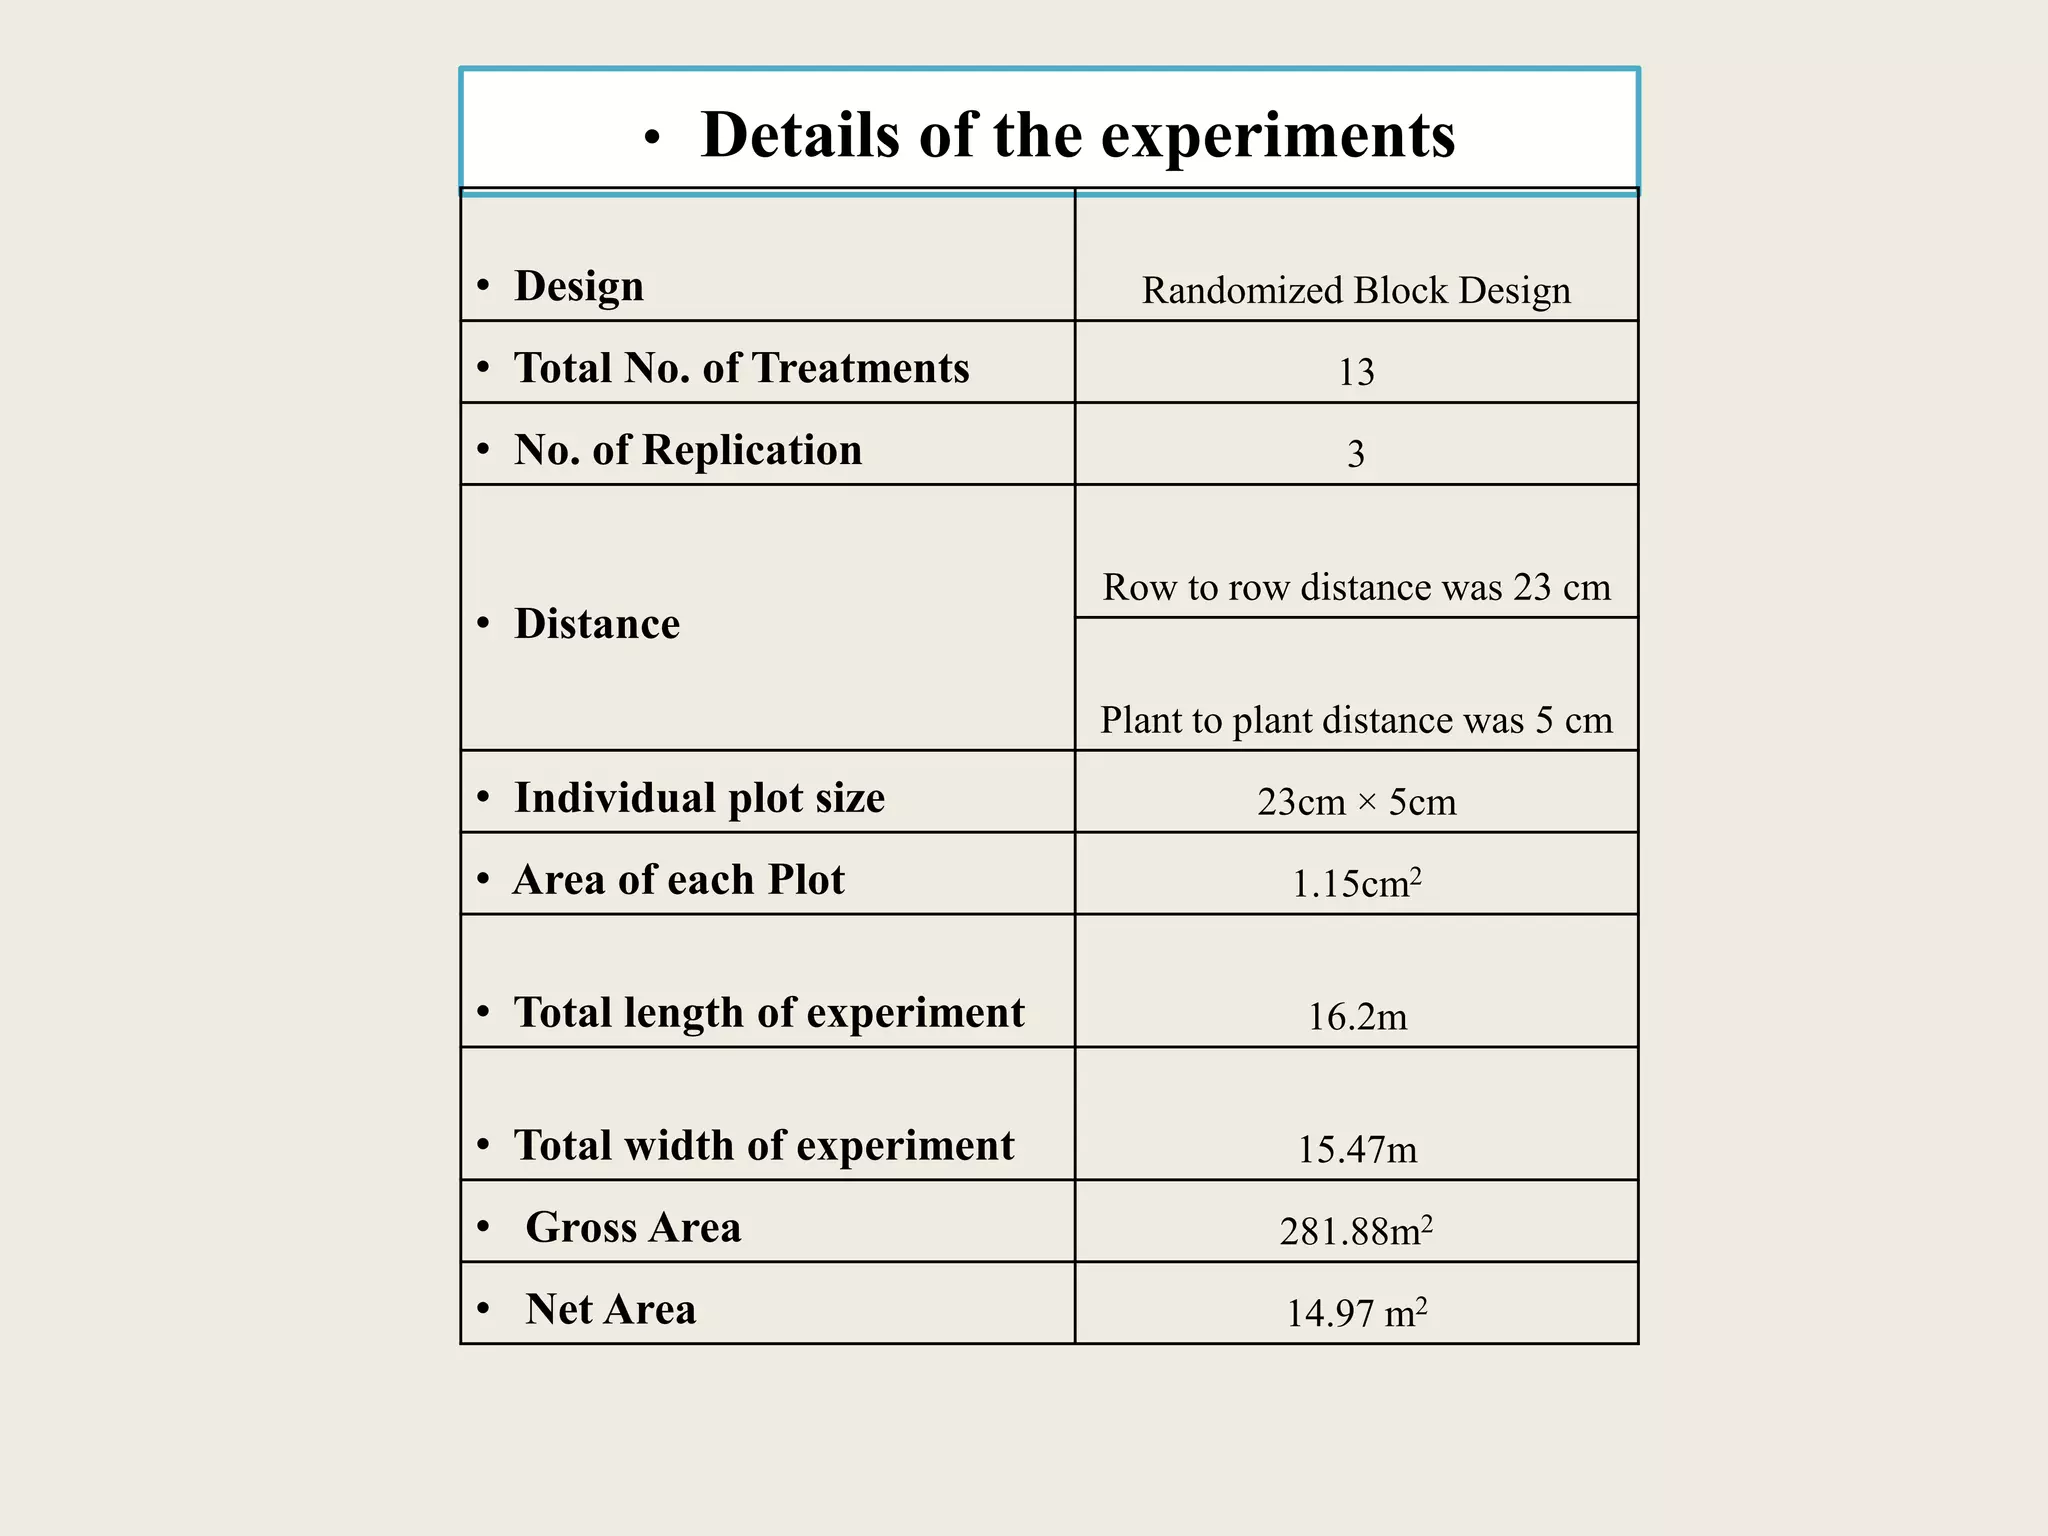
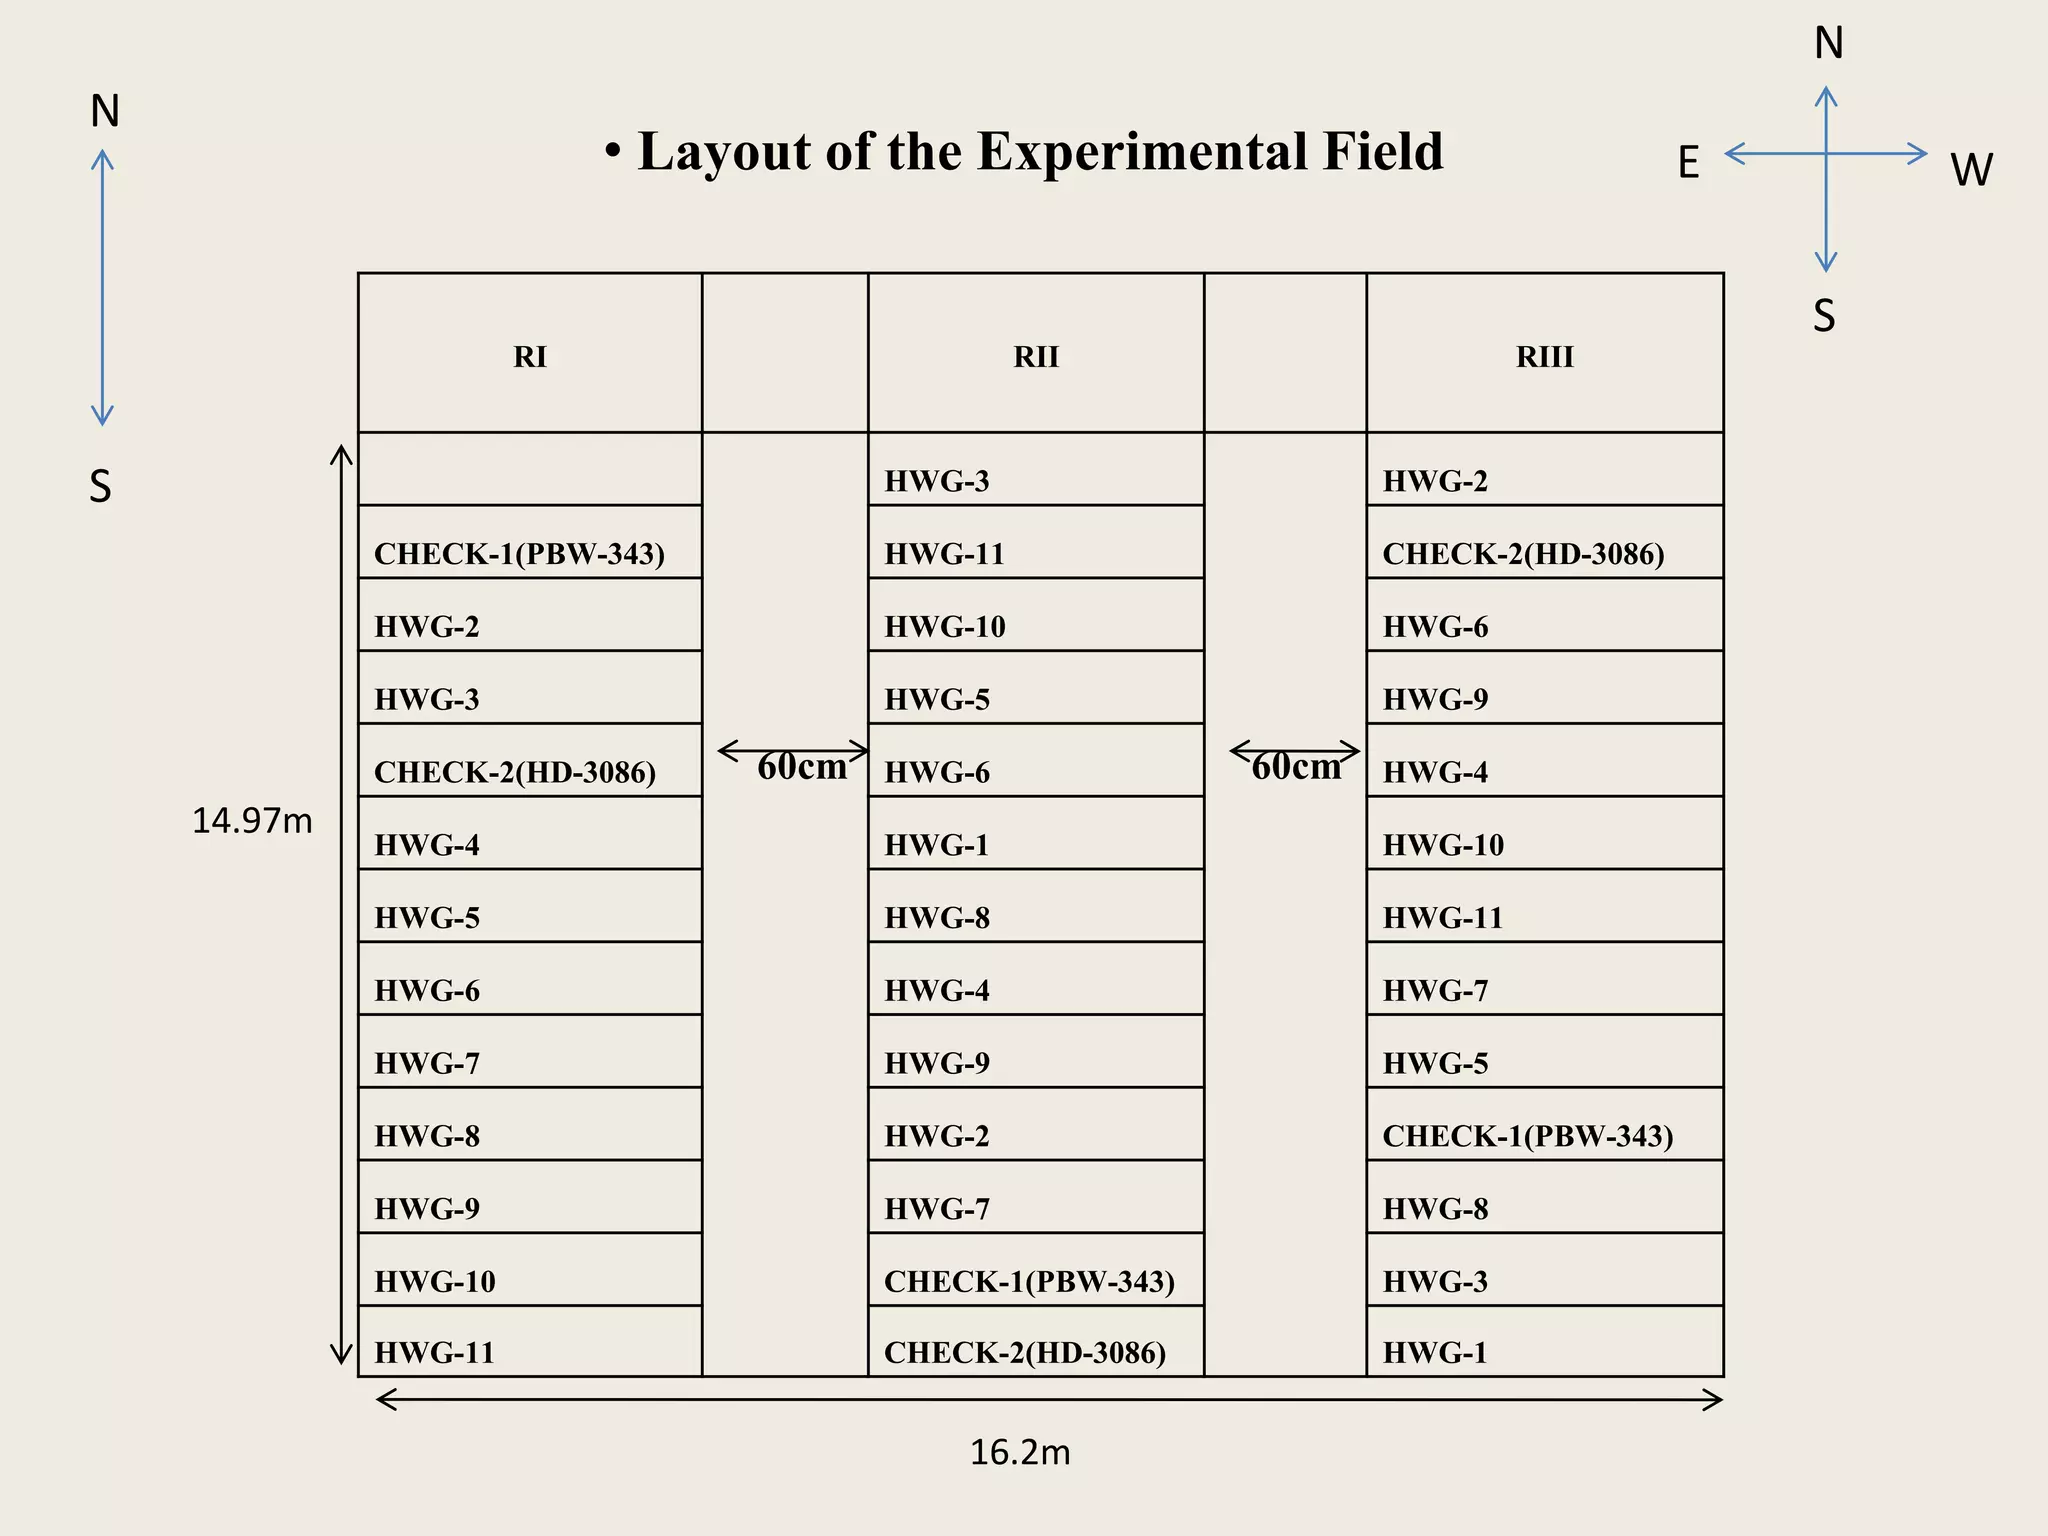
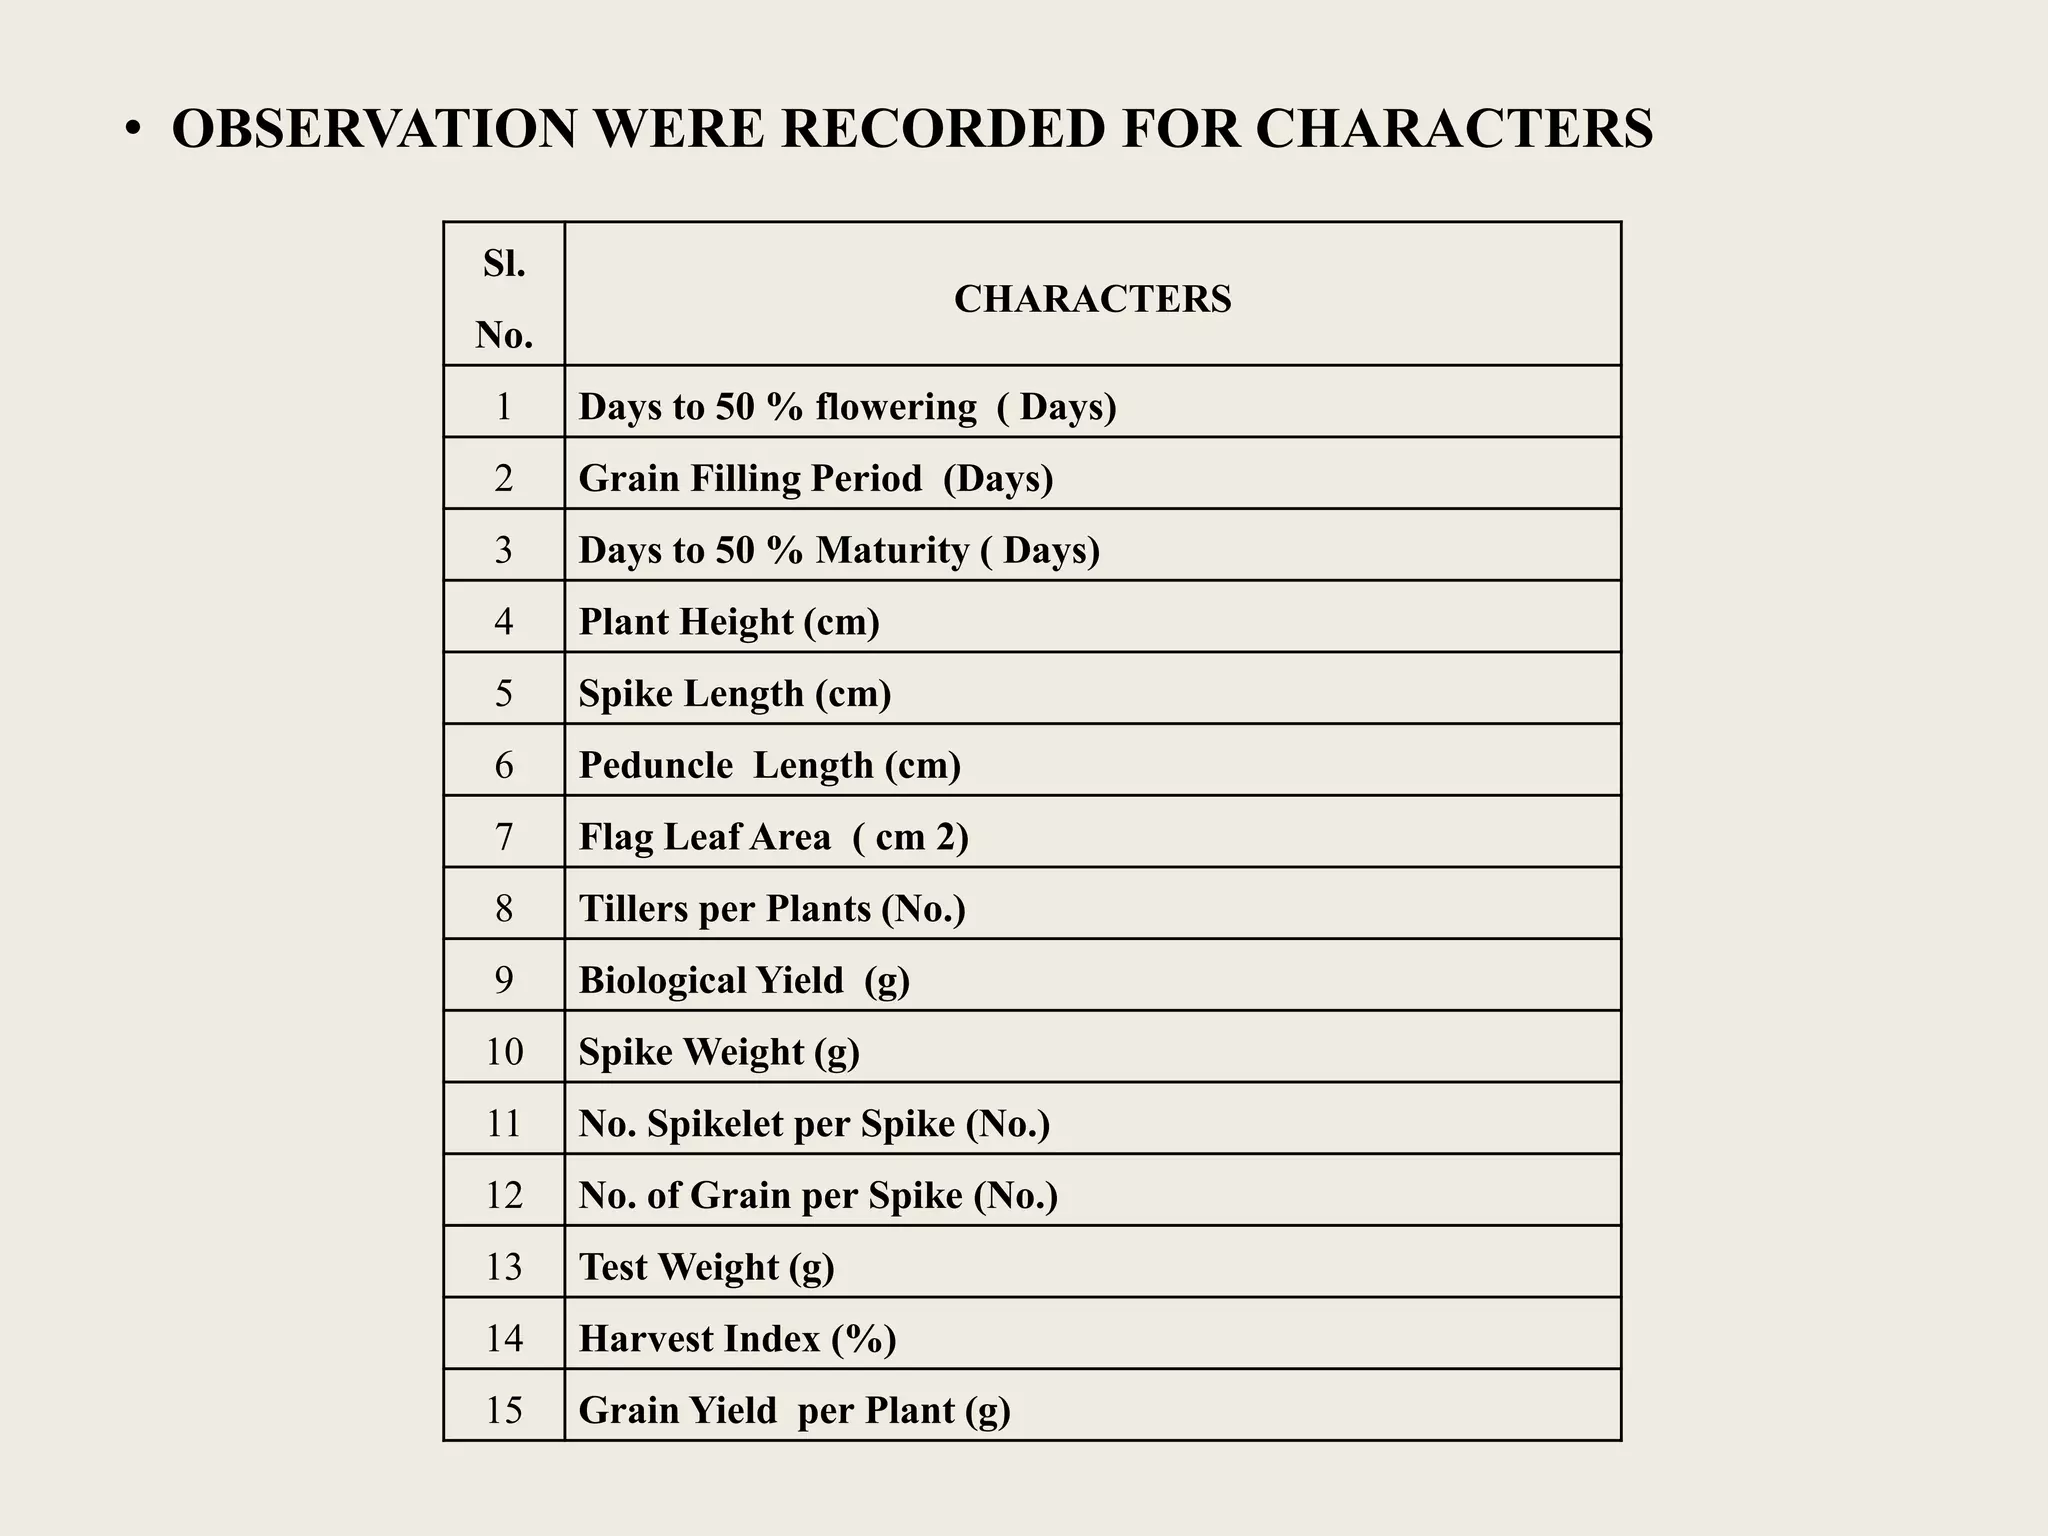
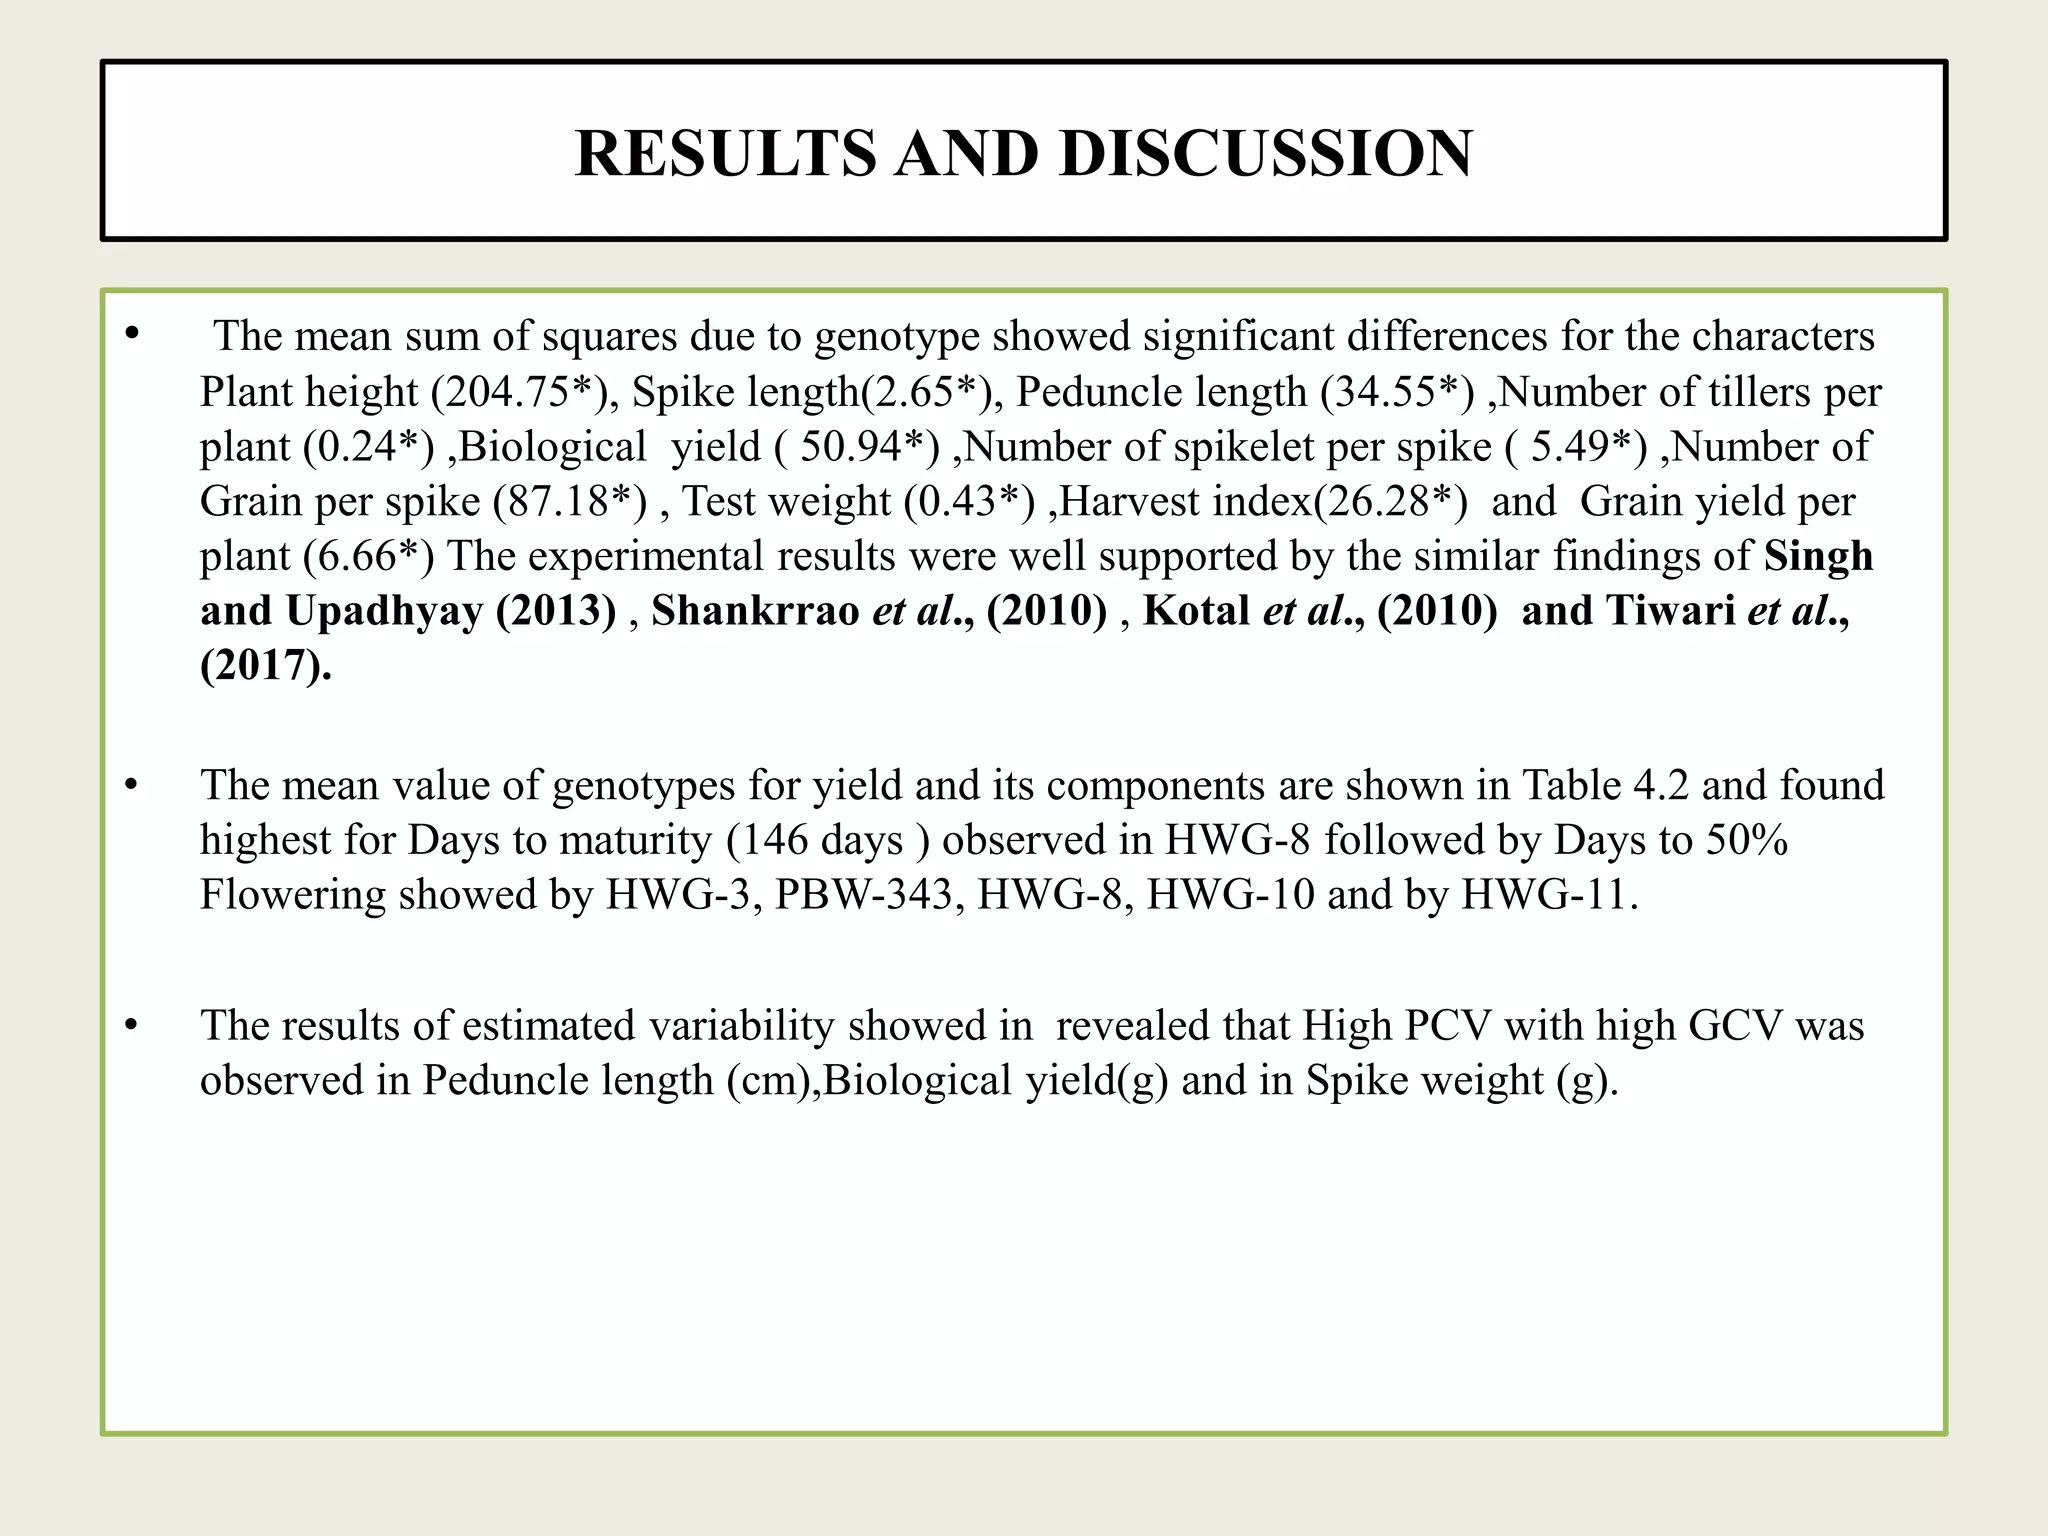
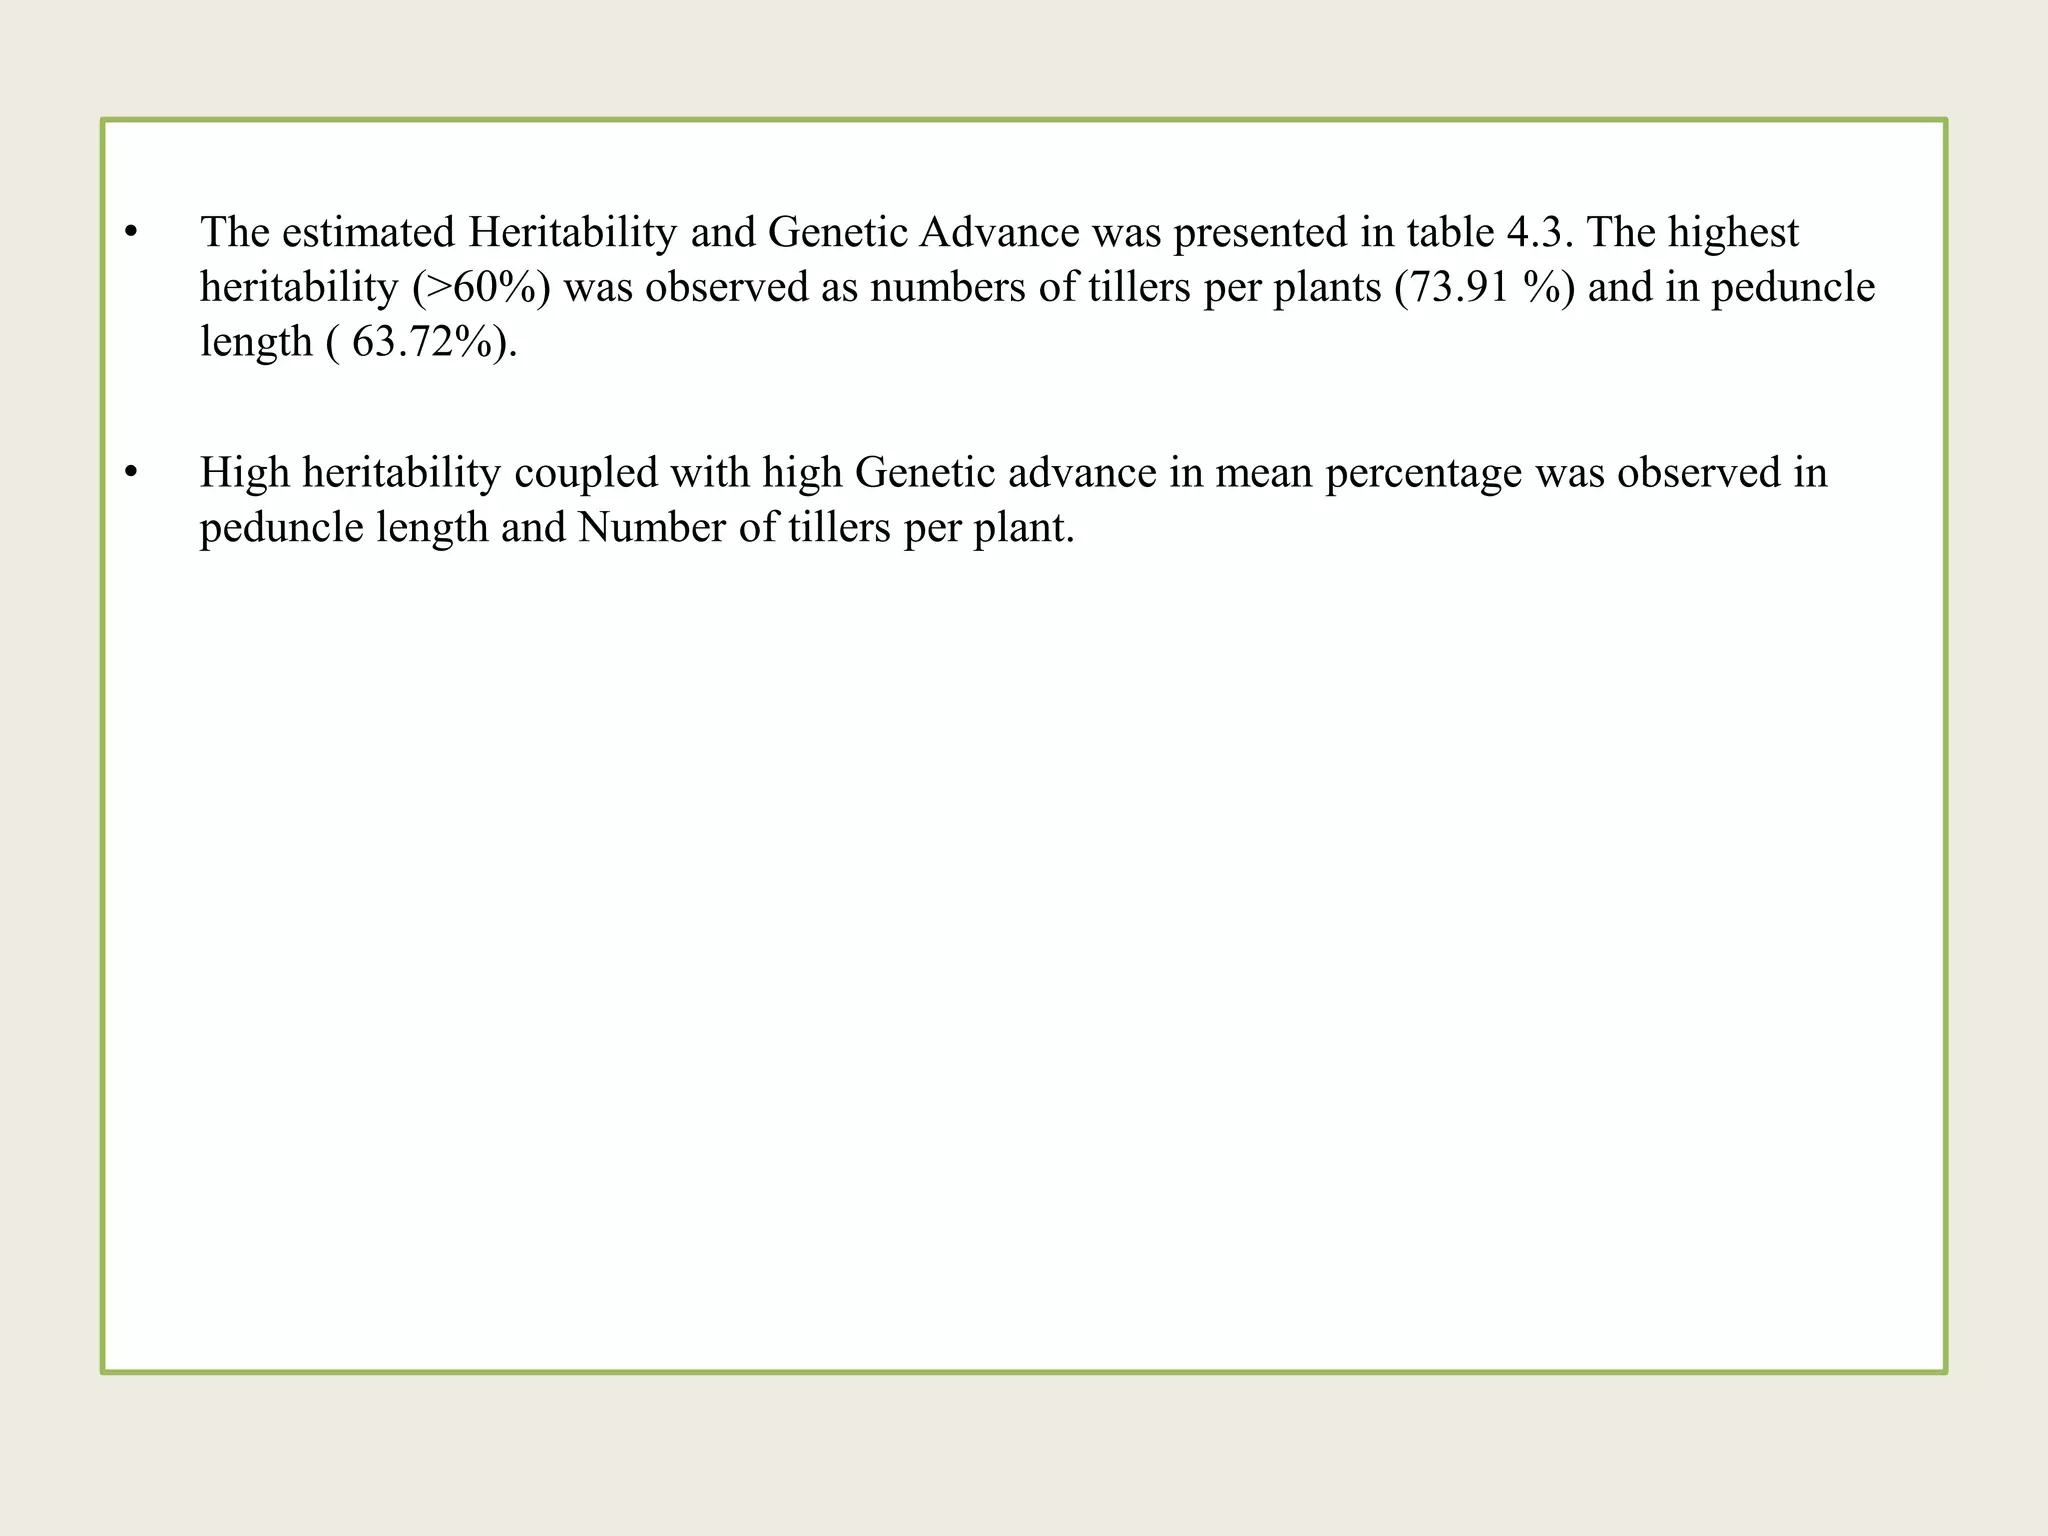
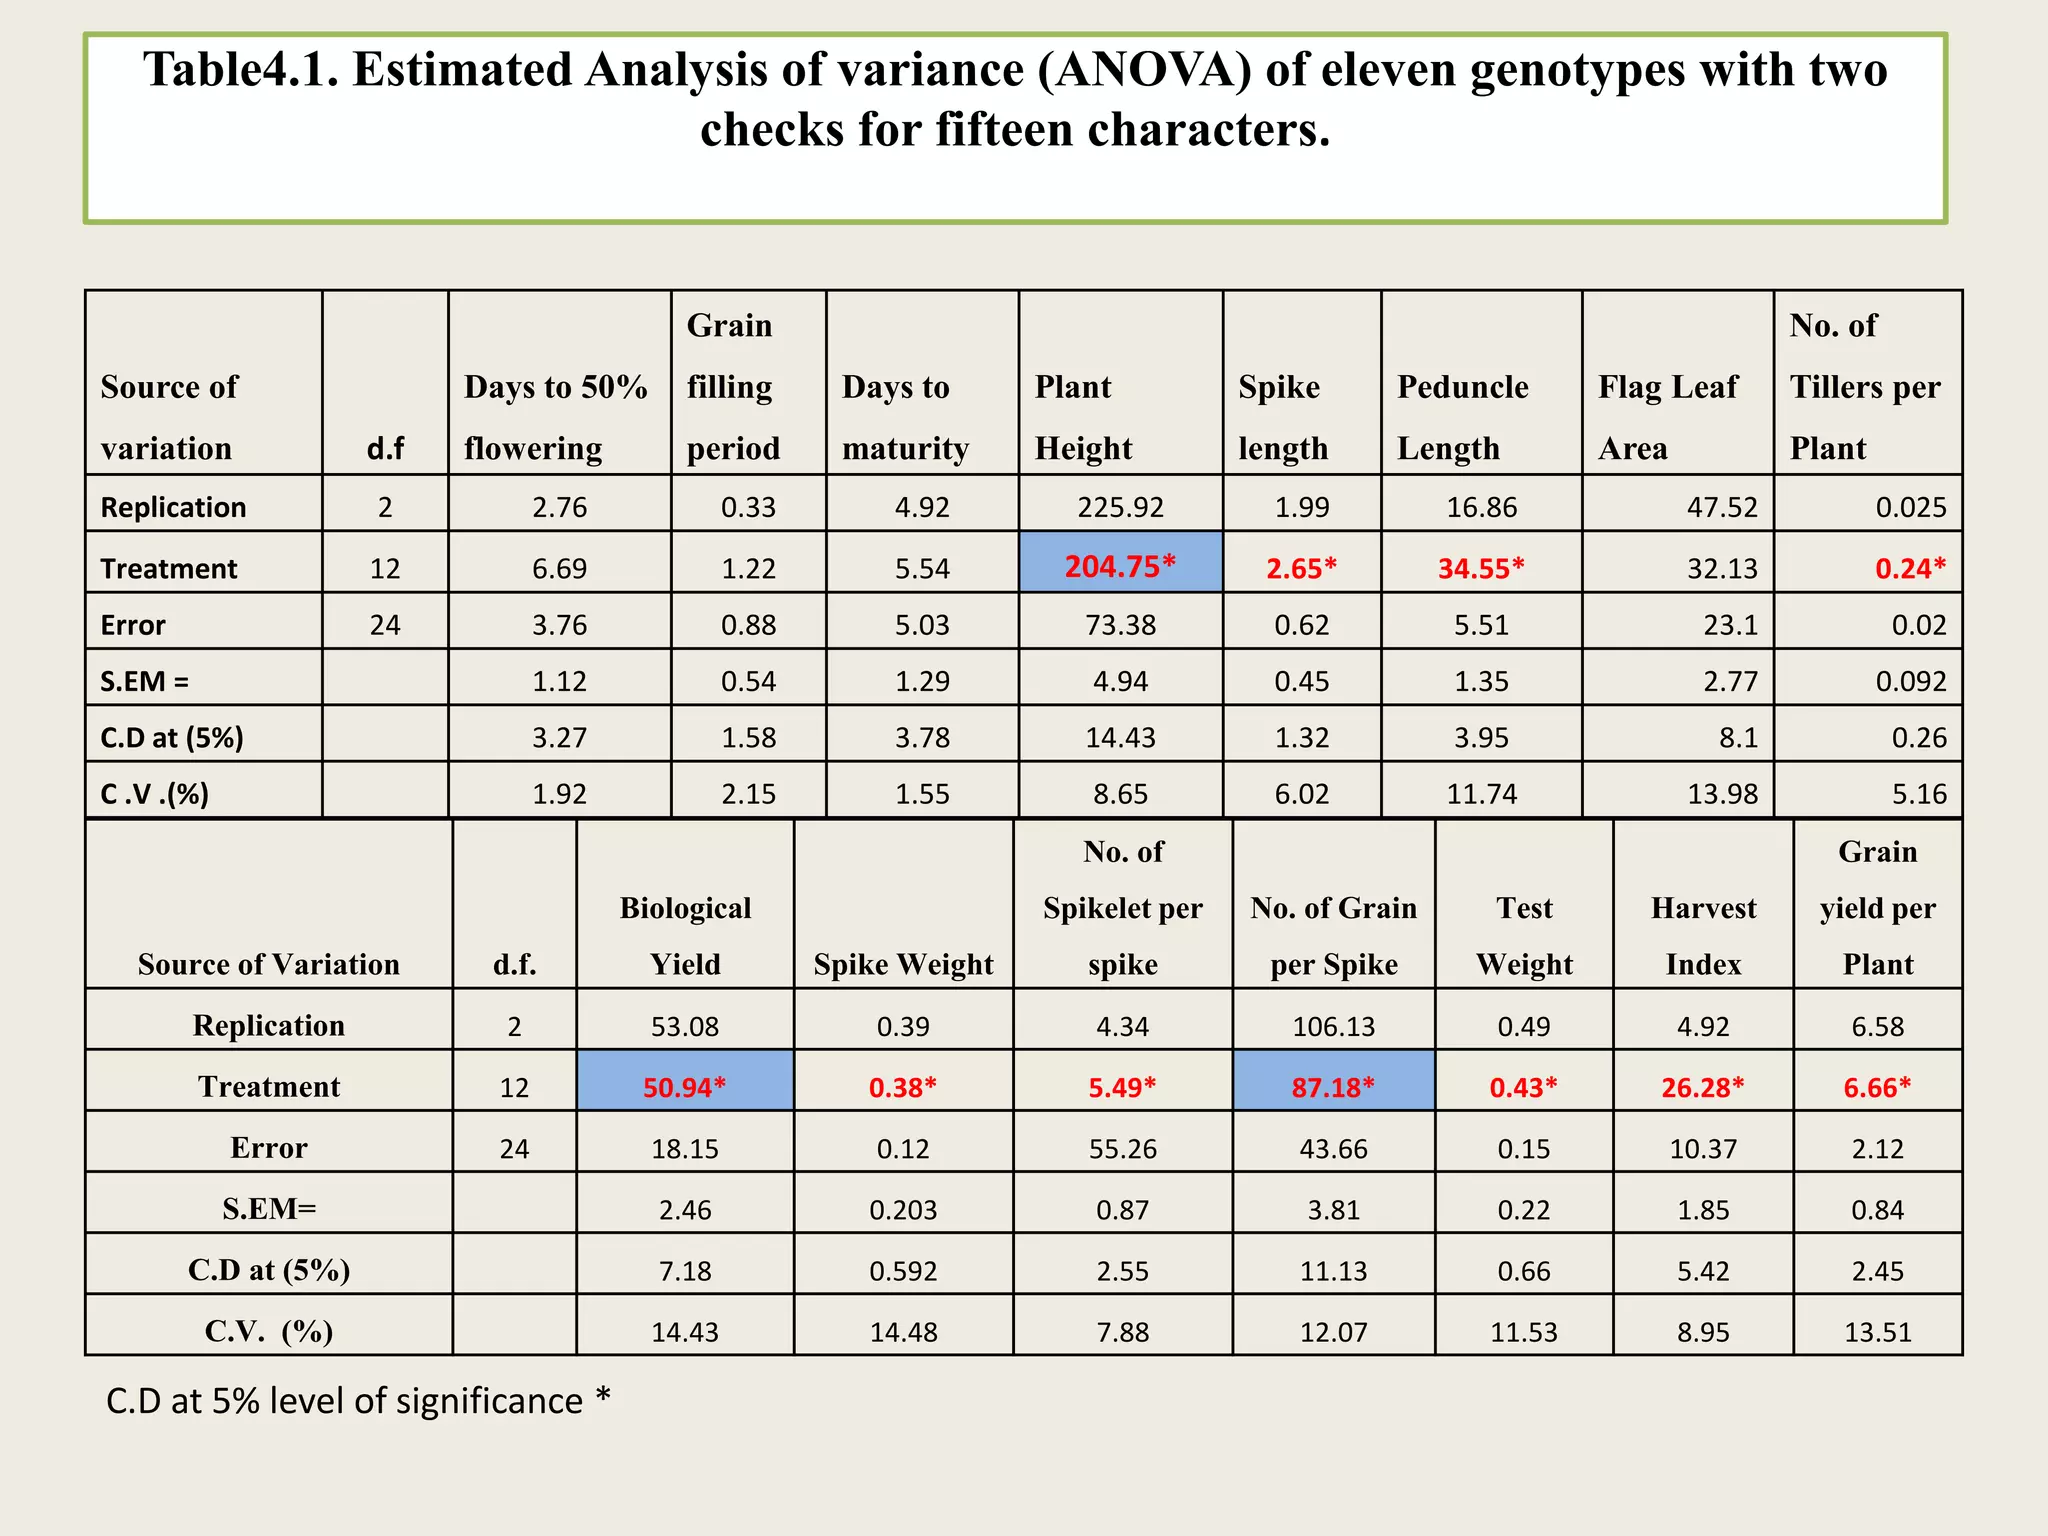
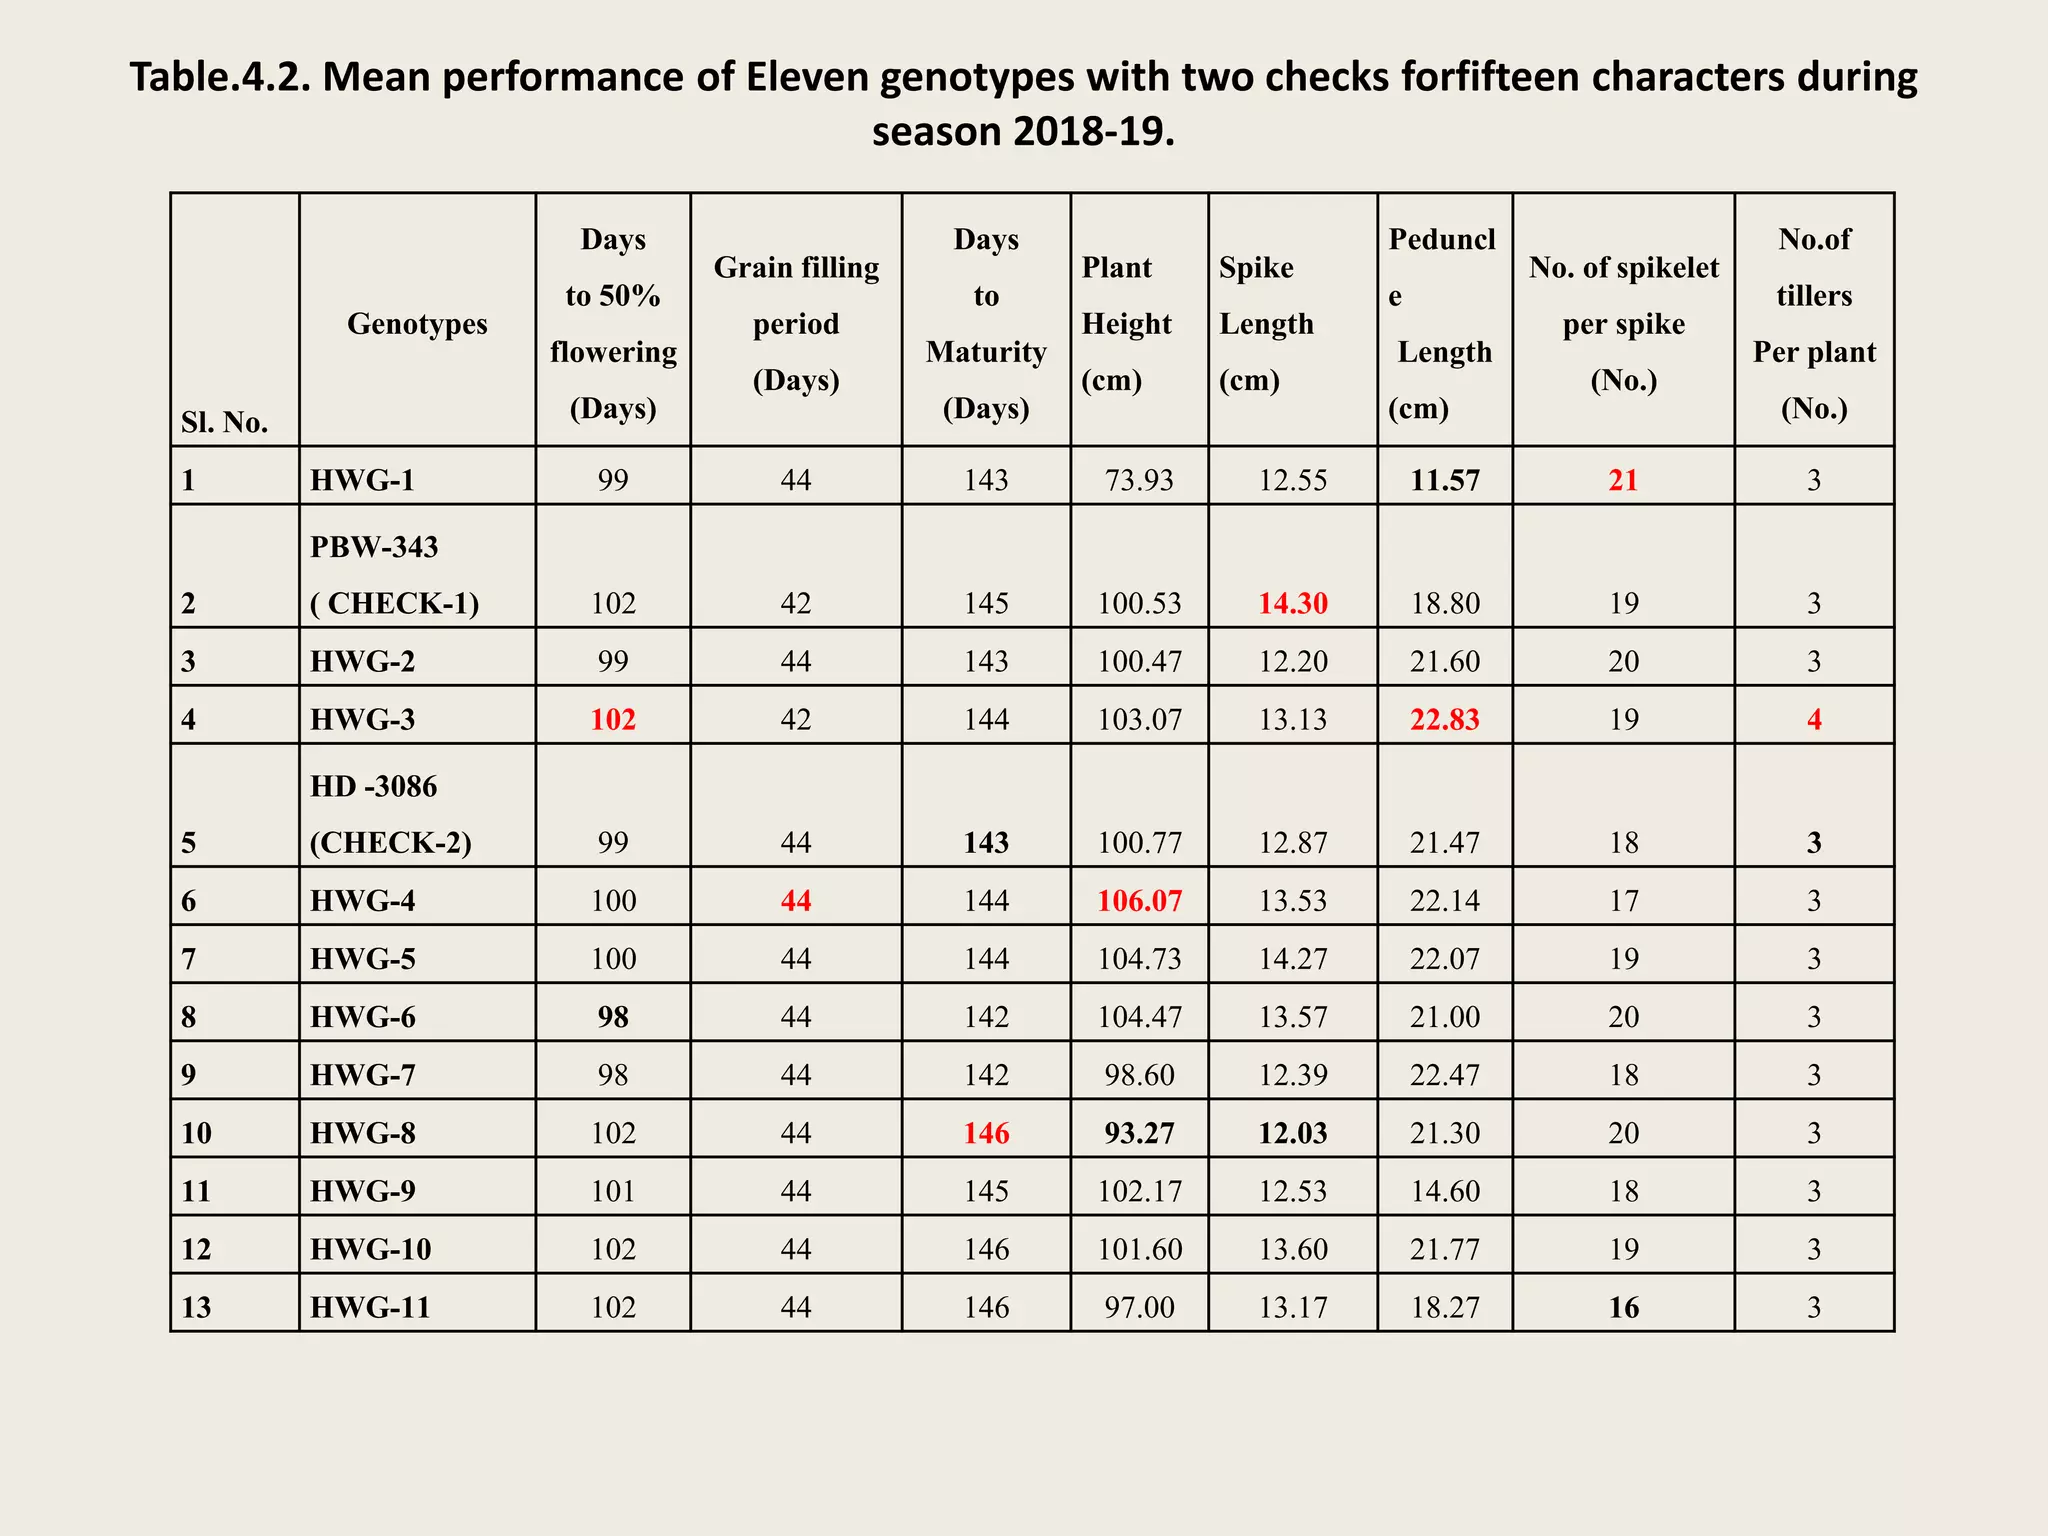
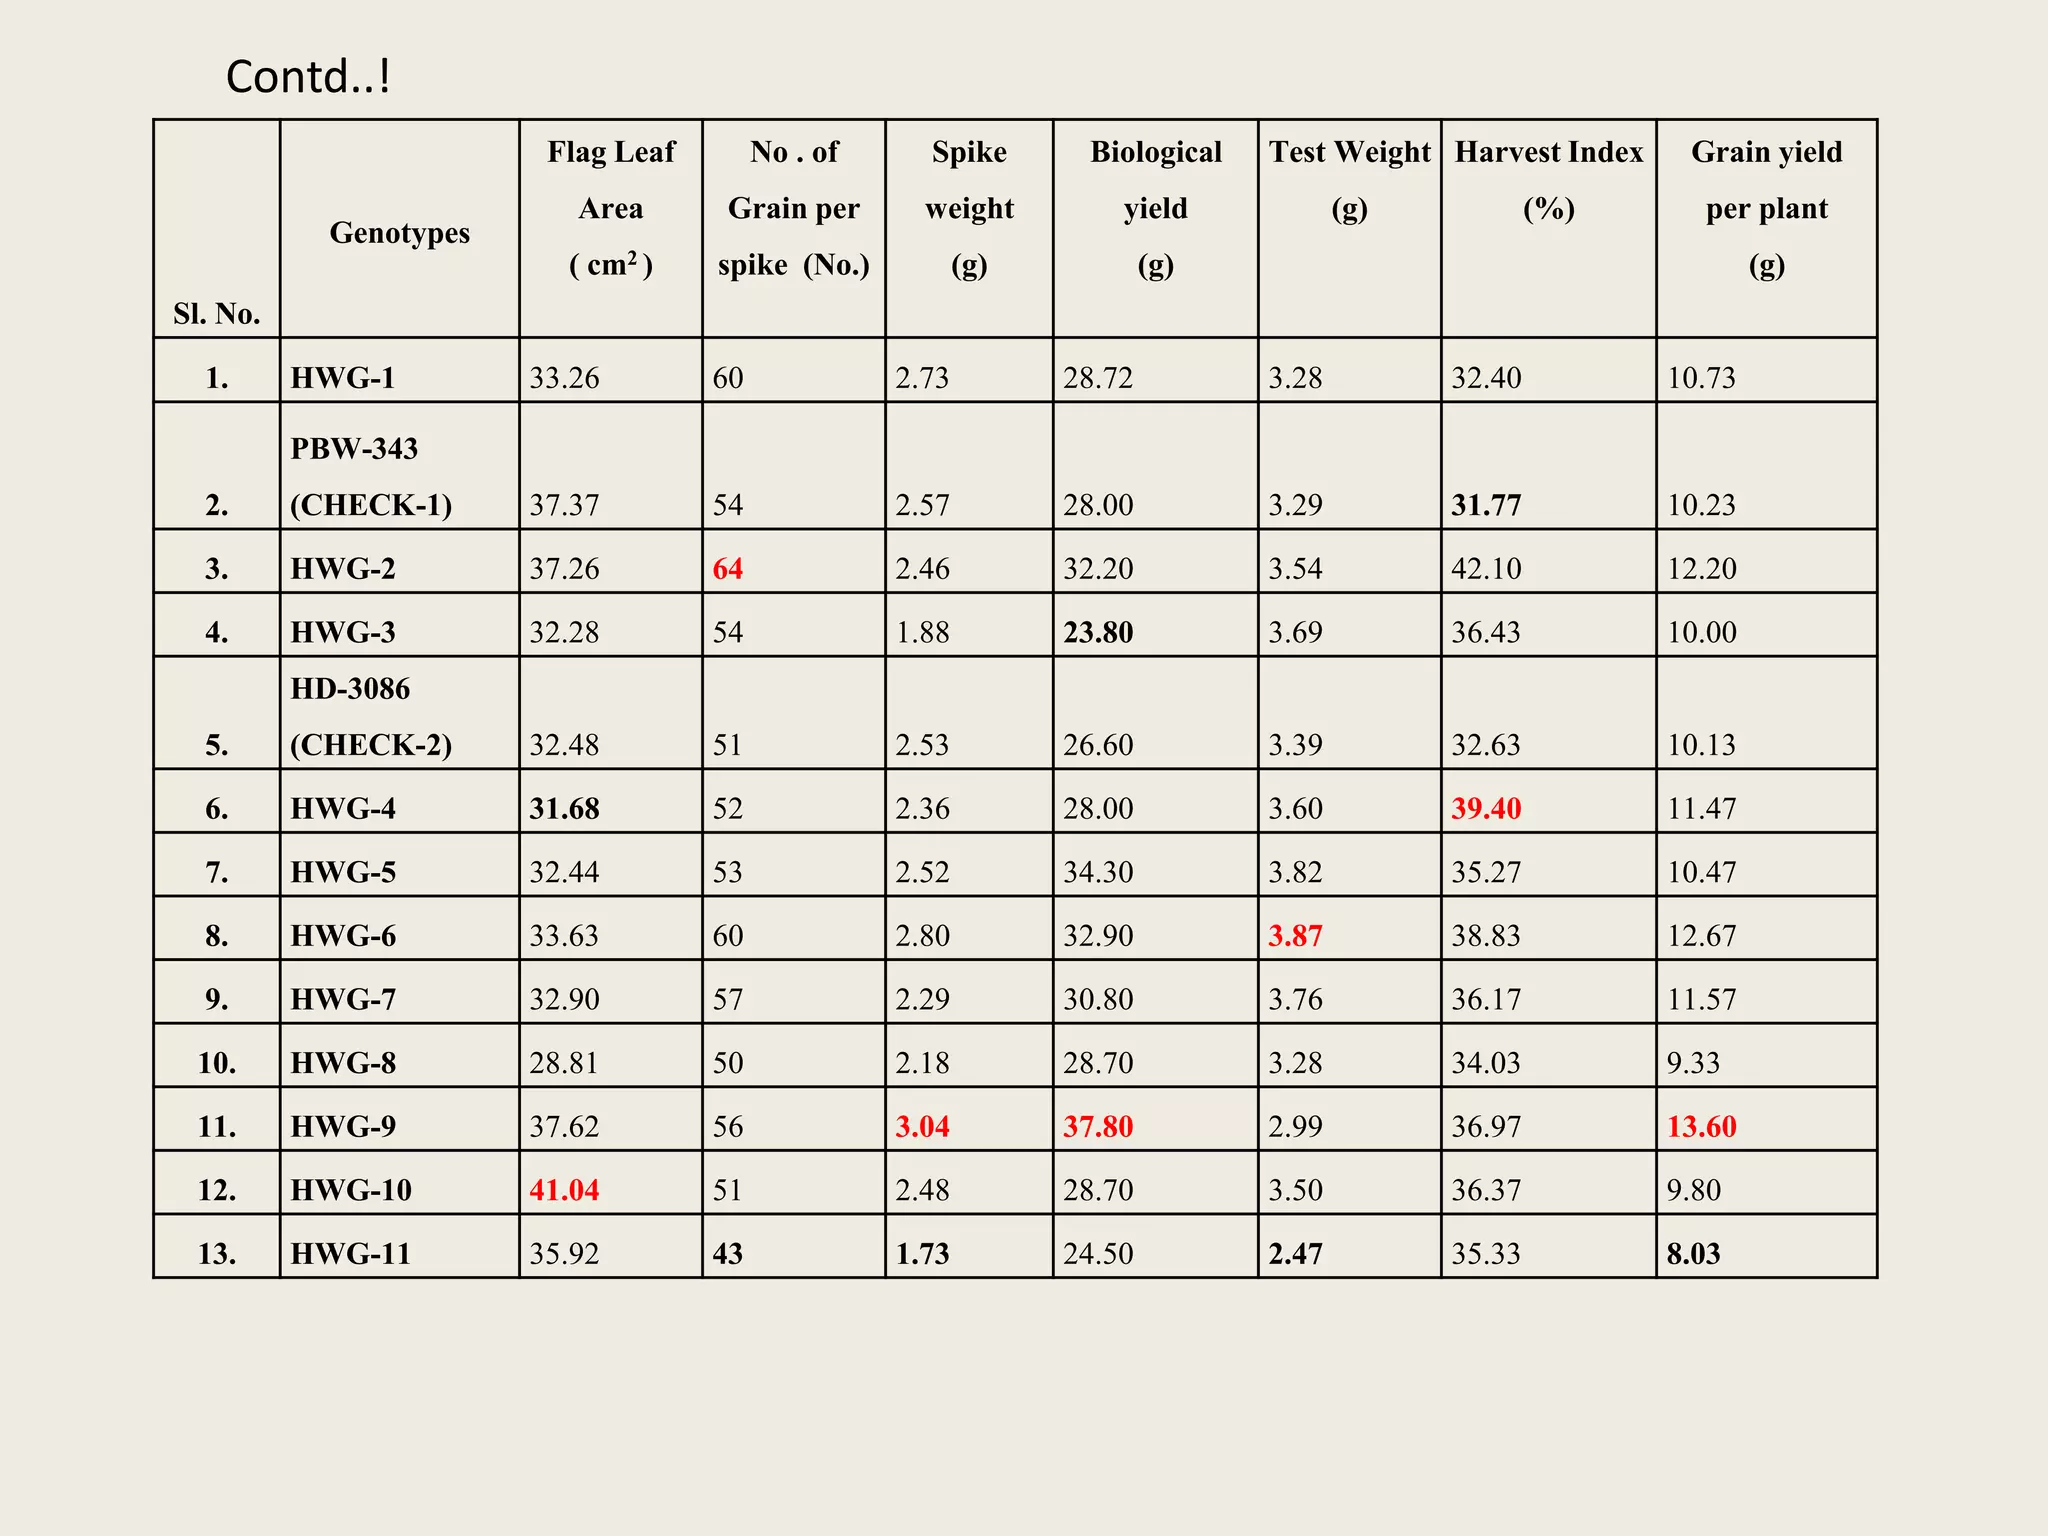
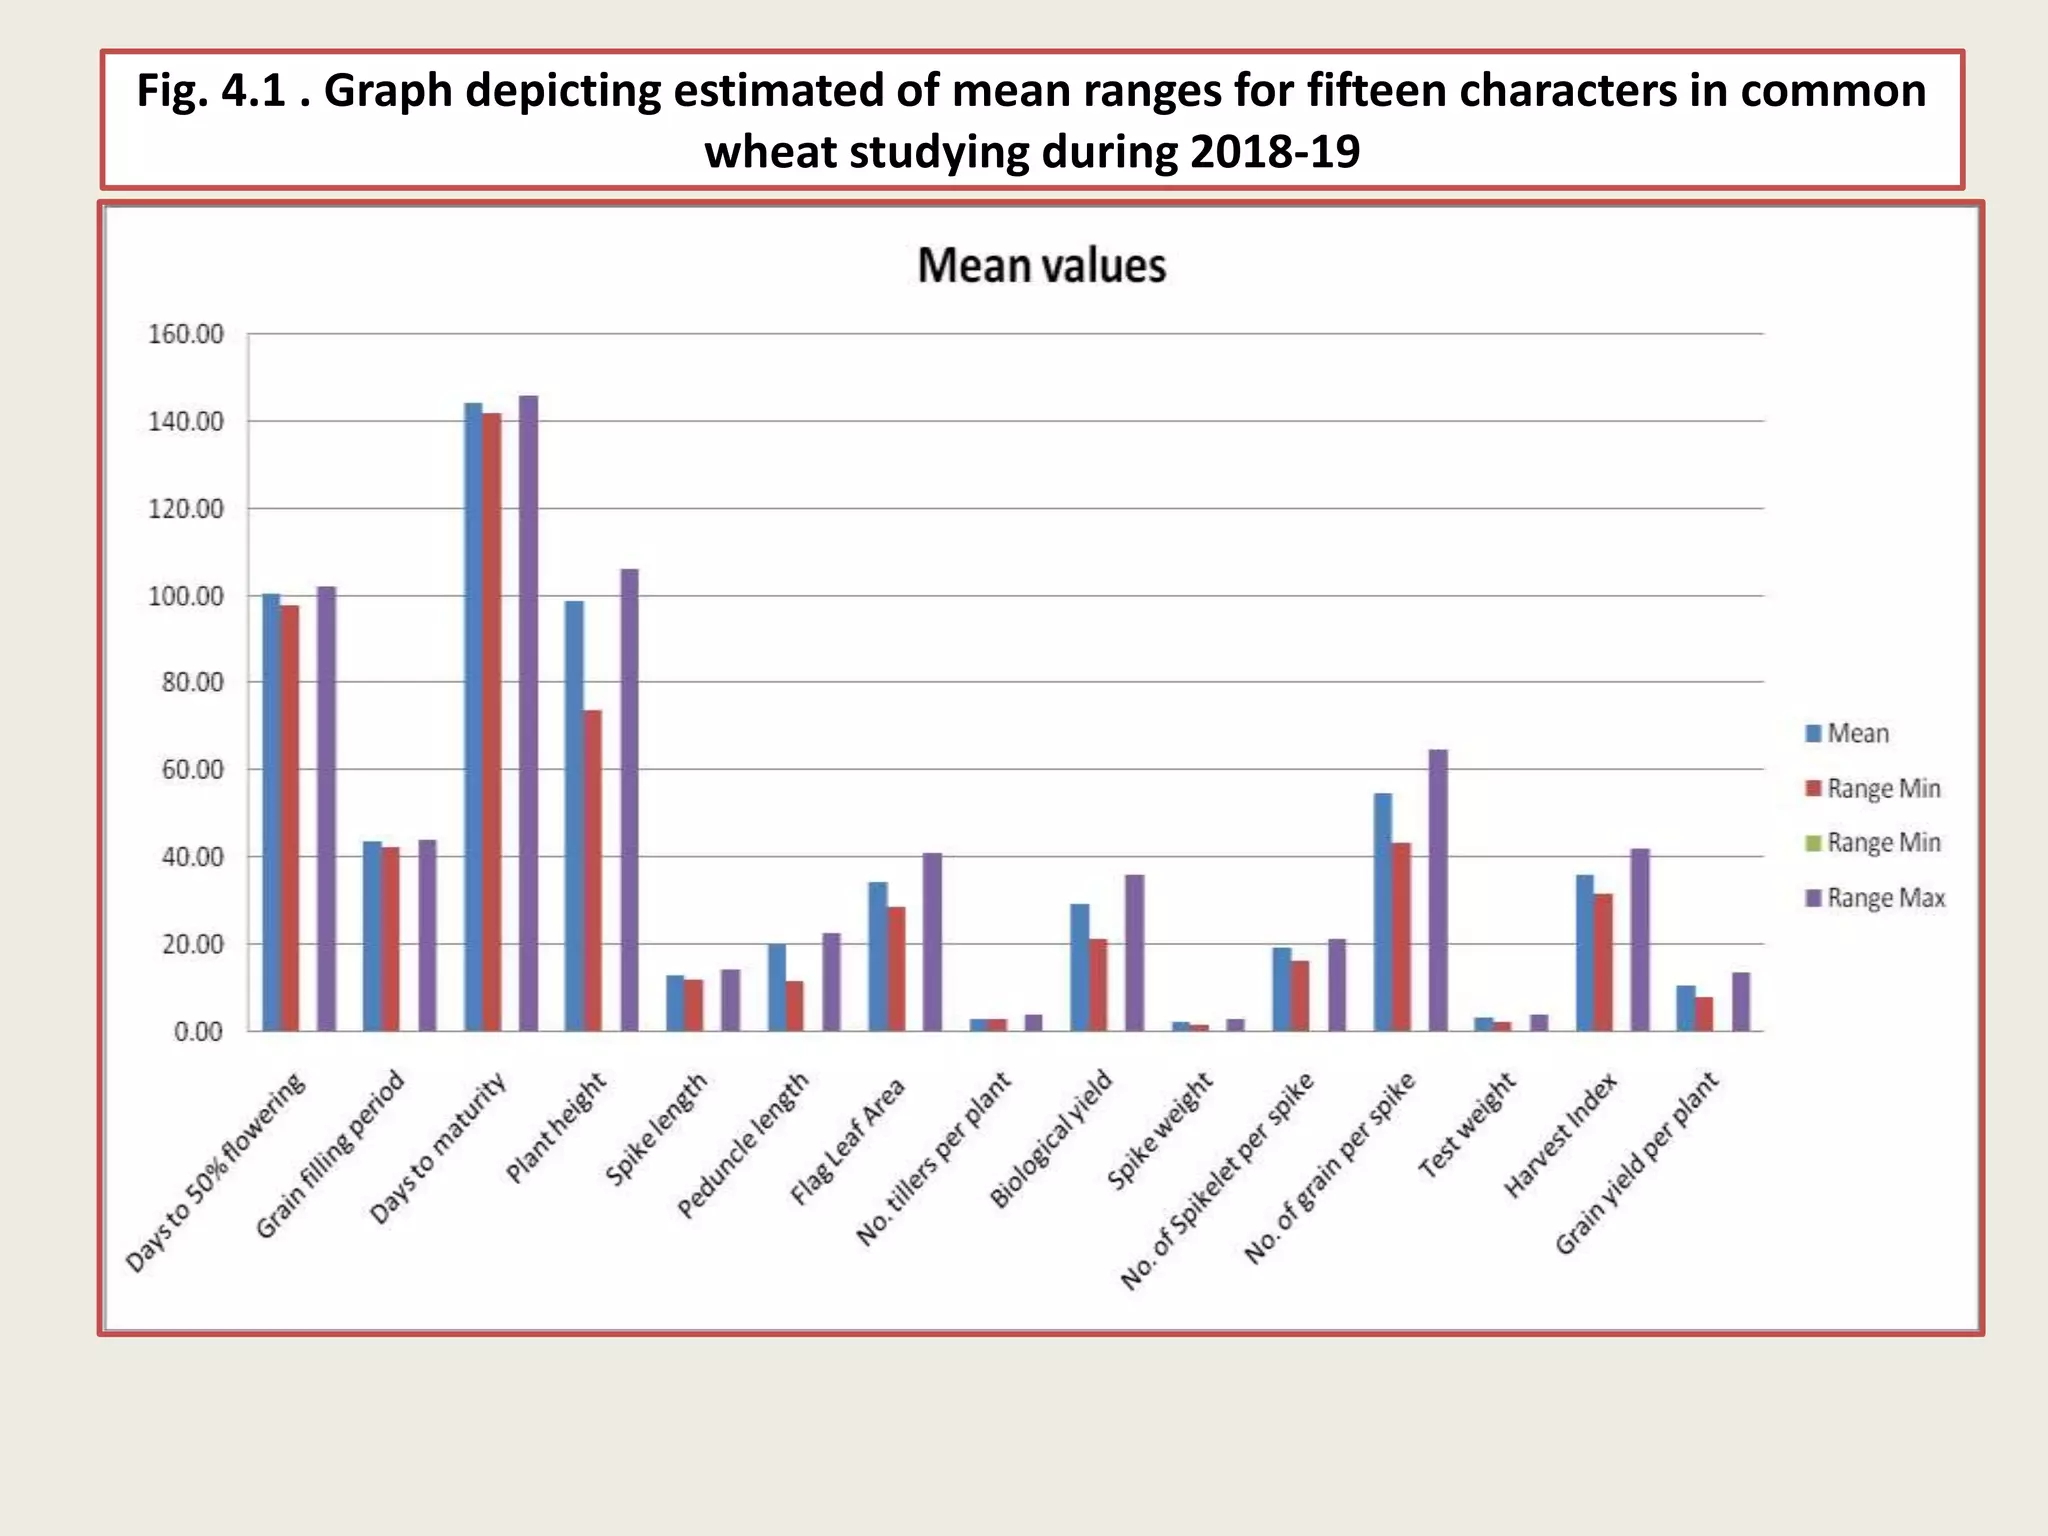
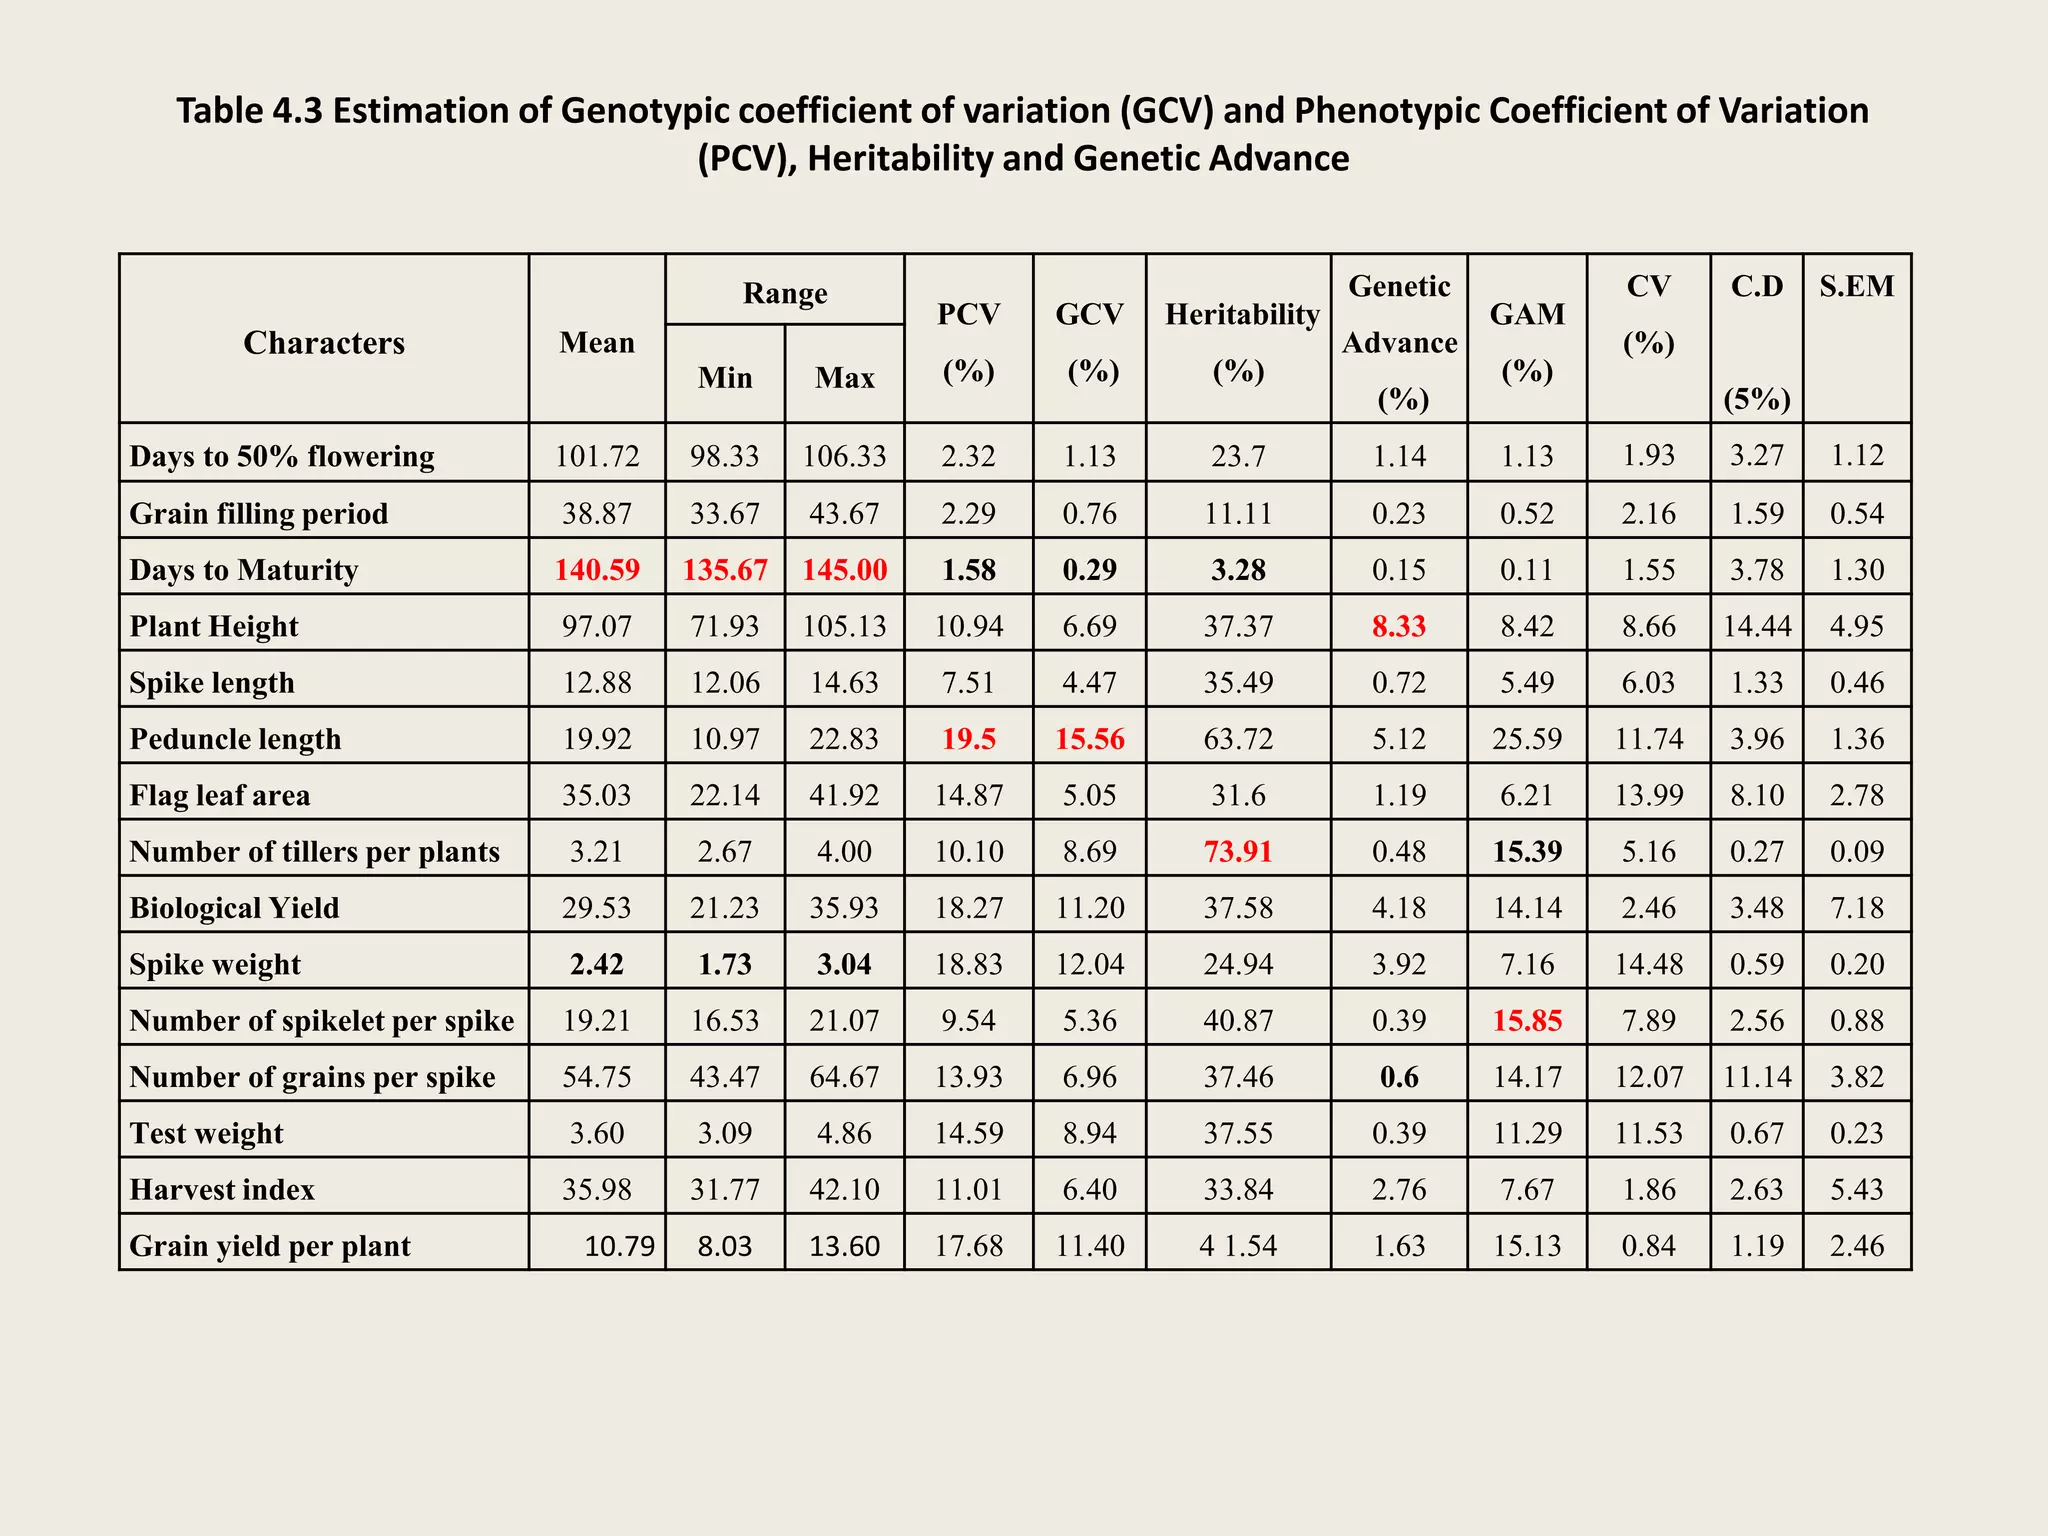
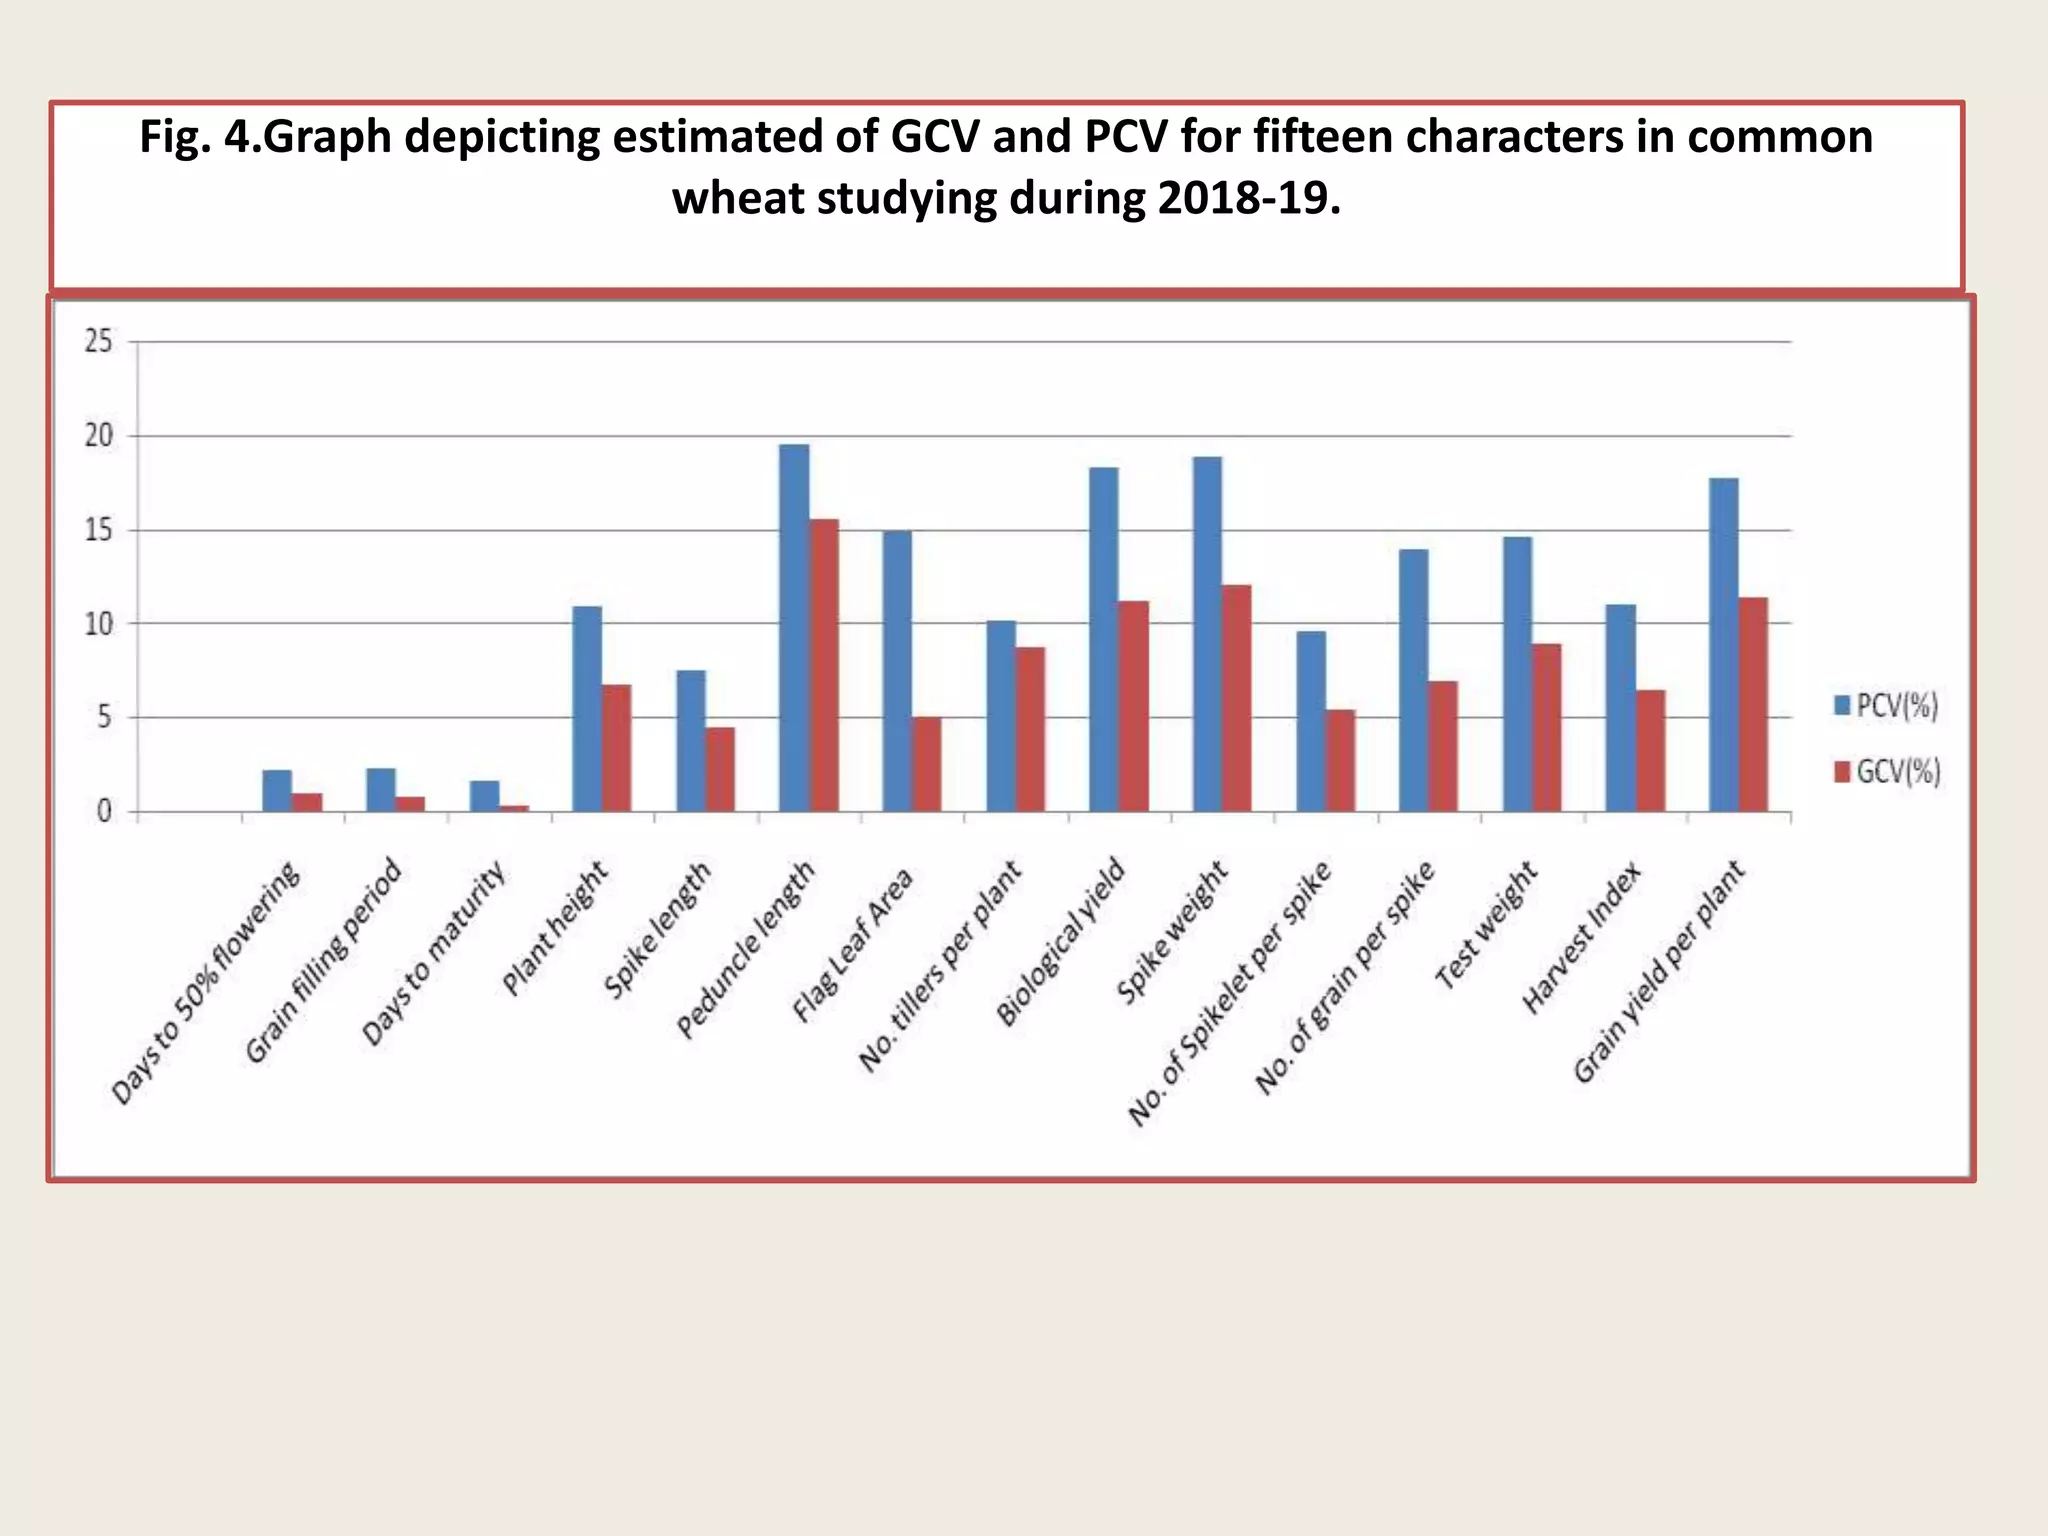
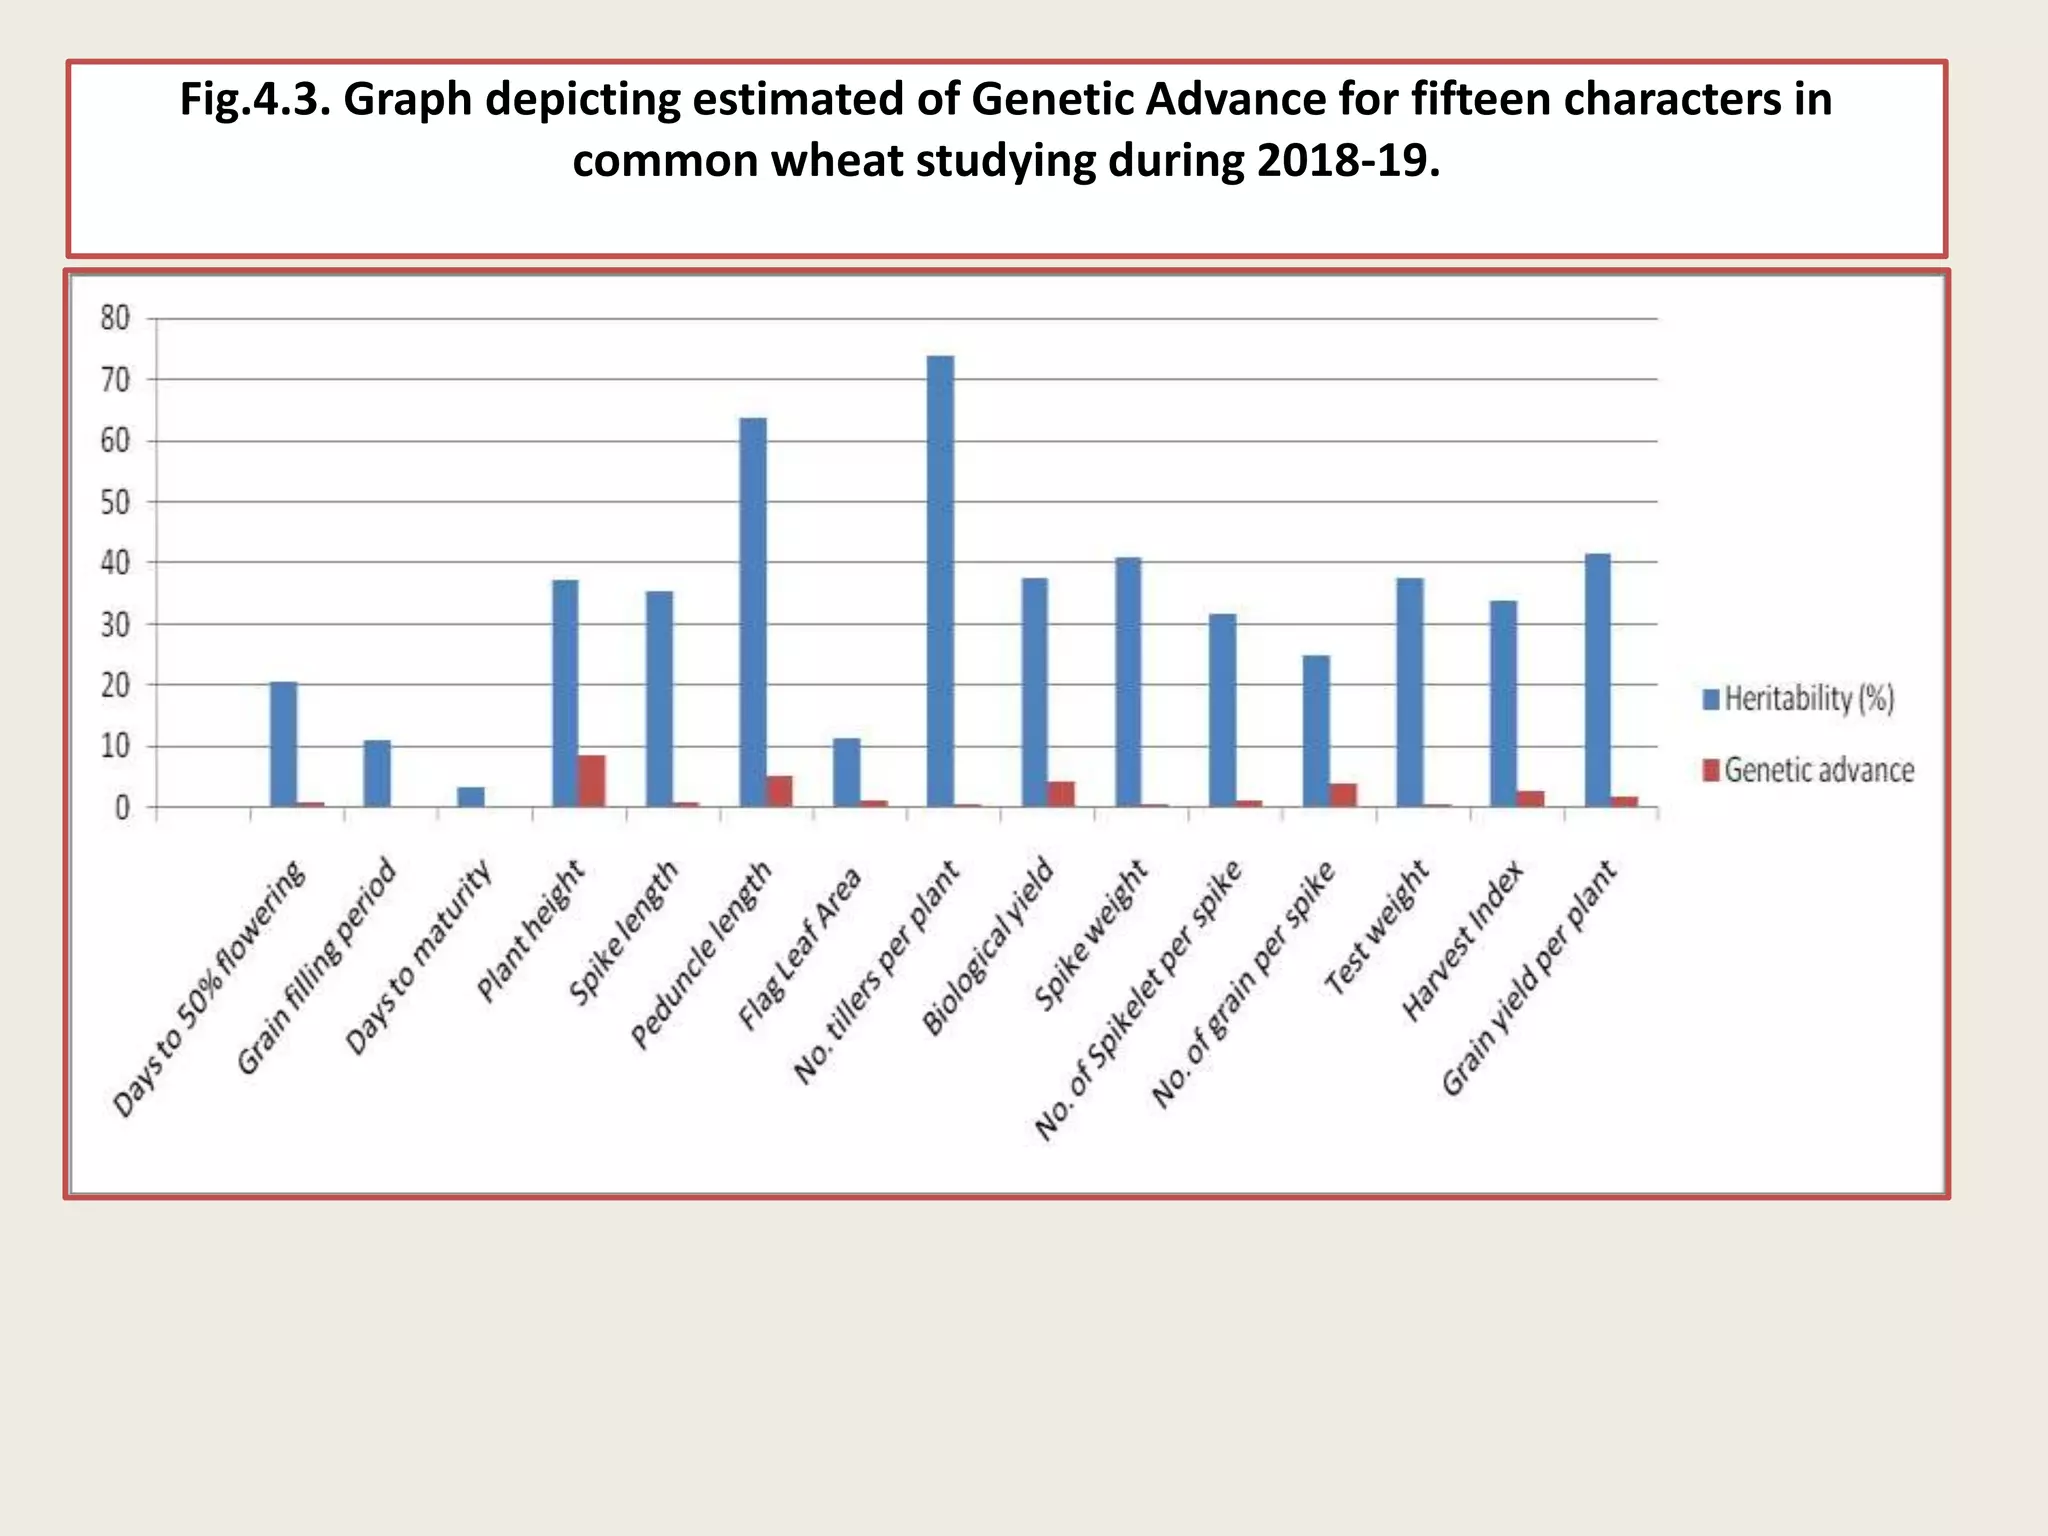
THESIS PRESENTATION
ON
STUDIES ON GENETIC VARIABILITY IN GERMPLASM OF
BREAD WHEAT
( Triticum aestivum L.)
DEPARTMENT OF AGRICULTURE
SCHOOL OF AGRICULTURE, FORESTRY AND FISHERIES
HIMGIRI ZEE UNIVERSITY
P.O. SHERPUR, CHAKRATA ROAD, DEHRADUN (UTTARAKHAND)-248197
PRESENTED BY
YANKEY BHUTIA
ENROLLMENT . NO : HZU0113000088
COURSE : M.Sc. Agriculture (Genetics and Plant Breeding )
2019
CONTENTS
• Introduction
• Objectives
• Materials and Methods
• Observation Recorded
• Statistical Analysis
• Results and Discussion
• Conclusion
• References
INTRODUCTION
• Wheat (Triticum aestivum . L ) is a self pollinating annual temperate crop
belonging to the cereal grass family Gramineae and is one of the most important
imperative staple food and feed crop in the world supporting approx. 35% of the
world population for the main consumption.
• It is the most widely grown crop and an essential component of the global food
security mosaic, providing one-fifth of the total calories for the world’s population.
• India is second largest producer of wheat in the world. The area, production, and
productivity of wheat in India in 2017-18 was 29.58 million ha, 99.7 million ton and
33.71 quintal per ha, respectively (ICAR I IWBR, 2018).
• It is grown in all the regions of the country and the states, namely, Uttar Pradesh,
Punjab, Haryana, Madhya Pradesh, Rajasthan, Bihar, Maharashtra, Gujarat, West
Bengal, Uttarkhand and Himachal Pradesh together contribute about 98% to the total
wheat production of the country and play an important role of supplying carbohydrate
and protein (Tewari et al., 2015).
• For a successful breeding programme , presence of the genetic variability plays a
vital role. With more diverse plants, greater chance to generate productive
recombinant and broad variability in segregating generation during Genetic
improvement Mohammadi and Rosanne, (2003).
• A successful selection depends upon the information on the genetic variability and
association of morpho-agronomic traits with grain yield.
• To identify that superior strains (treatments) it is important to have a knowledge of genetic
properties of a population which are phenotypically ,genetically expressible as a
qualitative and quantitative traits.
• The genotypic value that inherited (GCV) and the phenotypic value that ,all non-genetic
circumstances , non-heritable (PCV) that highly influence by the environment .
• The heritability is a good index of the transmission of characters from the parents to their
offspring (Falconer (1981).
• Genetic advance along with heritability helps in understanding the types of gene action
involved in expression of various polygenic traits to makes selection effective for the
breeders.
• The knowledge of genetic variability present in the population, heritability of
economically important characters is very important before initiating an effective
breeding program Begum (2015).
OBJECTIVES
On the basis of the multiple uses and economic importance of bread wheat,
“ Studies On Genetic Variability in Germplasm of Bread Wheat
( Triticum aestivum L.)” was conducted to identify genetic variability in eleven
genotypes of bread wheat with two checks (PBW-343 ; HD-3086) under fifteen
agronomical traits .
• To study the Genotypic coefficient of variation (GCV) and Phenotypic
coefficient of variation( PCV).
• To study the heritability and genetic advance for yield contributing characters.
MATERIALS AND METHODS
• The present investigation was carried out at Himgiri Zee University , Sherpur , Chakrata
Road , Dehradun ( Uttarkhand ) during Rabi season 2018-2019.
• The experimental material for present study comprised of an eleven genotypes and two
checks (PBW-343 ; HD-3086 ) and the Genotypes included are viz., HWG-1; HWG-2;
HWG-3; HWG-4;HWG-5;HWG-6;HWG-7; HWG-8; HWG-9; HWG-10 and HWG-11.
• Details of the experiments
• Design Randomized Block Design
• Total No. of Treatments 13
• No. of Replication 3
• Distance
Row to row distance was 23 cm
Plant to plant distance was 5 cm
• Individual plot size 23cm × 5cm
• Area of each Plot 1.15cm2
• Total length of experiment 16.2m
• Total width of experiment 15.47m
• Gross Area 281.88m2
• Net Area 14.97 m2
• Layout of the Experimental Field
RI RII RIII
HWG-3 HWG-2
CHECK-1(PBW-343) HWG-11 CHECK-2(HD-3086)
HWG-2 HWG-10 HWG-6
HWG-3 HWG-5 HWG-9
CHECK-2(HD-3086) 60cm HWG-6 60cm HWG-4
HWG-4 HWG-1 HWG-10
HWG-5 HWG-8 HWG-11
HWG-6 HWG-4 HWG-7
HWG-7 HWG-9 HWG-5
HWG-8 HWG-2 CHECK-1(PBW-343)
HWG-9 HWG-7 HWG-8
HWG-10 CHECK-1(PBW-343) HWG-3
HWG-11 CHECK-2(HD-3086) HWG-1
14.97m
16.2m
N
W
S
E
N
S
Sl.
No.
CHARACTERS
1 Days to 50 % flowering ( Days)
2 Grain Filling Period (Days)
3 Days to 50 % Maturity ( Days)
4 Plant Height (cm)
5 Spike Length (cm)
6 Peduncle Length (cm)
7 Flag Leaf Area ( cm 2)
8 Tillers per Plants (No.)
9 Biological Yield (g)
10 Spike Weight (g)
11 No. Spikelet per Spike (No.)
12 No. of Grain per Spike (No.)
13 Test Weight (g)
14 Harvest Index (%)
15 Grain Yield per Plant (g)
• OBSERVATION WERE RECORDED FOR CHARACTERS
RESULTS AND DISCUSSION
• The mean sum of squares due to genotype showed significant differences for the characters
Plant height (204.75*), Spike length(2.65*), Peduncle length (34.55*) ,Number of tillers per
plant (0.24*) ,Biological yield ( 50.94*) ,Number of spikelet per spike ( 5.49*) ,Number of
Grain per spike (87.18*) , Test weight (0.43*) ,Harvest index(26.28*) and Grain yield per
plant (6.66*) The experimental results were well supported by the similar findings of Singh
and Upadhyay (2013) , Shankrrao et al., (2010) , Kotal et al., (2010) and Tiwari et al.,
(2017).
• The mean value of genotypes for yield and its components are shown in Table 4.2 and found
highest for Days to maturity (146 days ) observed in HWG-8 followed by Days to 50%
Flowering showed by HWG-3, PBW-343, HWG-8, HWG-10 and by HWG-11.
• The results of estimated variability showed in revealed that High PCV with high GCV was
observed in Peduncle length (cm),Biological yield(g) and in Spike weight (g).
• The estimated Heritability and Genetic Advance was presented in table 4.3. The highest
heritability (>60%) was observed as numbers of tillers per plants (73.91 %) and in peduncle
length ( 63.72%).
• High heritability coupled with high Genetic advance in mean percentage was observed in
peduncle length and Number of tillers per plant.
Table4.1. Estimated Analysis of variance (ANOVA) of eleven genotypes with two
checks for fifteen characters.
Source of
variation d.f
Days to 50%
flowering
Grain
filling
period
Days to
maturity
Plant
Height
Spike
length
Peduncle
Length
Flag Leaf
Area
No. of
Tillers per
Plant
Replication 2 2.76 0.33 4.92 225.92 1.99 16.86 47.52 0.025
Treatment 12 6.69 1.22 5.54 204.75* 2.65* 34.55* 32.13 0.24*
Error 24 3.76 0.88 5.03 73.38 0.62 5.51 23.1 0.02
S.EM = 1.12 0.54 1.29 4.94 0.45 1.35 2.77 0.092
C.D at (5%) 3.27 1.58 3.78 14.43 1.32 3.95 8.1 0.26
C .V .(%) 1.92 2.15 1.55 8.65 6.02 11.74 13.98 5.16
Source of Variation d.f.
Biological
Yield Spike Weight
No. of
Spikelet per
spike
No. of Grain
per Spike
Test
Weight
Harvest
Index
Grain
yield per
Plant
Replication 2 53.08 0.39 4.34 106.13 0.49 4.92 6.58
Treatment 12 50.94* 0.38* 5.49* 87.18* 0.43* 26.28* 6.66*
Error 24 18.15 0.12 55.26 43.66 0.15 10.37 2.12
S.EM= 2.46 0.203 0.87 3.81 0.22 1.85 0.84
C.D at (5%) 7.18 0.592 2.55 11.13 0.66 5.42 2.45
C.V. (%) 14.43 14.48 7.88 12.07 11.53 8.95 13.51
C.D at 5% level of significance *
Table.4.2. Mean performance of Eleven genotypes with two checks forfifteen characters during
season 2018-19.
Sl. No.
Genotypes
Days
to 50%
flowering
(Days)
Grain filling
period
(Days)
Days
to
Maturity
(Days)
Plant
Height
(cm)
Spike
Length
(cm)
Peduncl
e
Length
(cm)
No. of spikelet
per spike
(No.)
No.of
tillers
Per plant
(No.)
1 HWG-1 99 44 143 73.93 12.55 11.57 21 3
2
PBW-343
( CHECK-1) 102 42 145 100.53 14.30 18.80 19 3
3 HWG-2 99 44 143 100.47 12.20 21.60 20 3
4 HWG-3 102 42 144 103.07 13.13 22.83 19 4
5
HD -3086
(CHECK-2) 99 44 143 100.77 12.87 21.47 18 3
6 HWG-4 100 44 144 106.07 13.53 22.14 17 3
7 HWG-5 100 44 144 104.73 14.27 22.07 19 3
8 HWG-6 98 44 142 104.47 13.57 21.00 20 3
9 HWG-7 98 44 142 98.60 12.39 22.47 18 3
10 HWG-8 102 44 146 93.27 12.03 21.30 20 3
11 HWG-9 101 44 145 102.17 12.53 14.60 18 3
12 HWG-10 102 44 146 101.60 13.60 21.77 19 3
13 HWG-11 102 44 146 97.00 13.17 18.27 16 3
Sl. No.
Genotypes
Flag Leaf
Area
( cm2 )
No . of
Grain per
spike (No.)
Spike
weight
(g)
Biological
yield
(g)
Test Weight
(g)
Harvest Index
(%)
Grain yield
per plant
(g)
1. HWG-1 33.26 60 2.73 28.72 3.28 32.40 10.73
2.
PBW-343
(CHECK-1) 37.37 54 2.57 28.00 3.29 31.77 10.23
3. HWG-2 37.26 64 2.46 32.20 3.54 42.10 12.20
4. HWG-3 32.28 54 1.88 23.80 3.69 36.43 10.00
5.
HD-3086
(CHECK-2) 32.48 51 2.53 26.60 3.39 32.63 10.13
6. HWG-4 31.68 52 2.36 28.00 3.60 39.40 11.47
7. HWG-5 32.44 53 2.52 34.30 3.82 35.27 10.47
8. HWG-6 33.63 60 2.80 32.90 3.87 38.83 12.67
9. HWG-7 32.90 57 2.29 30.80 3.76 36.17 11.57
10. HWG-8 28.81 50 2.18 28.70 3.28 34.03 9.33
11. HWG-9 37.62 56 3.04 37.80 2.99 36.97 13.60
12. HWG-10 41.04 51 2.48 28.70 3.50 36.37 9.80
13. HWG-11 35.92 43 1.73 24.50 2.47 35.33 8.03
Contd..!
Fig. 4.1 . Graph depicting estimated of mean ranges for fifteen characters in common
wheat studying during 2018-19
Table 4.3 Estimation of Genotypic coefficient of variation (GCV) and Phenotypic Coefficient of Variation
(PCV), Heritability and Genetic Advance
Characters Mean
Range
PCV
(%)
GCV
(%)
Heritability
(%)
Genetic
Advance
(%)
GAM
(%)
CV
(%)
C.D
(5%)
S.EM
Min Max
Days to 50% flowering 101.72 98.33 106.33 2.32 1.13 23.7 1.14 1.13 1.93 3.27 1.12
Grain filling period 38.87 33.67 43.67 2.29 0.76 11.11 0.23 0.52 2.16 1.59 0.54
Days to Maturity 140.59 135.67 145.00 1.58 0.29 3.28 0.15 0.11 1.55 3.78 1.30
Plant Height 97.07 71.93 105.13 10.94 6.69 37.37 8.33 8.42 8.66 14.44 4.95
Spike length 12.88 12.06 14.63 7.51 4.47 35.49 0.72 5.49 6.03 1.33 0.46
Peduncle length 19.92 10.97 22.83 19.5 15.56 63.72 5.12 25.59 11.74 3.96 1.36
Flag leaf area 35.03 22.14 41.92 14.87 5.05 31.6 1.19 6.21 13.99 8.10 2.78
Number of tillers per plants 3.21 2.67 4.00 10.10 8.69 73.91 0.48 15.39 5.16 0.27 0.09
Biological Yield 29.53 21.23 35.93 18.27 11.20 37.58 4.18 14.14 2.46 3.48 7.18
Spike weight 2.42 1.73 3.04 18.83 12.04 24.94 3.92 7.16 14.48 0.59 0.20
Number of spikelet per spike 19.21 16.53 21.07 9.54 5.36 40.87 0.39 15.85 7.89 2.56 0.88
Number of grains per spike 54.75 43.47 64.67 13.93 6.96 37.46 0.6 14.17 12.07 11.14 3.82
Test weight 3.60 3.09 4.86 14.59 8.94 37.55 0.39 11.29 11.53 0.67 0.23
Harvest index 35.98 31.77 42.10 11.01 6.40 33.84 2.76 7.67 1.86 2.63 5.43
Grain yield per plant 10.79 8.03 13.60 17.68 11.40 4 1.54 1.63 15.13 0.84 1.19 2.46
Fig. 4.Graph depicting estimated of GCV and PCV for fifteen characters in common
wheat studying during 2018-19.
Fig.4.3. Graph depicting estimated of Genetic Advance for fifteen characters in
common wheat studying during 2018-19.
SUMMARY AND CONCLUSION
• Genotype showed significant differences for the characters Plant height (204.75*), Spike
length(2.65*), Peduncle length (34.55*) ,Number of tillers per plant (0.24*), Biological yield
( 50.94*), Number of spikelet per spike ( 5.49*), Number of Grain per spike (87.18*), Test
weight (0.43*), Harvest index(26.28*) and Grain yield per plant (6.66*) which indicate that
the variation is existed in these characters within the treatments and between the treatments
so , selection for a genotypes through these characters results into a better improvement .
• The genotypes viz., HWG-3,HWG-8, HWG-10,HWG-1 and HWG-11 showed higher values
mean values for a different characters .
• The Grain yield was observed HWG-9(13.60g) followed by HWG-6(12.67g) and HWG-
2(12.20g) .
REFERENCES
• Abinasa Mohammed, Ayana Amsalu , Bultosa Geremew (2011). Genetic variability ,heritability and
trait associations in durum wheat ( Triticuma estivum L.) genotypes. African Journal of Agriculture
Research .6(17): 3972-3979.
• Ali Yousaf , Atta B.M., Akhter .J, Monneveux P ., Zahid L.(2008). Genetic variability ,Association and
Diversity studies in wheat (Triticum aestivum L.)Germplasm Pakistan Journal of Botany 40(5):2087-2097.
• Amin M.F., Hasan. M, Barma N.C.D, Rahman M.M, Hasan M.M (2015). Variability and heritability
analysis in spring wheat (Triticum aestivum L.,) genotypes Bangladesh J. Agriculture Research40(3): 435-
450.
• AryaM., Jaiswal. JP.(2014). Characterization of wheat ( Triticum aestivum.) Germplasm for yield and
yield attributing traits.IndianJournal of Plant Genetic Resources 27(2) 123-126
• Arya V.K., Singh Jogendra , Kumar L., Kumar Rajendra , Kumar Punit , Chand Pooran (2017).
Genetic Variability and diversity analysis for yield and and its components in wheat (Triticum aestivum
L.)Indian Journal of Agriculture Research, 51(2):129-134.
• Baranwal D.K., Mishra V .K., Vishwakarma M.K., YadavPunam S., Arun B., (2012). Studies on
genetic variability, correlation and path analysis for yield and yield contributing traits in wheat (Triticum
aestivum .L.)Plant archive Vol. 12 (1) 99-104
• Bhushan Bharat, Bharti .S., Ojha A., Pandey M., Gourav S.S., TyagiB.T., Singh G. (2009).Genetic
variability,correlation coefficient and path analysis of some quantitative traits in bread wheat. Journal of
Wheat Research5(11);21-26
• in bread wheat.Indian Journal of Agricultural Research 48(6):429-436.
• Choudhary RC, Sharma R and Kumar M. (2015). Genetic variability, heritability and genetic advance
in wheat under different normal and heat stressed environments. Electronic Journal of Plant Breeding
6(4):1082-1087.
• Degewlone . A, Dejene.T, Sharif, M.(2013). Genetic variability and traits association in bread wheat
(Triticum aestivum L.).International Research Journal of Agriculture Science1(2)121-129
• Desheva and Kyosev (2015).Genetic diversity assessment of common winter wheat (Triticum aestivum L.)
genotypes.Emirates Journal of Food and Agriculture 2015.27(3):283-290.
• Deoraj M.G., DahatD.V., Rajput H.J. and Wakale M.B.(2016).Studies on variability in wheat (Triticum
aestivum L.)International Research Journal of Multidisciplinary Studies 2(2)2454-8499
• Dutamo D., Alamerew S., Eticha F., Assefa E.,(2015).Genetic variability in Bread Wheat (Triticum aestivum
L.) germplasm for yield and yield component traits. Journal of Biology, Agriculture and Healthcare Vol.5,
No.17:140-147.
• Firouzian Ali (2003).Heritability and Genetic Advance of grin yield and its related traits in wheat. Pakistan
Journal of Biological Science 6(24): 2020-2023.
• Gupta S.K., Verma S.R., (2000). Variability, Heritability, Genetic advance under normal and rainfed
conditions in durum wheat. Indian Journal of Agriculture Research, 34 (2)122-125
• ICAR-IIWBR, (2018).Director’s Report of AICRP on Wheat and Barley Improvement Project 2017-18. Ed:
G. P. Singh, ICAR-Indian Institute of Wheat and Barley Research,Karnal, India. p.87.
• Naik V.R., Biradar S.S., Yadawad A., Desai S.A., Veeresha B.A.,(2015) Study of genetic variability
parameters in Bread wheat (Triticum aestivum ).Research Journal of Agricultural Science 6(1)123-125
• Nukasani V., Potdukhe N.R., Bharad Swati , Deshmukh S.,Shinde S.M.(2013)Genetic variability
,correlation and path analysis in wheat .J.Wheat Res.5(2): 48-51
• Patil Channappagouda , Koujalagi Deepak (2018) Genetic variability study in F2 population of
tetraploid dicoccum wheat crosses . Journal of Applied and Natural Science 10(2):773-778 .
• Rahman M.A., Kabir M.L., Hasanuzzaman.M., Rumi R.H.,Afrosa M.T. (2016).Study of variability in
bread wheat aestivum L . International journal of Agronomy and Agriculture Research (IJAAR) vol.5-
8.issn:2223-7054
• Rangare N.R., Krupakar A., Kumar Abhishica ,Singh Satyapal (2010) Character association and
component analysis in wheat ( Triticumaestivum L.,) Electronic Journal of Plant Breeding .1 (3) 231-238.
• Rajput Rahul Singh(2018).Correlation ,path analysis ,heritability and genetic advance for morphological
character on bread wheat (Triticum aestivumL.).Journal of Pharmacognosy and Phytochemistry .7(2).107-
112
• Rajshreeand Satish Kumar Singh (2018). Assessment of Genetic Diversity in Promising Bread Wheat
(Triticum aestivum L.) Genotypes.International Journal of Current Microbiology and Applied Sciences.
7(3): 676-684.
• Safi lutfullah , Singh Rajesh, Abraham Thomas (2017): Assessment of heritability and genetic
parameters in wheat ( Triticum aestivum L.) based on argonomic and morphological traits. Journal of
Pharmacognosy and Phytochemeistry 18-21
• Satesh C.G.,( 2016). Genetic studies on yield and Associate characters in wheat ( Triticum aestivum
L.).International Journal of Theoretical And Applied Sciences .8(2)36-39
• Singh .B and Upadhyay, P.K.,(2013) Genetic variability ,Correlation and Path analysis in wheat (Triticum
aesticum ),Indian Res.J..genet.and Biotech 7(1) 22-26
• Tewari, R., Jaiswal, J.P., Gangwar, R.P. and Singh, P.K. (2015). Genetic diversity analysis in exotic
germplasm accessions of wheat (Triticum aestivum L.) by cluster analysis. Electronic Journal of Plant
Breeding, 6(4): 1111-1117.
• Nukasani, V. Potdukhe, N.R. Bharad, Swati Deshmukh, Shradha and Asahinde S.M.(2013).Genetic
variability, Correlation and Path analysis in wheat.Journal of Wheat Research 5(2):48-51.
• Khashif ,M. and Khaliq , K(2004).Heritability, Correlation and Path coefficient analysis for some metric
traits in wheat. International Journal of Agriculture and Biology .6(1)138-142
• Kumar Vijay, Sharma P.K., Kumar H., Gupta V.(2014).Studies of variability and association of yield
with some Agro morphological characters
• Kyosev Bozhidar , Desheva Gergana (2015). Study on variability ,heritability genetic advance and
association amo ng characters in emmer wheat genotypes (Triticum dicoccon Schrank) Journal of
Biological Science and Biotechnology .221-228.
• Kumar Vinod , Lal G.M., Ruchi ,Upsdhyay Ashish. (2009). Genetic variability and Association of
Quantitative traits with Grain yield in bread wheat (Triticum aestivum L.)Asian Journal of Agricultural
Science 1(1)4-6.
• Kotalbangshi D., Das Arpita , Choudhury B.K.,(2010).Genetic variability and Association Characters in
wheat (Triticum aestivum L.)Asian Journal of Crop Science 2(3)155-160.
• Kumar Binod ,Singh C.M., Jaiswal Kundan Kumar.,(2013). Genetic variability ,Association and
diversity studies in bread wheat (Triticum aestivum L.) The Bioscan8(1)143-147.
• Kumar Bhishal (2016) . Study on variability , correlation and genetic divergence for grain yield and its
component in F3 population of wheat (Triticum aestivum L.)Jawaharlal Nehru Krishi Vishwa Vidylaya
,Jabalpur .M.P.2(4) 33-38
• Kumar vijay , Sharma P.K., Kumar Hitesh, Gupta Vikas (2014).Studies of variability and association of
yield with some agro-morphological characters in bread wheat(Triticum aestivum L.)Indian Journal of
Agriculture Research 48(6)429-436.
• Kumar Ajeet ,Kumar A., RathiVikas, Tomer K.P al Singh Variability(2017). Heritability and
Genetic advance analysis (Triticum aestivum L.) Genotypes .International Journal of current
Microbiology and Applied Sciences 6(8):2687-2691.
• Kumar Anuj , Gaurav S.S., Bahuguna Deepak K., Sharma P., Singh, Chand P.(2017). Analysis
of Variability,Heritability and Genetic Advance for yield and yield related trait in wheat (Triticum
aestivum L.) Genotypes.International Journal of Agricultural 7(4): 583-590.
• Kumar Navin, Shailesh Marker and Vijay Kumar (2014).Study of heritability and genetic advance
estimates in timely sown bread wheat(Triticum aestivum L.)Bioscience Discovery, 5(1)64-69.
• ( 20 17) Genetic analysis of yield components an physiological Characters under changing climate in
wheat .International Journal Of Current Microbiology and Applied Science .6(9) 3525-3530
• Ullah . k., khan S.J., Muhammed.T. , Muhhamad (2011). Genotypic and Phenotypic variability,
heritability an genetic diversity for yield components in bread wheat germplasm ( Triticum aestivum
L.) AFR. J. Agric. 6(23)5204-5207.
• Vir O., Sultan Sheikh M., ( 2013).Genetic variability and characters associations in the germplasm
of wheat (Triticum aestivum L.) under Rainfed conditions of Himalayas .International Journal Of
Agricultural Sciences ( 2013) 6(1) 222-226
• Zeeshan .M, Arshad ,W, Khan .M .I., Ali .S, Nawaz A ,and Tariq .M,(2014). Heritability , trait
association and path coefficient studies for some agronomic characters in synthetic elite lines of
wheat ( Triticum aestivum L.) under rainfed condition . J. Agric. And Allied .Sci 3(.4)236-276
•
THANK YOU !

Study of genetic variability in germplasm of common bread wheat

  • 1.
    THESIS PRESENTATION ON STUDIES ONGENETIC VARIABILITY IN GERMPLASM OF BREAD WHEAT ( Triticum aestivum L.) DEPARTMENT OF AGRICULTURE SCHOOL OF AGRICULTURE, FORESTRY AND FISHERIES HIMGIRI ZEE UNIVERSITY P.O. SHERPUR, CHAKRATA ROAD, DEHRADUN (UTTARAKHAND)-248197 PRESENTED BY YANKEY BHUTIA ENROLLMENT . NO : HZU0113000088 COURSE : M.Sc. Agriculture (Genetics and Plant Breeding ) 2019
  • 2.
    CONTENTS • Introduction • Objectives •Materials and Methods • Observation Recorded • Statistical Analysis • Results and Discussion • Conclusion • References
  • 3.
    INTRODUCTION • Wheat (Triticumaestivum . L ) is a self pollinating annual temperate crop belonging to the cereal grass family Gramineae and is one of the most important imperative staple food and feed crop in the world supporting approx. 35% of the world population for the main consumption. • It is the most widely grown crop and an essential component of the global food security mosaic, providing one-fifth of the total calories for the world’s population. • India is second largest producer of wheat in the world. The area, production, and productivity of wheat in India in 2017-18 was 29.58 million ha, 99.7 million ton and 33.71 quintal per ha, respectively (ICAR I IWBR, 2018). • It is grown in all the regions of the country and the states, namely, Uttar Pradesh, Punjab, Haryana, Madhya Pradesh, Rajasthan, Bihar, Maharashtra, Gujarat, West Bengal, Uttarkhand and Himachal Pradesh together contribute about 98% to the total wheat production of the country and play an important role of supplying carbohydrate and protein (Tewari et al., 2015). • For a successful breeding programme , presence of the genetic variability plays a vital role. With more diverse plants, greater chance to generate productive recombinant and broad variability in segregating generation during Genetic improvement Mohammadi and Rosanne, (2003).
  • 4.
    • A successfulselection depends upon the information on the genetic variability and association of morpho-agronomic traits with grain yield. • To identify that superior strains (treatments) it is important to have a knowledge of genetic properties of a population which are phenotypically ,genetically expressible as a qualitative and quantitative traits. • The genotypic value that inherited (GCV) and the phenotypic value that ,all non-genetic circumstances , non-heritable (PCV) that highly influence by the environment . • The heritability is a good index of the transmission of characters from the parents to their offspring (Falconer (1981). • Genetic advance along with heritability helps in understanding the types of gene action involved in expression of various polygenic traits to makes selection effective for the breeders. • The knowledge of genetic variability present in the population, heritability of economically important characters is very important before initiating an effective breeding program Begum (2015).
  • 5.
    OBJECTIVES On the basisof the multiple uses and economic importance of bread wheat, “ Studies On Genetic Variability in Germplasm of Bread Wheat ( Triticum aestivum L.)” was conducted to identify genetic variability in eleven genotypes of bread wheat with two checks (PBW-343 ; HD-3086) under fifteen agronomical traits . • To study the Genotypic coefficient of variation (GCV) and Phenotypic coefficient of variation( PCV). • To study the heritability and genetic advance for yield contributing characters.
  • 6.
    MATERIALS AND METHODS •The present investigation was carried out at Himgiri Zee University , Sherpur , Chakrata Road , Dehradun ( Uttarkhand ) during Rabi season 2018-2019. • The experimental material for present study comprised of an eleven genotypes and two checks (PBW-343 ; HD-3086 ) and the Genotypes included are viz., HWG-1; HWG-2; HWG-3; HWG-4;HWG-5;HWG-6;HWG-7; HWG-8; HWG-9; HWG-10 and HWG-11.
  • 7.
    • Details ofthe experiments • Design Randomized Block Design • Total No. of Treatments 13 • No. of Replication 3 • Distance Row to row distance was 23 cm Plant to plant distance was 5 cm • Individual plot size 23cm × 5cm • Area of each Plot 1.15cm2 • Total length of experiment 16.2m • Total width of experiment 15.47m • Gross Area 281.88m2 • Net Area 14.97 m2
  • 8.
    • Layout ofthe Experimental Field RI RII RIII HWG-3 HWG-2 CHECK-1(PBW-343) HWG-11 CHECK-2(HD-3086) HWG-2 HWG-10 HWG-6 HWG-3 HWG-5 HWG-9 CHECK-2(HD-3086) 60cm HWG-6 60cm HWG-4 HWG-4 HWG-1 HWG-10 HWG-5 HWG-8 HWG-11 HWG-6 HWG-4 HWG-7 HWG-7 HWG-9 HWG-5 HWG-8 HWG-2 CHECK-1(PBW-343) HWG-9 HWG-7 HWG-8 HWG-10 CHECK-1(PBW-343) HWG-3 HWG-11 CHECK-2(HD-3086) HWG-1 14.97m 16.2m N W S E N S
  • 9.
    Sl. No. CHARACTERS 1 Days to50 % flowering ( Days) 2 Grain Filling Period (Days) 3 Days to 50 % Maturity ( Days) 4 Plant Height (cm) 5 Spike Length (cm) 6 Peduncle Length (cm) 7 Flag Leaf Area ( cm 2) 8 Tillers per Plants (No.) 9 Biological Yield (g) 10 Spike Weight (g) 11 No. Spikelet per Spike (No.) 12 No. of Grain per Spike (No.) 13 Test Weight (g) 14 Harvest Index (%) 15 Grain Yield per Plant (g) • OBSERVATION WERE RECORDED FOR CHARACTERS
  • 10.
    RESULTS AND DISCUSSION •The mean sum of squares due to genotype showed significant differences for the characters Plant height (204.75*), Spike length(2.65*), Peduncle length (34.55*) ,Number of tillers per plant (0.24*) ,Biological yield ( 50.94*) ,Number of spikelet per spike ( 5.49*) ,Number of Grain per spike (87.18*) , Test weight (0.43*) ,Harvest index(26.28*) and Grain yield per plant (6.66*) The experimental results were well supported by the similar findings of Singh and Upadhyay (2013) , Shankrrao et al., (2010) , Kotal et al., (2010) and Tiwari et al., (2017). • The mean value of genotypes for yield and its components are shown in Table 4.2 and found highest for Days to maturity (146 days ) observed in HWG-8 followed by Days to 50% Flowering showed by HWG-3, PBW-343, HWG-8, HWG-10 and by HWG-11. • The results of estimated variability showed in revealed that High PCV with high GCV was observed in Peduncle length (cm),Biological yield(g) and in Spike weight (g).
  • 11.
    • The estimatedHeritability and Genetic Advance was presented in table 4.3. The highest heritability (>60%) was observed as numbers of tillers per plants (73.91 %) and in peduncle length ( 63.72%). • High heritability coupled with high Genetic advance in mean percentage was observed in peduncle length and Number of tillers per plant.
  • 12.
    Table4.1. Estimated Analysisof variance (ANOVA) of eleven genotypes with two checks for fifteen characters. Source of variation d.f Days to 50% flowering Grain filling period Days to maturity Plant Height Spike length Peduncle Length Flag Leaf Area No. of Tillers per Plant Replication 2 2.76 0.33 4.92 225.92 1.99 16.86 47.52 0.025 Treatment 12 6.69 1.22 5.54 204.75* 2.65* 34.55* 32.13 0.24* Error 24 3.76 0.88 5.03 73.38 0.62 5.51 23.1 0.02 S.EM = 1.12 0.54 1.29 4.94 0.45 1.35 2.77 0.092 C.D at (5%) 3.27 1.58 3.78 14.43 1.32 3.95 8.1 0.26 C .V .(%) 1.92 2.15 1.55 8.65 6.02 11.74 13.98 5.16 Source of Variation d.f. Biological Yield Spike Weight No. of Spikelet per spike No. of Grain per Spike Test Weight Harvest Index Grain yield per Plant Replication 2 53.08 0.39 4.34 106.13 0.49 4.92 6.58 Treatment 12 50.94* 0.38* 5.49* 87.18* 0.43* 26.28* 6.66* Error 24 18.15 0.12 55.26 43.66 0.15 10.37 2.12 S.EM= 2.46 0.203 0.87 3.81 0.22 1.85 0.84 C.D at (5%) 7.18 0.592 2.55 11.13 0.66 5.42 2.45 C.V. (%) 14.43 14.48 7.88 12.07 11.53 8.95 13.51 C.D at 5% level of significance *
  • 13.
    Table.4.2. Mean performanceof Eleven genotypes with two checks forfifteen characters during season 2018-19. Sl. No. Genotypes Days to 50% flowering (Days) Grain filling period (Days) Days to Maturity (Days) Plant Height (cm) Spike Length (cm) Peduncl e Length (cm) No. of spikelet per spike (No.) No.of tillers Per plant (No.) 1 HWG-1 99 44 143 73.93 12.55 11.57 21 3 2 PBW-343 ( CHECK-1) 102 42 145 100.53 14.30 18.80 19 3 3 HWG-2 99 44 143 100.47 12.20 21.60 20 3 4 HWG-3 102 42 144 103.07 13.13 22.83 19 4 5 HD -3086 (CHECK-2) 99 44 143 100.77 12.87 21.47 18 3 6 HWG-4 100 44 144 106.07 13.53 22.14 17 3 7 HWG-5 100 44 144 104.73 14.27 22.07 19 3 8 HWG-6 98 44 142 104.47 13.57 21.00 20 3 9 HWG-7 98 44 142 98.60 12.39 22.47 18 3 10 HWG-8 102 44 146 93.27 12.03 21.30 20 3 11 HWG-9 101 44 145 102.17 12.53 14.60 18 3 12 HWG-10 102 44 146 101.60 13.60 21.77 19 3 13 HWG-11 102 44 146 97.00 13.17 18.27 16 3
  • 14.
    Sl. No. Genotypes Flag Leaf Area (cm2 ) No . of Grain per spike (No.) Spike weight (g) Biological yield (g) Test Weight (g) Harvest Index (%) Grain yield per plant (g) 1. HWG-1 33.26 60 2.73 28.72 3.28 32.40 10.73 2. PBW-343 (CHECK-1) 37.37 54 2.57 28.00 3.29 31.77 10.23 3. HWG-2 37.26 64 2.46 32.20 3.54 42.10 12.20 4. HWG-3 32.28 54 1.88 23.80 3.69 36.43 10.00 5. HD-3086 (CHECK-2) 32.48 51 2.53 26.60 3.39 32.63 10.13 6. HWG-4 31.68 52 2.36 28.00 3.60 39.40 11.47 7. HWG-5 32.44 53 2.52 34.30 3.82 35.27 10.47 8. HWG-6 33.63 60 2.80 32.90 3.87 38.83 12.67 9. HWG-7 32.90 57 2.29 30.80 3.76 36.17 11.57 10. HWG-8 28.81 50 2.18 28.70 3.28 34.03 9.33 11. HWG-9 37.62 56 3.04 37.80 2.99 36.97 13.60 12. HWG-10 41.04 51 2.48 28.70 3.50 36.37 9.80 13. HWG-11 35.92 43 1.73 24.50 2.47 35.33 8.03 Contd..!
  • 15.
    Fig. 4.1 .Graph depicting estimated of mean ranges for fifteen characters in common wheat studying during 2018-19
  • 16.
    Table 4.3 Estimationof Genotypic coefficient of variation (GCV) and Phenotypic Coefficient of Variation (PCV), Heritability and Genetic Advance Characters Mean Range PCV (%) GCV (%) Heritability (%) Genetic Advance (%) GAM (%) CV (%) C.D (5%) S.EM Min Max Days to 50% flowering 101.72 98.33 106.33 2.32 1.13 23.7 1.14 1.13 1.93 3.27 1.12 Grain filling period 38.87 33.67 43.67 2.29 0.76 11.11 0.23 0.52 2.16 1.59 0.54 Days to Maturity 140.59 135.67 145.00 1.58 0.29 3.28 0.15 0.11 1.55 3.78 1.30 Plant Height 97.07 71.93 105.13 10.94 6.69 37.37 8.33 8.42 8.66 14.44 4.95 Spike length 12.88 12.06 14.63 7.51 4.47 35.49 0.72 5.49 6.03 1.33 0.46 Peduncle length 19.92 10.97 22.83 19.5 15.56 63.72 5.12 25.59 11.74 3.96 1.36 Flag leaf area 35.03 22.14 41.92 14.87 5.05 31.6 1.19 6.21 13.99 8.10 2.78 Number of tillers per plants 3.21 2.67 4.00 10.10 8.69 73.91 0.48 15.39 5.16 0.27 0.09 Biological Yield 29.53 21.23 35.93 18.27 11.20 37.58 4.18 14.14 2.46 3.48 7.18 Spike weight 2.42 1.73 3.04 18.83 12.04 24.94 3.92 7.16 14.48 0.59 0.20 Number of spikelet per spike 19.21 16.53 21.07 9.54 5.36 40.87 0.39 15.85 7.89 2.56 0.88 Number of grains per spike 54.75 43.47 64.67 13.93 6.96 37.46 0.6 14.17 12.07 11.14 3.82 Test weight 3.60 3.09 4.86 14.59 8.94 37.55 0.39 11.29 11.53 0.67 0.23 Harvest index 35.98 31.77 42.10 11.01 6.40 33.84 2.76 7.67 1.86 2.63 5.43 Grain yield per plant 10.79 8.03 13.60 17.68 11.40 4 1.54 1.63 15.13 0.84 1.19 2.46
  • 17.
    Fig. 4.Graph depictingestimated of GCV and PCV for fifteen characters in common wheat studying during 2018-19.
  • 18.
    Fig.4.3. Graph depictingestimated of Genetic Advance for fifteen characters in common wheat studying during 2018-19.
  • 19.
    SUMMARY AND CONCLUSION •Genotype showed significant differences for the characters Plant height (204.75*), Spike length(2.65*), Peduncle length (34.55*) ,Number of tillers per plant (0.24*), Biological yield ( 50.94*), Number of spikelet per spike ( 5.49*), Number of Grain per spike (87.18*), Test weight (0.43*), Harvest index(26.28*) and Grain yield per plant (6.66*) which indicate that the variation is existed in these characters within the treatments and between the treatments so , selection for a genotypes through these characters results into a better improvement . • The genotypes viz., HWG-3,HWG-8, HWG-10,HWG-1 and HWG-11 showed higher values mean values for a different characters . • The Grain yield was observed HWG-9(13.60g) followed by HWG-6(12.67g) and HWG- 2(12.20g) .
  • 20.
    REFERENCES • Abinasa Mohammed,Ayana Amsalu , Bultosa Geremew (2011). Genetic variability ,heritability and trait associations in durum wheat ( Triticuma estivum L.) genotypes. African Journal of Agriculture Research .6(17): 3972-3979. • Ali Yousaf , Atta B.M., Akhter .J, Monneveux P ., Zahid L.(2008). Genetic variability ,Association and Diversity studies in wheat (Triticum aestivum L.)Germplasm Pakistan Journal of Botany 40(5):2087-2097. • Amin M.F., Hasan. M, Barma N.C.D, Rahman M.M, Hasan M.M (2015). Variability and heritability analysis in spring wheat (Triticum aestivum L.,) genotypes Bangladesh J. Agriculture Research40(3): 435- 450. • AryaM., Jaiswal. JP.(2014). Characterization of wheat ( Triticum aestivum.) Germplasm for yield and yield attributing traits.IndianJournal of Plant Genetic Resources 27(2) 123-126 • Arya V.K., Singh Jogendra , Kumar L., Kumar Rajendra , Kumar Punit , Chand Pooran (2017). Genetic Variability and diversity analysis for yield and and its components in wheat (Triticum aestivum L.)Indian Journal of Agriculture Research, 51(2):129-134. • Baranwal D.K., Mishra V .K., Vishwakarma M.K., YadavPunam S., Arun B., (2012). Studies on genetic variability, correlation and path analysis for yield and yield contributing traits in wheat (Triticum aestivum .L.)Plant archive Vol. 12 (1) 99-104 • Bhushan Bharat, Bharti .S., Ojha A., Pandey M., Gourav S.S., TyagiB.T., Singh G. (2009).Genetic variability,correlation coefficient and path analysis of some quantitative traits in bread wheat. Journal of Wheat Research5(11);21-26 • in bread wheat.Indian Journal of Agricultural Research 48(6):429-436.
  • 21.
    • Choudhary RC,Sharma R and Kumar M. (2015). Genetic variability, heritability and genetic advance in wheat under different normal and heat stressed environments. Electronic Journal of Plant Breeding 6(4):1082-1087. • Degewlone . A, Dejene.T, Sharif, M.(2013). Genetic variability and traits association in bread wheat (Triticum aestivum L.).International Research Journal of Agriculture Science1(2)121-129 • Desheva and Kyosev (2015).Genetic diversity assessment of common winter wheat (Triticum aestivum L.) genotypes.Emirates Journal of Food and Agriculture 2015.27(3):283-290. • Deoraj M.G., DahatD.V., Rajput H.J. and Wakale M.B.(2016).Studies on variability in wheat (Triticum aestivum L.)International Research Journal of Multidisciplinary Studies 2(2)2454-8499 • Dutamo D., Alamerew S., Eticha F., Assefa E.,(2015).Genetic variability in Bread Wheat (Triticum aestivum L.) germplasm for yield and yield component traits. Journal of Biology, Agriculture and Healthcare Vol.5, No.17:140-147. • Firouzian Ali (2003).Heritability and Genetic Advance of grin yield and its related traits in wheat. Pakistan Journal of Biological Science 6(24): 2020-2023. • Gupta S.K., Verma S.R., (2000). Variability, Heritability, Genetic advance under normal and rainfed conditions in durum wheat. Indian Journal of Agriculture Research, 34 (2)122-125 • ICAR-IIWBR, (2018).Director’s Report of AICRP on Wheat and Barley Improvement Project 2017-18. Ed: G. P. Singh, ICAR-Indian Institute of Wheat and Barley Research,Karnal, India. p.87. • Naik V.R., Biradar S.S., Yadawad A., Desai S.A., Veeresha B.A.,(2015) Study of genetic variability parameters in Bread wheat (Triticum aestivum ).Research Journal of Agricultural Science 6(1)123-125 • Nukasani V., Potdukhe N.R., Bharad Swati , Deshmukh S.,Shinde S.M.(2013)Genetic variability ,correlation and path analysis in wheat .J.Wheat Res.5(2): 48-51
  • 22.
    • Patil Channappagouda, Koujalagi Deepak (2018) Genetic variability study in F2 population of tetraploid dicoccum wheat crosses . Journal of Applied and Natural Science 10(2):773-778 . • Rahman M.A., Kabir M.L., Hasanuzzaman.M., Rumi R.H.,Afrosa M.T. (2016).Study of variability in bread wheat aestivum L . International journal of Agronomy and Agriculture Research (IJAAR) vol.5- 8.issn:2223-7054 • Rangare N.R., Krupakar A., Kumar Abhishica ,Singh Satyapal (2010) Character association and component analysis in wheat ( Triticumaestivum L.,) Electronic Journal of Plant Breeding .1 (3) 231-238. • Rajput Rahul Singh(2018).Correlation ,path analysis ,heritability and genetic advance for morphological character on bread wheat (Triticum aestivumL.).Journal of Pharmacognosy and Phytochemistry .7(2).107- 112 • Rajshreeand Satish Kumar Singh (2018). Assessment of Genetic Diversity in Promising Bread Wheat (Triticum aestivum L.) Genotypes.International Journal of Current Microbiology and Applied Sciences. 7(3): 676-684. • Safi lutfullah , Singh Rajesh, Abraham Thomas (2017): Assessment of heritability and genetic parameters in wheat ( Triticum aestivum L.) based on argonomic and morphological traits. Journal of Pharmacognosy and Phytochemeistry 18-21 • Satesh C.G.,( 2016). Genetic studies on yield and Associate characters in wheat ( Triticum aestivum L.).International Journal of Theoretical And Applied Sciences .8(2)36-39 • Singh .B and Upadhyay, P.K.,(2013) Genetic variability ,Correlation and Path analysis in wheat (Triticum aesticum ),Indian Res.J..genet.and Biotech 7(1) 22-26 • Tewari, R., Jaiswal, J.P., Gangwar, R.P. and Singh, P.K. (2015). Genetic diversity analysis in exotic germplasm accessions of wheat (Triticum aestivum L.) by cluster analysis. Electronic Journal of Plant Breeding, 6(4): 1111-1117.
  • 23.
    • Nukasani, V.Potdukhe, N.R. Bharad, Swati Deshmukh, Shradha and Asahinde S.M.(2013).Genetic variability, Correlation and Path analysis in wheat.Journal of Wheat Research 5(2):48-51. • Khashif ,M. and Khaliq , K(2004).Heritability, Correlation and Path coefficient analysis for some metric traits in wheat. International Journal of Agriculture and Biology .6(1)138-142 • Kumar Vijay, Sharma P.K., Kumar H., Gupta V.(2014).Studies of variability and association of yield with some Agro morphological characters • Kyosev Bozhidar , Desheva Gergana (2015). Study on variability ,heritability genetic advance and association amo ng characters in emmer wheat genotypes (Triticum dicoccon Schrank) Journal of Biological Science and Biotechnology .221-228. • Kumar Vinod , Lal G.M., Ruchi ,Upsdhyay Ashish. (2009). Genetic variability and Association of Quantitative traits with Grain yield in bread wheat (Triticum aestivum L.)Asian Journal of Agricultural Science 1(1)4-6. • Kotalbangshi D., Das Arpita , Choudhury B.K.,(2010).Genetic variability and Association Characters in wheat (Triticum aestivum L.)Asian Journal of Crop Science 2(3)155-160. • Kumar Binod ,Singh C.M., Jaiswal Kundan Kumar.,(2013). Genetic variability ,Association and diversity studies in bread wheat (Triticum aestivum L.) The Bioscan8(1)143-147. • Kumar Bhishal (2016) . Study on variability , correlation and genetic divergence for grain yield and its component in F3 population of wheat (Triticum aestivum L.)Jawaharlal Nehru Krishi Vishwa Vidylaya ,Jabalpur .M.P.2(4) 33-38 • Kumar vijay , Sharma P.K., Kumar Hitesh, Gupta Vikas (2014).Studies of variability and association of yield with some agro-morphological characters in bread wheat(Triticum aestivum L.)Indian Journal of Agriculture Research 48(6)429-436.
  • 24.
    • Kumar Ajeet,Kumar A., RathiVikas, Tomer K.P al Singh Variability(2017). Heritability and Genetic advance analysis (Triticum aestivum L.) Genotypes .International Journal of current Microbiology and Applied Sciences 6(8):2687-2691. • Kumar Anuj , Gaurav S.S., Bahuguna Deepak K., Sharma P., Singh, Chand P.(2017). Analysis of Variability,Heritability and Genetic Advance for yield and yield related trait in wheat (Triticum aestivum L.) Genotypes.International Journal of Agricultural 7(4): 583-590. • Kumar Navin, Shailesh Marker and Vijay Kumar (2014).Study of heritability and genetic advance estimates in timely sown bread wheat(Triticum aestivum L.)Bioscience Discovery, 5(1)64-69. • ( 20 17) Genetic analysis of yield components an physiological Characters under changing climate in wheat .International Journal Of Current Microbiology and Applied Science .6(9) 3525-3530 • Ullah . k., khan S.J., Muhammed.T. , Muhhamad (2011). Genotypic and Phenotypic variability, heritability an genetic diversity for yield components in bread wheat germplasm ( Triticum aestivum L.) AFR. J. Agric. 6(23)5204-5207. • Vir O., Sultan Sheikh M., ( 2013).Genetic variability and characters associations in the germplasm of wheat (Triticum aestivum L.) under Rainfed conditions of Himalayas .International Journal Of Agricultural Sciences ( 2013) 6(1) 222-226 • Zeeshan .M, Arshad ,W, Khan .M .I., Ali .S, Nawaz A ,and Tariq .M,(2014). Heritability , trait association and path coefficient studies for some agronomic characters in synthetic elite lines of wheat ( Triticum aestivum L.) under rainfed condition . J. Agric. And Allied .Sci 3(.4)236-276 •
  • 25.