This document discusses key concepts related to dissolution and diffusion of drugs. It defines dissolution as the process where a solid substance solubilizes in a solvent, with the rate determined by factors like agitation and pH. Diffusion is defined as the passive movement of molecules from high to low concentration regions. Fick's first and second laws of diffusion relate the diffusion rate to the concentration gradient. The document also discusses concepts like steady state, permeability, time lag, and factors affecting diffusion and dissolution rates like size, shape, temperature and solubility.
Presented by Aakash N S, M Pharm I Year, covering foundational concepts relevant to pharmaceutics.
Explains consolidation in materials and kinetic models for drug release including various particulate models.
Definition and mechanisms of diffusion, focusing on solute movement from high to low concentration.
Fick’s First and Second Laws detailing solute flux, concentration gradients, time lag, and factors affecting diffusion.
Discusses steady state conditions, concentration equilibrium, and experimental setup for diffusion studies.
Defines permeability coefficients and describes the burst effect in controlled drug release formulations.
Examines factors such as size, shape, temperature, charge, and lipid solubility that influence diffusion.
Defines dissolution and presents Noyes and Whitney dissolution rate equation and its significance.
Discusses various factors that affect dissolution including agitation, pH, surface tension, and temperature.
Introduction to pharmacokinetics, studying drug absorption, distribution, metabolism, and elimination.
Details key parameters such as absorption (bioavailability), distribution, and elimination metrics.
Explains bioavailability and different absorption rates characterizing their impacts on drug therapy.
Definitions of drug clearance, elimination rate constants, and half-life significance in pharmacokinetics.
Describes peak plasma concentration metrics, time to peak concentration, and their relevance in efficacy.
Introduces AUC as a critical measure of drug exposure and highlights methods for its calculation.
Focuses on Heckel plot for analyzing compressibility and mechanical properties of tablet formulations.
Describes a study on paracetamol tablet formulation analyzing compressibility with natural binders.
Introduces Korsmeyer-Peppas model to analyze drug release profiles from polymeric systems.
Explains similarity (f2) and difference (f1) factors for comparing dissolution profiles of drug forms.
Overview of significance tests including hypothesis, P-value, and their interpretation in drug research.
Analysis of variance (ANOVA) detailing its applications, types, and significance in pharmaceutical studies.
Describes Chi-square's application in frequencies and various t-tests for comparing mean values.List of key references and resources for deeper understanding of topics discussed throughout the presentation.
Presented by;
Aakash NS
M Pharm I Year
Department of Pharmaceutics
College of Pharmacy,
Madras Medical College.
1
MYPHARMAGUIDE.COM
www.DuloMix.com
2.
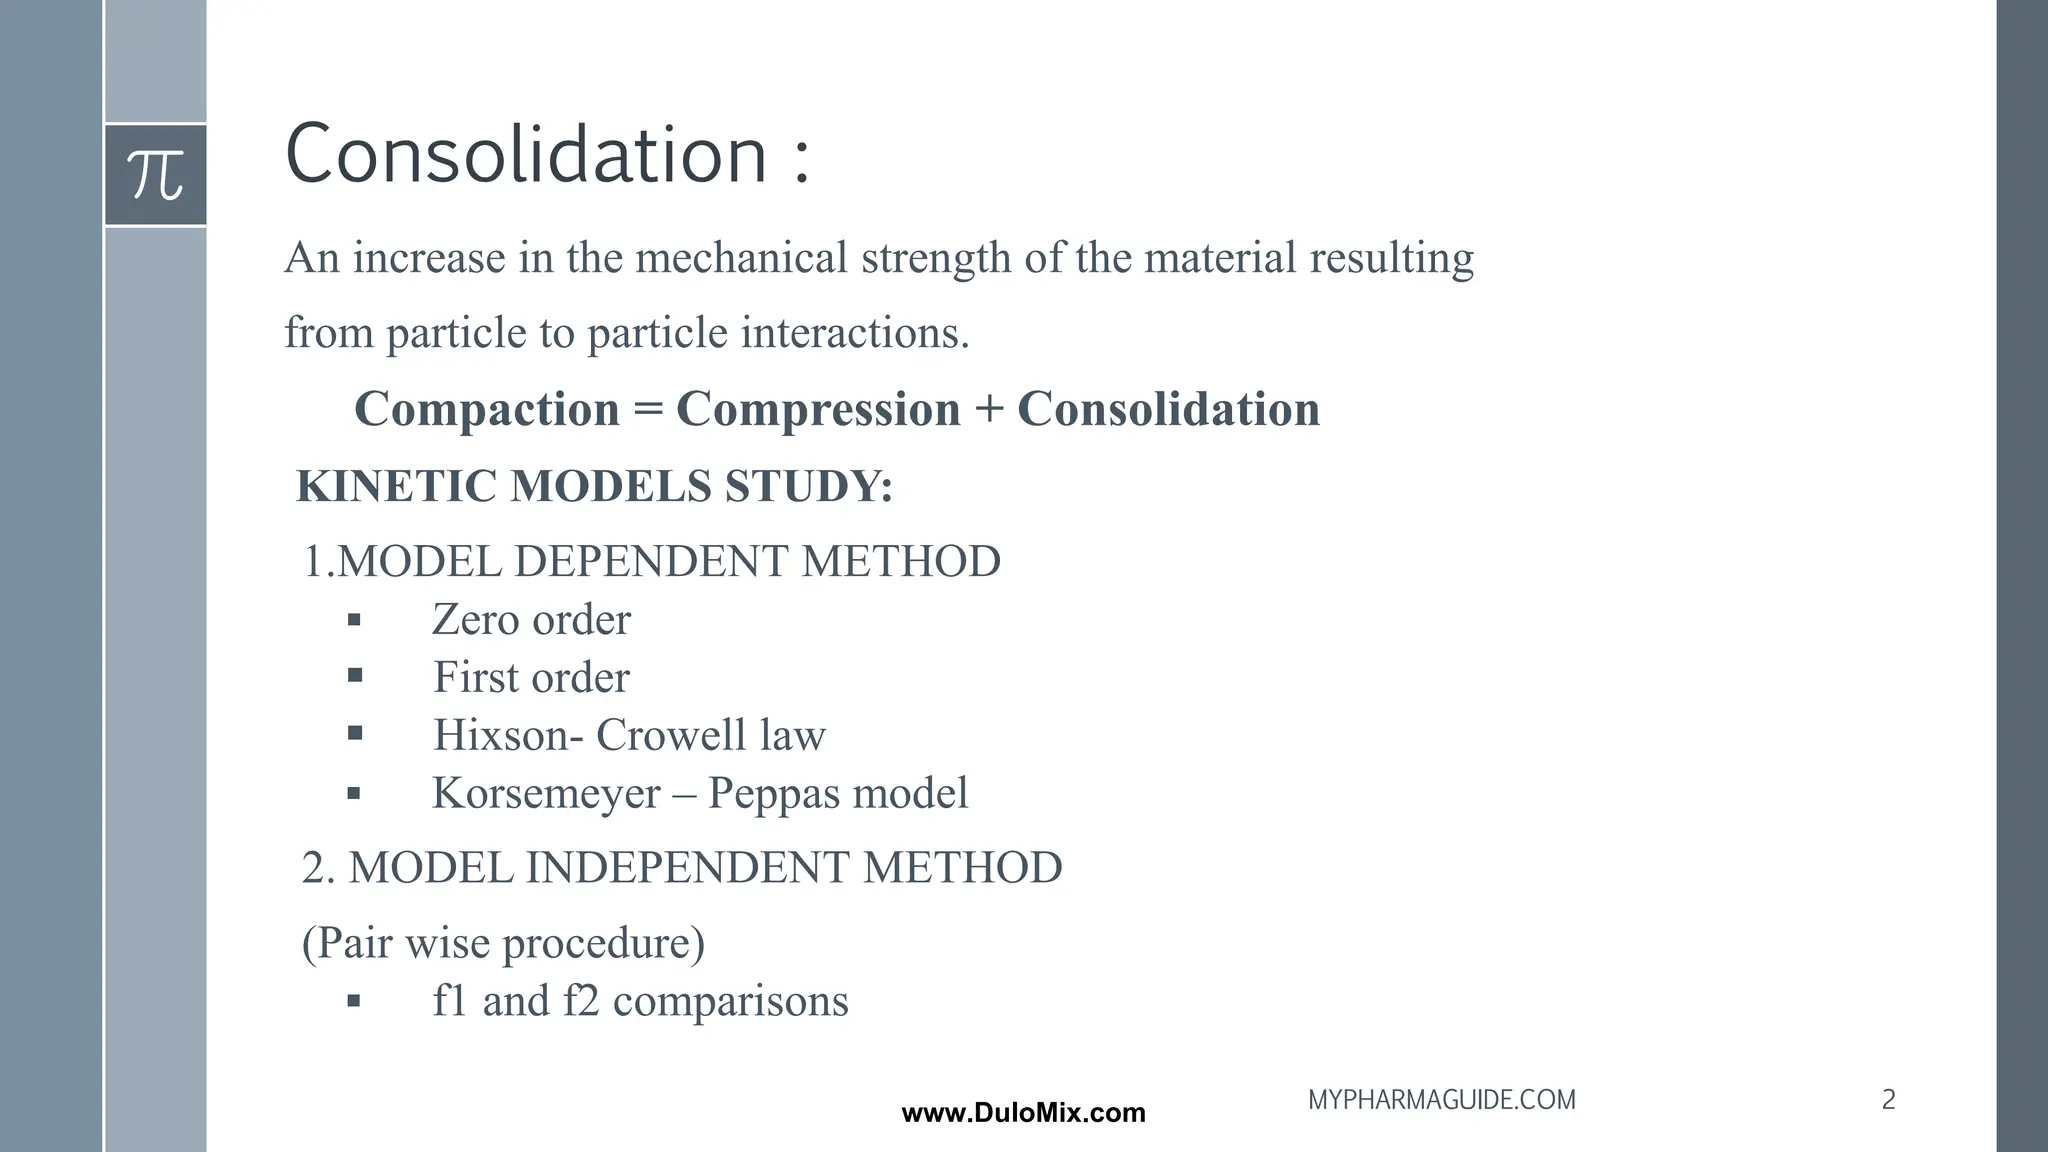
Consolidation :
An increasein the mechanical strength of the material resulting
from particle to particle interactions.
Compaction = Compression + Consolidation
KINETIC MODELS STUDY:
1.MODEL DEPENDENT METHOD
▪ Zero order
▪ First order
▪ Hixson- Crowell law
▪ Korsemeyer – Peppas model
2. MODEL INDEPENDENT METHOD
(Pair wise procedure)
▪ f1 and f2 comparisons
2
MYPHARMAGUIDE.COM
www.DuloMix.com
3.
DIFFUSION
Diffusion is aprocess of migration of solute molecules from a
region of high concentration to a region of low concentration
and is brought about by random molecular motion.
The passage of solute molecules through a barrier may occur by
▪ Simple molecular diffusion (permeation) or
▪ By movement through pores and channels
3
MYPHARMAGUIDE.COM
www.DuloMix.com
4.
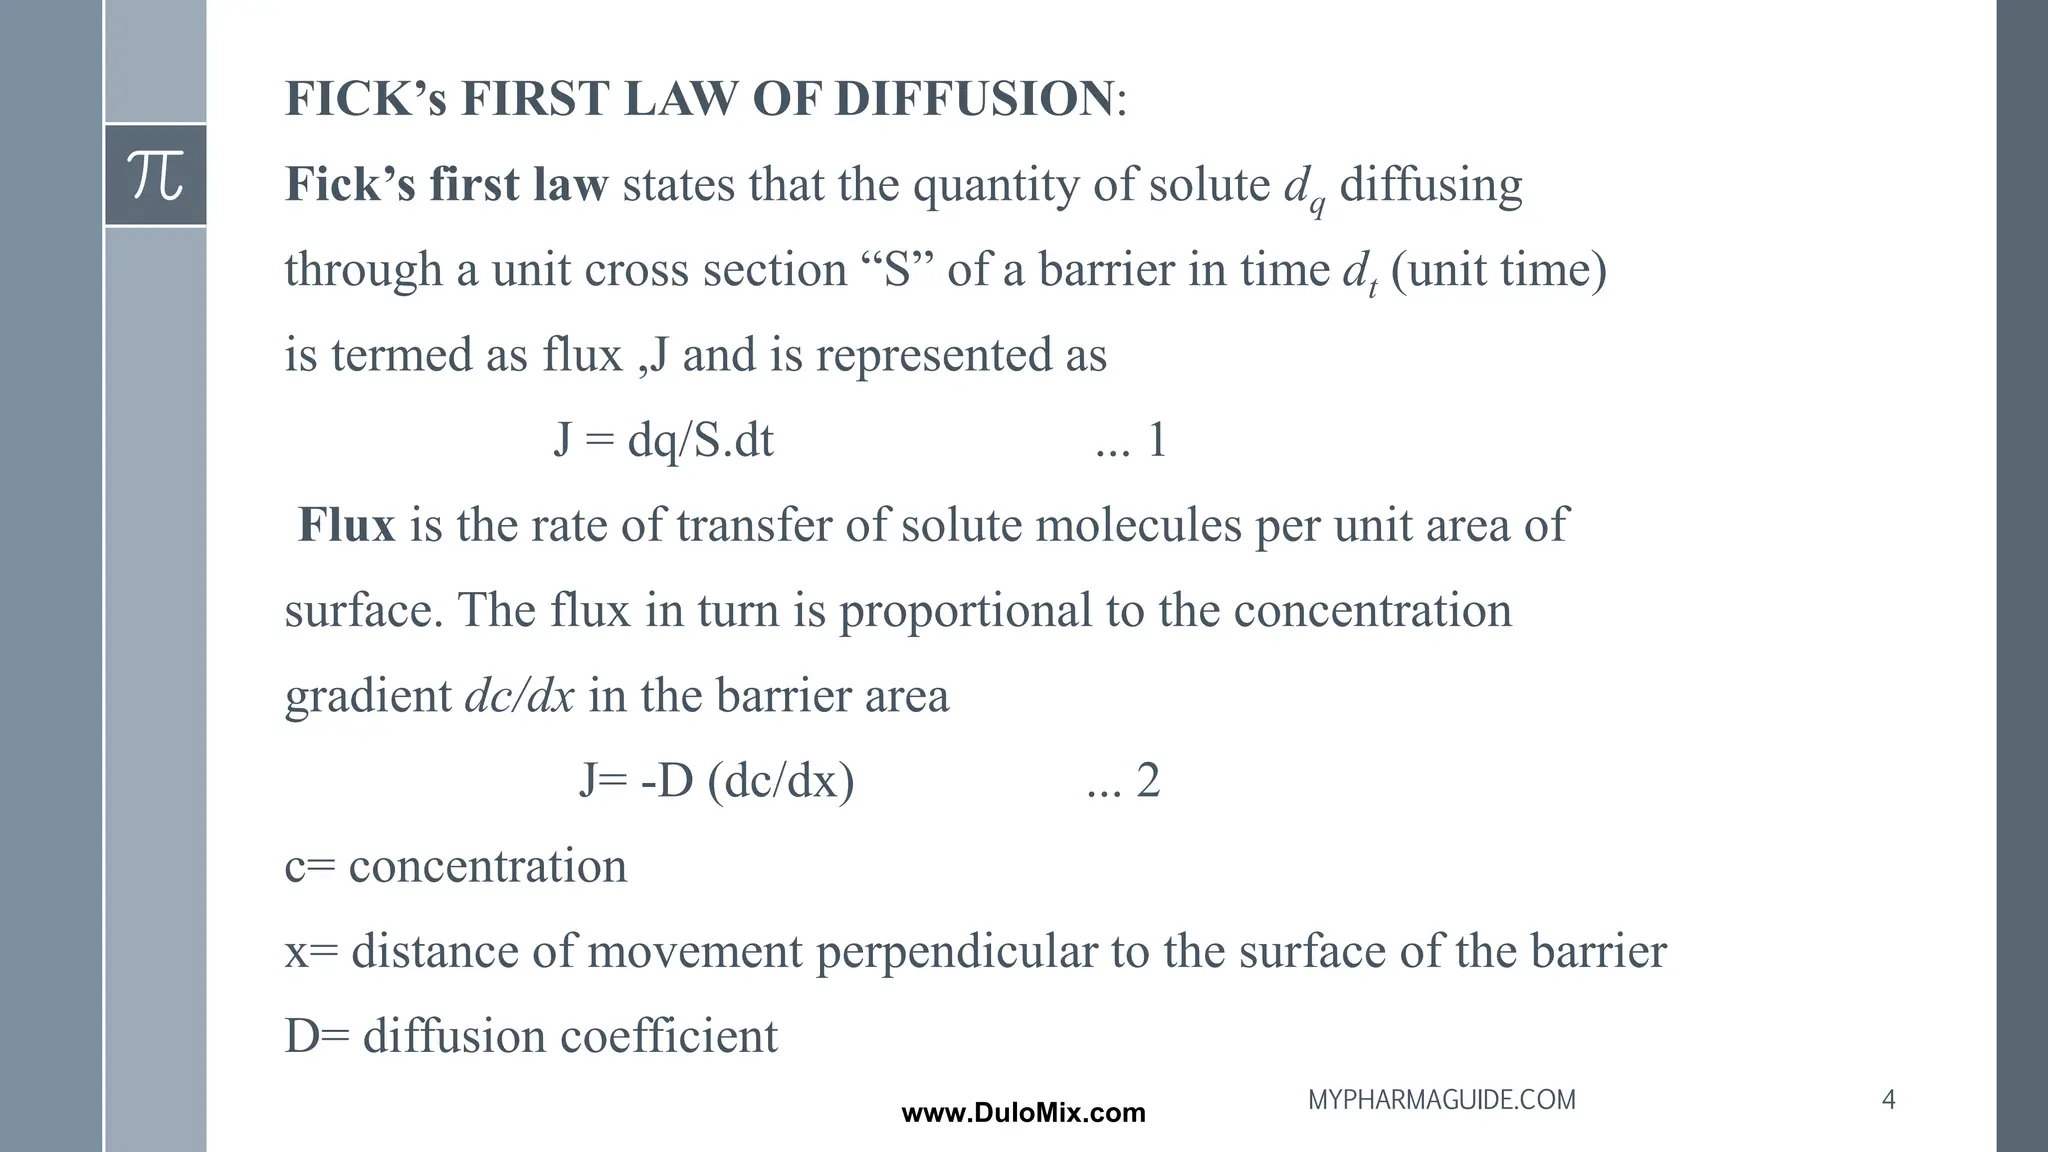
FICK’s FIRST LAWOF DIFFUSION:
Fick’s first law states that the quantity of solute dq diffusing
through a unit cross section “S” of a barrier in time dt (unit time)
is termed as flux ,J and is represented as
J = dq/S.dt ... 1
Flux is the rate of transfer of solute molecules per unit area of
surface. The flux in turn is proportional to the concentration
gradient dc/dx in the barrier area
J= -D (dc/dx) ... 2
c= concentration
x= distance of movement perpendicular to the surface of the barrier
D= diffusion coefficient
4
MYPHARMAGUIDE.COM
www.DuloMix.com
5.
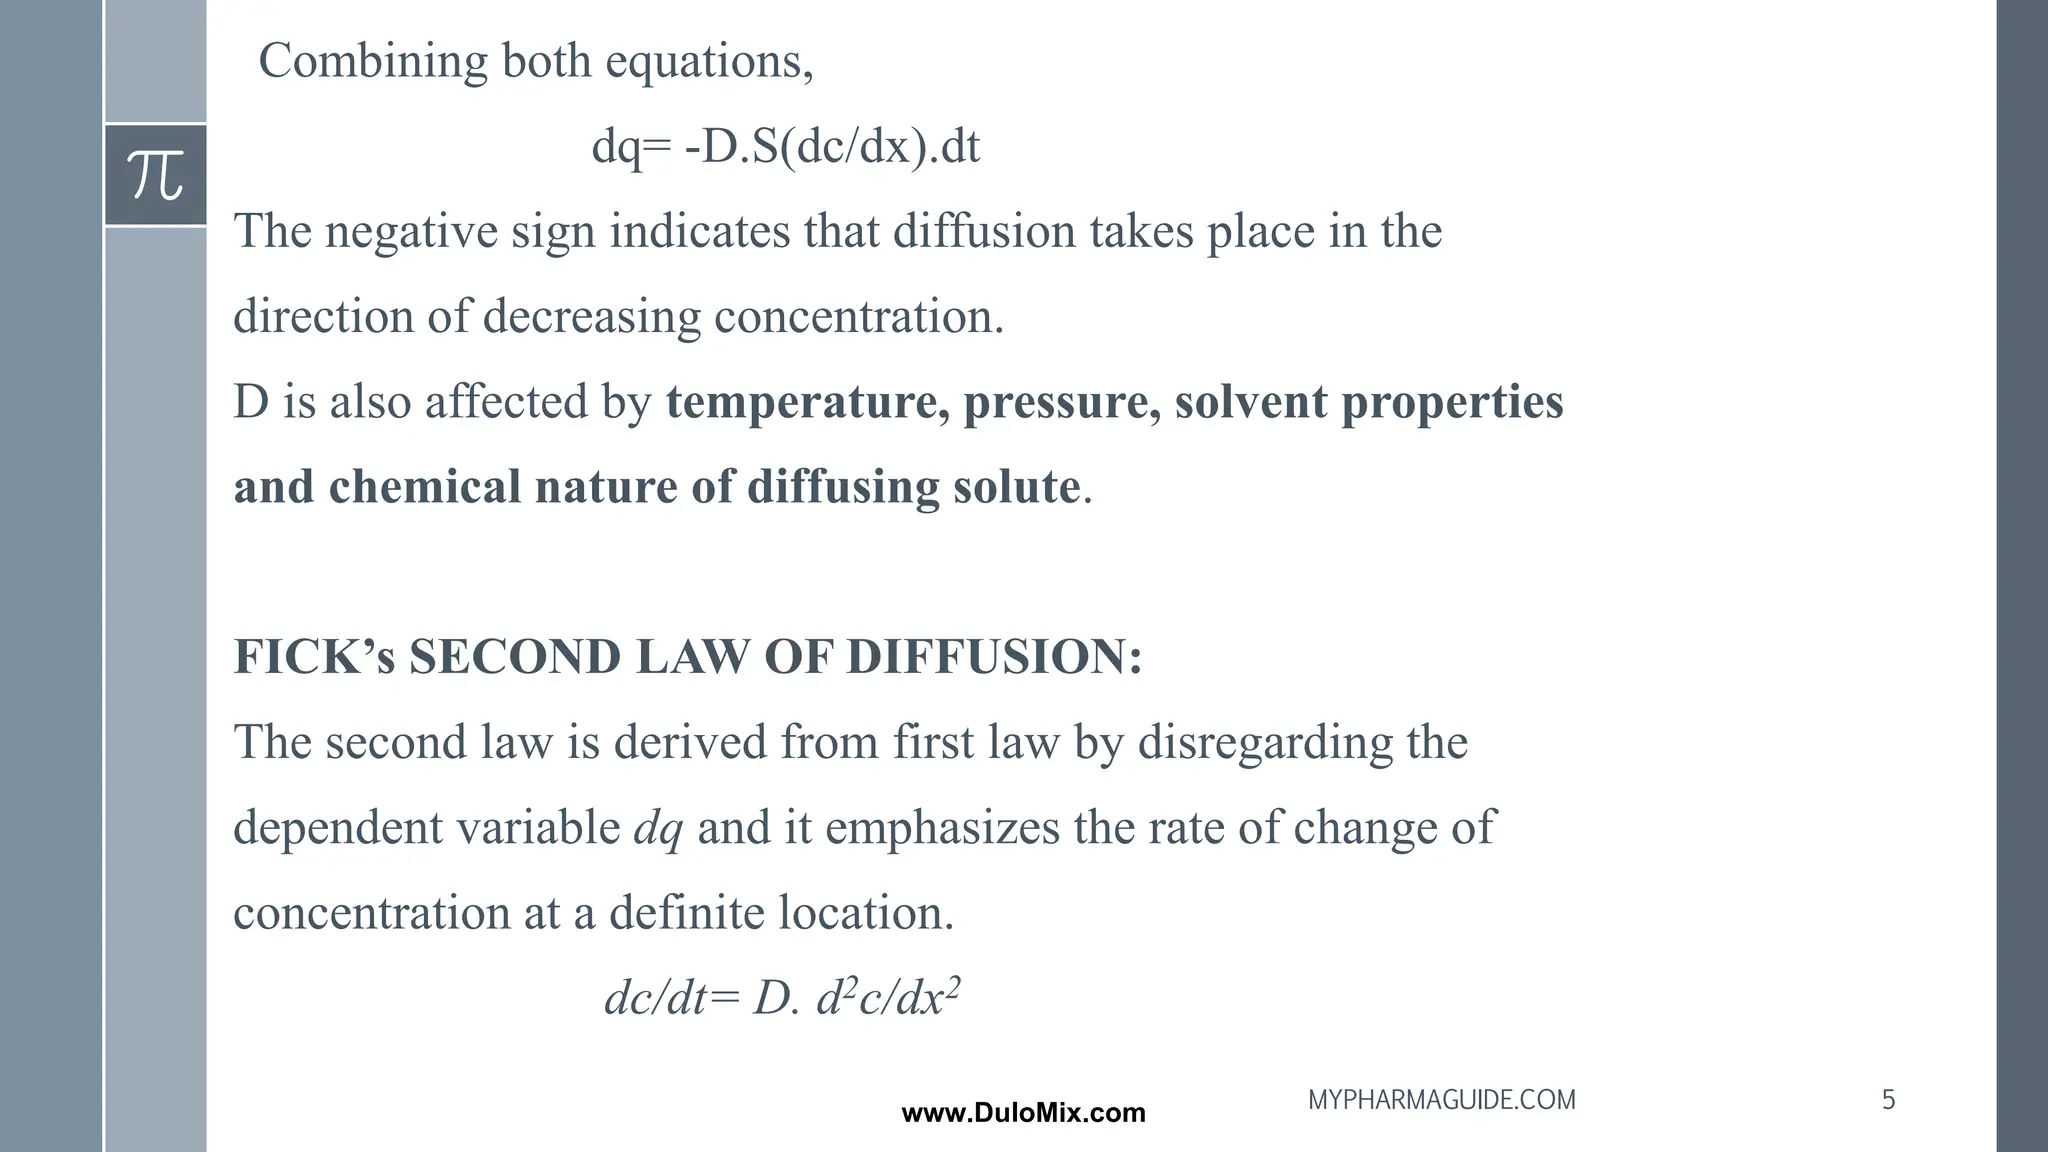
Combining both equations,
dq=-D.S(dc/dx).dt
The negative sign indicates that diffusion takes place in the
direction of decreasing concentration.
D is also affected by temperature, pressure, solvent properties
and chemical nature of diffusing solute.
FICK’s SECOND LAW OF DIFFUSION:
The second law is derived from first law by disregarding the
dependent variable dq and it emphasizes the rate of change of
concentration at a definite location.
dc/dt= D. d2c/dx2
5
MYPHARMAGUIDE.COM
www.DuloMix.com
6.
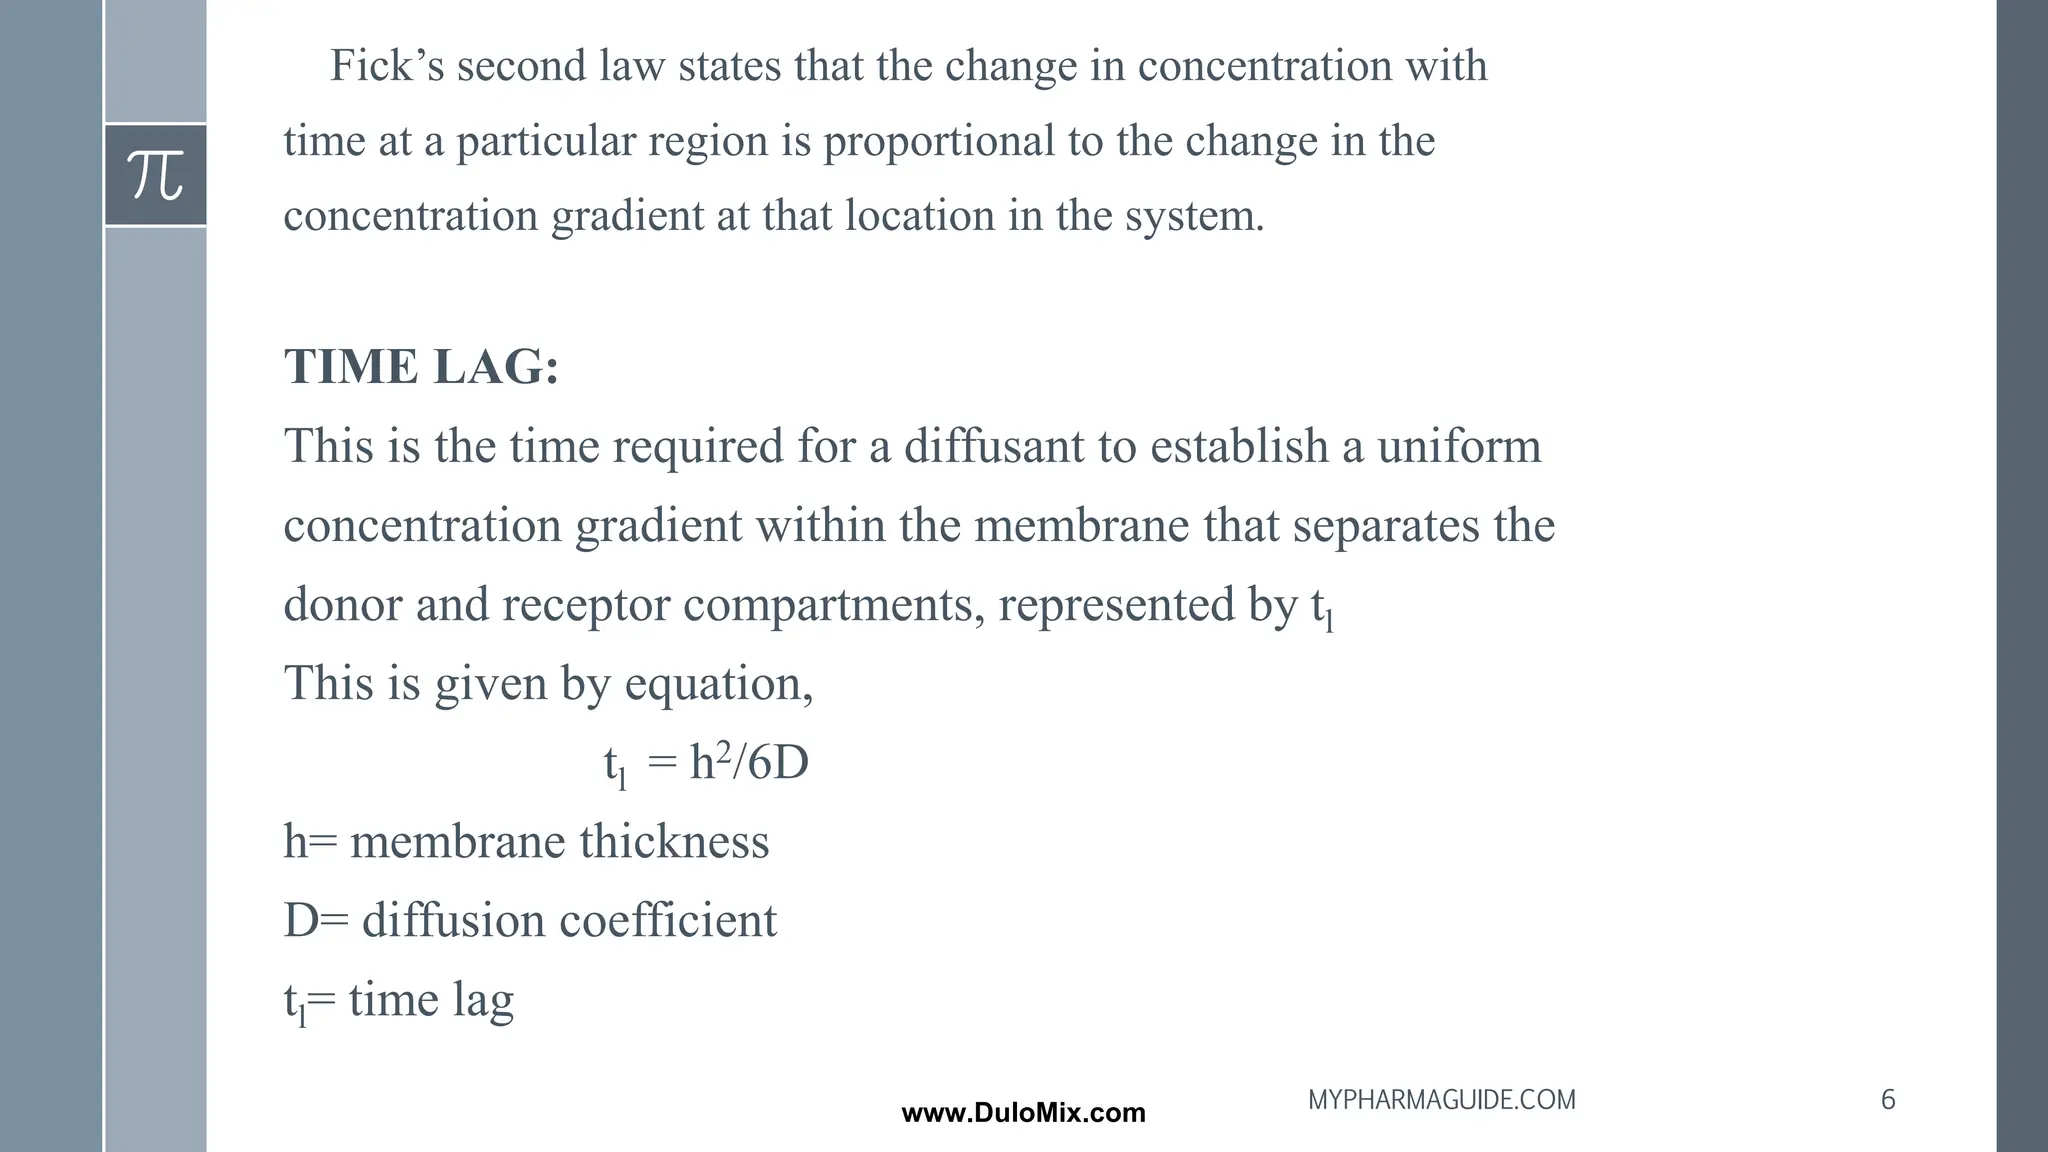
Fick’s second lawstates that the change in concentration with
time at a particular region is proportional to the change in the
concentration gradient at that location in the system.
TIME LAG:
This is the time required for a diffusant to establish a uniform
concentration gradient within the membrane that separates the
donor and receptor compartments, represented by tl
This is given by equation,
tl = h2/6D
h= membrane thickness
D= diffusion coefficient
tl= time lag
6
MYPHARMAGUIDE.COM
www.DuloMix.com
7.
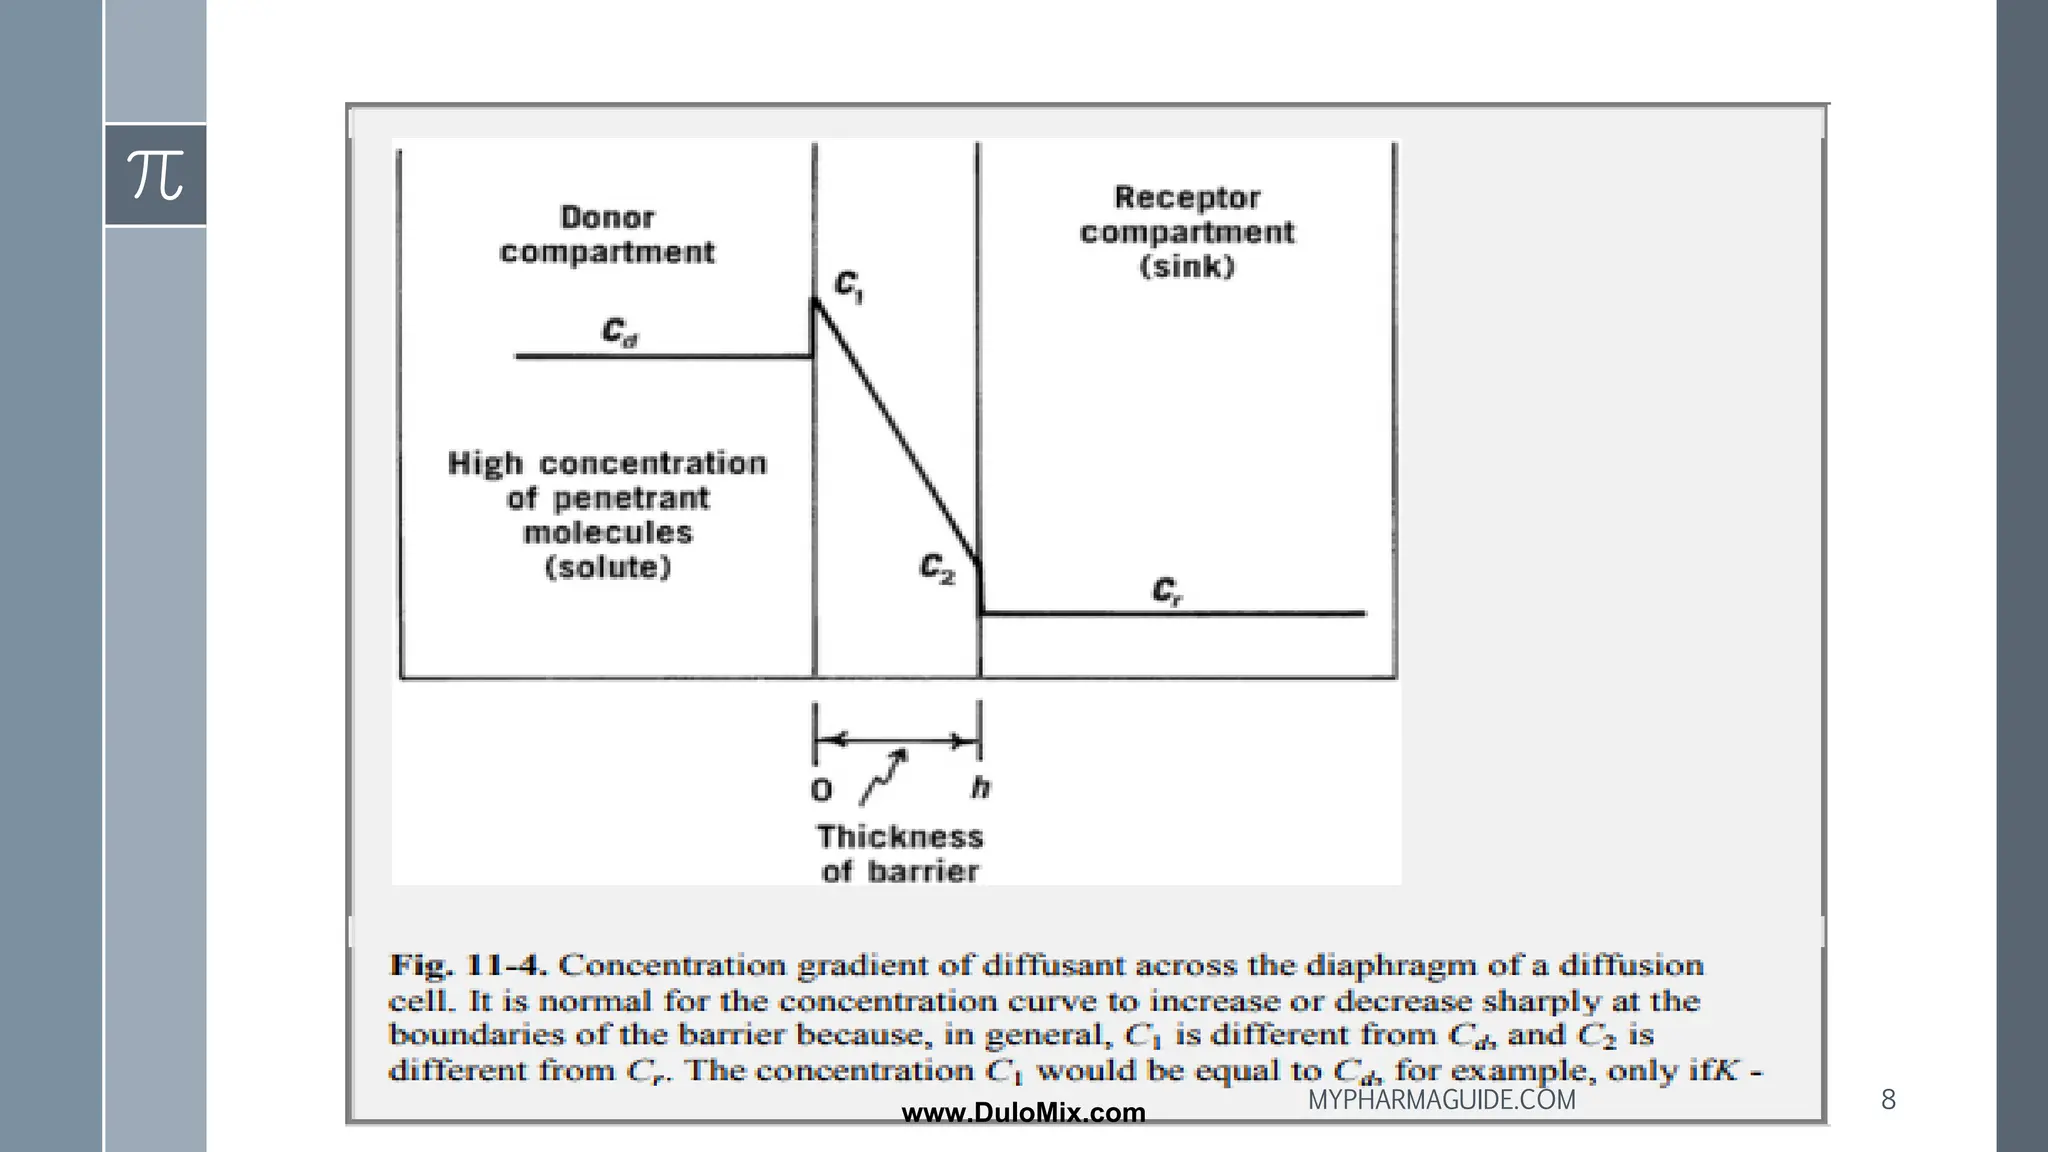
Steady State
› .Consider the diffusant originally dissolved in a solvent in the left-hand
compartment of the chamber shown in Figure.
› Solvent alone is placed on the right-hand side of the barrier, and the solute
or penetrant diffuses through the central barrier from solution to solvent side
(donor to receptor compartment).
› In diffusion experiments, the solution in the receptor compartment is
constantly removed and replaced with fresh solvent to keep the
concentration at a low level. This is referred to as ―sink conditions,‖ the left
compartment being the source and the right compartment the sink.
7
MYPHARMAGUIDE.COM
www.DuloMix.com
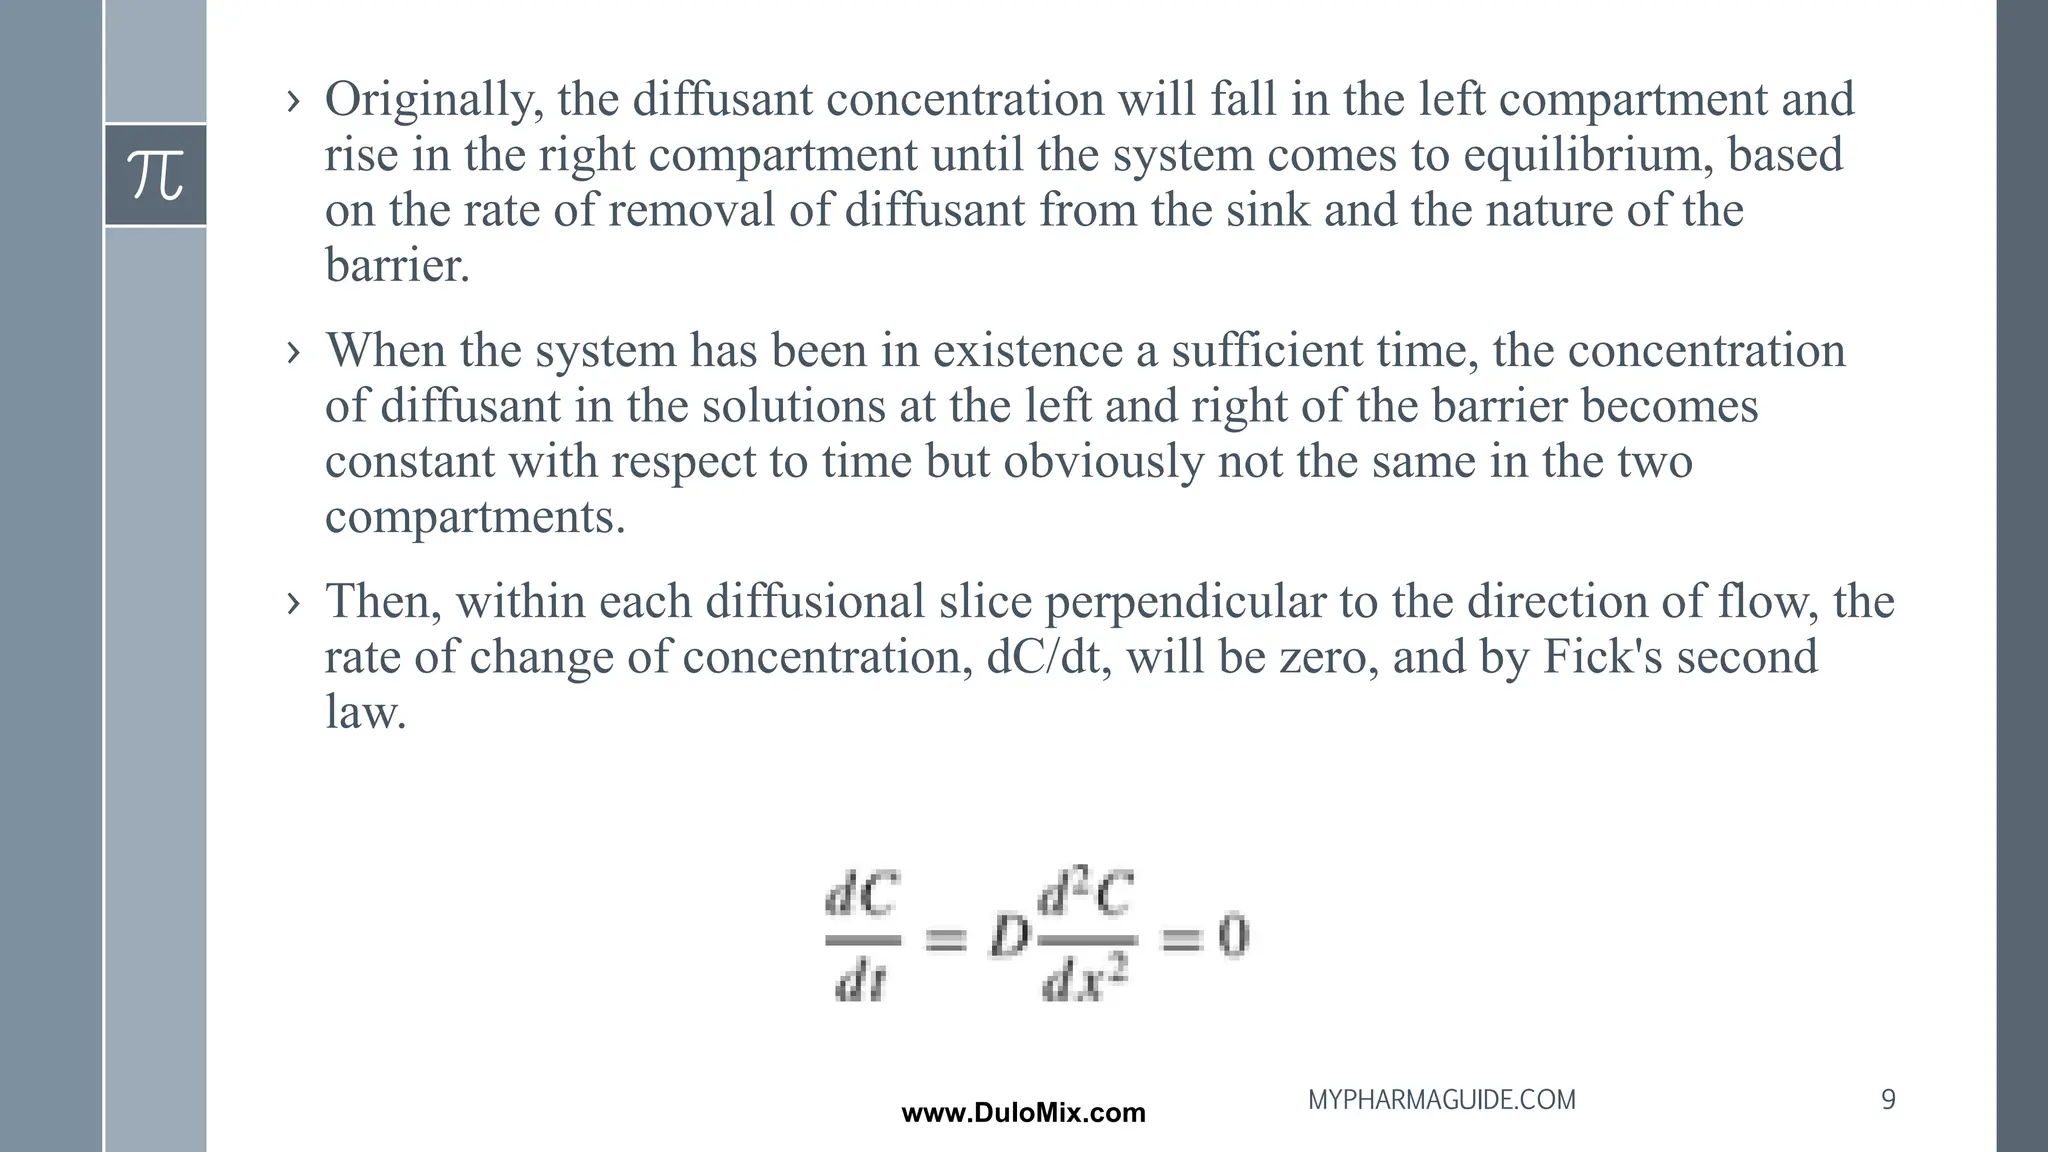
› Originally, thediffusant concentration will fall in the left compartment and
rise in the right compartment until the system comes to equilibrium, based
on the rate of removal of diffusant from the sink and the nature of the
barrier.
› When the system has been in existence a sufficient time, the concentration
of diffusant in the solutions at the left and right of the barrier becomes
constant with respect to time but obviously not the same in the two
compartments.
› Then, within each diffusional slice perpendicular to the direction of flow, the
rate of change of concentration, dC/dt, will be zero, and by Fick's second
law.
9
MYPHARMAGUIDE.COM
www.DuloMix.com
10.
PERMEABILITY COEFFICIENT:
This showsthe rate of permeation of drug molecules/ solute
across the semi-permeable membrane
BURST EFFECT:
› In many of the controlled release formulations, immediately
upon placement in the release medium, an initial large bolus of
drug is released before the release rate reaches a stable profile.
› This phenomenon is known as “burst effect”.
› Initial state of drug release into receptor side is at a higher rate
than the steady-state release rate
10
MYPHARMAGUIDE.COM
www.DuloMix.com
11.
FACTORS AFFECTING DIFFUSION
▪Size
▪ Shape
▪ Concentration
▪ Temperature
▪ Charge
▪ Lipid solubility
SIZE:
Small molecules can slip by the polar heads of the
phospholipids and through the membrane to the other side.
Very large molecules like proteins cannot diffuse across the
membrane at all.
11
MYPHARMAGUIDE.COM
www.DuloMix.com
12.
SHAPE:
– Glucose isable to get into cells much faster than other sugars.
– Made by facilitated diffusion.
– A carrier protein specific for glucose combines with it on the outer
surface, closes around it and then opens to the inside of the cell where the
glucose is released.
– The carrier then returns to its original shape and is ready to transport
another glucose molecule.
CONCENTRATION:
– The greater the concentration gradient between the outside and inside of
the membrane the greater the rate of diffusion.
– If the concentration of oxygen outside the cell increases then it will
diffuse more quickly into the cell
12
MYPHARMAGUIDE.COM
www.DuloMix.com
13.
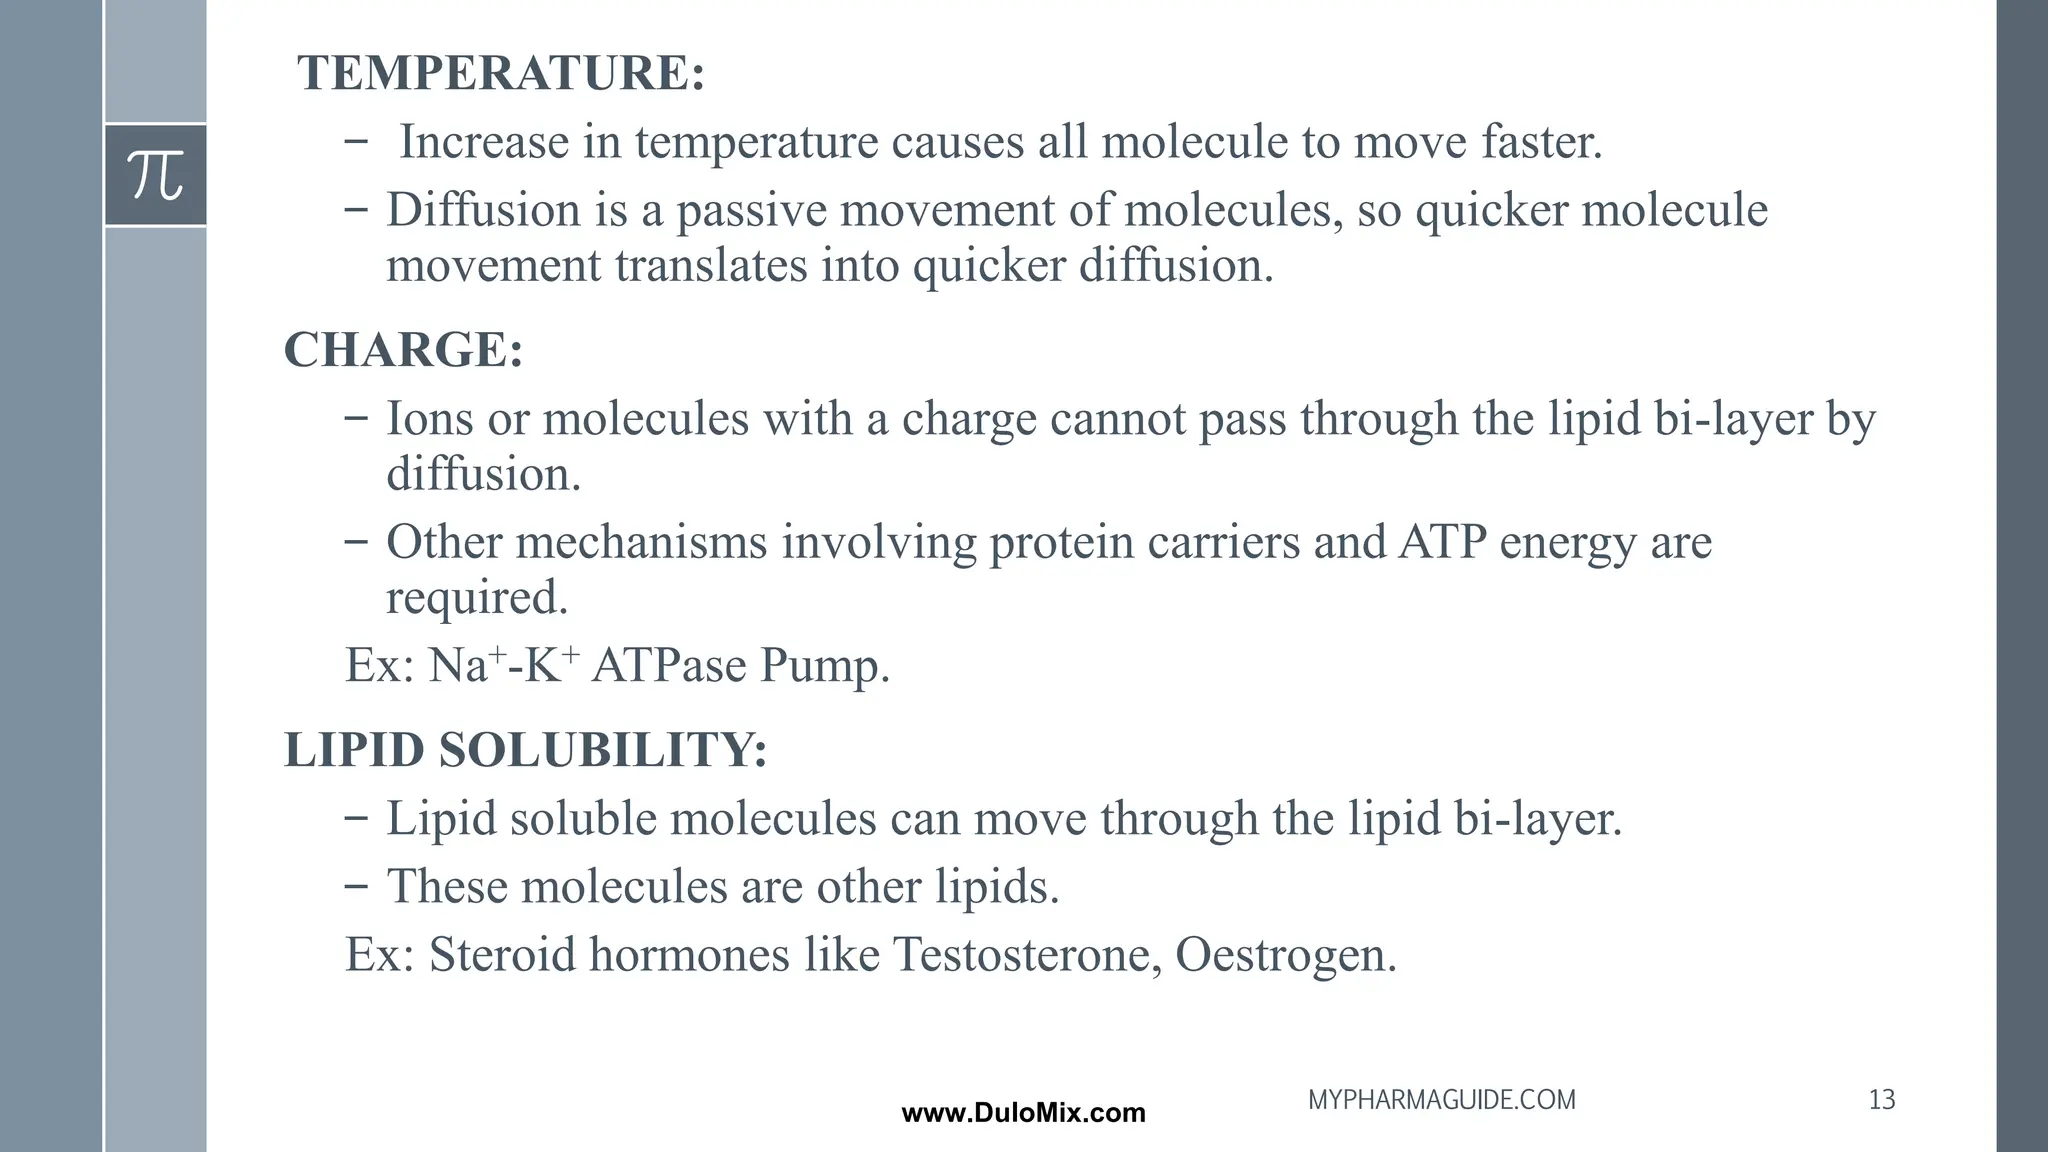
TEMPERATURE:
– Increase intemperature causes all molecule to move faster.
– Diffusion is a passive movement of molecules, so quicker molecule
movement translates into quicker diffusion.
CHARGE:
– Ions or molecules with a charge cannot pass through the lipid bi-layer by
diffusion.
– Other mechanisms involving protein carriers and ATP energy are
required.
Ex: Na+-K+ ATPase Pump.
LIPID SOLUBILITY:
– Lipid soluble molecules can move through the lipid bi-layer.
– These molecules are other lipids.
Ex: Steroid hormones like Testosterone, Oestrogen.
13
MYPHARMAGUIDE.COM
www.DuloMix.com
14.
DISSOLUTION :
Dissolution isa process in which a solid substance solubilizes in
a given solvent i.e. mass transfer from the solid surface to the
liquid phase.
Dissolution is the rate determining step for hydrophobic, poorly
aqueous soluble drugs
E.g. Griseofulvin, Spironolactone
14
MYPHARMAGUIDE.COM
www.DuloMix.com
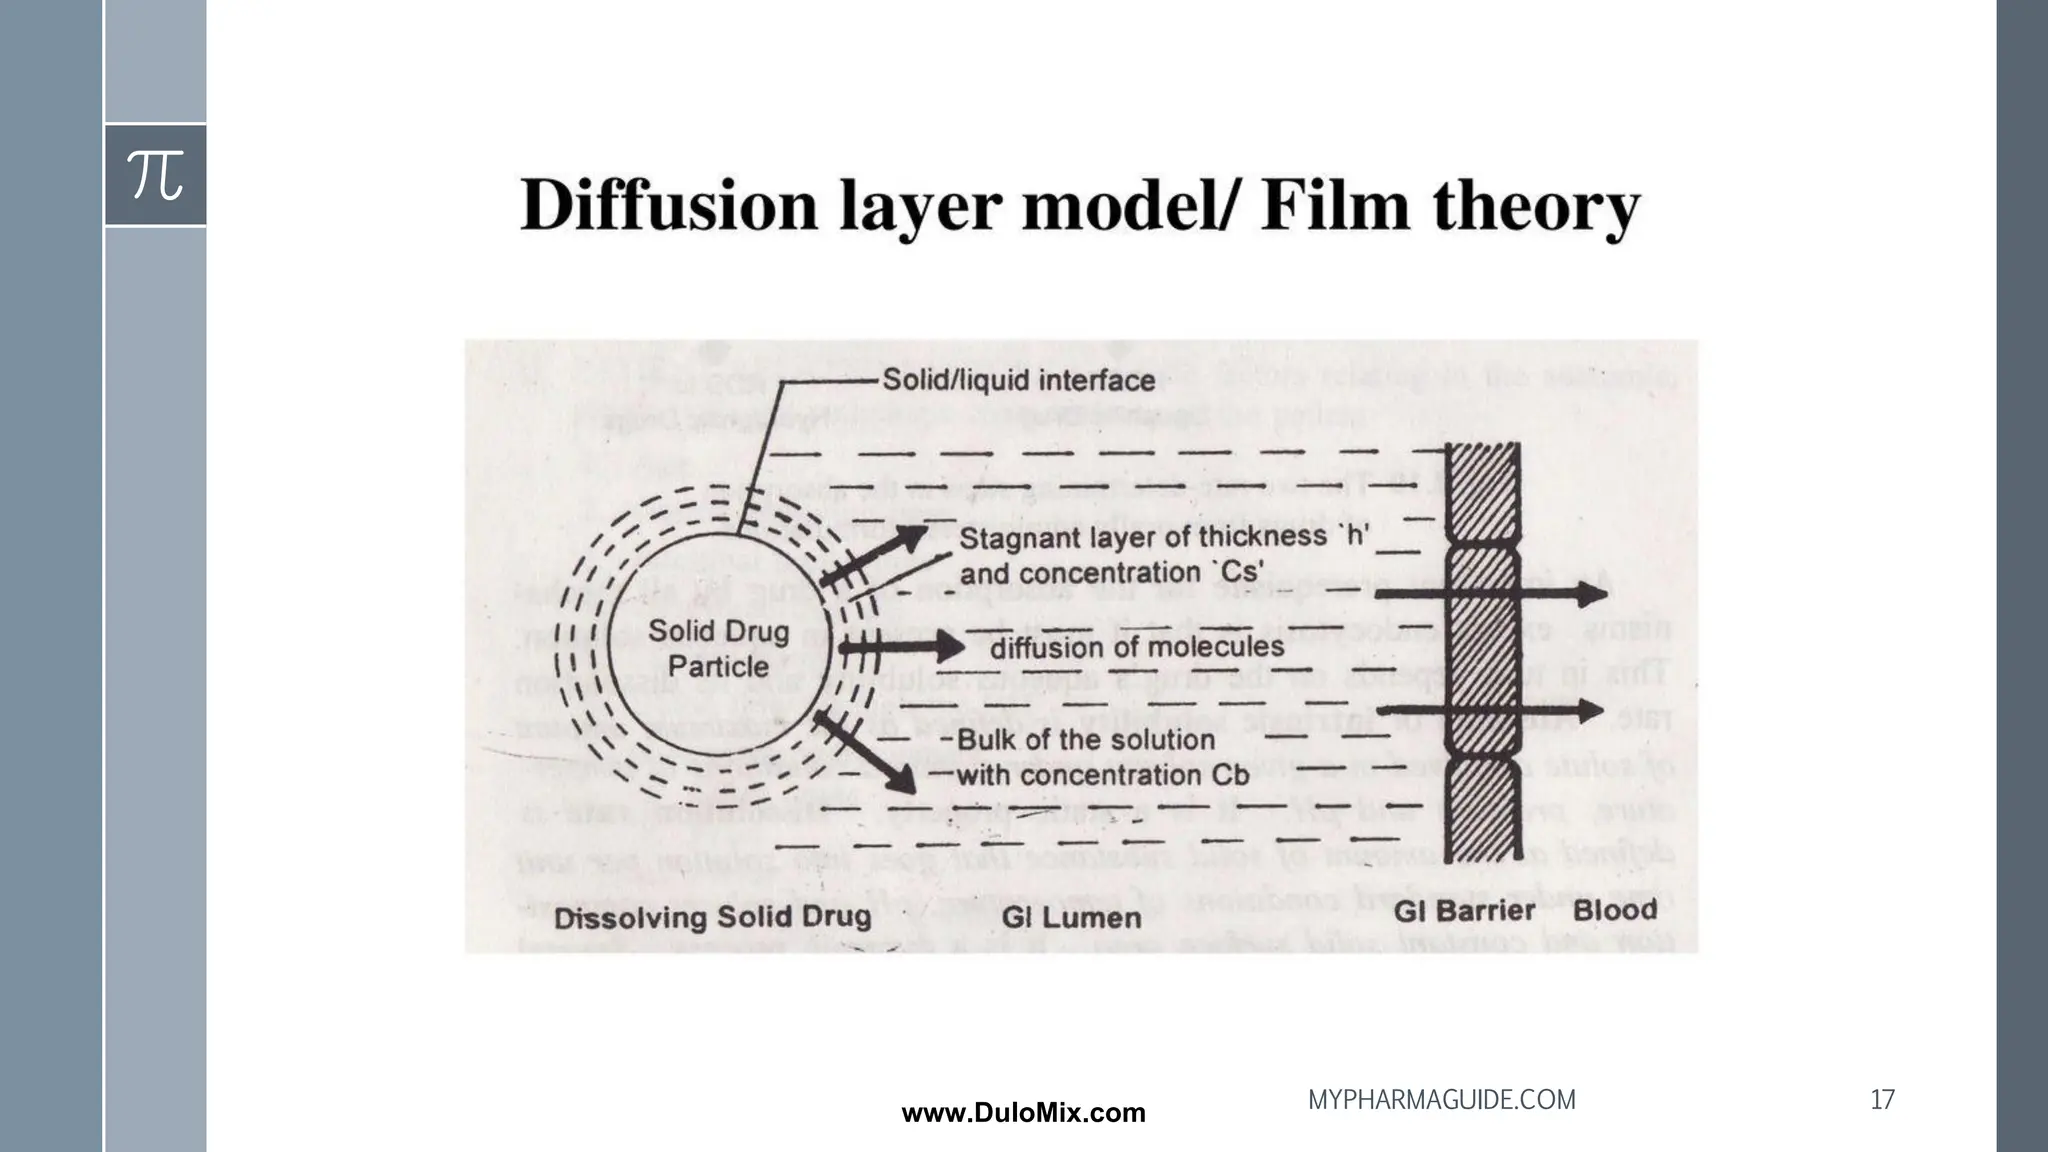
15.
The rate ofdissolution is given by Noyes and Whitney:
dC / dt = k(Cs – Cb)
This equation was based on Fick’s Second Law of diffusion
Where,
dC/dt = Dissolution rate of the drug
k = Dissolution rate constant
Cs = Concentration of drug in stagnant layer
Cb = Concentration of drug in the bulk of the solution at time t
15
MYPHARMAGUIDE.COM
www.DuloMix.com
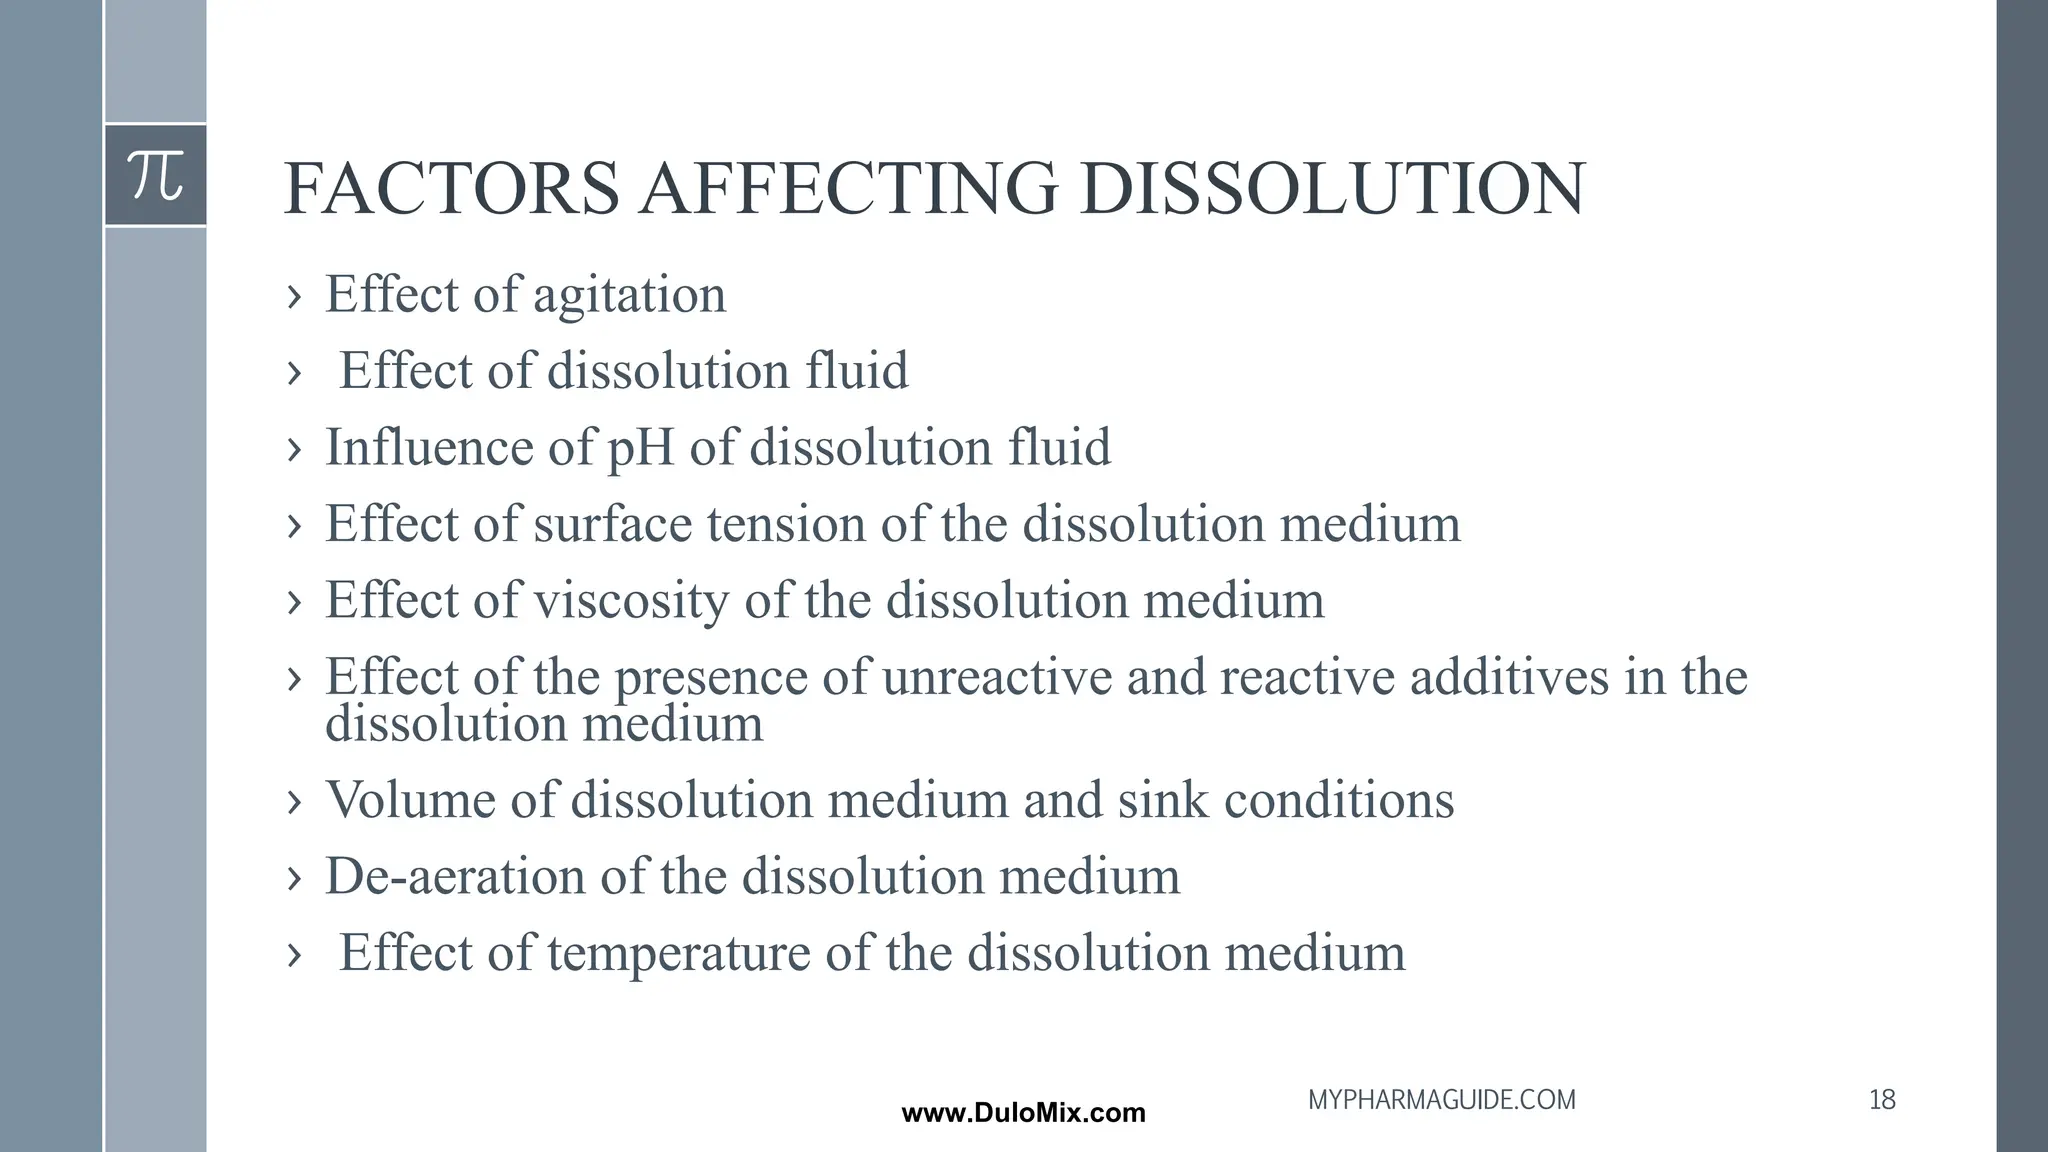
FACTORS AFFECTING DISSOLUTION
›Effect of agitation
› Effect of dissolution fluid
› Influence of pH of dissolution fluid
› Effect of surface tension of the dissolution medium
› Effect of viscosity of the dissolution medium
› Effect of the presence of unreactive and reactive additives in the
dissolution medium
› Volume of dissolution medium and sink conditions
› De-aeration of the dissolution medium
› Effect of temperature of the dissolution medium
18
MYPHARMAGUIDE.COM
www.DuloMix.com
19.
▪ EFFECT OFAGITATION:
– The relationship between the intensity of agitation and the rate of
dissolution varies considerably to the type of agitation used, degree of
laminar and turbulent flow in the system, shape and design of the stirrer
and the physicochemical properties of the solid.
– For the basket method(100rpm) is utilized while for the paddle method
(50-75rpm) is recommended.
▪ EFFECT OF DISSOLUTION FLUID:
– Selection of proper medium for dissolution testing depends largely on the
physicochemical properties of the drug.
19
MYPHARMAGUIDE.COM
www.DuloMix.com
20.
▪ INFLUENCE OFpH OF DISSOLUTION FLUID:
– Change in pH exert greatest effect in drug solubility.
– For weak acids dissolution rate increases with increase in pH
– For weak bases dissolution rate increases with decrease in pH
– Tablets containing active ingredients, whose solubility are independent of
pH, dissolution rate does not vary significantly with change of pH of
dissolution medium unless they contain certain excipients that are
influenced by pH
– Tablets that are formulated with CO2 producing compounds (NaHCO3,
CaCO3) tend to have slightly faster dissolution rate in acid medium than
in water.
20
MYPHARMAGUIDE.COM
www.DuloMix.com
21.
▪ EFFECT OFSURFACE TENSION OF THE
DISSOLUTION MEDIUM:
➢ According to the diffusion film theory, dissolution of the drug is
governed by the interplay between
I. Release of the drug from solid surface and
II. Its transfer throughout the bulk of the dissolution medium
➢ If the drug is hydrophobic the dissolution rate is influenced primarily
by the process of release, whereas for hydrophilic drugs the transfer
process is more likely to be the rate limiting step.
➢ Incorporation of surface active agents in the dissolution medium is
expected to enhance the dissolution rate of a poorly soluble drug in
solid dosage forms by reducing the interfacial tension and micelle
formation.
21
MYPHARMAGUIDE.COM
www.DuloMix.com
22.
➢ Addition ofsurfactant below CMC can increase significantly the
dissolution rate because of better penetration of the solvent into the tablet
resulting in greater availability of the drug surface.
▪ EFFECT OF VISCOSITY OF THE DISSOLUTION
MEDIUM:
If the interaction at the interfaces occurs much faster than the rate of
transport, such as in case of diffusion controlled dissolution processes, it
would be expected that the dissolution rate decreases with an increase in
viscosity.
22
MYPHARMAGUIDE.COM
www.DuloMix.com
23.
▪ EFFECT OFPRESENCE OF UNREACTIVE AND REACTIVE
ADDITIVES IN THE DISSOLUTION MEDIUM:
– EXAMPLE: When neutral ionic compounds like sodium chloride and
sodium sulphate or non-ionic organic compounds like dextrose if added
to the dissolution medium, the dissolution of benzoic acid was linearly
dependent upon its solubility in particular solvent.
– When certain buffers or bases were added to the aqueous solvent, an
increase in the dissolution rate was observed.
23
MYPHARMAGUIDE.COM
www.DuloMix.com
24.
▪ DEAERATION OFTHE DISSOLUTION MEDIUM:
➢ Presence of dissolved air or other gases in the dissolution medium may
influence the dissolution rate of certain formulations and lead to variable
and unreliable results.
➢ Example: The dissolved air in distilled water could lower its pH
➢ The air bubbles that circulate can affect the hydrodynamic flow pattern
generated by the stirring mechanism.
➢ The air bubbles on solid surface of tablet can lead to reduction in the
specific gravity and thus there is a minimum chance of being wetted
efficiently.
24
MYPHARMAGUIDE.COM
www.DuloMix.com
25.
▪ EFFECT OFTEMPERATURE OF THE DISSOLUTION MEDIUM:
➢ Drug solubility is temperature dependent.
➢ Generally the temperature of 37±0.5ºC is maintained during dissolution
determination of oral dosage forms and suppositories.
➢ For topical preparations as low as 30ºC and 25ºC have been used.
25
MYPHARMAGUIDE.COM
www.DuloMix.com
26.
PHARMACOKINETICS
❖Pharmacokinetics is thestudy of the kinetics of drug absorption,
distribution, metabolism and elimination and their relationship
with the pharmacological, therapeutic or toxicological response
in man and animals.
❖Pharmacokinetics describe what the body does to the drug, as
opposed to pharmacodynamics which describe what the drug
does to the body.
26
MYPHARMAGUIDE.COM
www.DuloMix.com
27.
PARAMETERS THAT WILLBE ESTIMATED :
1.Absorption
➢Bioavailability (Cmax, tmax, AUC)
➢Absorption rate constant (Ka)
➢Salt factor
2.Distribution
➢Volume of distribution ( Vd)
➢Distribution equilibrium
➢Distribution rate constant
3.Elimination
➢Clearance
➢Half-life
➢1st order, 0 order and mixed order kinetics
➢Elimination rate constant (Kel), Ku, Km 27
MYPHARMAGUIDE.COM
www.DuloMix.com
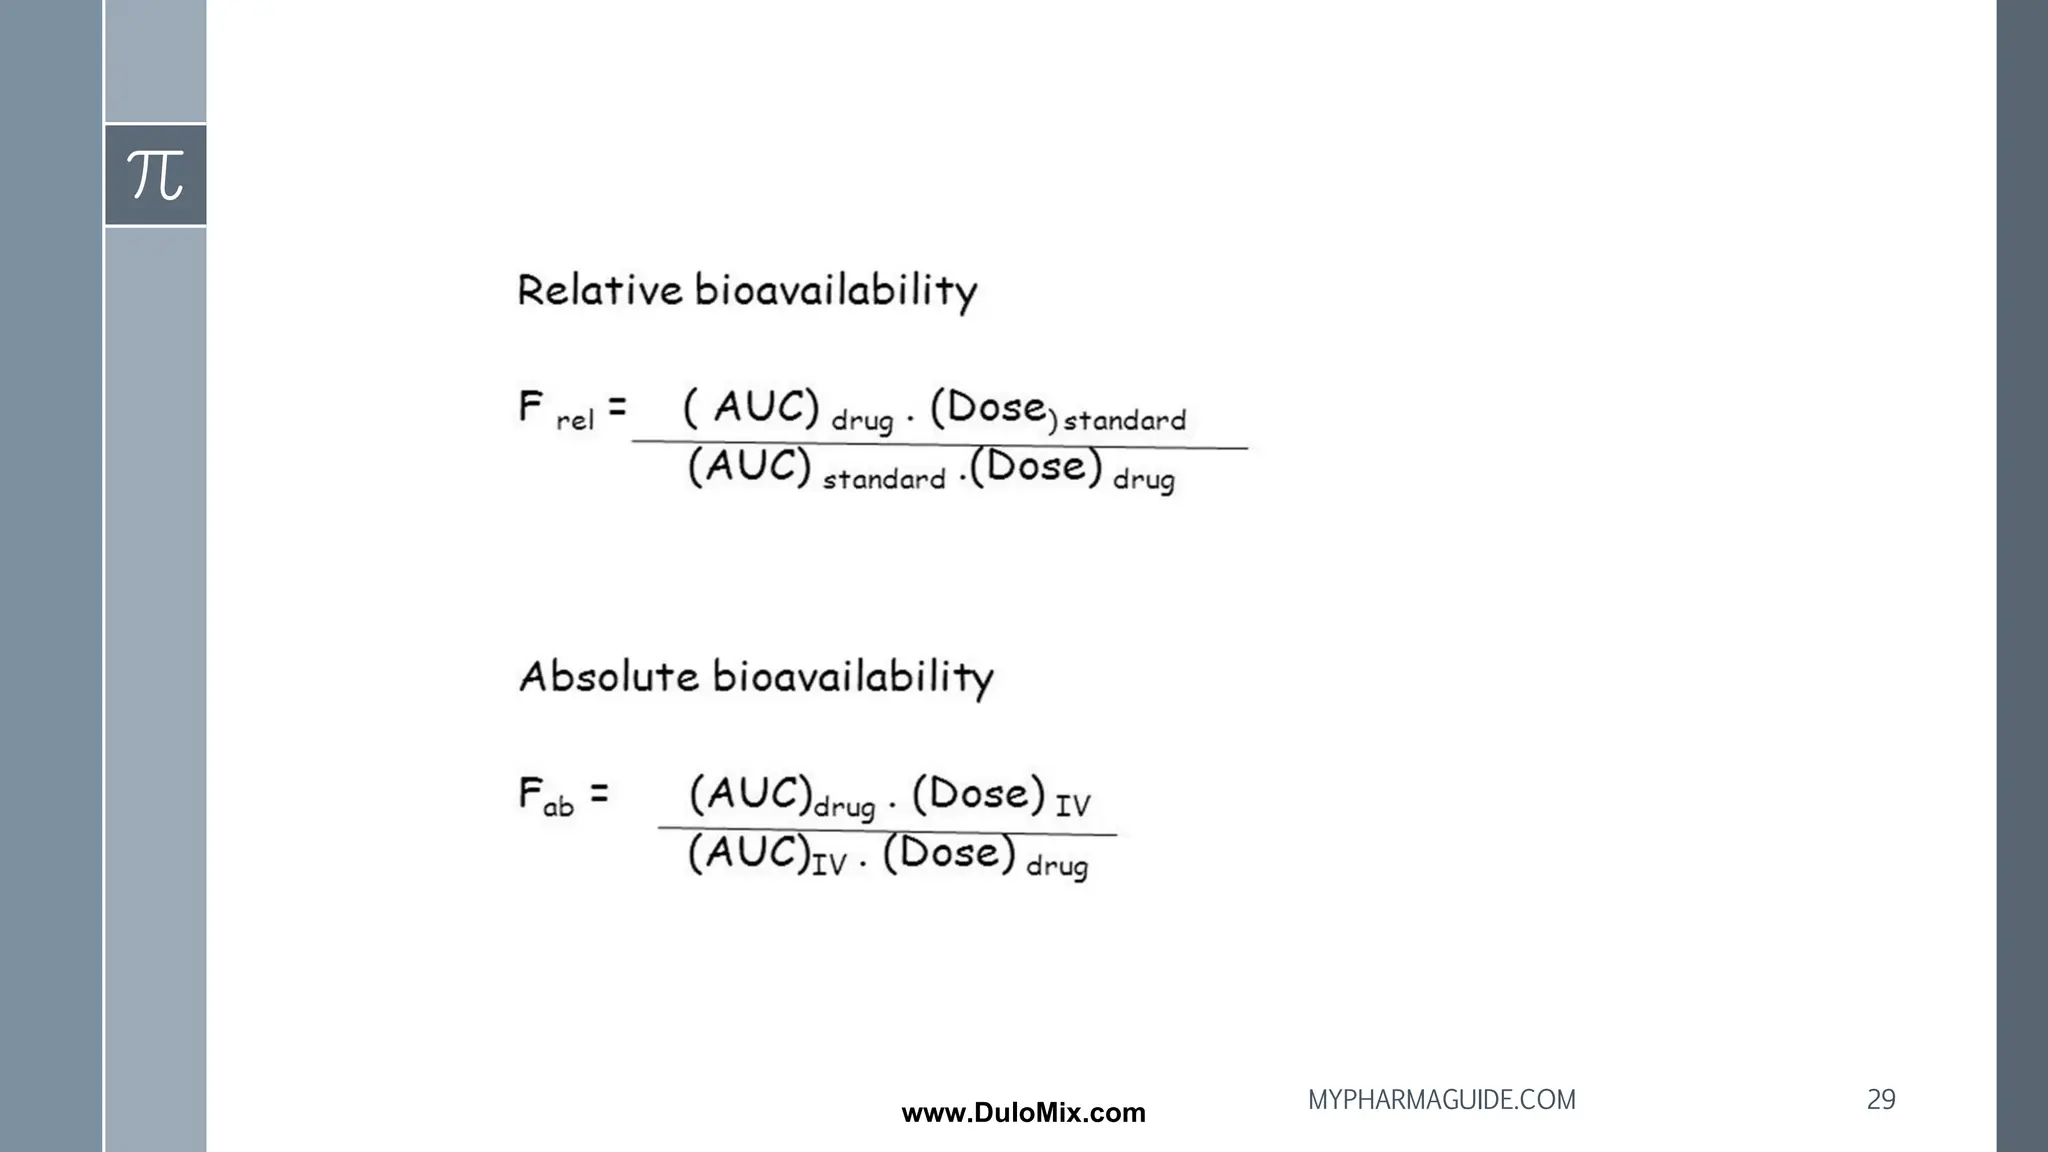
28.
Bioavailability :
› Bioavailabilityis the fraction of administered drug that reaches the systemic
circulation.
› Bioavailability is expressed as the fraction of administered drug that gains
access to the systemic circulation in a chemically unchanged form.
› For example, if 100 mg of a drug are administered orally and 70 mg of this
drug are absorbed unchanged, the bioavailability is 0.7 or 70 percent.
28
MYPHARMAGUIDE.COM
www.DuloMix.com
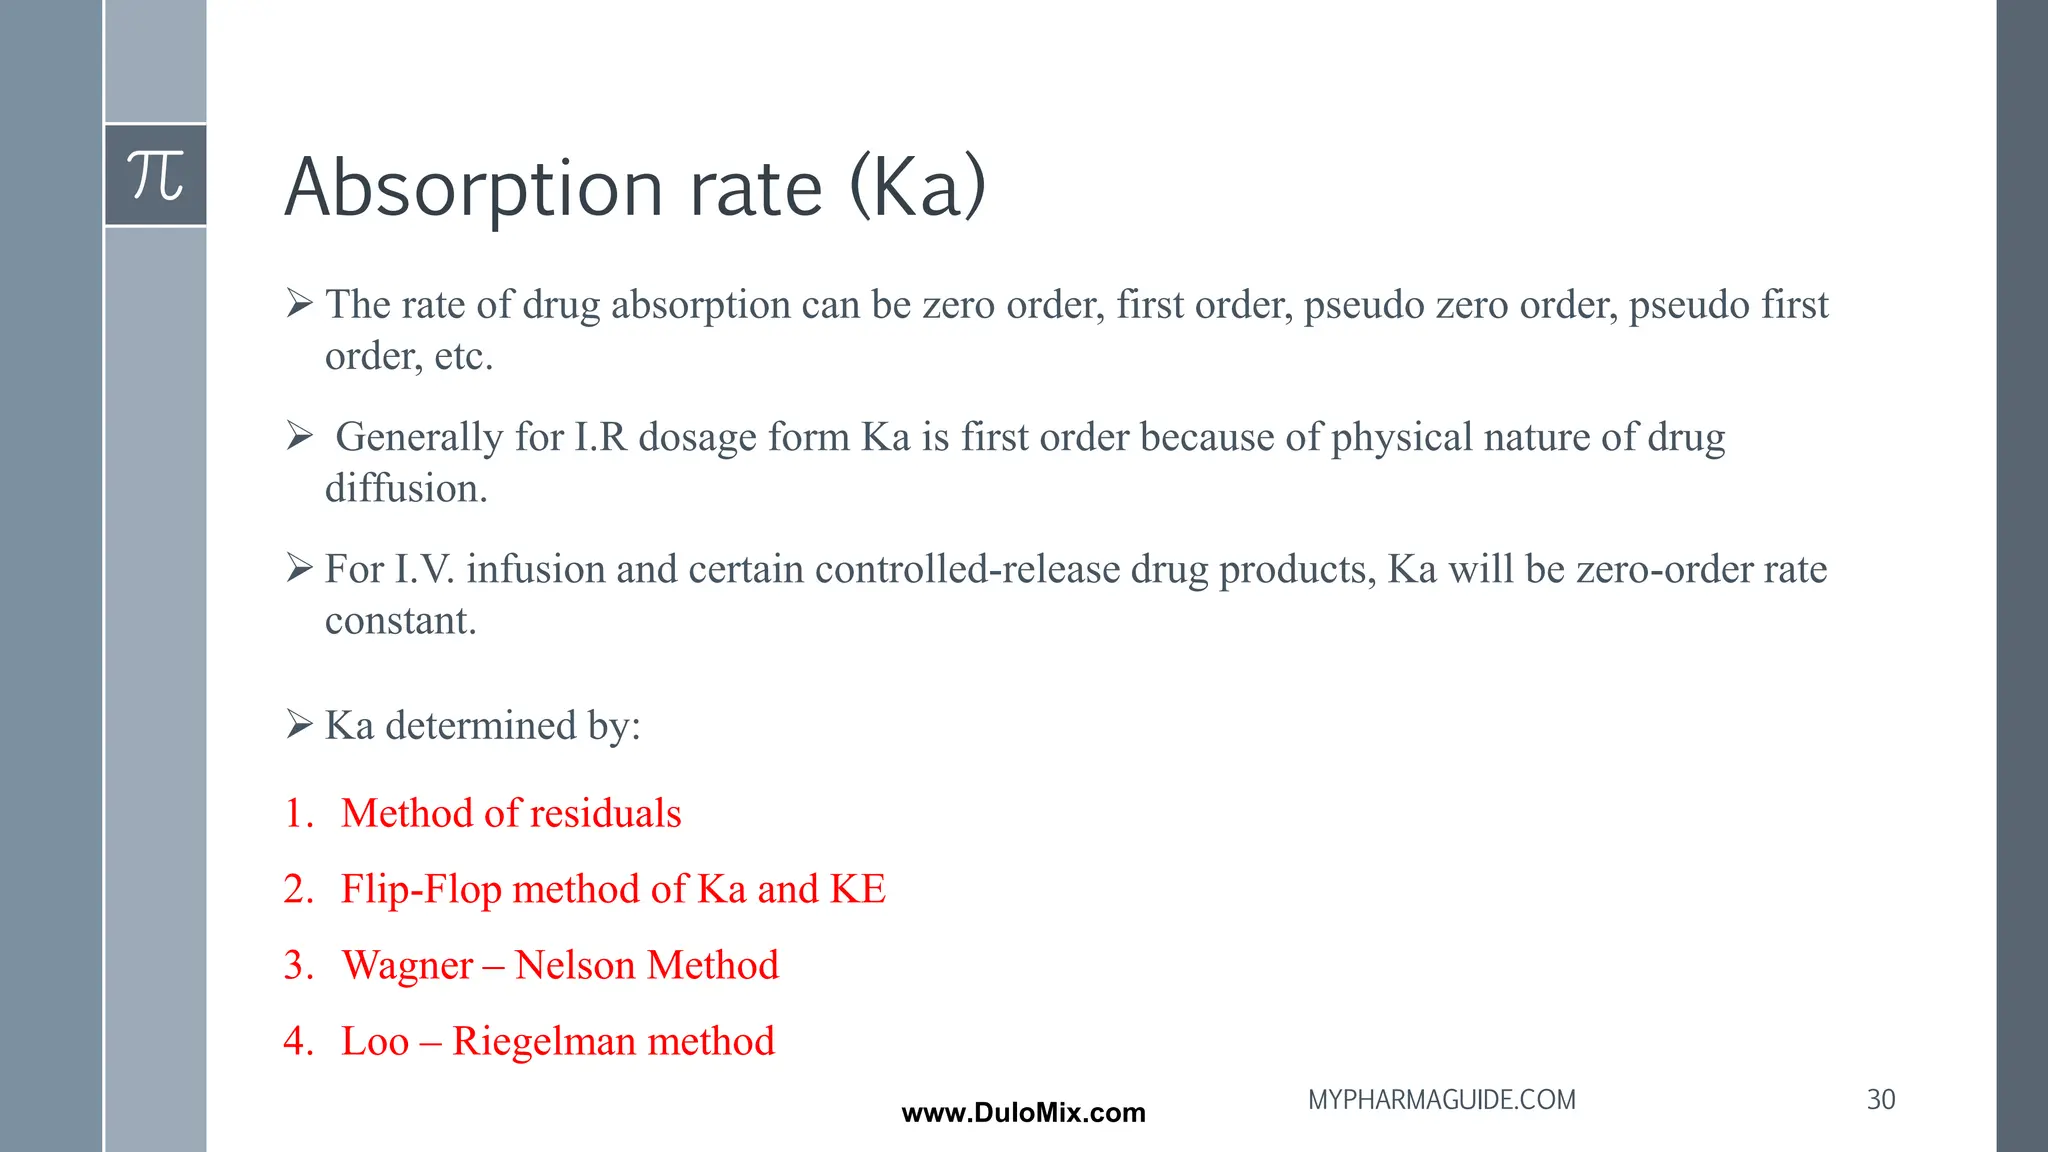
Absorption rate (Ka)
➢The rate of drug absorption can be zero order, first order, pseudo zero order, pseudo first
order, etc.
➢ Generally for I.R dosage form Ka is first order because of physical nature of drug
diffusion.
➢ For I.V. infusion and certain controlled-release drug products, Ka will be zero-order rate
constant.
➢ Ka determined by:
1. Method of residuals
2. Flip-Flop method of Ka and KE
3. Wagner – Nelson Method
4. Loo – Riegelman method
30
MYPHARMAGUIDE.COM
www.DuloMix.com
31.
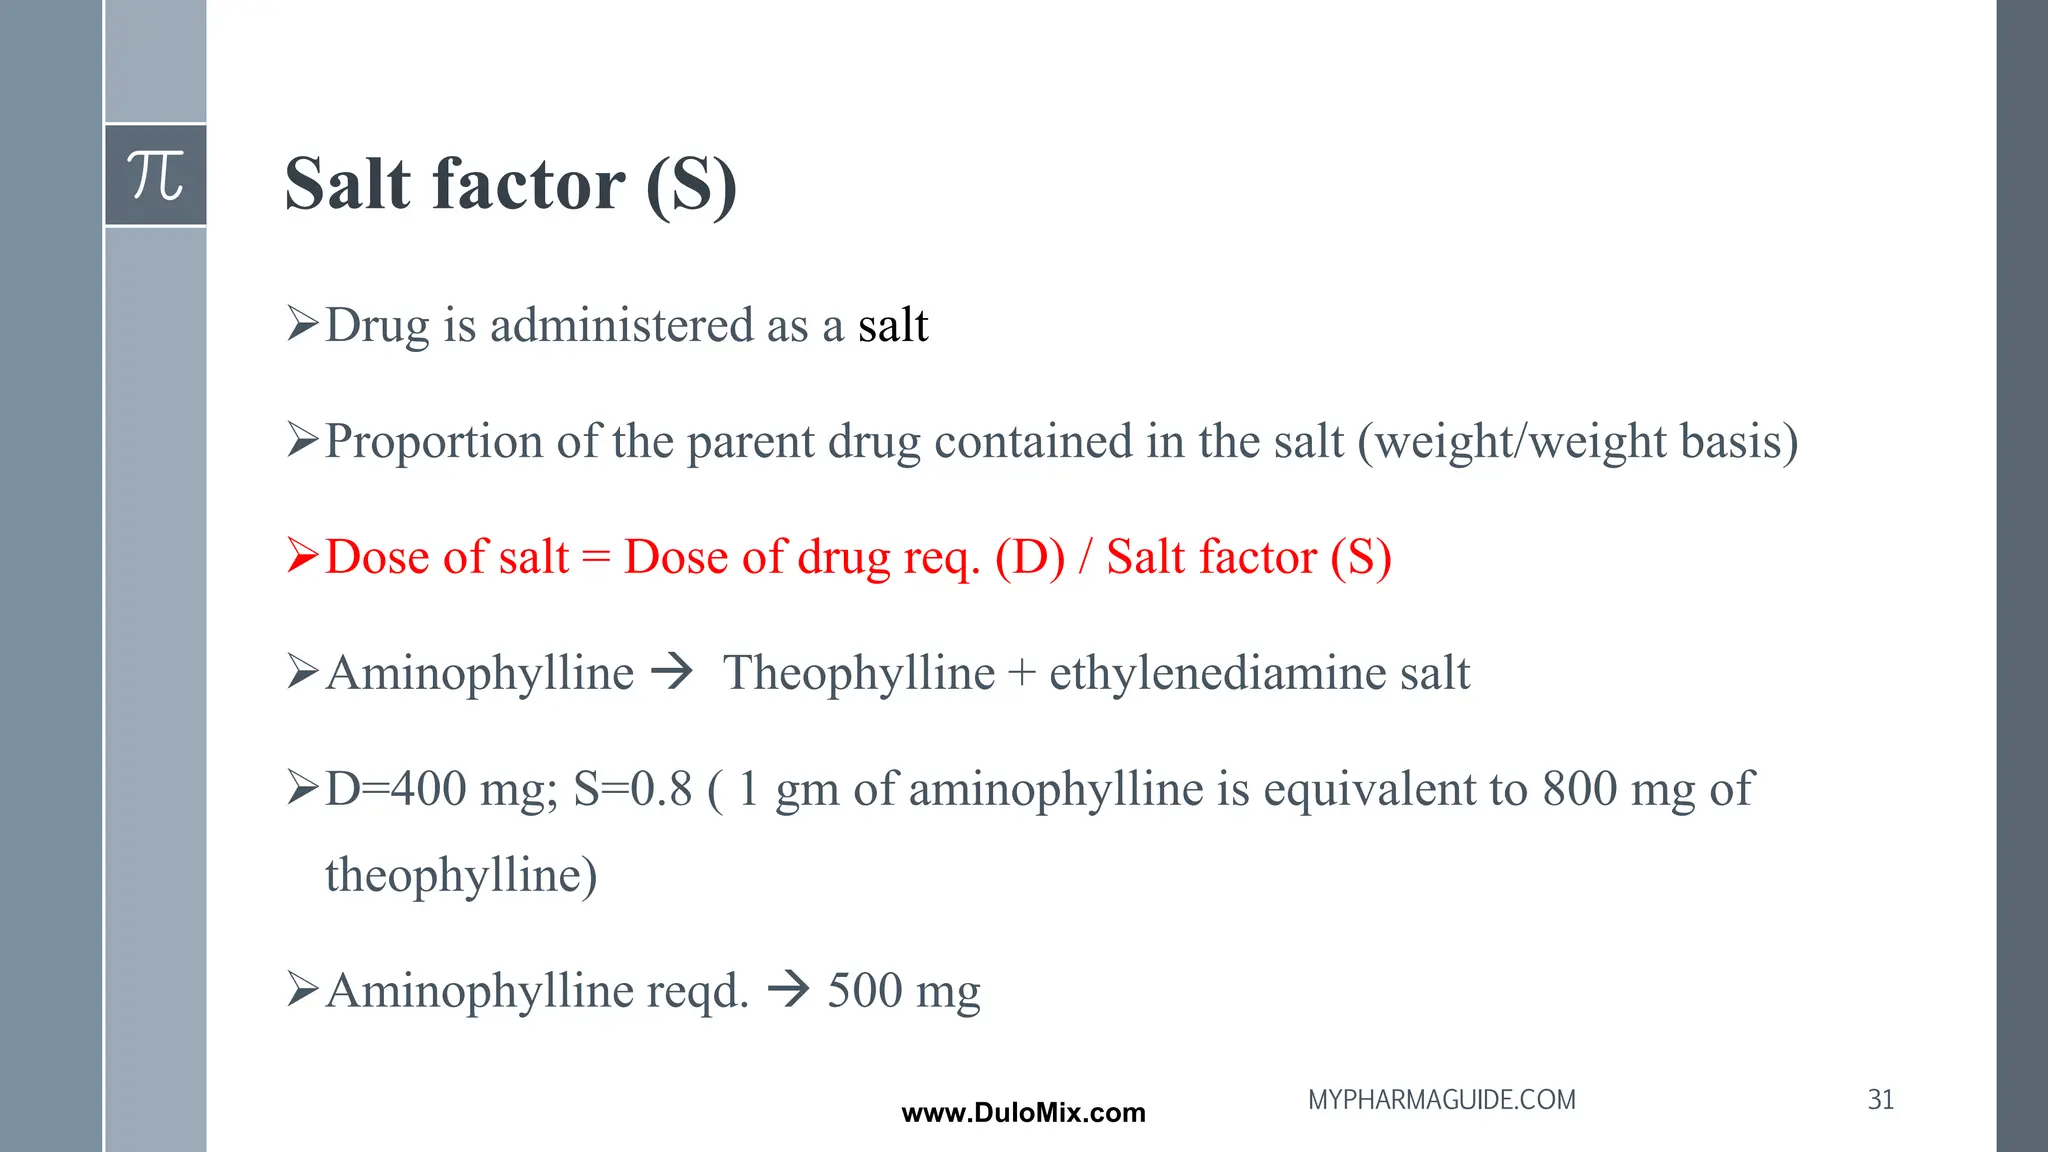
Salt factor (S)
➢Drugis administered as a salt
➢Proportion of the parent drug contained in the salt (weight/weight basis)
➢Dose of salt = Dose of drug req. (D) / Salt factor (S)
➢Aminophylline → Theophylline + ethylenediamine salt
➢D=400 mg; S=0.8 ( 1 gm of aminophylline is equivalent to 800 mg of
theophylline)
➢Aminophylline reqd. → 500 mg
31
MYPHARMAGUIDE.COM
www.DuloMix.com
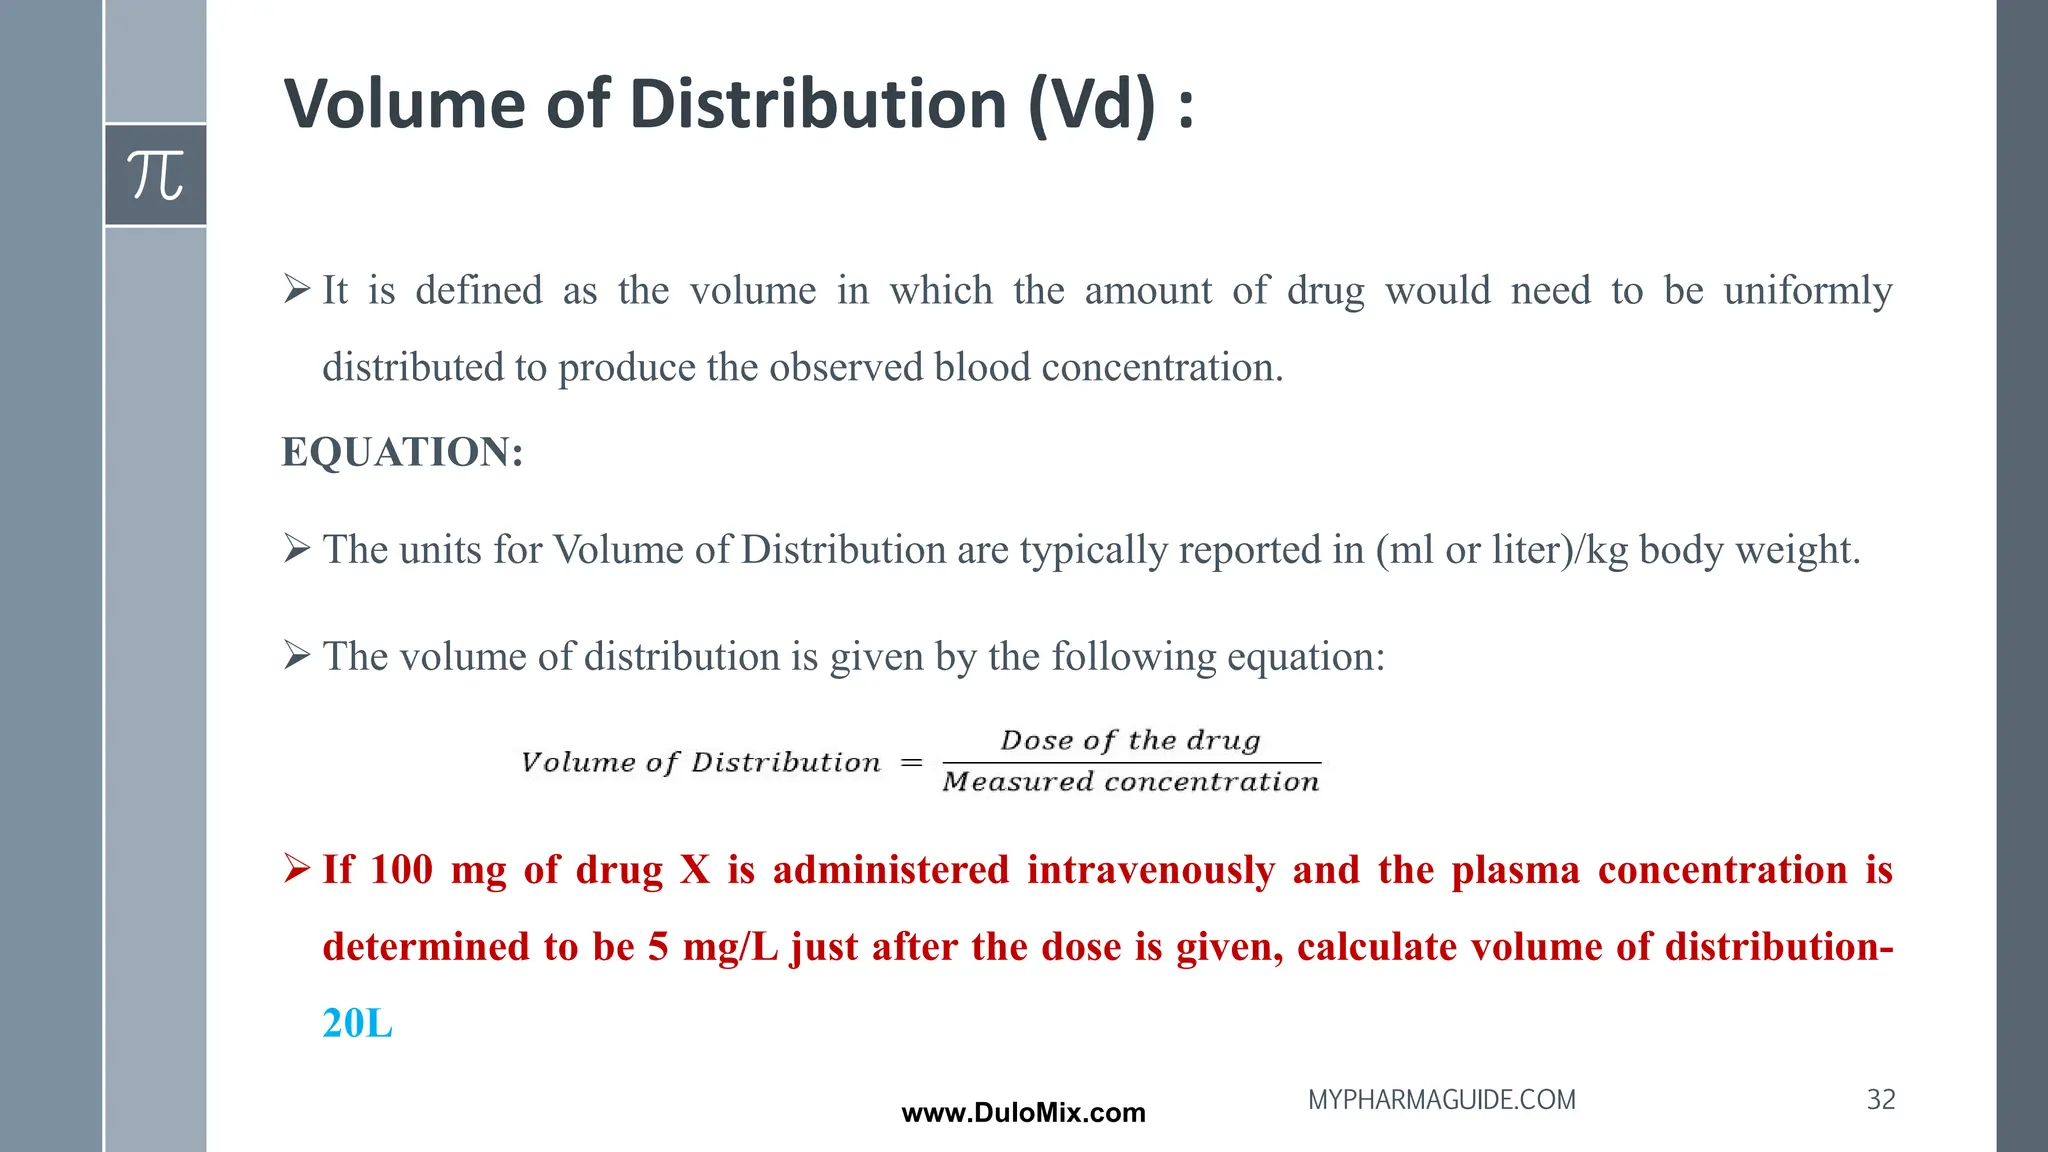
32.
Volume of Distribution(Vd) :
➢ It is defined as the volume in which the amount of drug would need to be uniformly
distributed to produce the observed blood concentration.
EQUATION:
➢ The units for Volume of Distribution are typically reported in (ml or liter)/kg body weight.
➢ The volume of distribution is given by the following equation:
➢ If 100 mg of drug X is administered intravenously and the plasma concentration is
determined to be 5 mg/L just after the dose is given, calculate volume of distribution-
20L
32
MYPHARMAGUIDE.COM
www.DuloMix.com
33.
› The volumeof distribution(vd), also known as apparent volume of
distribution, is used to quantify the distribution of a medication between
plasma and the rest of the body after oral or parenteral dosing.
➢How the drug binds in the blood or serum compared to the binding in
tissues is also an important determinate of the Vd for a drug.
➢Reflects the extent to which it is present in extra vascular tissues and
not in the plasma.
➢For example, Warfarin has such a small volume of distribution is that it is
highly bound to serum albumin so that the free fraction of drug in the blood
(fB) is very small.
33
MYPHARMAGUIDE.COM
www.DuloMix.com
34.
Distribution equilibrium
➢Rate oftransfer of drug from blood to various organs & tissues = Rate of transfer of
drug from various tissues & organs back into the blood
➢Rapid distribution → Rate of transfer of drug from blood to all organs & tissues &
vice-versa have become equal instantaneously following administration (intra/extra
vascular) of the dose of a drug.
Distribution rate constant (kT)
➢Measure of how rapidly drug would leave tissue if the arterial concentration were to
drop to zero.
➢Fractional rate of drug distribution from an organ to blood
34
MYPHARMAGUIDE.COM
www.DuloMix.com
35.
Clearance :
➢The definitionof clearance is the volume of serum or blood completely
cleared of the drug per unit time.
➢ it determines the maintenance dose
➢Extraction Ratio (ER) : The ability of an organ to remove or extract the
drug from the blood or serum
ER = (Cin − Cout)/Cin
35
MYPHARMAGUIDE.COM
www.DuloMix.com
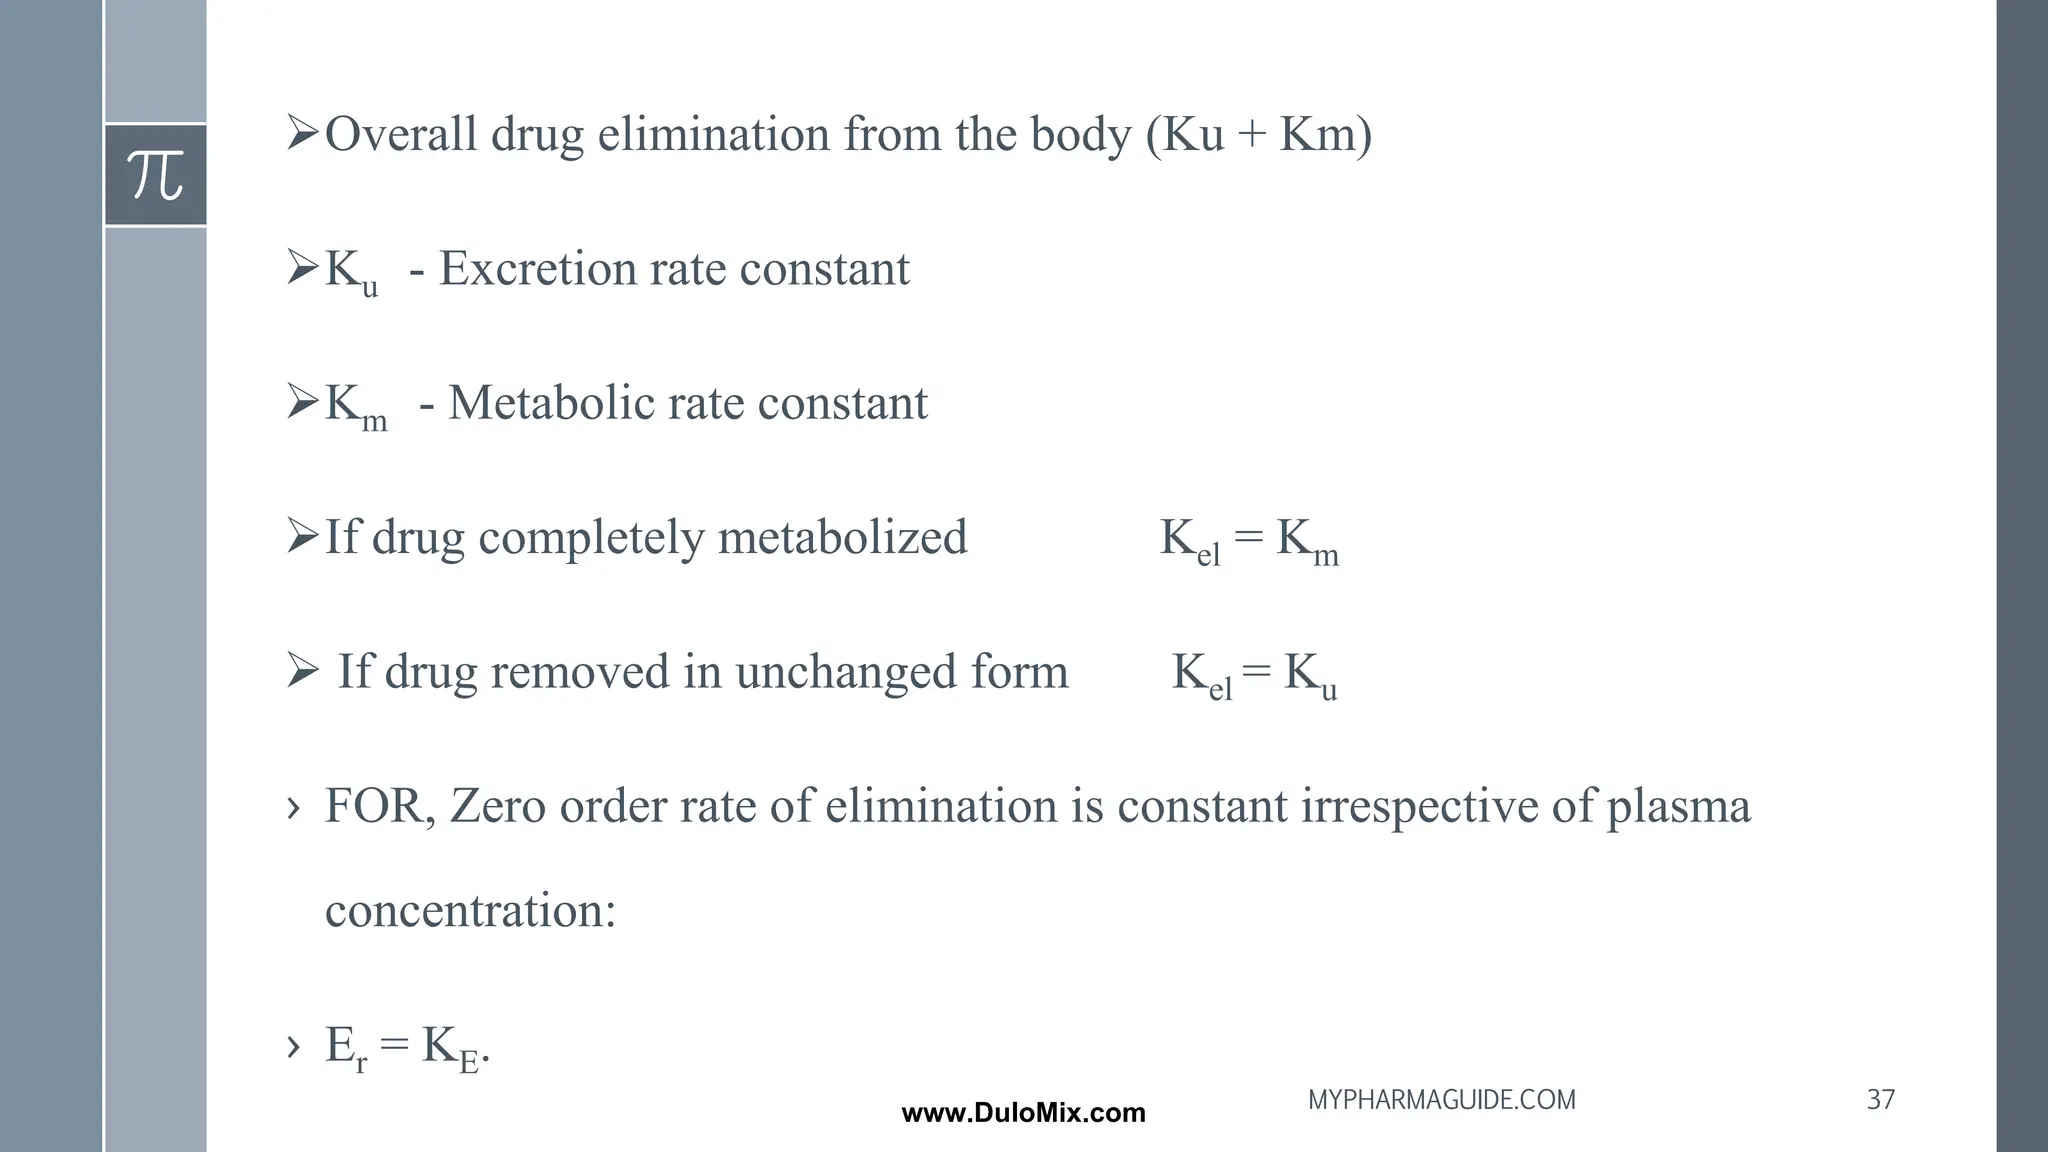
➢Overall drug eliminationfrom the body (Ku + Km)
➢Ku - Excretion rate constant
➢Km - Metabolic rate constant
➢If drug completely metabolized Kel = Km
➢ If drug removed in unchanged form Kel = Ku
› FOR, Zero order rate of elimination is constant irrespective of plasma
concentration:
› Er = KE.
37
MYPHARMAGUIDE.COM
www.DuloMix.com
38.
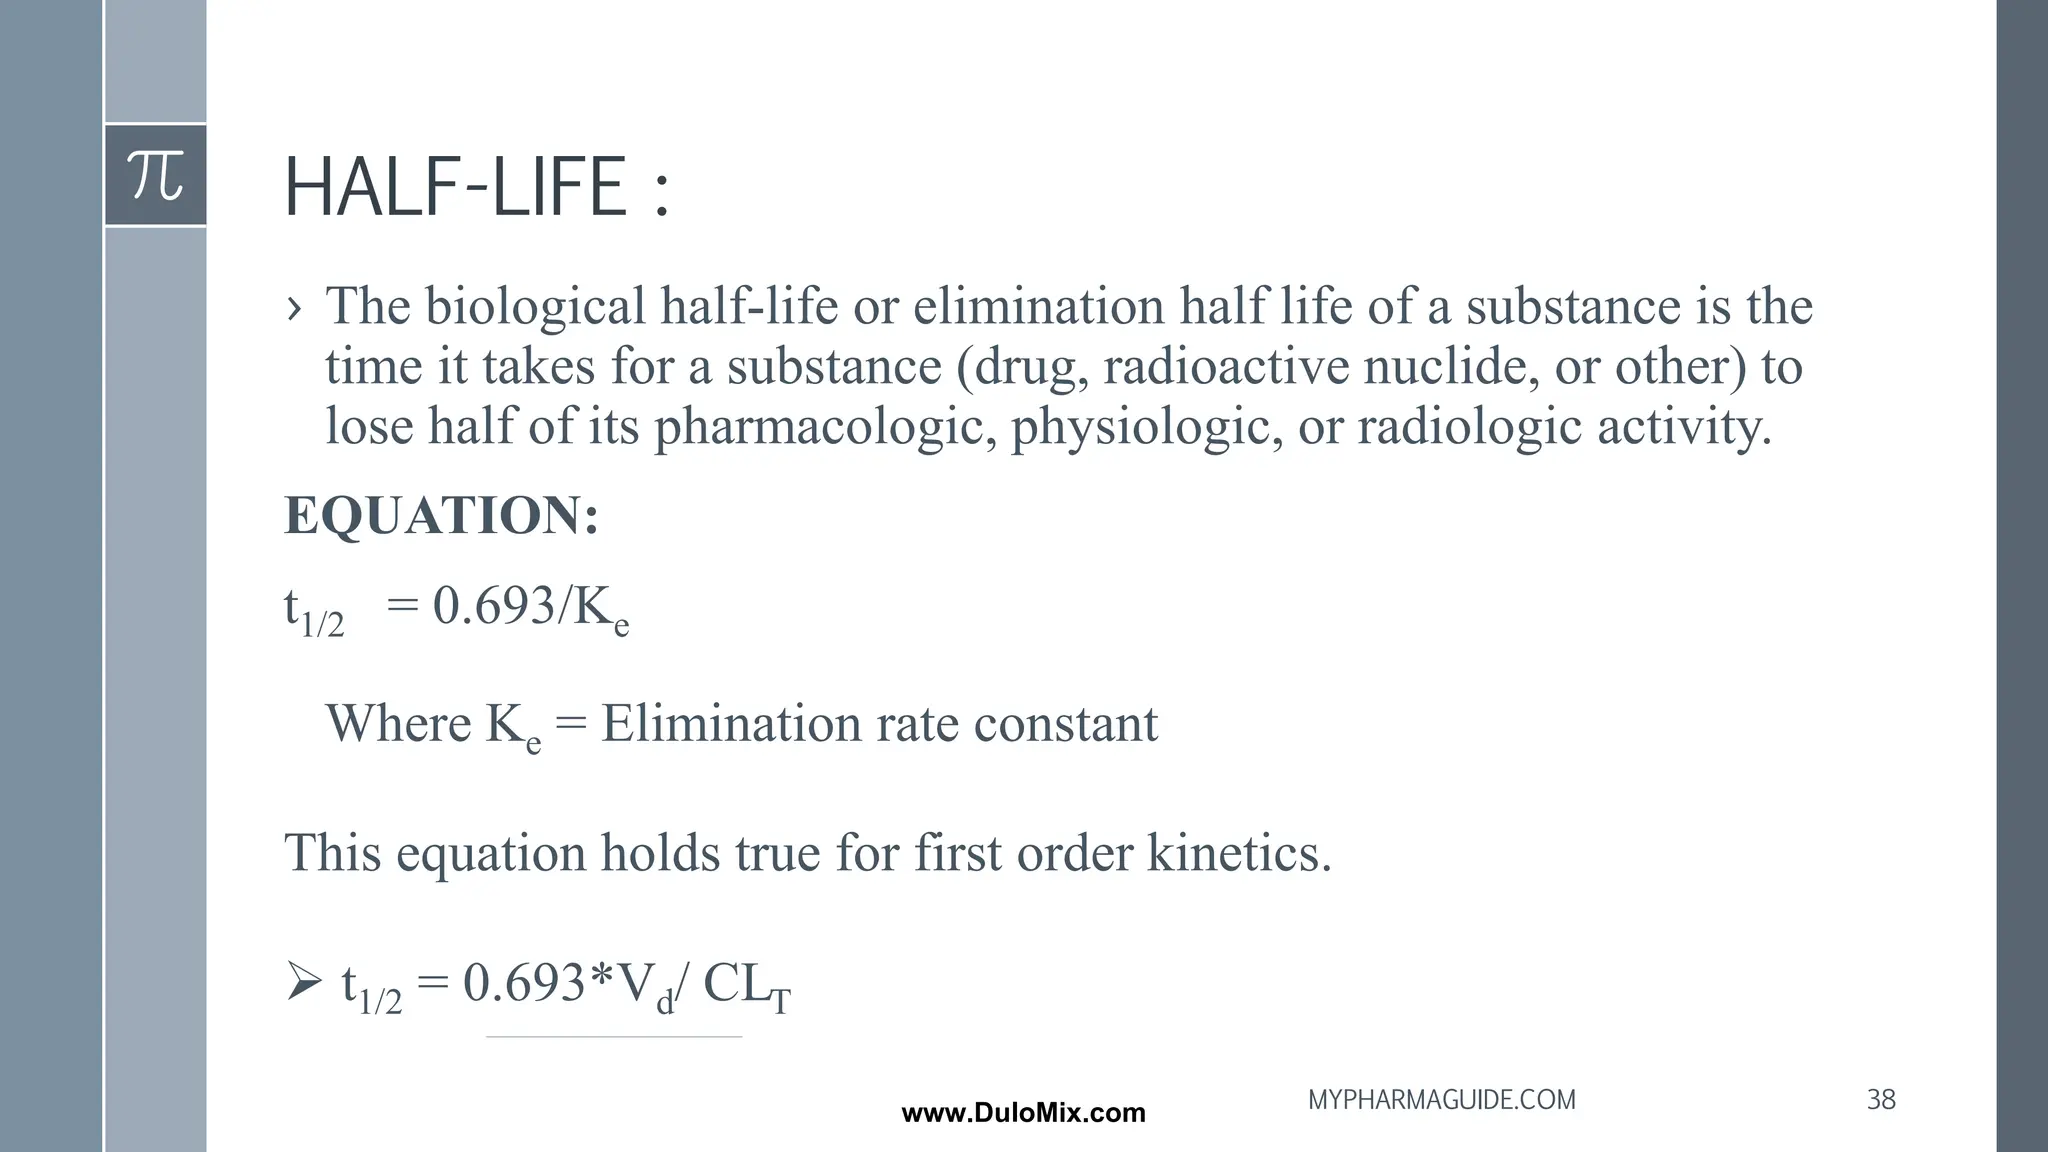
HALF-LIFE :
› Thebiological half-life or elimination half life of a substance is the
time it takes for a substance (drug, radioactive nuclide, or other) to
lose half of its pharmacologic, physiologic, or radiologic activity.
EQUATION:
t1/2 = 0.693/Ke
Where Ke = Elimination rate constant
This equation holds true for first order kinetics.
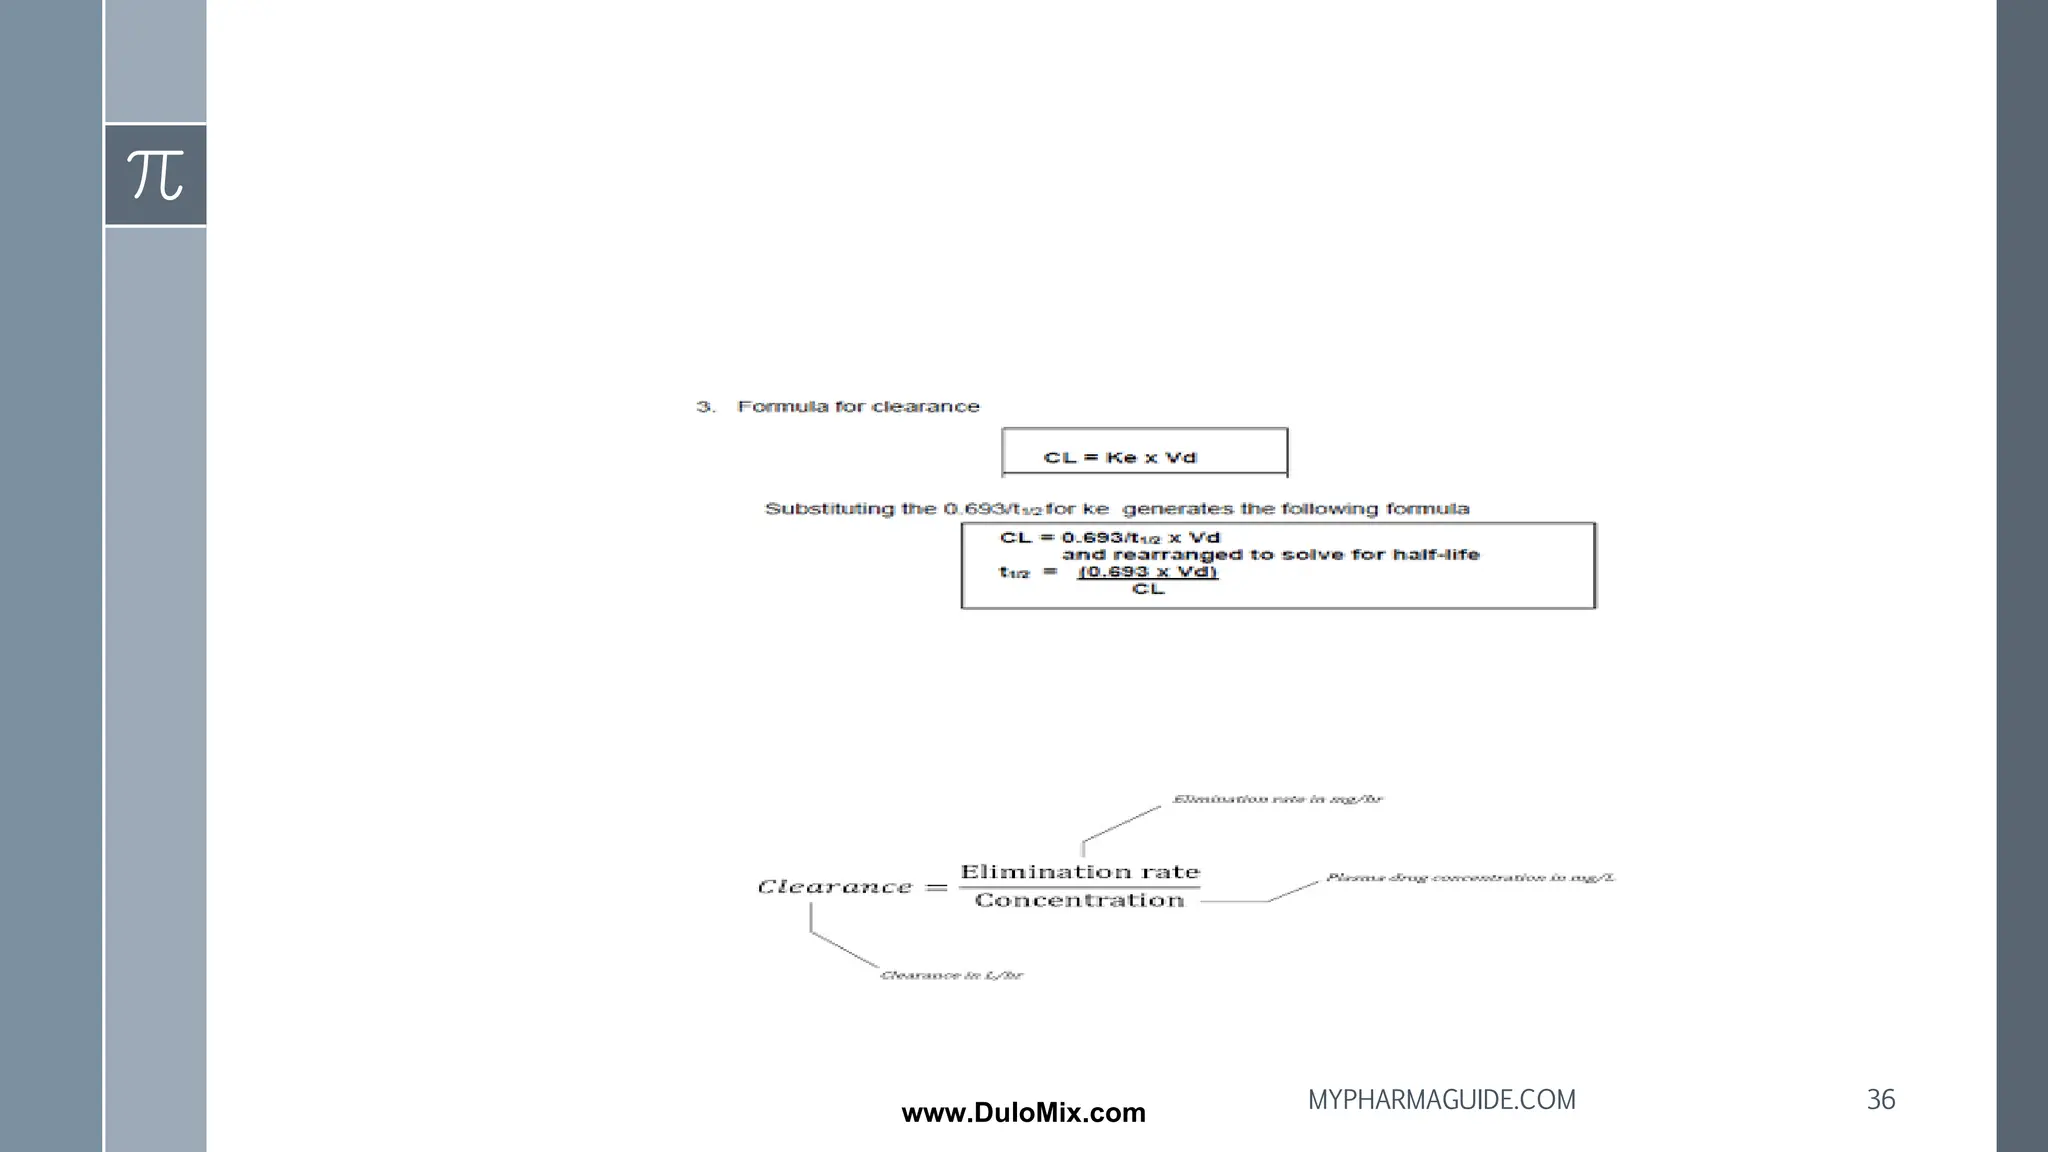
➢ t1/2 = 0.693*Vd/ CLT
38
MYPHARMAGUIDE.COM
www.DuloMix.com
39.
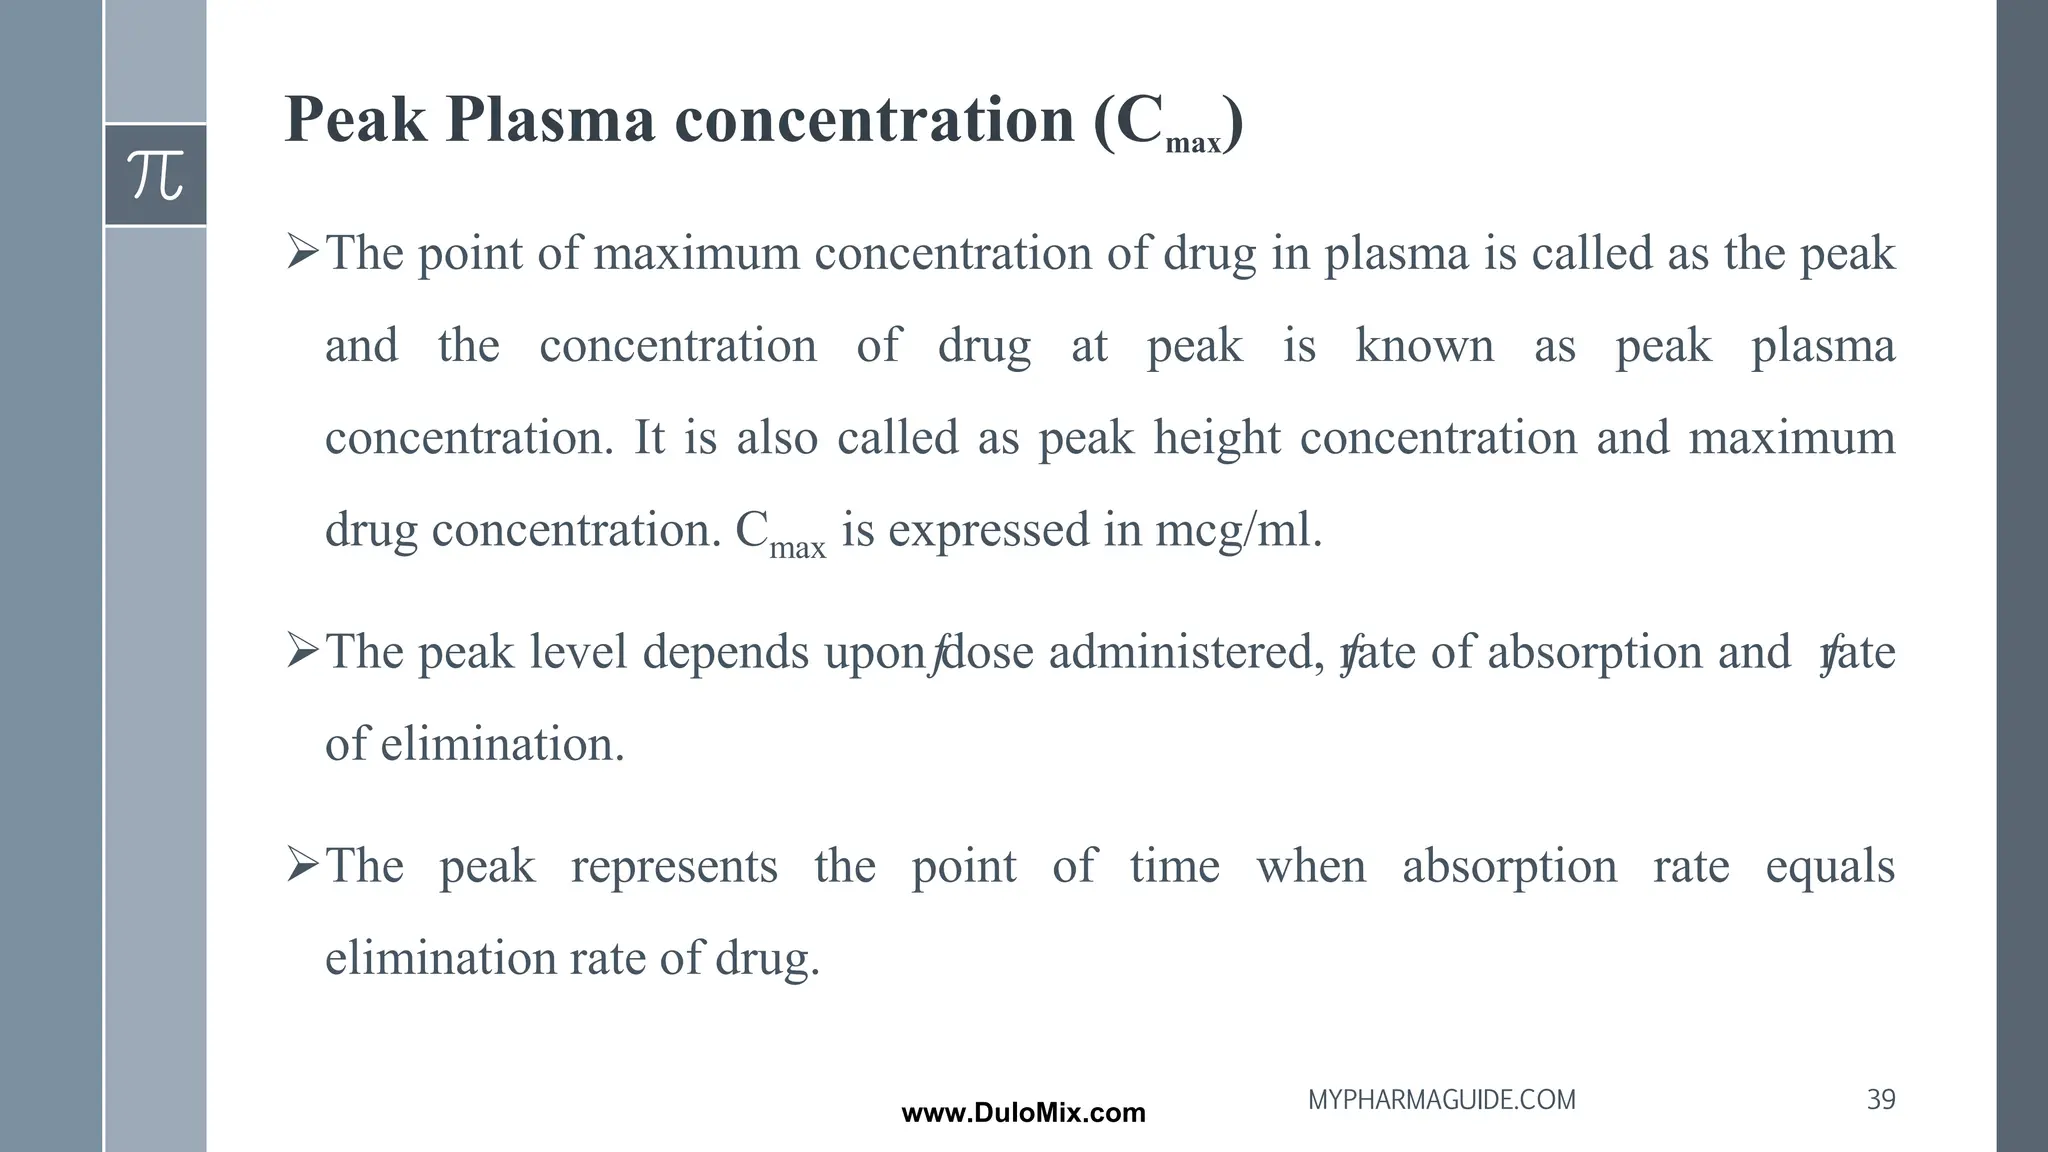
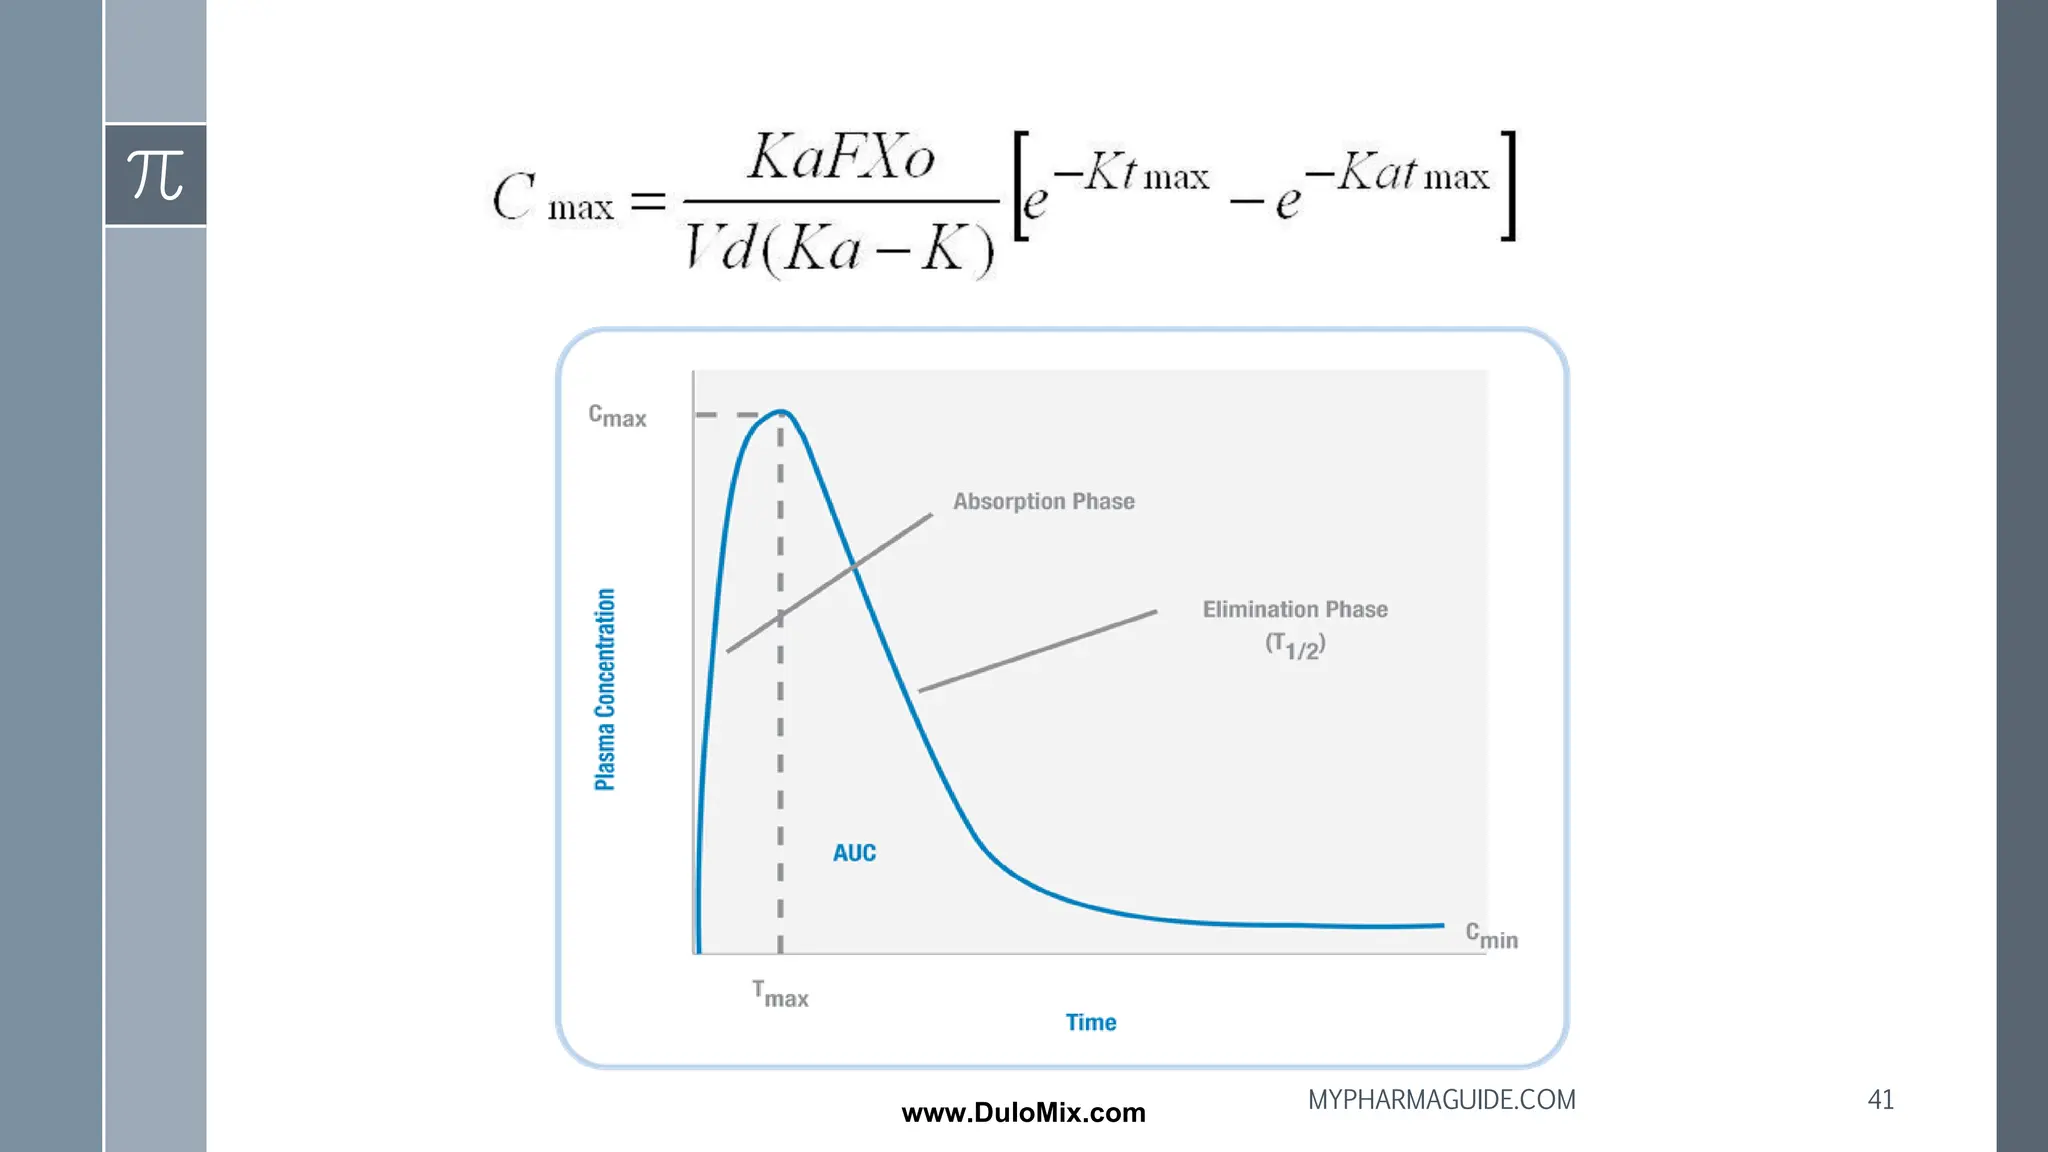
Peak Plasma concentration(Cmax)
➢The point of maximum concentration of drug in plasma is called as the peak
and the concentration of drug at peak is known as peak plasma
concentration. It is also called as peak height concentration and maximum
drug concentration. Cmax is expressed in mcg/ml.
➢The peak level depends uponƒ
dose administered, ƒ
rate of absorption and ƒ
rate
of elimination.
➢The peak represents the point of time when absorption rate equals
elimination rate of drug.
39
MYPHARMAGUIDE.COM
www.DuloMix.com
40.
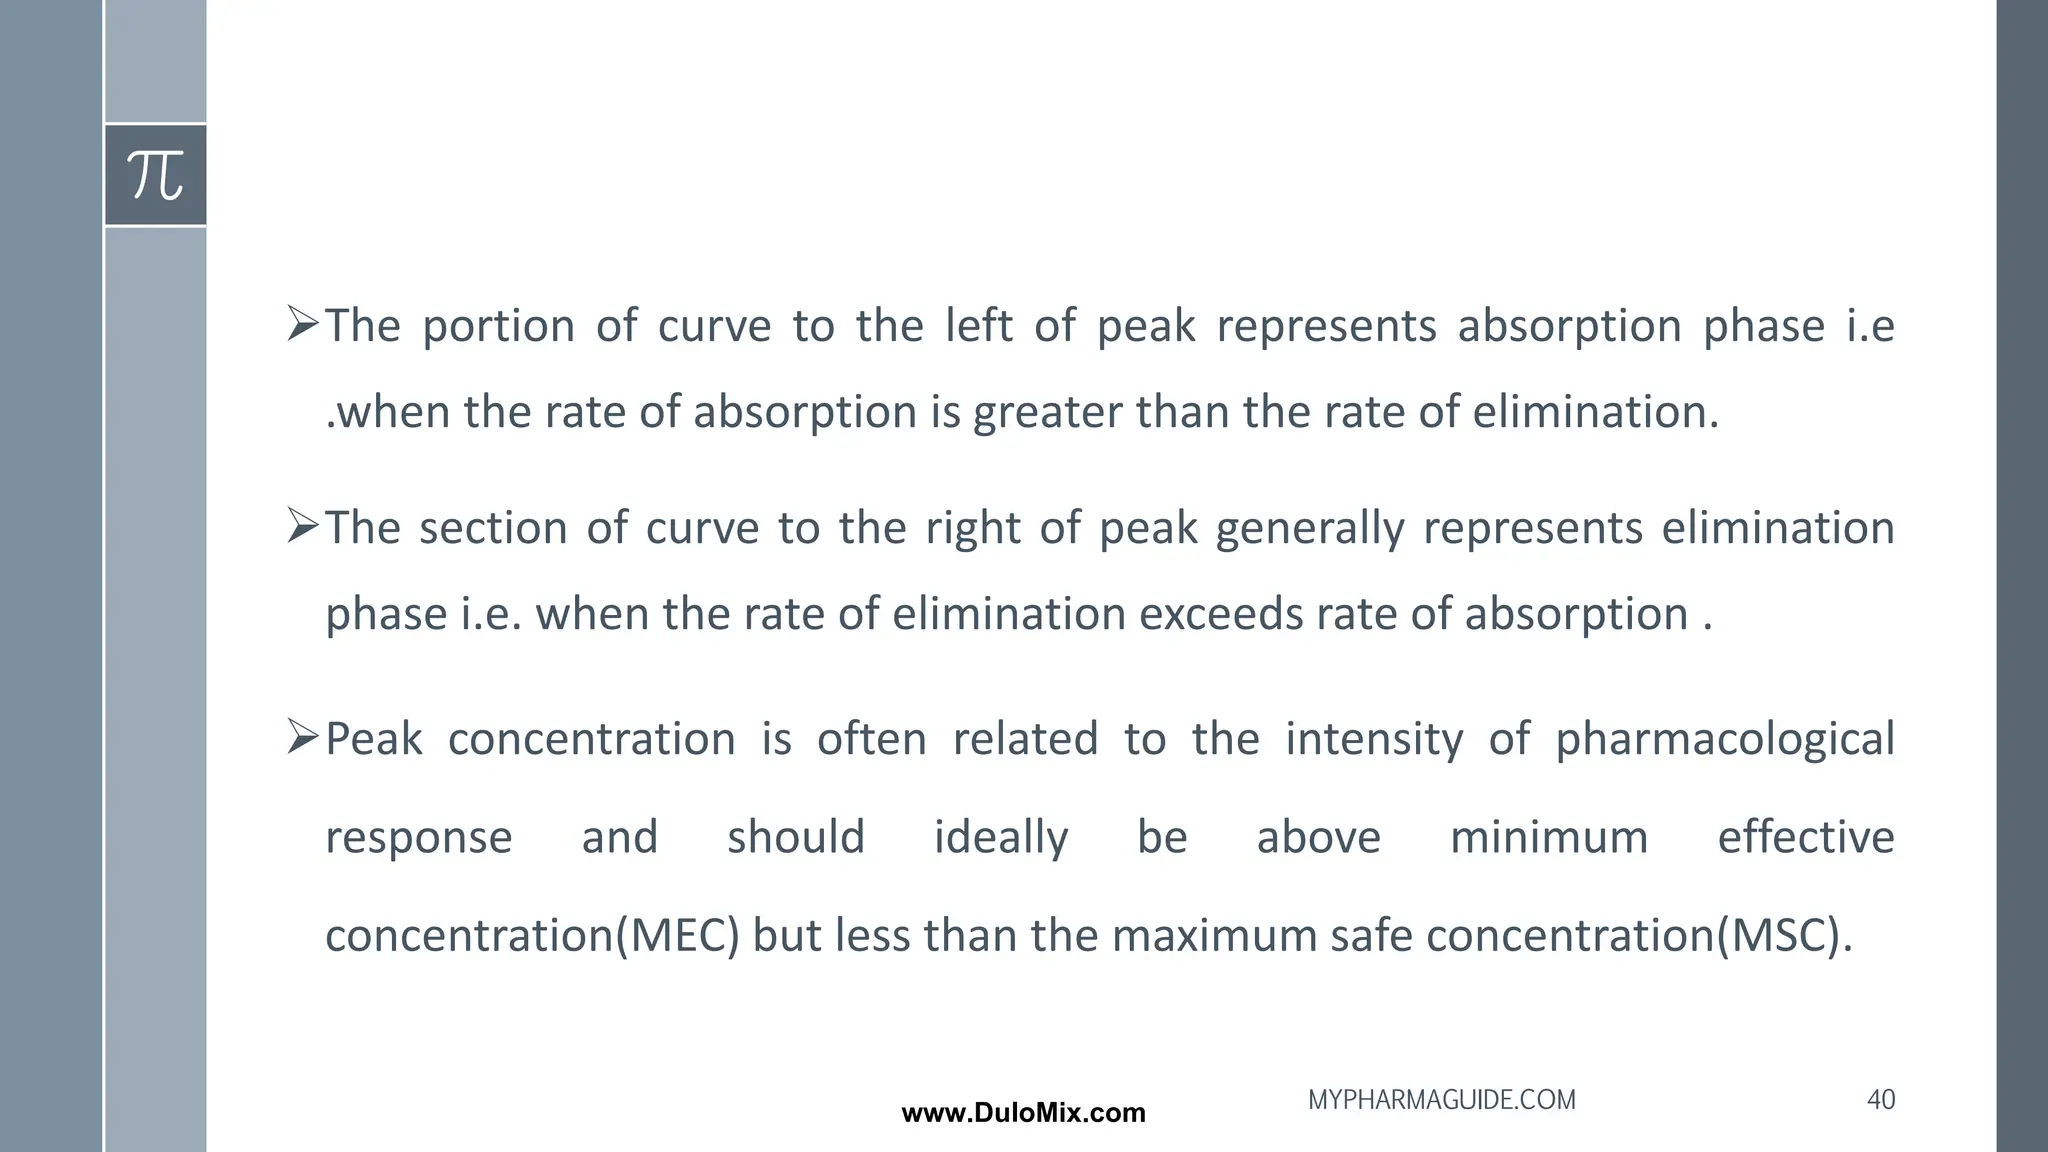
➢The portion ofcurve to the left of peak represents absorption phase i.e
.when the rate of absorption is greater than the rate of elimination.
➢The section of curve to the right of peak generally represents elimination
phase i.e. when the rate of elimination exceeds rate of absorption .
➢Peak concentration is often related to the intensity of pharmacological
response and should ideally be above minimum effective
concentration(MEC) but less than the maximum safe concentration(MSC).
40
MYPHARMAGUIDE.COM
www.DuloMix.com
Time of PeakConcentration (tmax)
➢The time for drug to reach peak concentration in plasma(after extra
vascular administration) is called as the time of peak concentration.
➢It is expressed in hours and is useful in estimating the rate of absorption.
➢Onset time and onset of action are dependent upon tmax.
➢The parameter is of particular importance in assessing the efficacy of drug
used to treat acute conditions like pain and insomnia which can be treated
by a single dose.
42
MYPHARMAGUIDE.COM
www.DuloMix.com
Area Under theCurve(AUC)
➢ It represents the total integrated area under the plasma level‐
time profile and expresses the total amount of drug that comes
into the systemic circulation after its administration.
➢ AUC is expressed in mcg/ml * hours.
➢ It is the most important parameter in evaluating the
bioavailability of a drug from its dosage form as it represents the extent of absorption.
➢ AUC is also important for drugs that are administered repetitively for
the treatment of chronic conditions like asthma or epilepsy.
44
MYPHARMAGUIDE.COM
www.DuloMix.com
45.
Methods to measureAUC
1. Planimeter → An instrument for mechanically measuring the area of plane figures
2. “Cut and weigh” method
3. Trapezoidal rule
– Linear method
– Logarithmic method
4. Integration method
5. Tai’s formula
45
MYPHARMAGUIDE.COM
www.DuloMix.com
46.
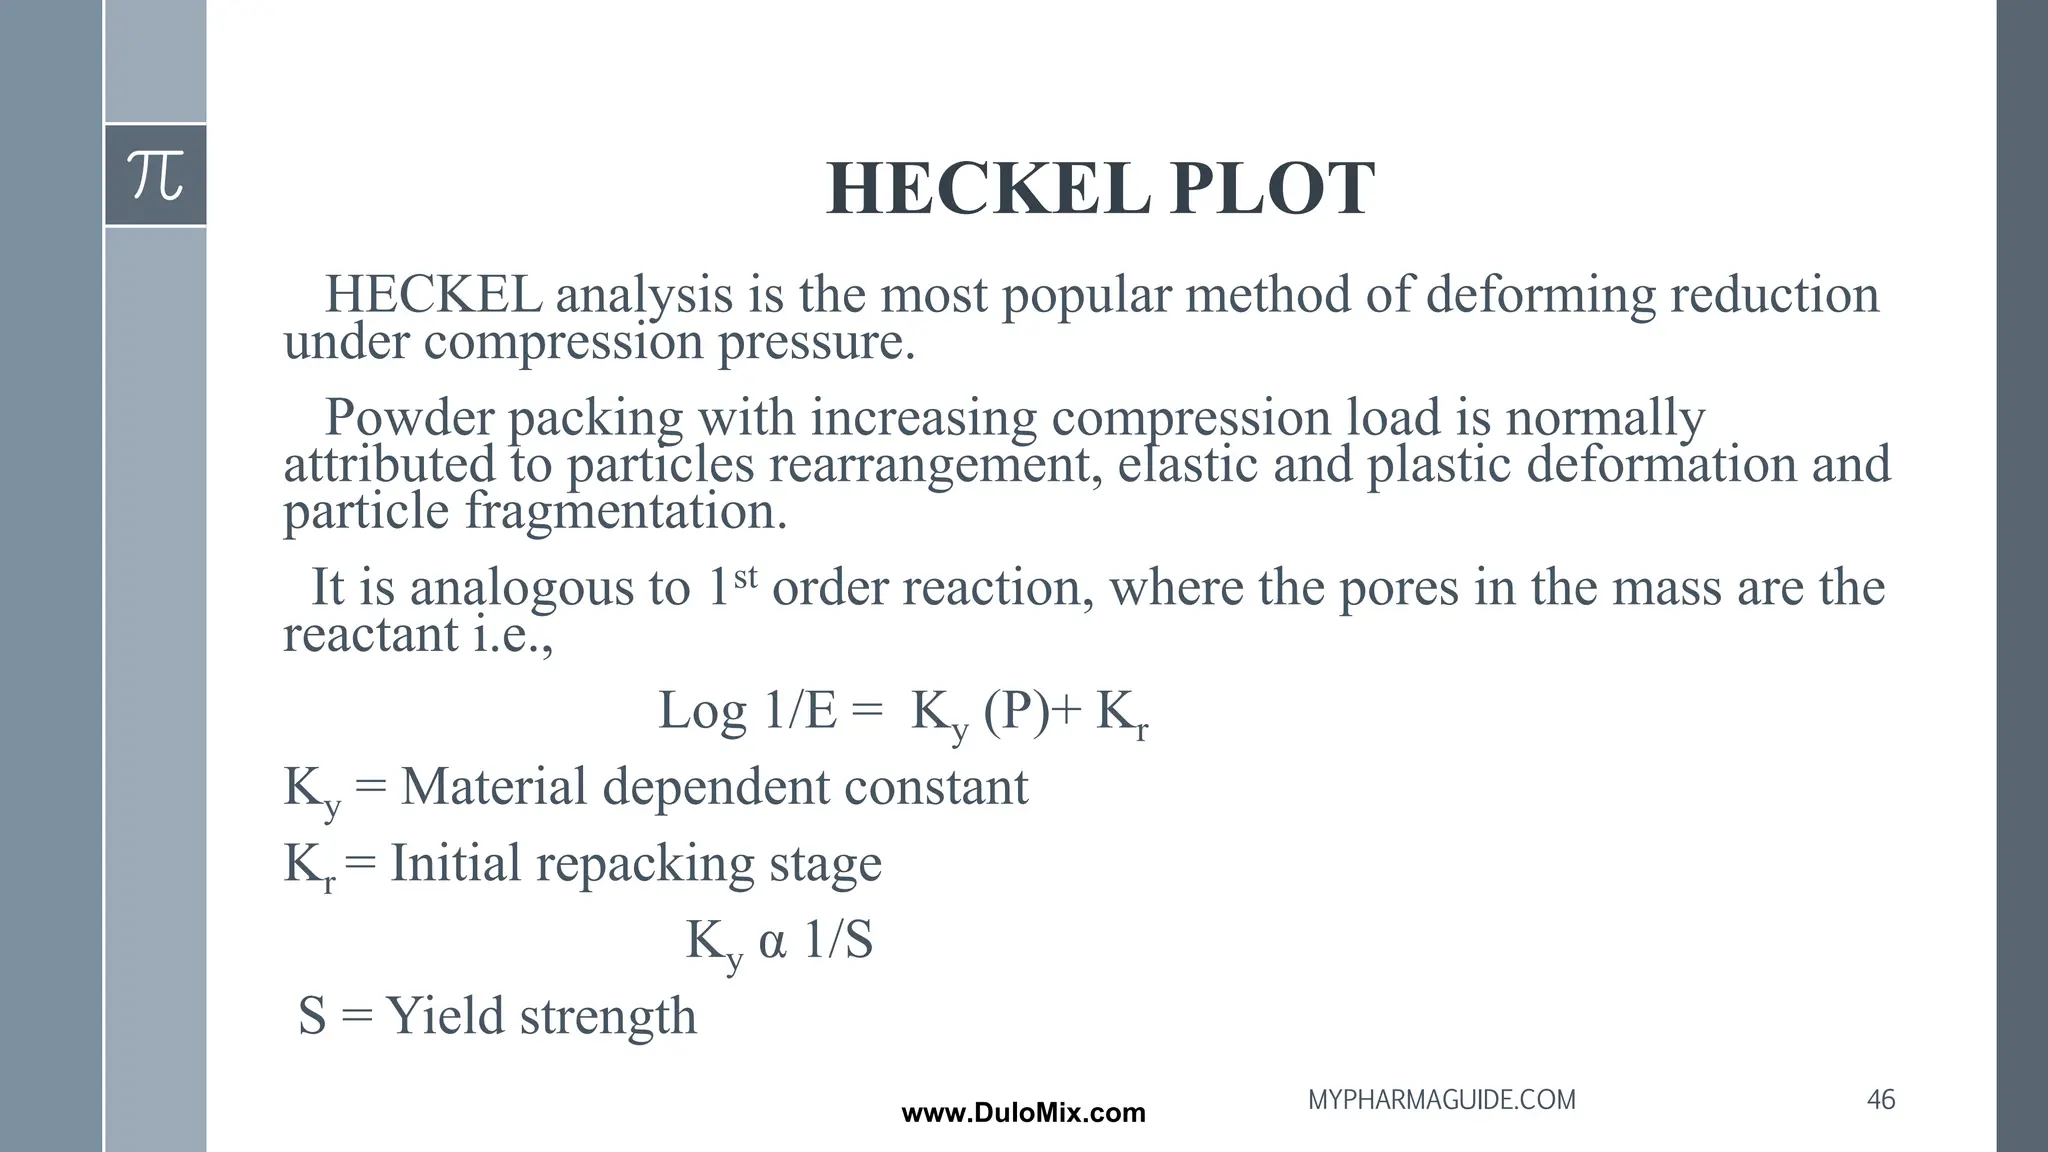
HECKEL PLOT
HECKEL analysisis the most popular method of deforming reduction
under compression pressure.
Powder packing with increasing compression load is normally
attributed to particles rearrangement, elastic and plastic deformation and
particle fragmentation.
It is analogous to 1st order reaction, where the pores in the mass are the
reactant i.e.,
Log 1/E = Ky (P)+ Kr
Ky = Material dependent constant
Kr = Initial repacking stage
Ky α 1/S
S = Yield strength
46
MYPHARMAGUIDE.COM
www.DuloMix.com
47.
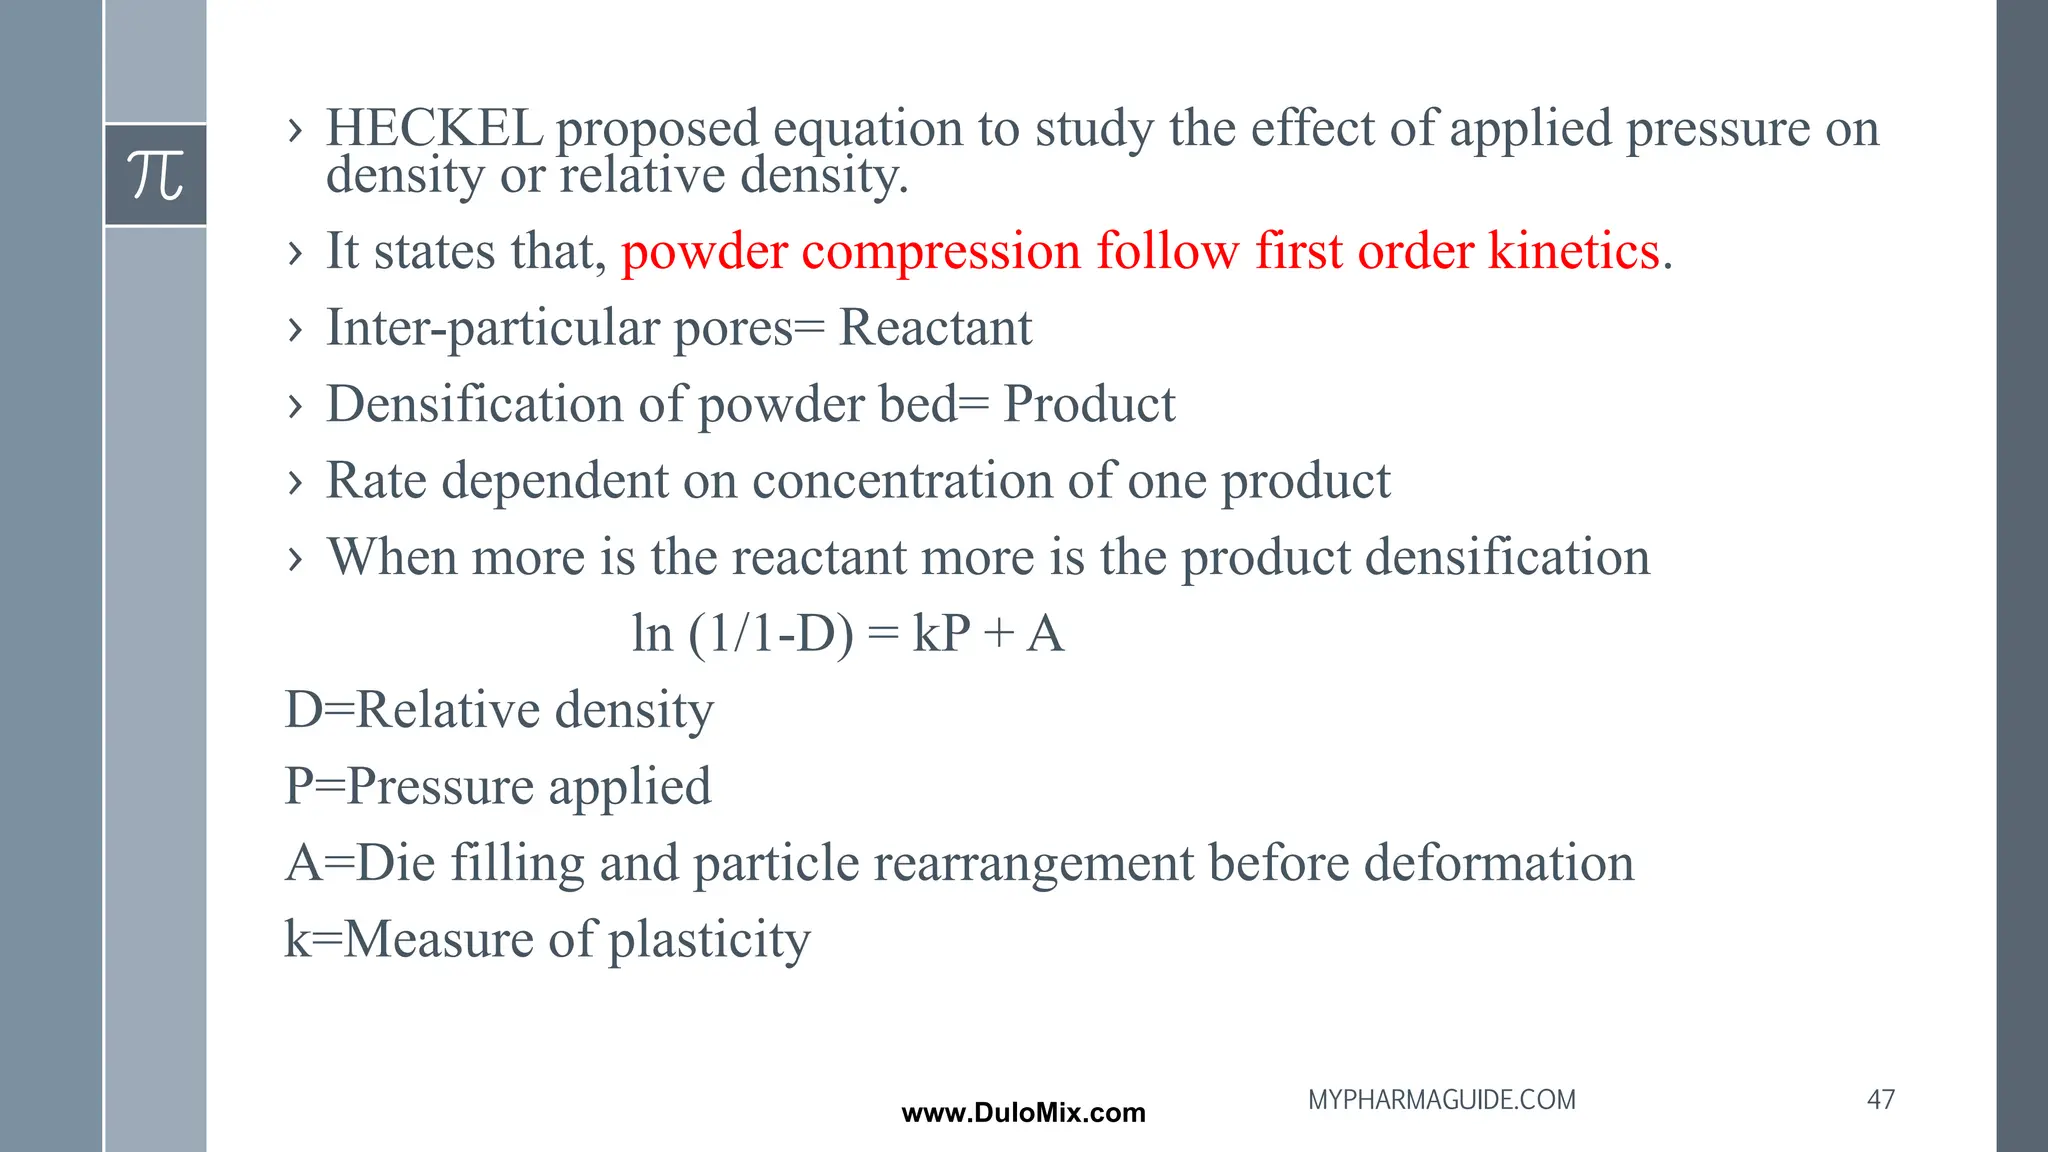
› HECKEL proposedequation to study the effect of applied pressure on
density or relative density.
› It states that, powder compression follow first order kinetics.
› Inter-particular pores= Reactant
› Densification of powder bed= Product
› Rate dependent on concentration of one product
› When more is the reactant more is the product densification
ln (1/1-D) = kP + A
D=Relative density
P=Pressure applied
A=Die filling and particle rearrangement before deformation
k=Measure of plasticity
47
MYPHARMAGUIDE.COM
www.DuloMix.com
48.
Relative density= Densityof powder
True density of material
D=1 {when no pores left after compression}
D=0.3 or 0.1 {30% or 10% of volume of tablet consists of
Pores [porosity]}
Porosity(E) = 1-D
48
MYPHARMAGUIDE.COM
www.DuloMix.com
49.
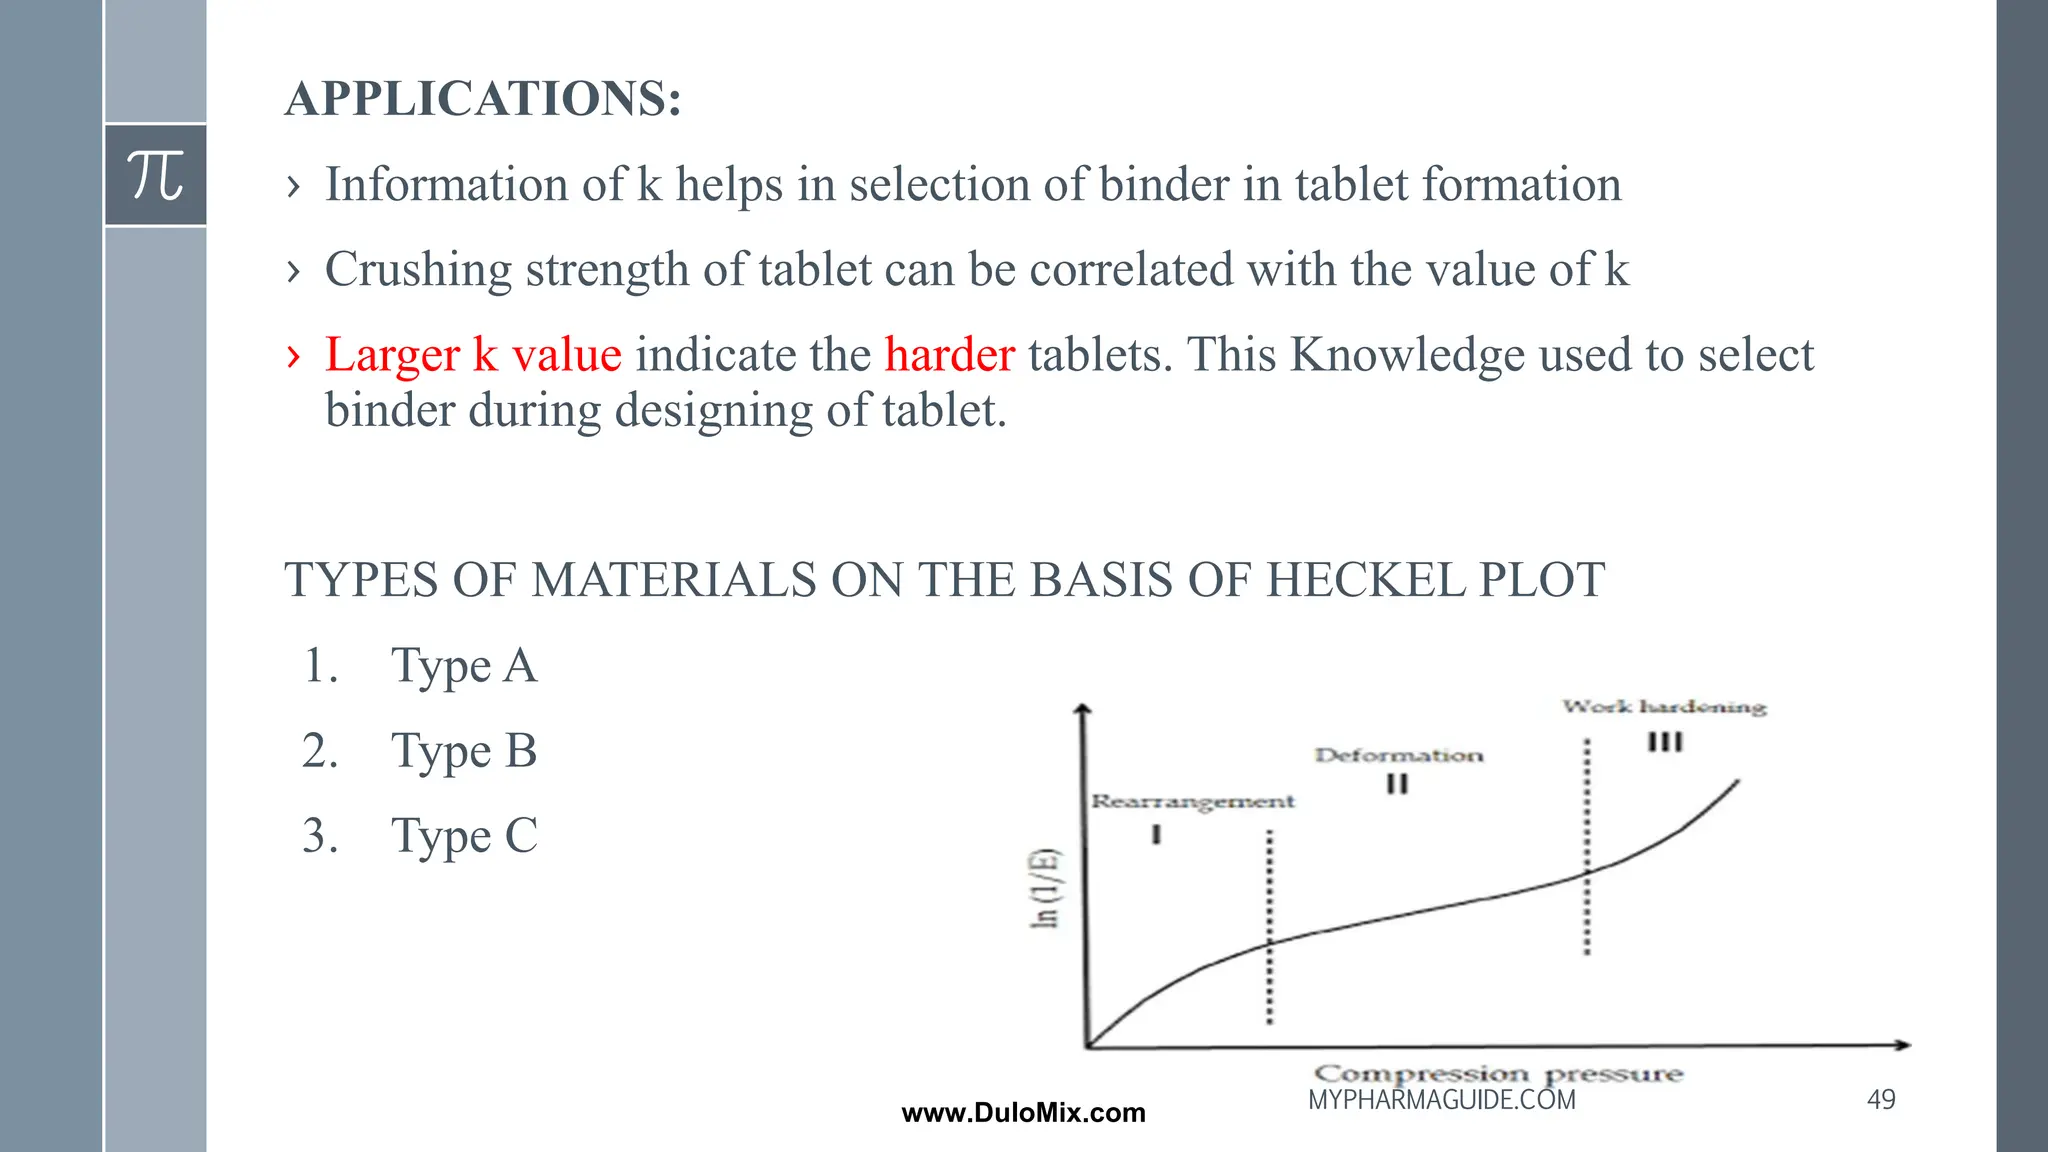
APPLICATIONS:
› Information ofk helps in selection of binder in tablet formation
› Crushing strength of tablet can be correlated with the value of k
› Larger k value indicate the harder tablets. This Knowledge used to select
binder during designing of tablet.
TYPES OF MATERIALS ON THE BASIS OF HECKEL PLOT
1. Type A
2. Type B
3. Type C
49
MYPHARMAGUIDE.COM
www.DuloMix.com
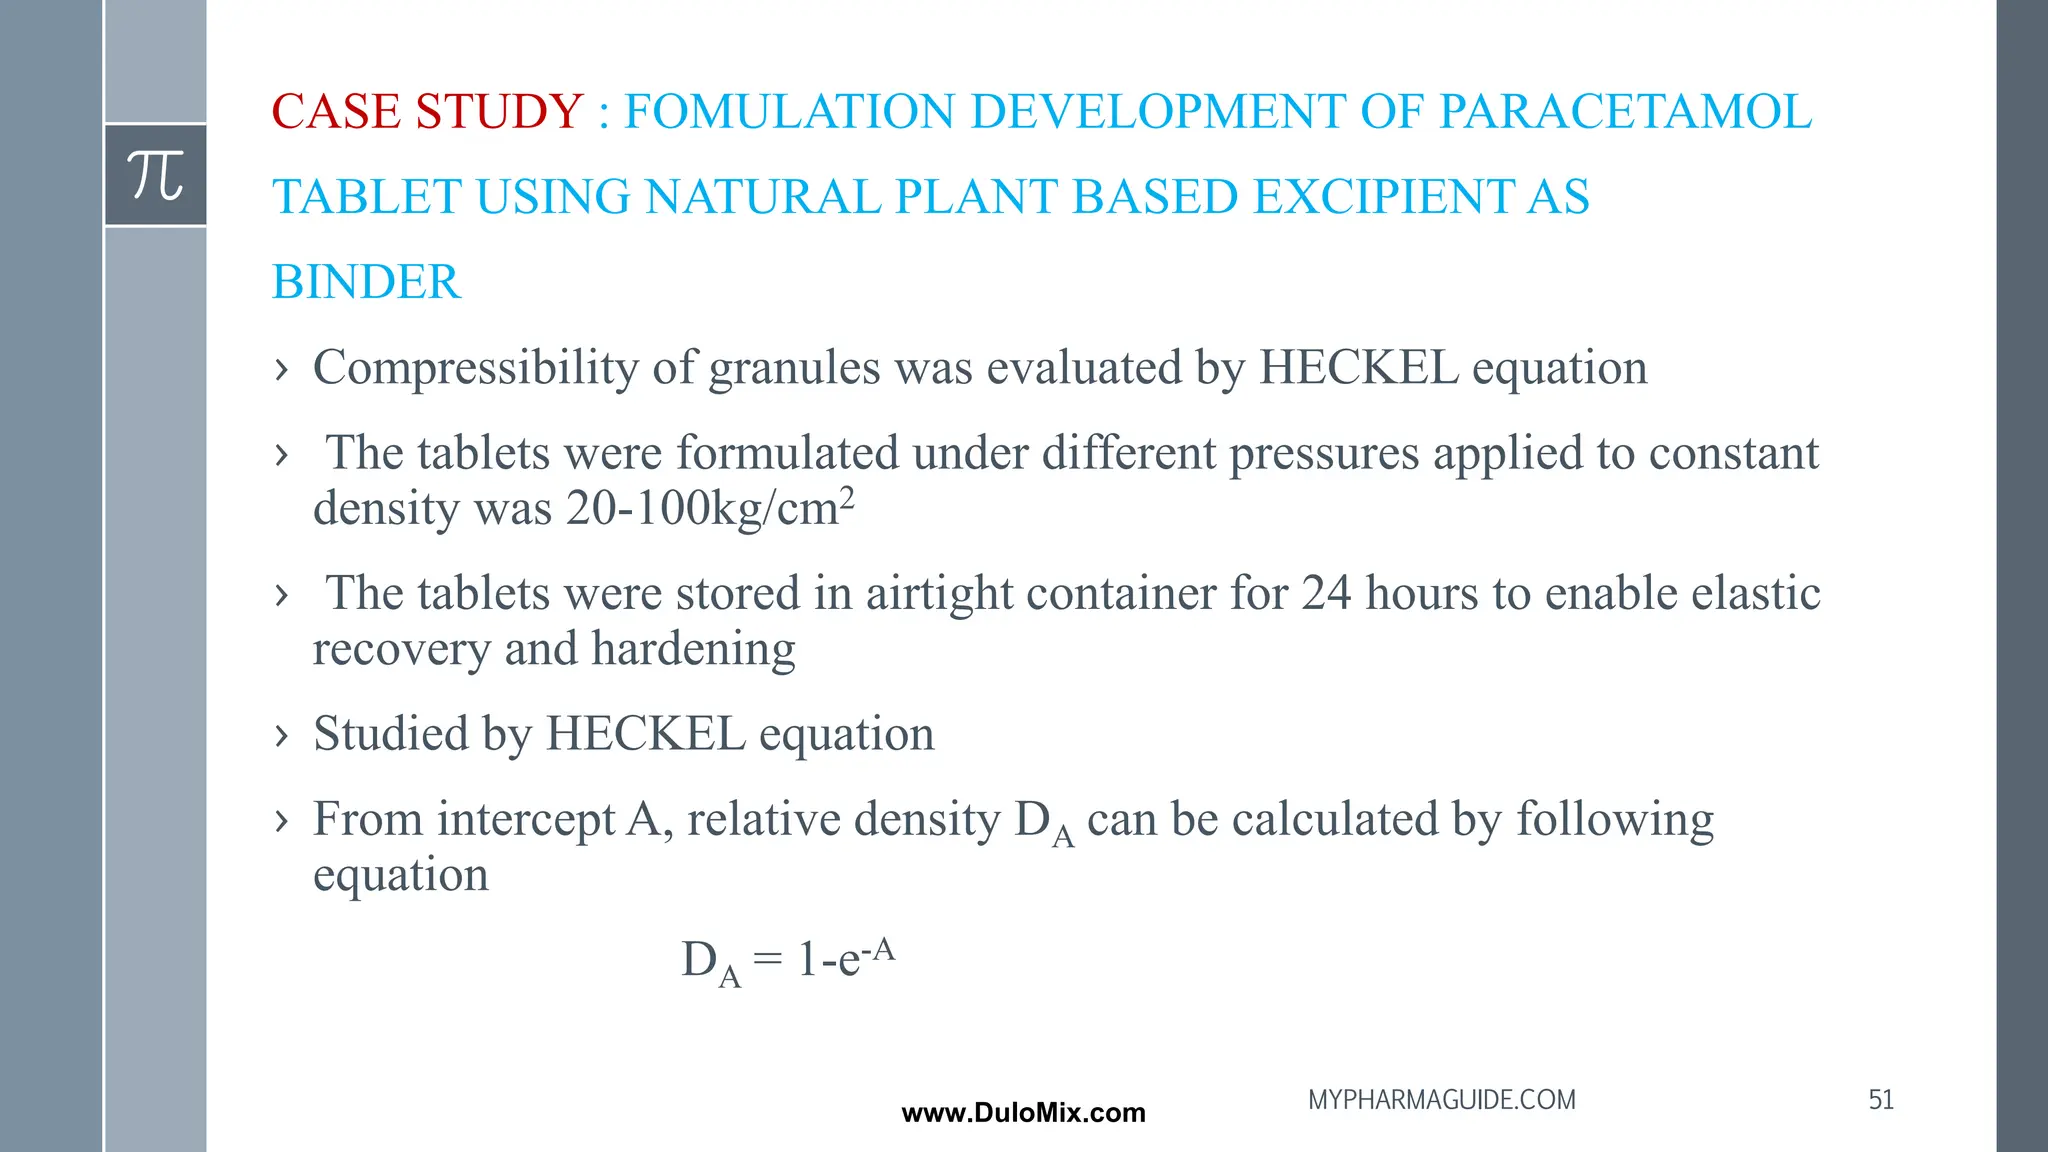
CASE STUDY :FOMULATION DEVELOPMENT OF PARACETAMOL
TABLET USING NATURAL PLANT BASED EXCIPIENT AS
BINDER
› Compressibility of granules was evaluated by HECKEL equation
› The tablets were formulated under different pressures applied to constant
density was 20-100kg/cm2
› The tablets were stored in airtight container for 24 hours to enable elastic
recovery and hardening
› Studied by HECKEL equation
› From intercept A, relative density DA can be calculated by following
equation
DA = 1-e-A
51
MYPHARMAGUIDE.COM
www.DuloMix.com
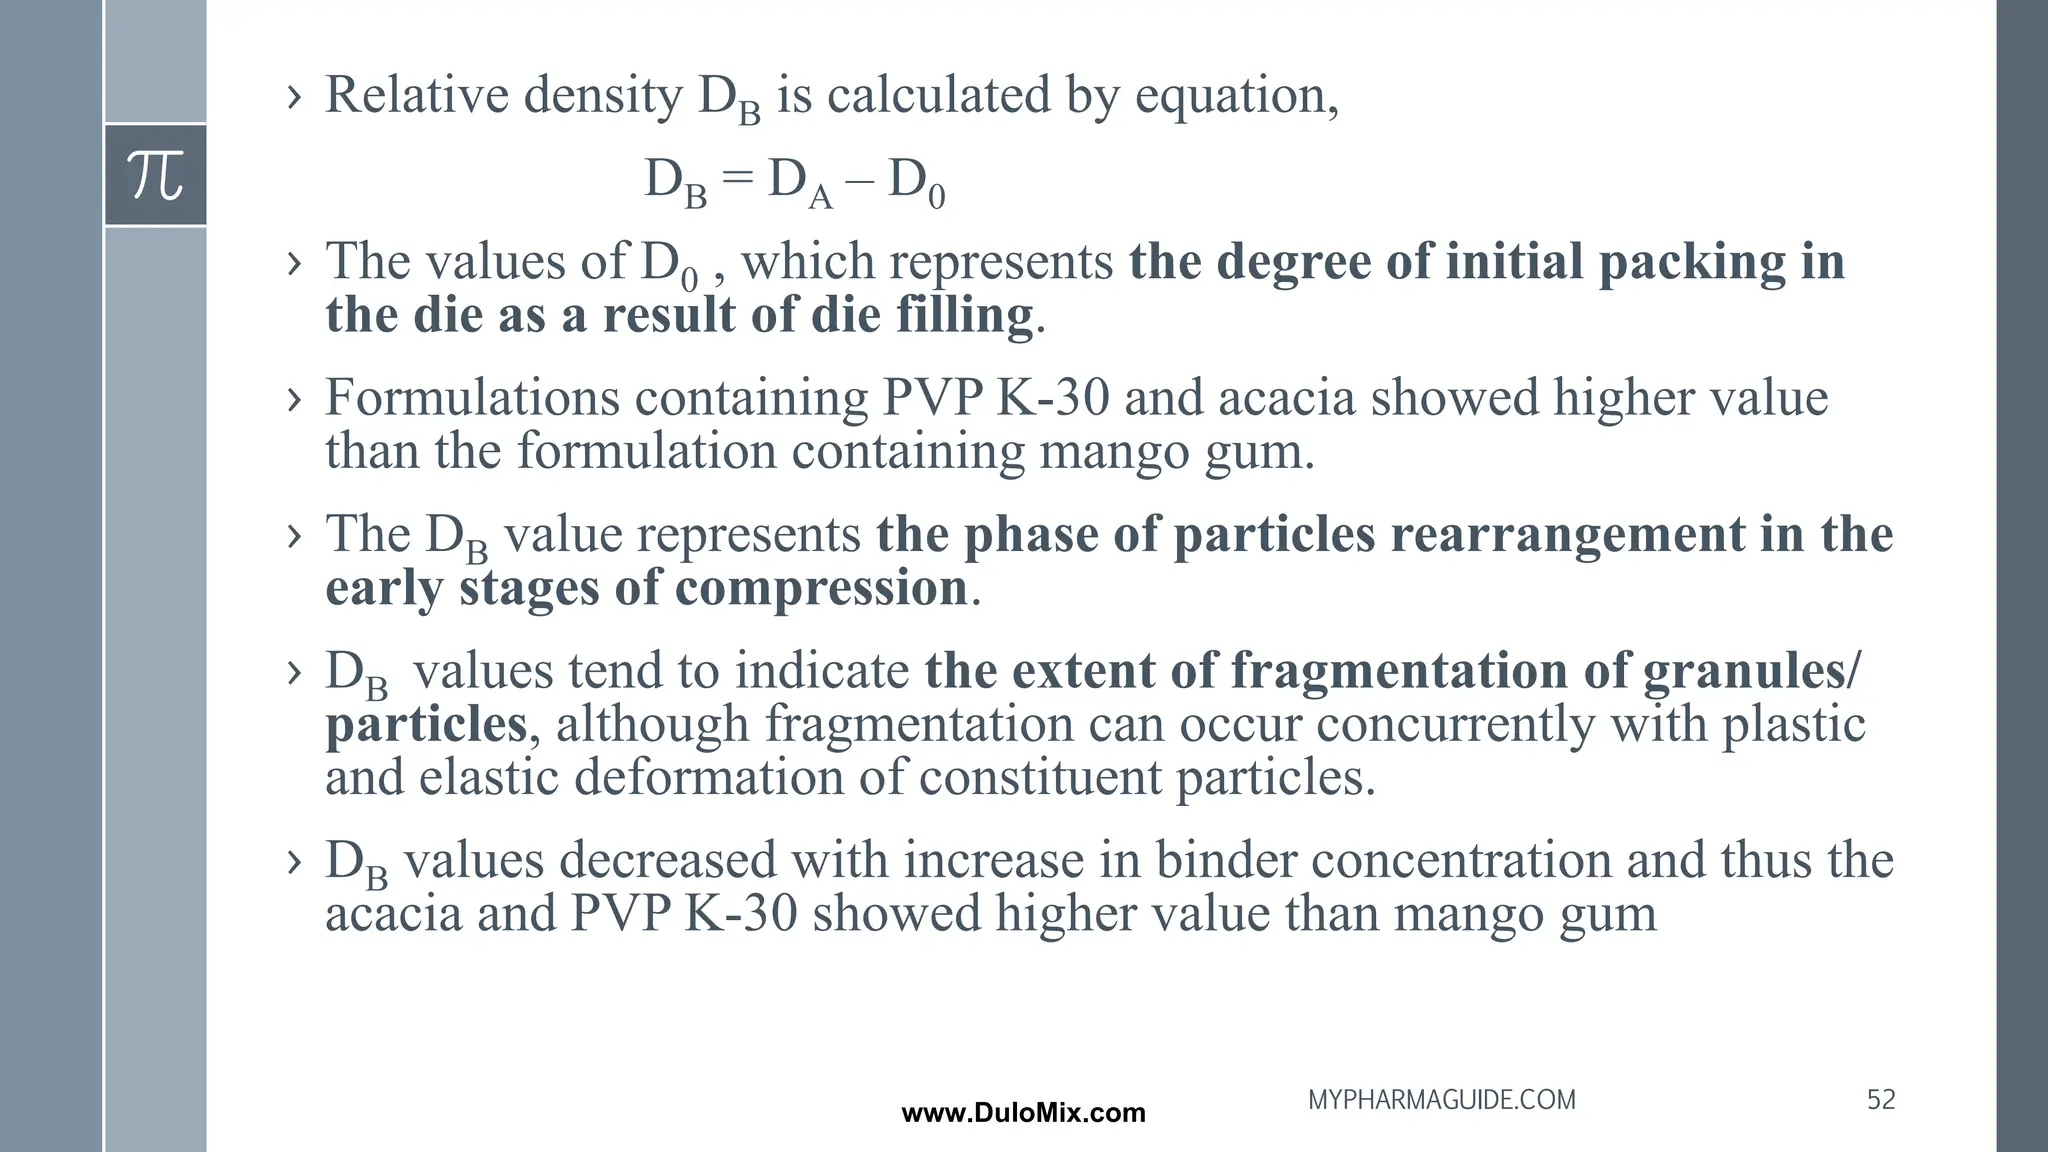
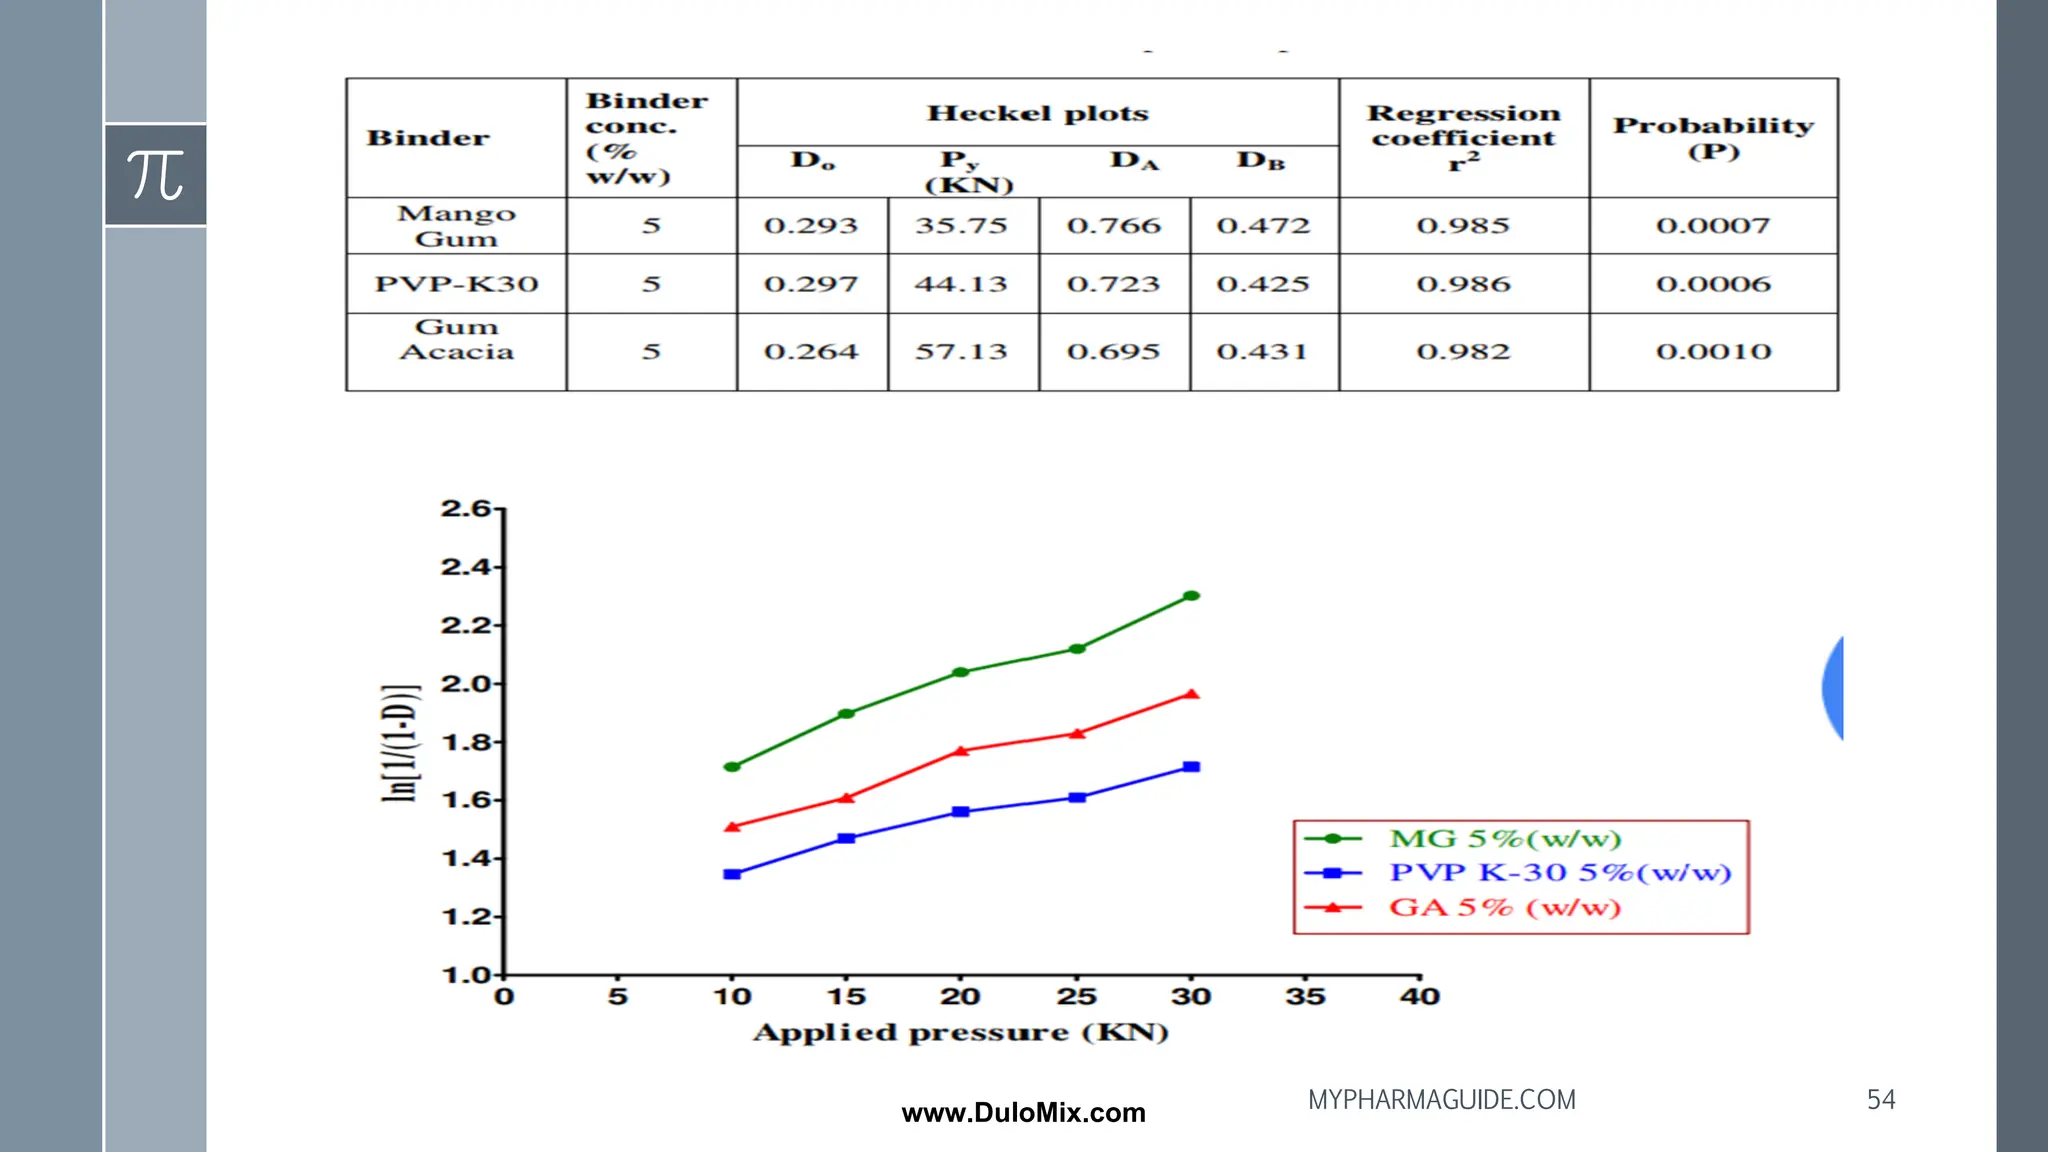
52.
› Relative densityDB is calculated by equation,
DB = DA – D0
› The values of D0 , which represents the degree of initial packing in
the die as a result of die filling.
› Formulations containing PVP K-30 and acacia showed higher value
than the formulation containing mango gum.
› The DB value represents the phase of particles rearrangement in the
early stages of compression.
› DB values tend to indicate the extent of fragmentation of granules/
particles, although fragmentation can occur concurrently with plastic
and elastic deformation of constituent particles.
› DB values decreased with increase in binder concentration and thus the
acacia and PVP K-30 showed higher value than mango gum
52
MYPHARMAGUIDE.COM
www.DuloMix.com
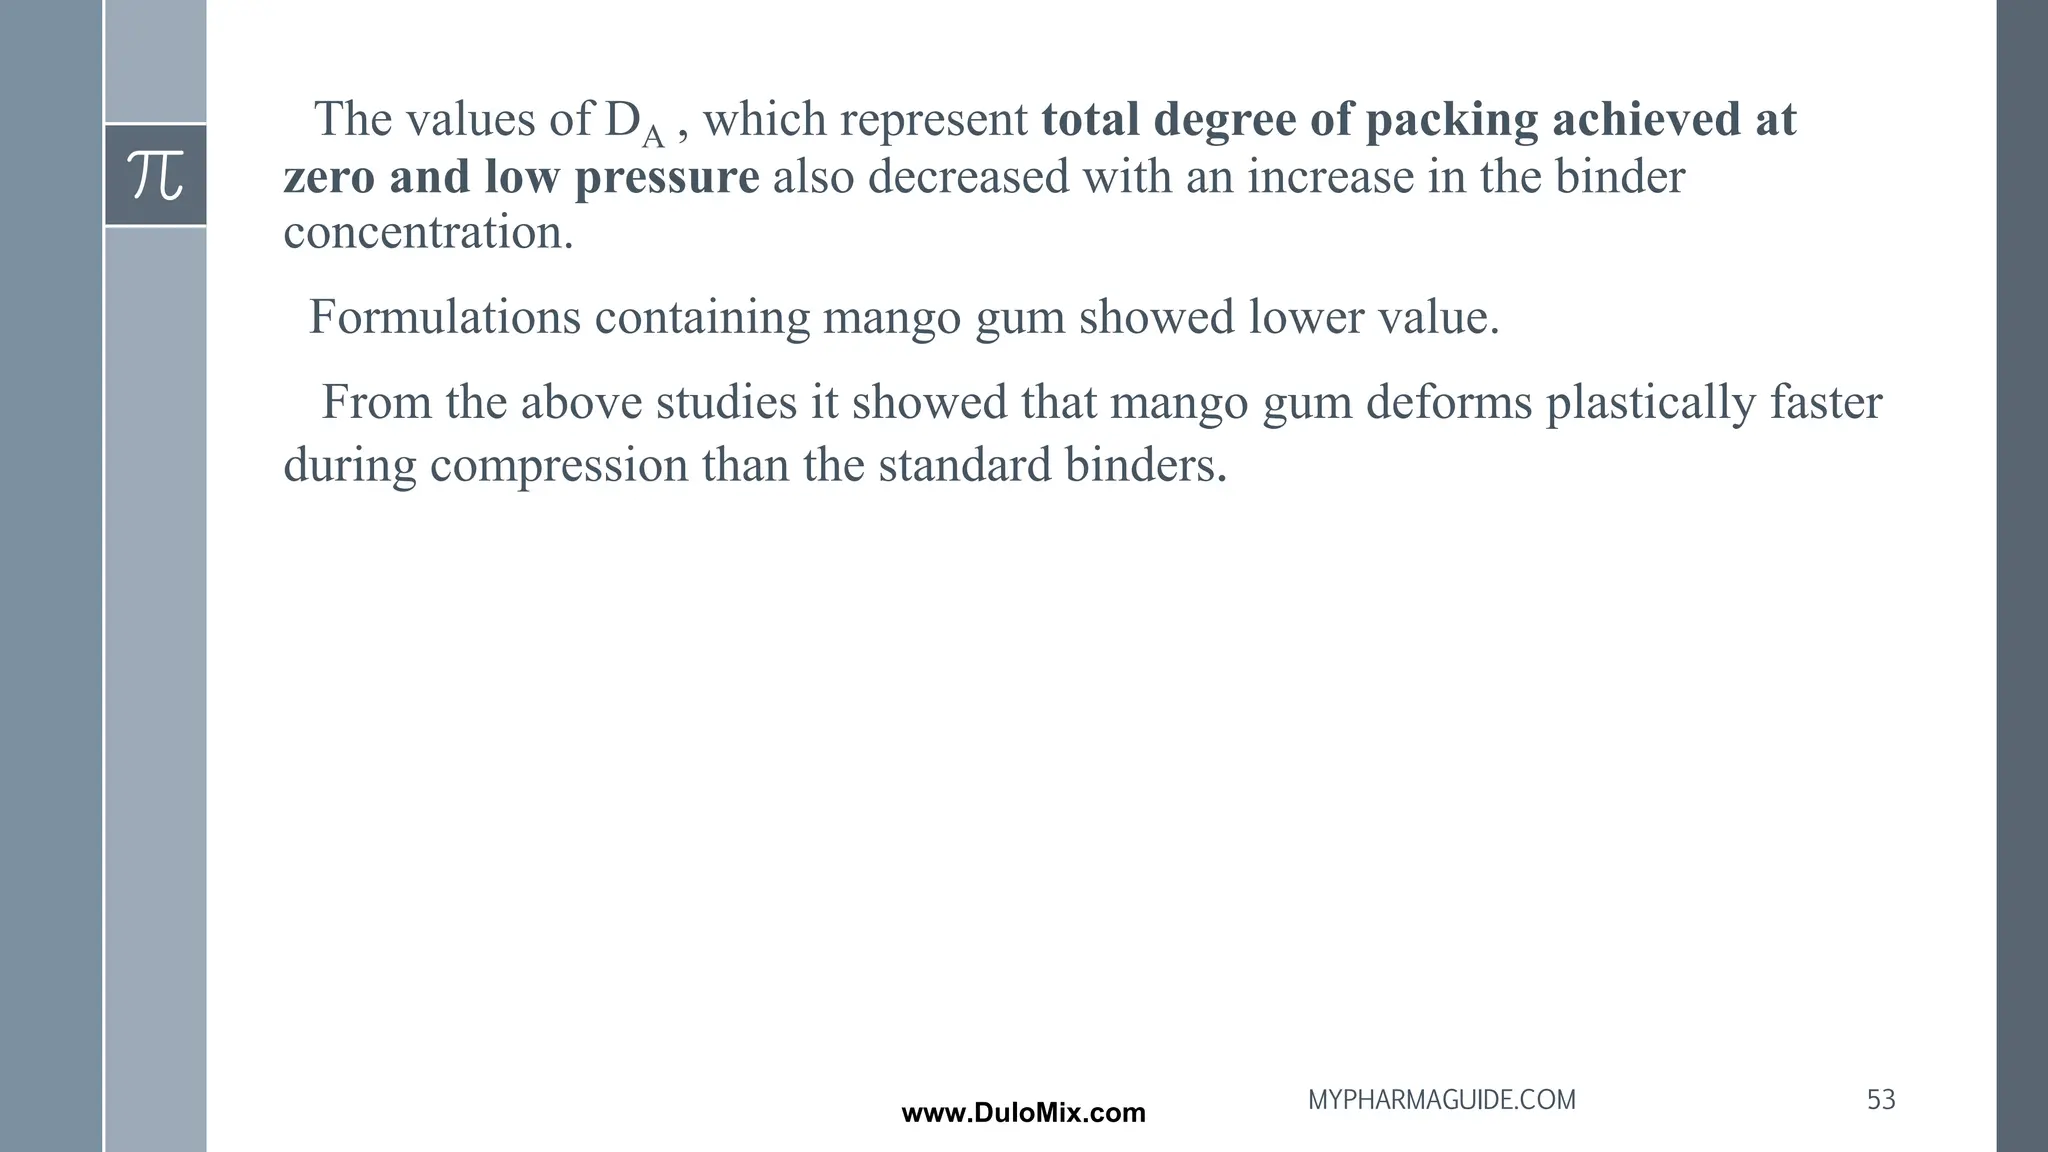
53.
The values ofDA , which represent total degree of packing achieved at
zero and low pressure also decreased with an increase in the binder
concentration.
Formulations containing mango gum showed lower value.
From the above studies it showed that mango gum deforms plastically faster
during compression than the standard binders.
53
MYPHARMAGUIDE.COM
www.DuloMix.com
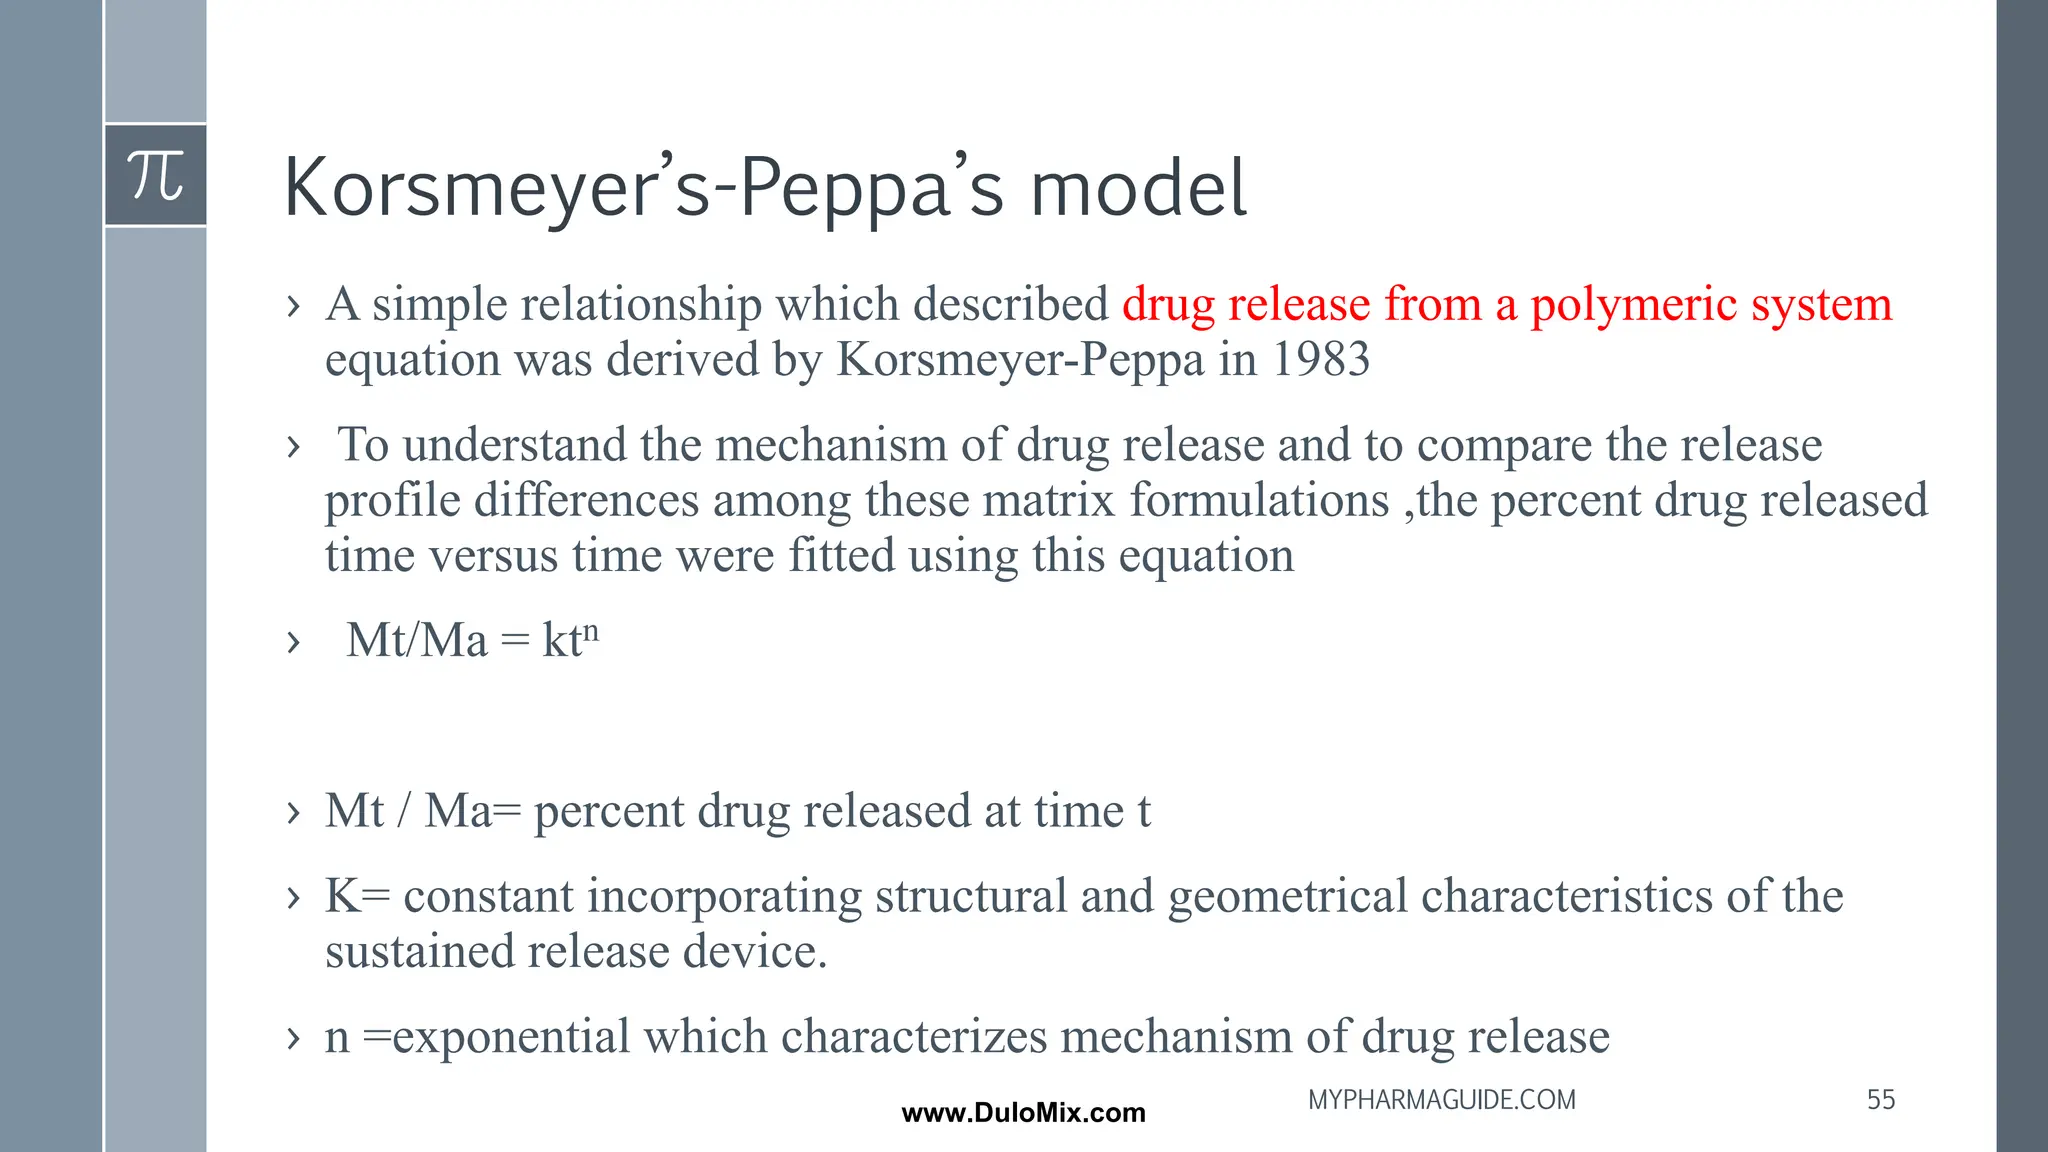
Korsmeyer’s-Peppa’s model
› Asimple relationship which described drug release from a polymeric system
equation was derived by Korsmeyer-Peppa in 1983
› To understand the mechanism of drug release and to compare the release
profile differences among these matrix formulations ,the percent drug released
time versus time were fitted using this equation
› Mt/Ma = ktn
› Mt / Ma= percent drug released at time t
› K= constant incorporating structural and geometrical characteristics of the
sustained release device.
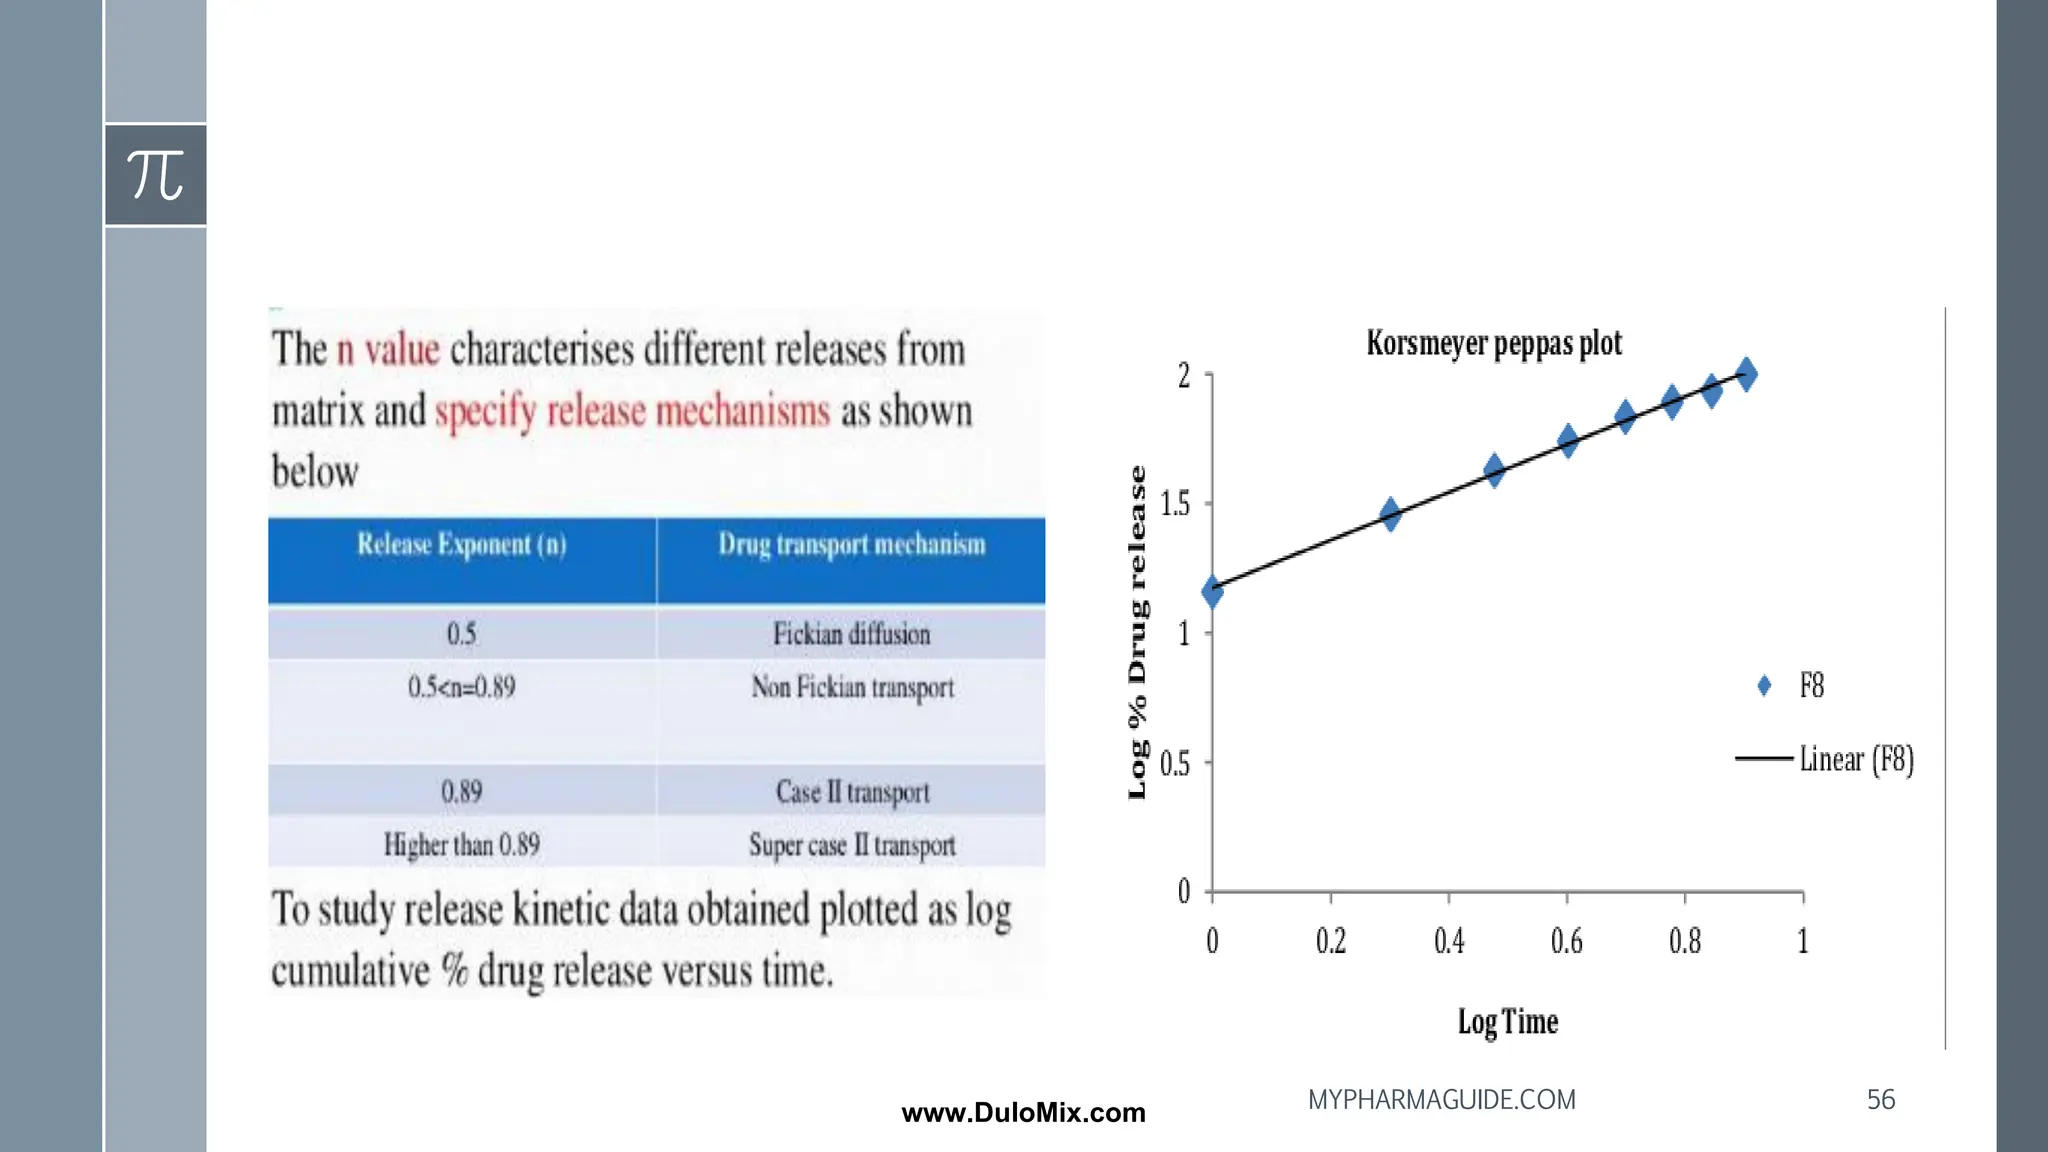
› n =exponential which characterizes mechanism of drug release
55
MYPHARMAGUIDE.COM
www.DuloMix.com
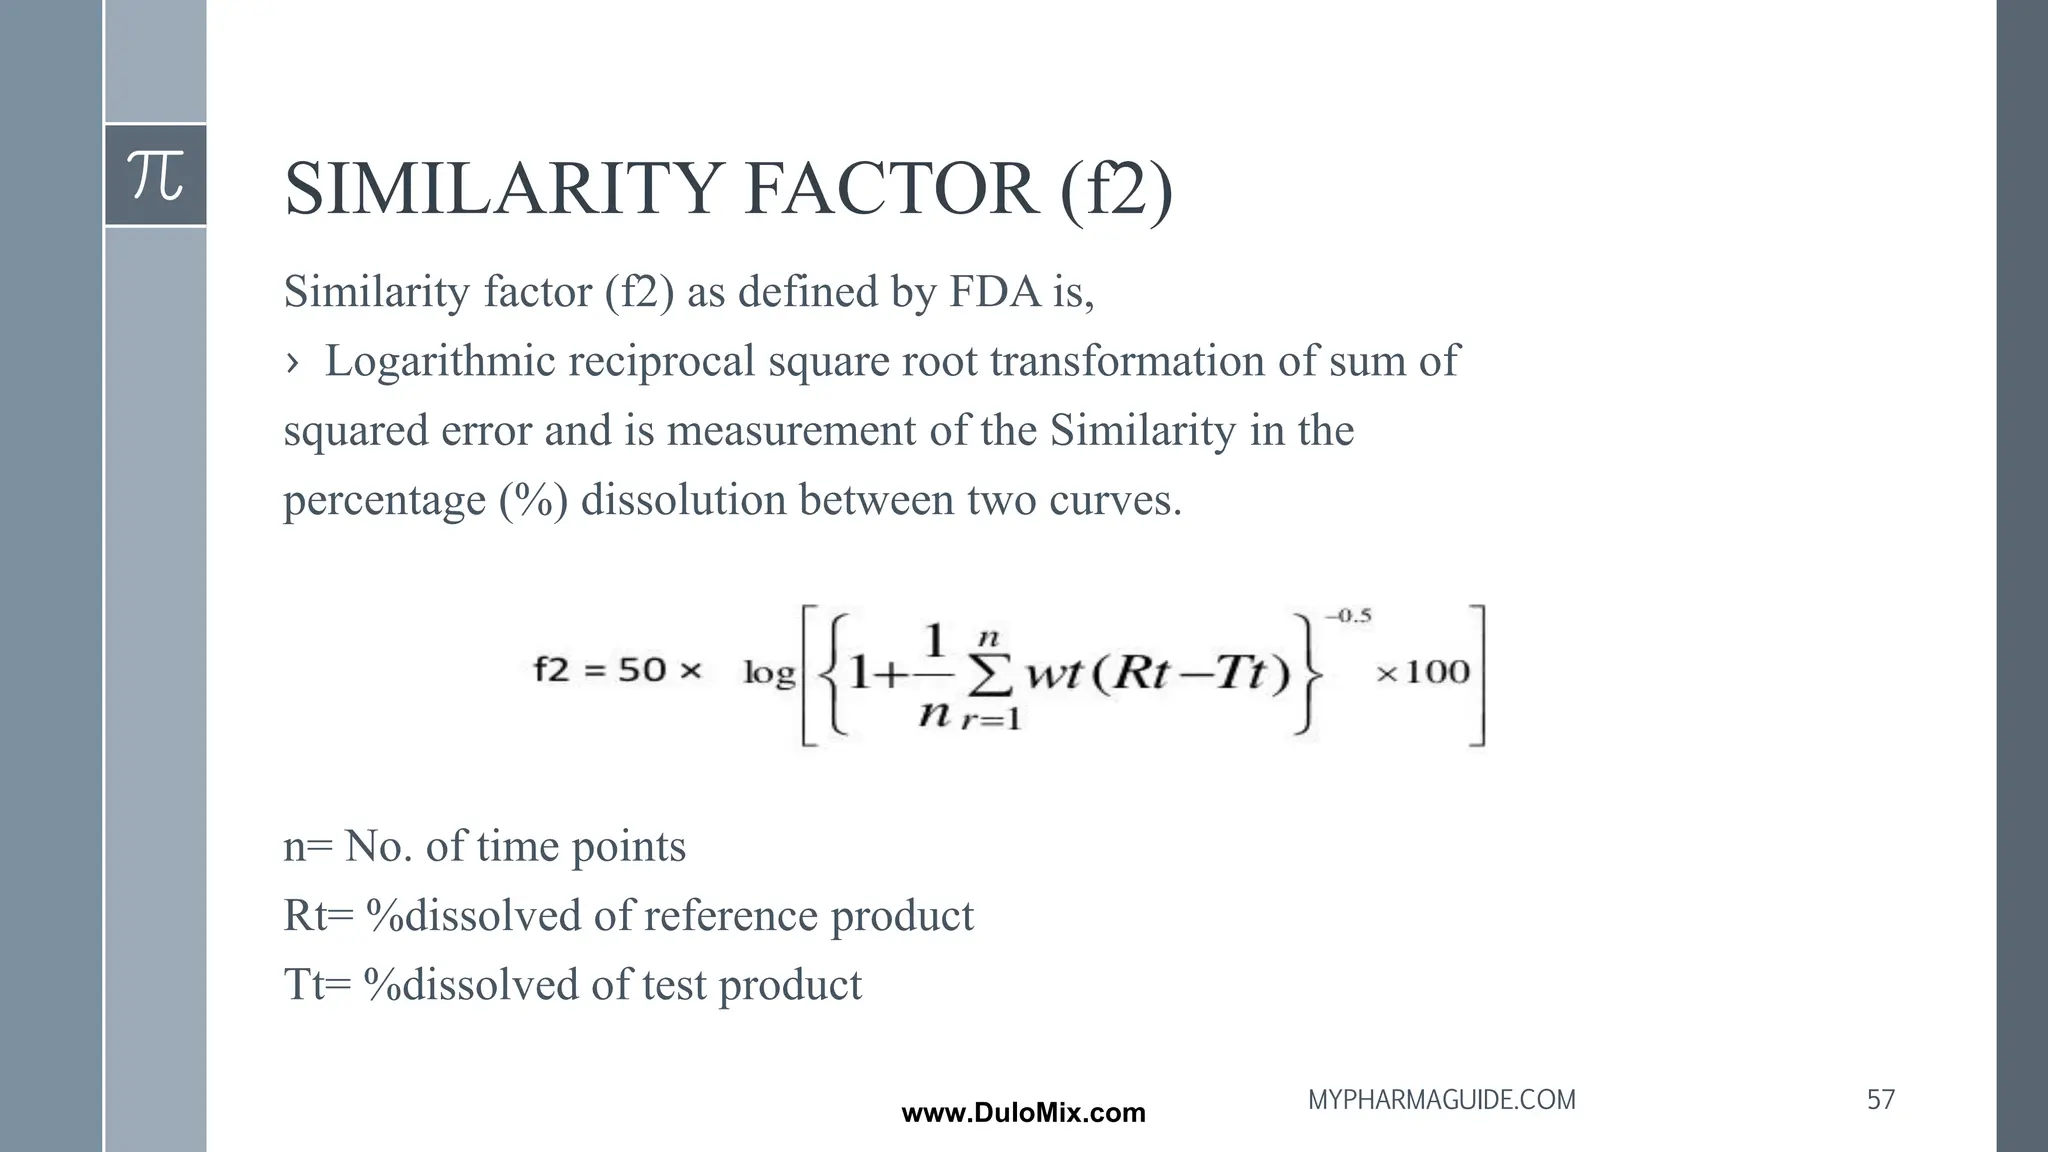
SIMILARITY FACTOR (f2)
Similarityfactor (f2) as defined by FDA is,
› Logarithmic reciprocal square root transformation of sum of
squared error and is measurement of the Similarity in the
percentage (%) dissolution between two curves.
n= No. of time points
Rt= %dissolved of reference product
Tt= %dissolved of test product
57
MYPHARMAGUIDE.COM
www.DuloMix.com
58.
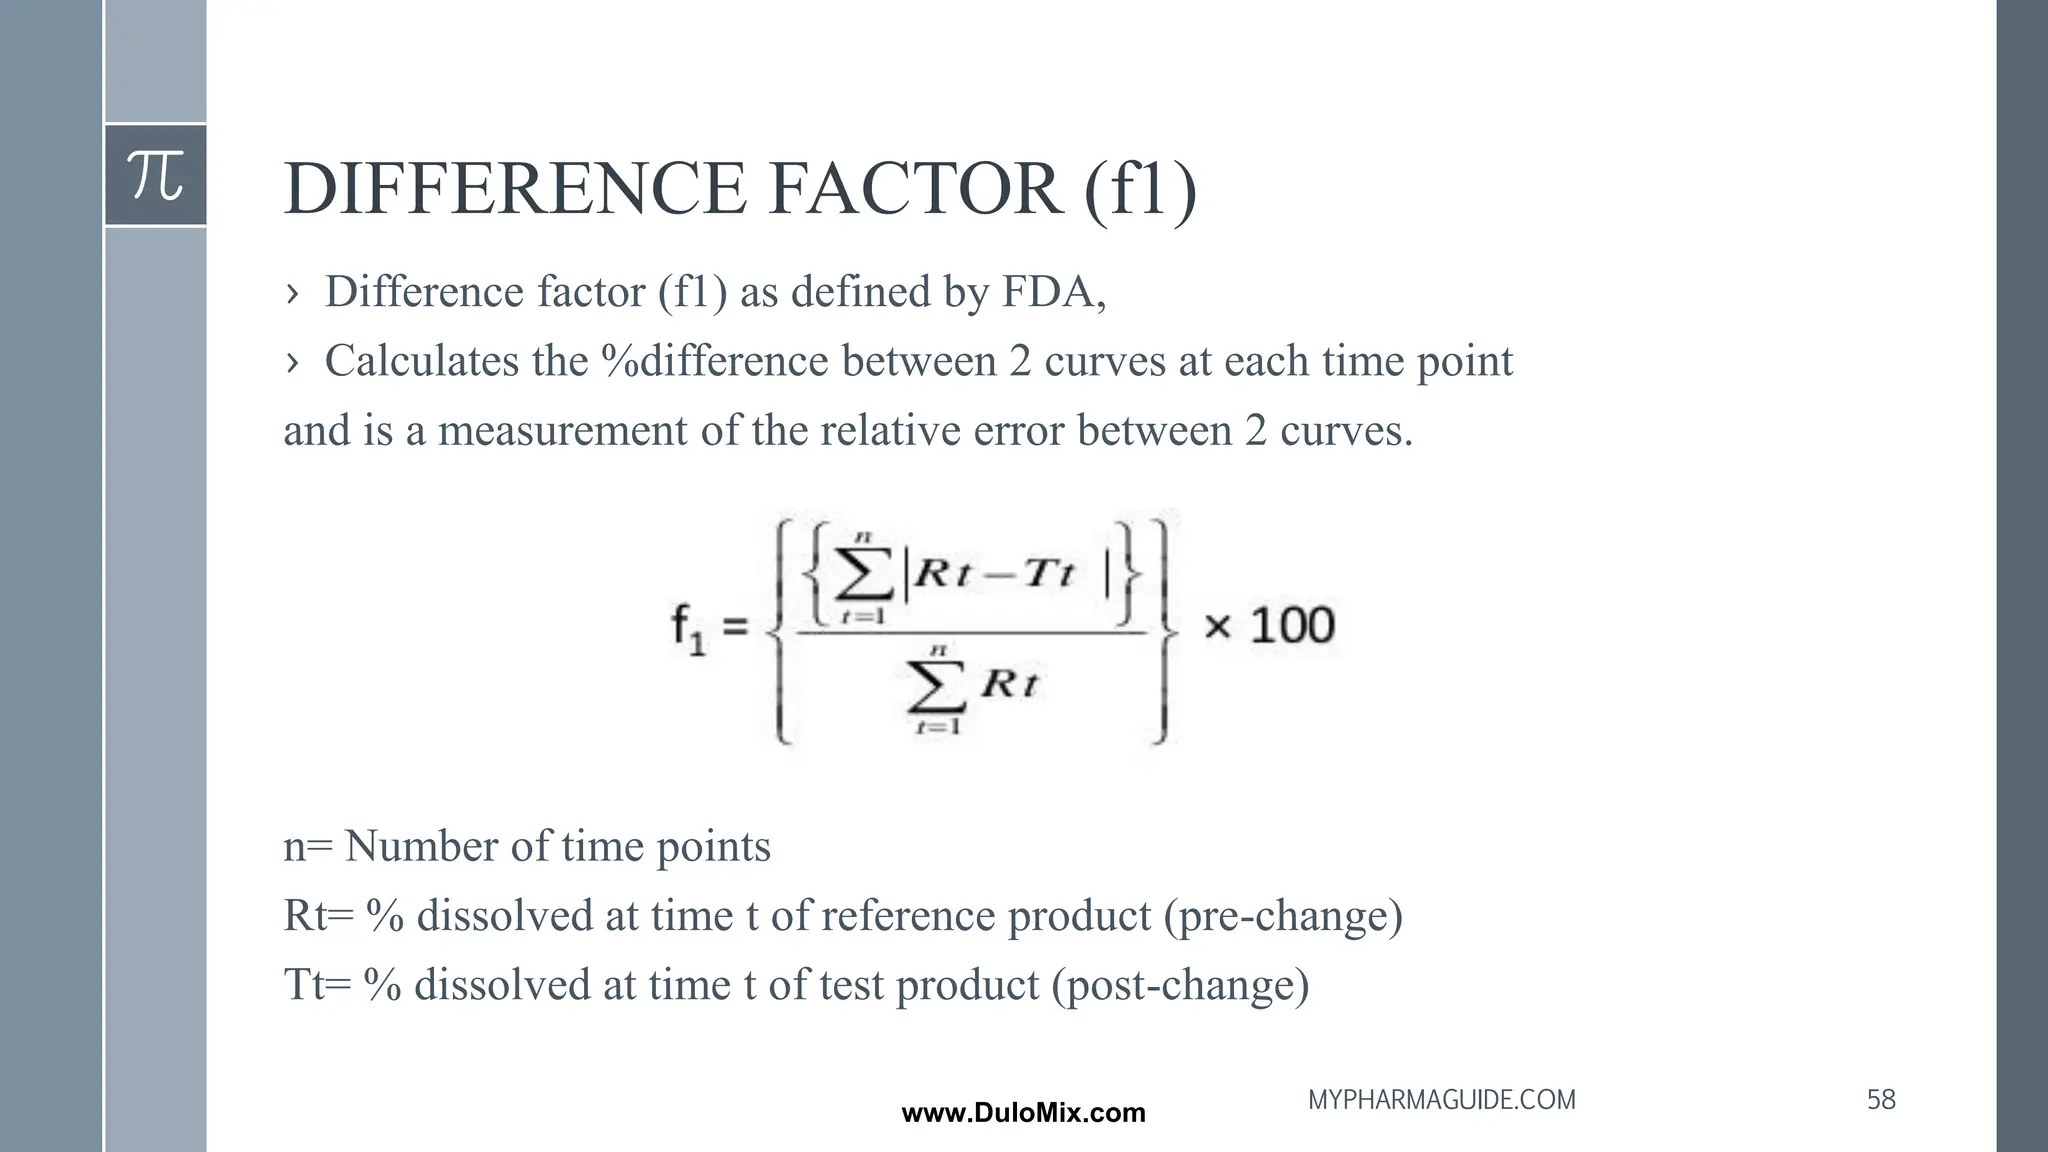
DIFFERENCE FACTOR (f1)
›Difference factor (f1) as defined by FDA,
› Calculates the %difference between 2 curves at each time point
and is a measurement of the relative error between 2 curves.
n= Number of time points
Rt= % dissolved at time t of reference product (pre-change)
Tt= % dissolved at time t of test product (post-change)
58
MYPHARMAGUIDE.COM
www.DuloMix.com
59.
STEPS INVOLVED:
› Thismodel- independent method is most suitable for the dissolution
profile comparison when 3-4 or more dissolution time points are
available.
› Determine the dissolution profile of two products (12 units each) of
the test (post-change) and reference (pre-change) products.
› Using the mean dissolution values from both curves at each time
interval, calculate the difference factor (f1) and similarity factor (f2)
using above formulas.
› For curves to be considered similar, f1 values should be close to 0
and f2 values should be close to 100.
› Generally f1 values up-to 15(0-15) and f2 values greater than
50(50-100) ensure sameness or equivalence of the 2 curves.
59
MYPHARMAGUIDE.COM
www.DuloMix.com
60.
CONDITIONS INVOLVED:
› Thedissolution measurements of the test and reference batches should be
made under exactly the same conditions.
› The dissolution time points for both the profiles should be the same (ex:
15,30,45,60 minutes)
› The reference product used should be the most recently manufactured pre-
change product.
› Only one measurement should be considered after 85% dissolution of both
the products
› To allow use of mean data, the %coefficient variation (%cv) at the earlier
time points (ex: 15 minutes)should not be more than 20% and at other time
points should not be more than 10%
60
MYPHARMAGUIDE.COM
www.DuloMix.com
61.
%Coefficient of variation(%CV)
It is the Standard deviation (s)divided by mean times(m) 100%
%CV = (s/m) 100%
› The mean dissolution values for reference can be derived either from last pre-
change batch or the last 2 or more consecutively manufactured pre-change
batches.
OBJECTIVES:
› To develop, in-vitro in-vivo correlation which can help to reduce costs, speed-
up product development and reduce the need to perform costly bioavailability
human volunteer studies
› Establish the similarity of pharmaceutical dosage forms, for which
composition, manufacture site, scale of manufacture, manufacture process and/
or equipment may have changed within defined limits.
61
MYPHARMAGUIDE.COM
www.DuloMix.com
62.
HIGUCHI MODEL
Higuchi proposedthis model in 1961 to describe the drug release
from matrix system.
HYPOTHESIS:
› Initial drug concentration in the matrix is much higher than drug solubility.
› Drug diffusion takes place only in one dimension (edge effect should be
avoided)
› Drug particles are much smaller the system thickness.
› Matrix swelling and dissolution are less or negligible.
› Drug diffusivity is constant.
› In the release environment perfect sink conditions are maintained.
62
MYPHARMAGUIDE.COM
www.DuloMix.com
63.
Higuchi model isgiven by the equation,
C= [D (2qt-Cs) Cst] ½
C= Total amount of drug release per unit area of matrix (mg/cm2)
D= Diffusion coefficient
qt= Total amount of drug in a unit volume of matrix (mg/cm3)
Cs = Solubility of drug (mg/cm3)
t= Time
APPLICATIONS:
▪ By using this model dissolution of drug from several modified release dosage forms like
some trans-dermal system and matrix tablet with water soluble drugs are studied.
▪ Also used for study of poorly soluble drugs from variety of matrices including solids and
semisolids.
63
MYPHARMAGUIDE.COM
www.DuloMix.com
64.
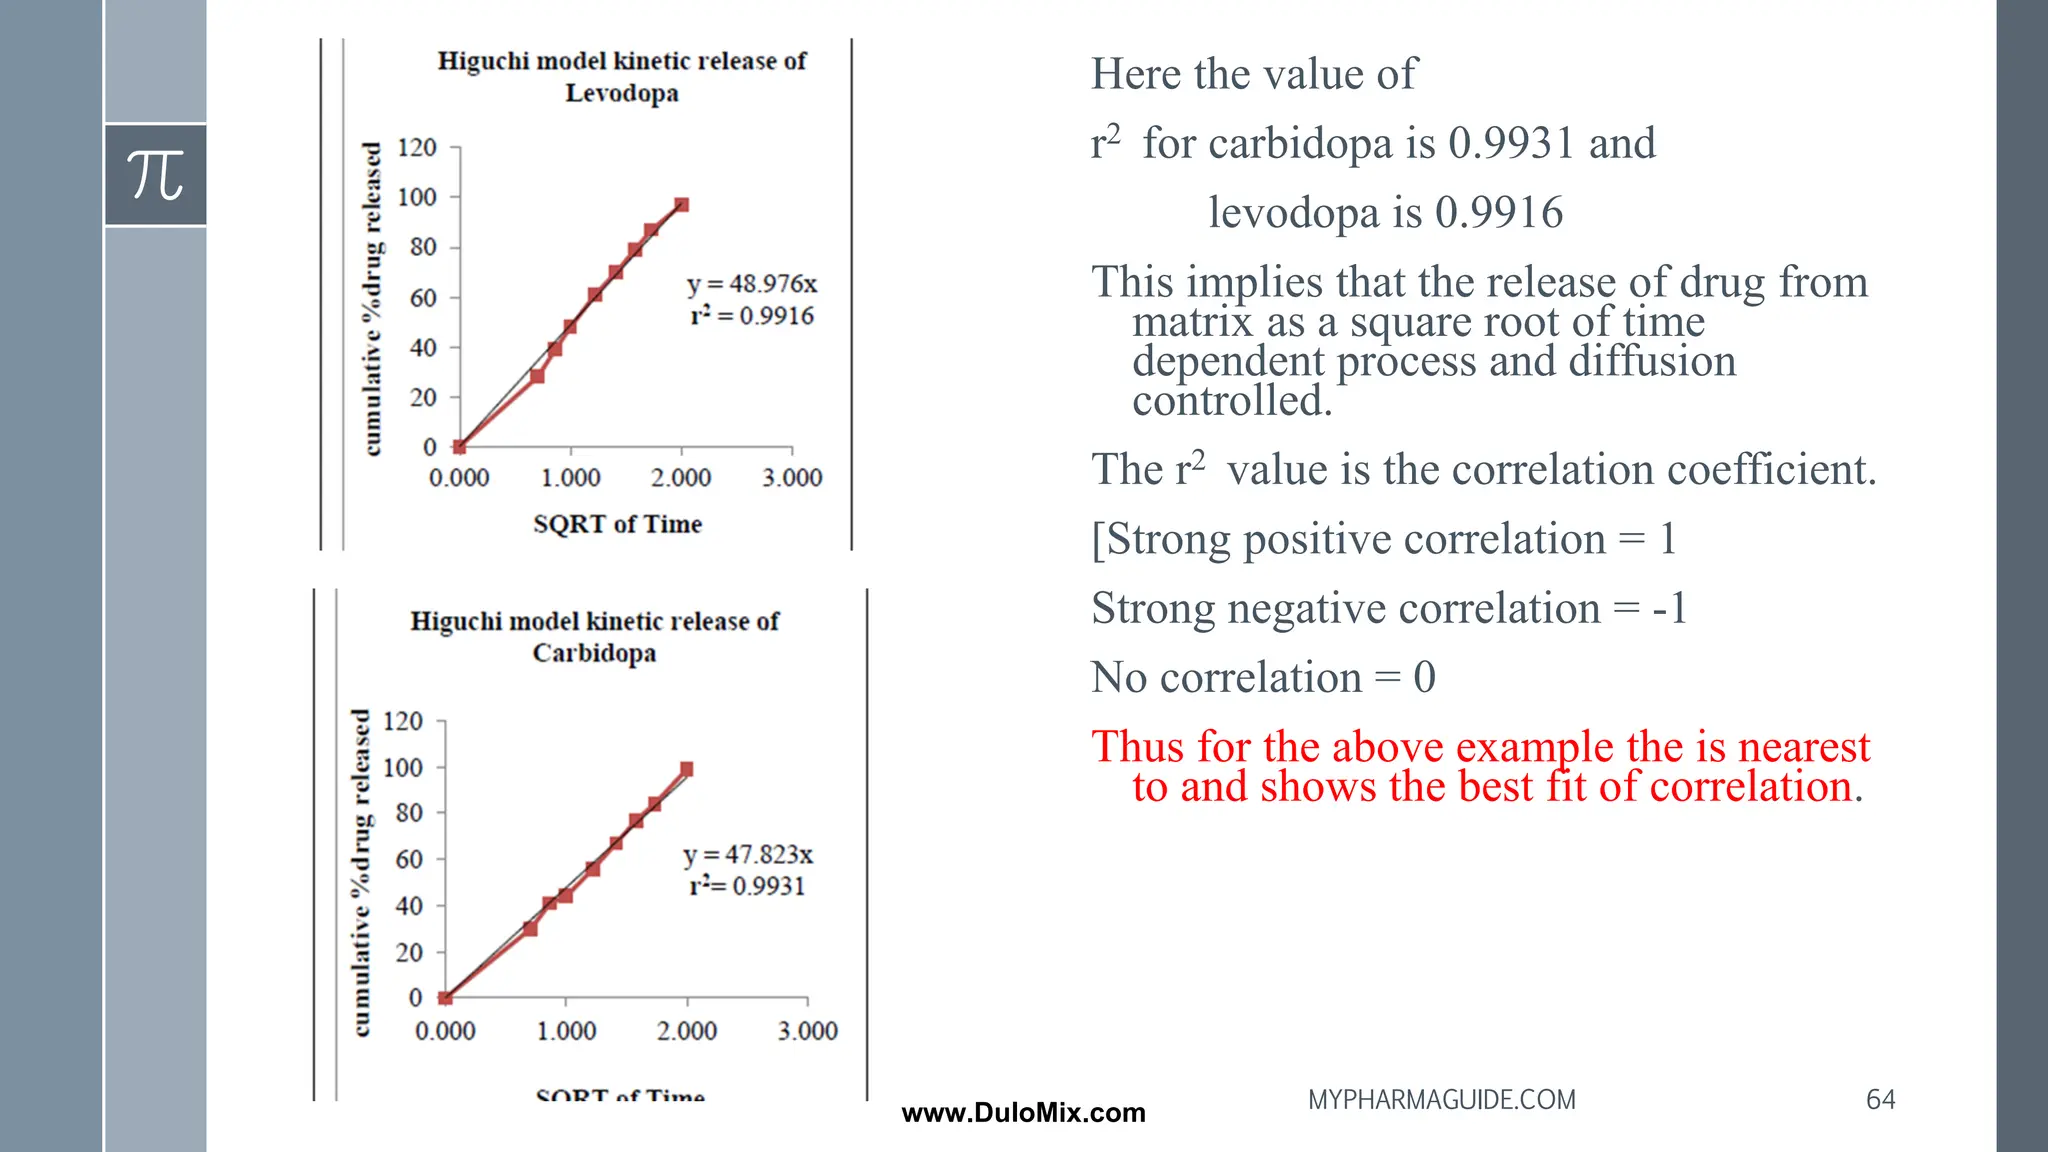
Here the valueof
r2 for carbidopa is 0.9931 and
levodopa is 0.9916
This implies that the release of drug from
matrix as a square root of time
dependent process and diffusion
controlled.
The r2 value is the correlation coefficient.
[Strong positive correlation = 1
Strong negative correlation = -1
No correlation = 0
Thus for the above example the is nearest
to and shows the best fit of correlation.
64
MYPHARMAGUIDE.COM
www.DuloMix.com
65.
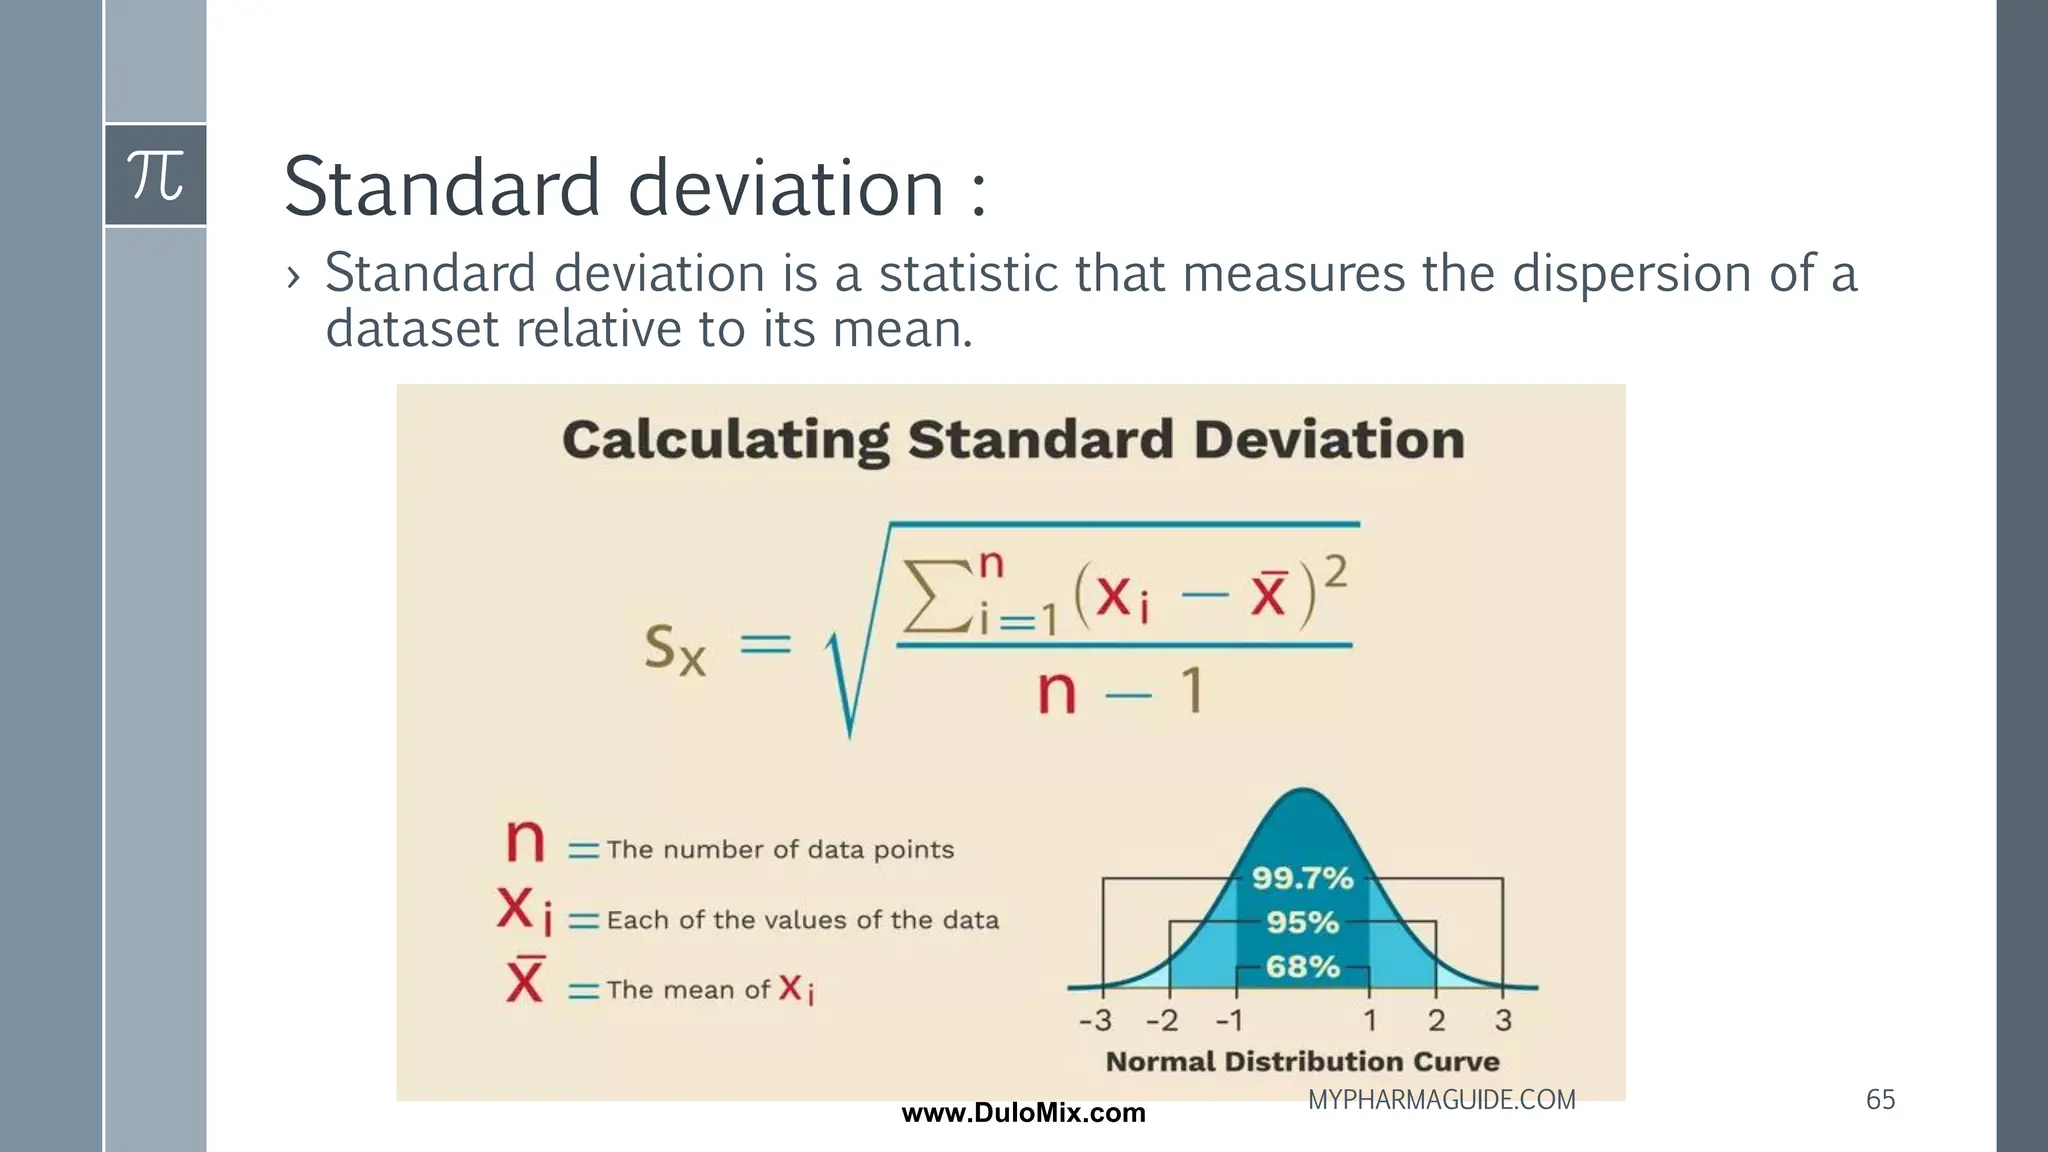
Standard deviation :
›Standard deviation is a statistic that measures the dispersion of a
dataset relative to its mean.
65
MYPHARMAGUIDE.COM
www.DuloMix.com
66.
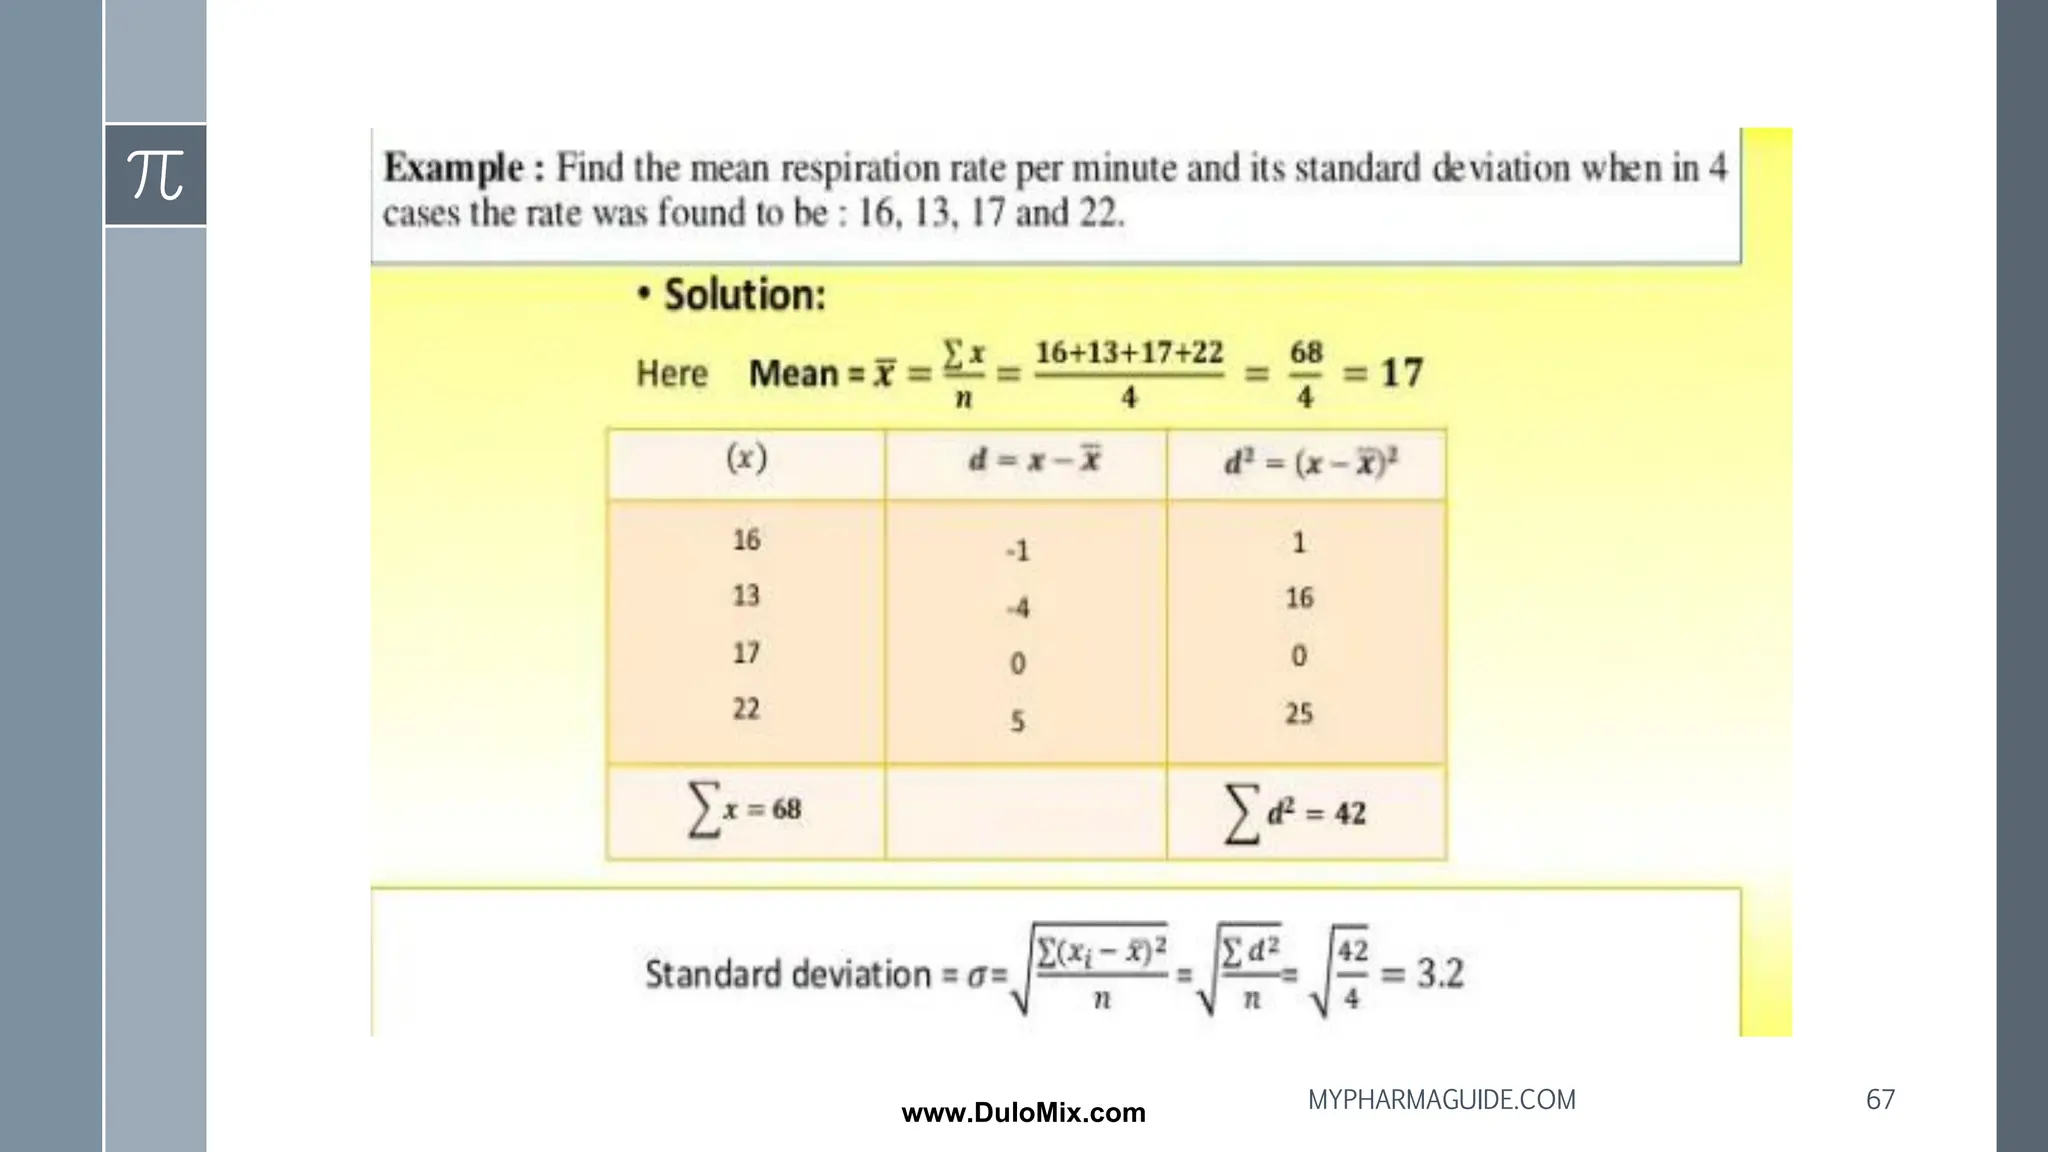
STEPS INVOLVED:
▪ Calculatemean
▪ Write a table that subtracts mean from each observed value
▪ Square each of the differences
▪ Add this column
▪ Divide by n-1 where n is the number of items in the sample. This is
the variance.
▪ To get Standard Deviation we take the square root of variance
TYPES:
Low Standard Deviation-indicates that the data points tend to
be very close to the mean.
High Standard Deviation -indicates that the data is spread out
over a large range of values.
66
MYPHARMAGUIDE.COM
www.DuloMix.com
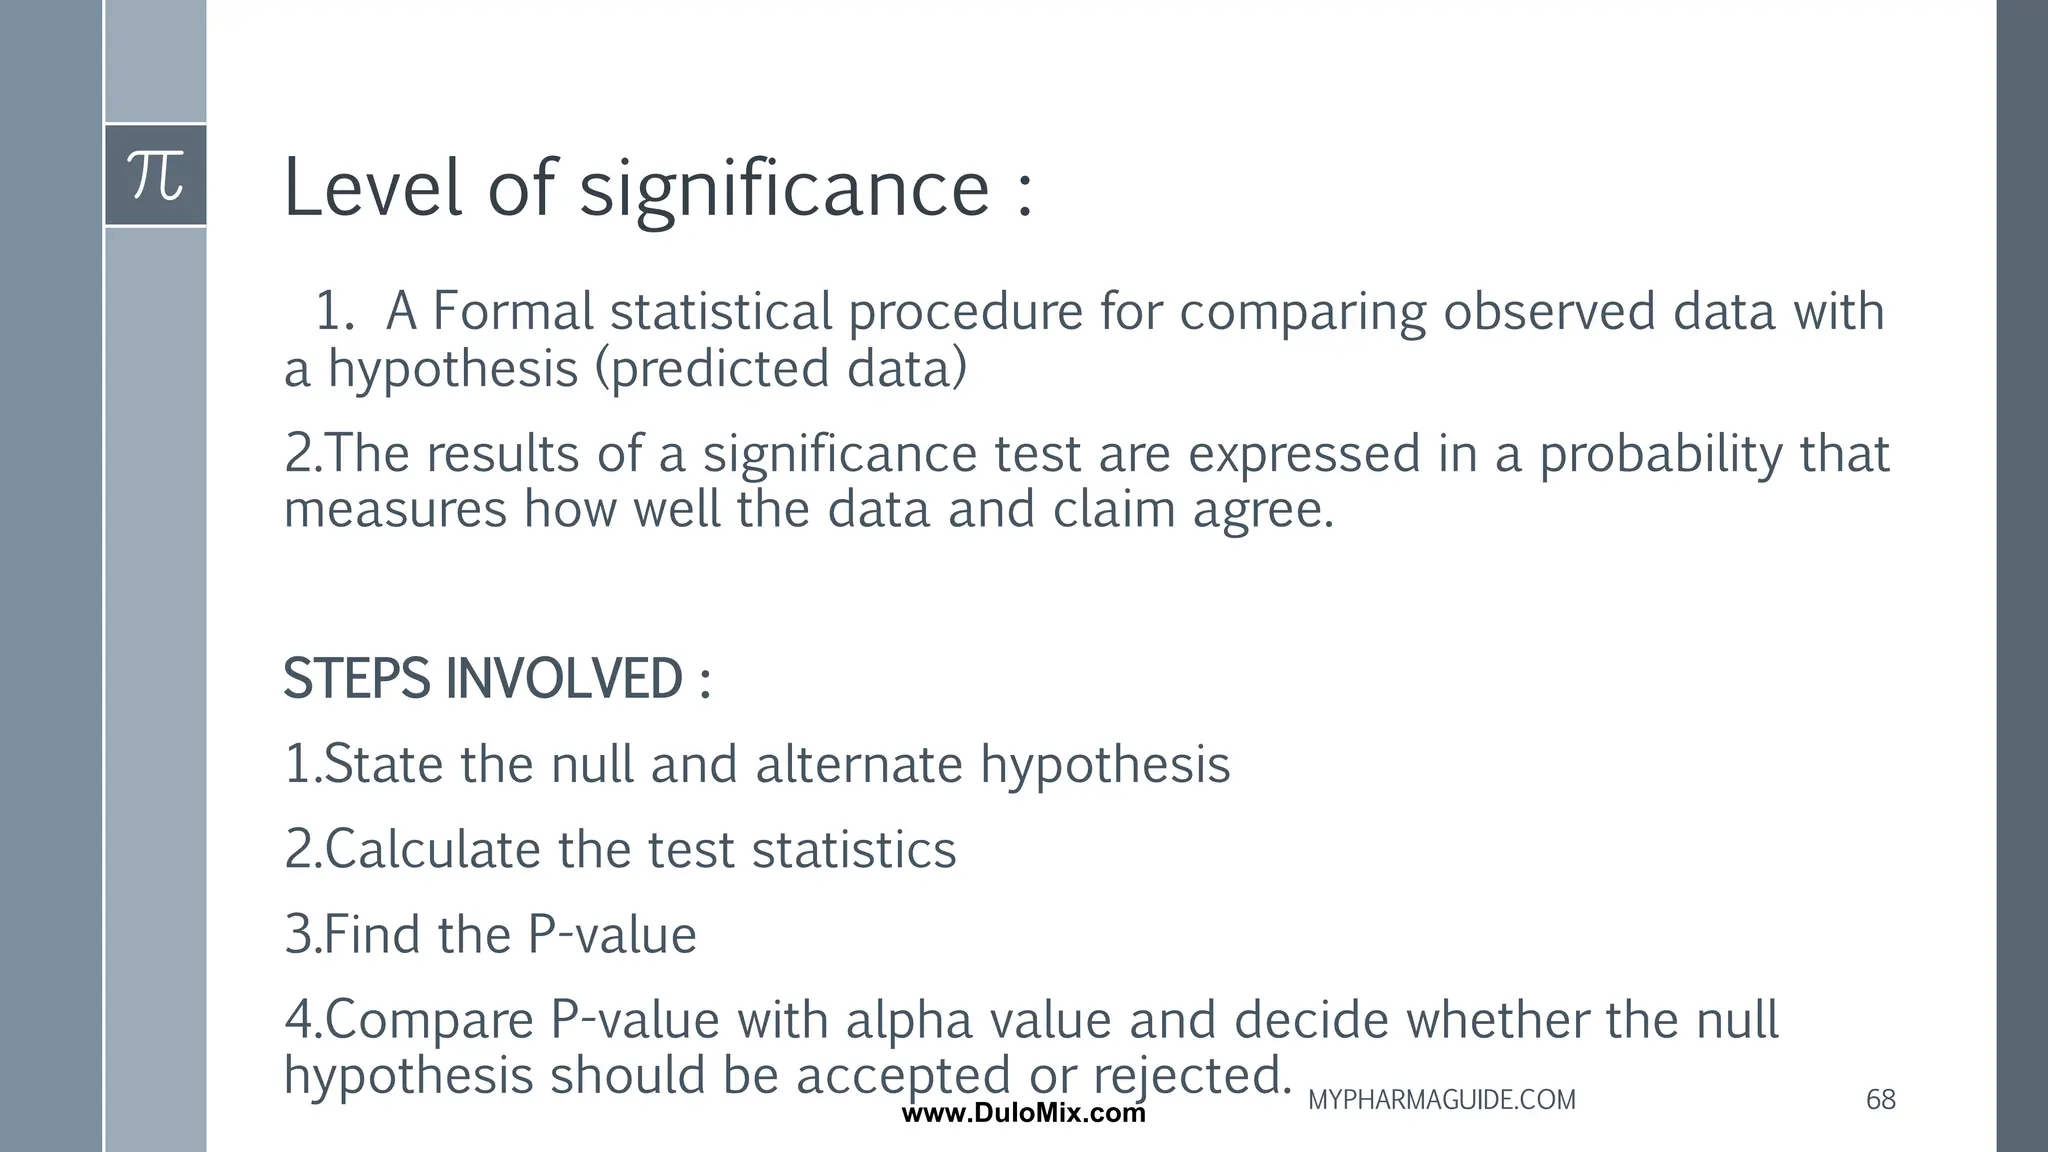
Level of significance:
1. A Formal statistical procedure for comparing observed data with
a hypothesis (predicted data)
2.The results of a significance test are expressed in a probability that
measures how well the data and claim agree.
STEPS INVOLVED :
1.State the null and alternate hypothesis
2.Calculate the test statistics
3.Find the P-value
4.Compare P-value with alpha value and decide whether the null
hypothesis should be accepted or rejected. 68
MYPHARMAGUIDE.COM
www.DuloMix.com
69.
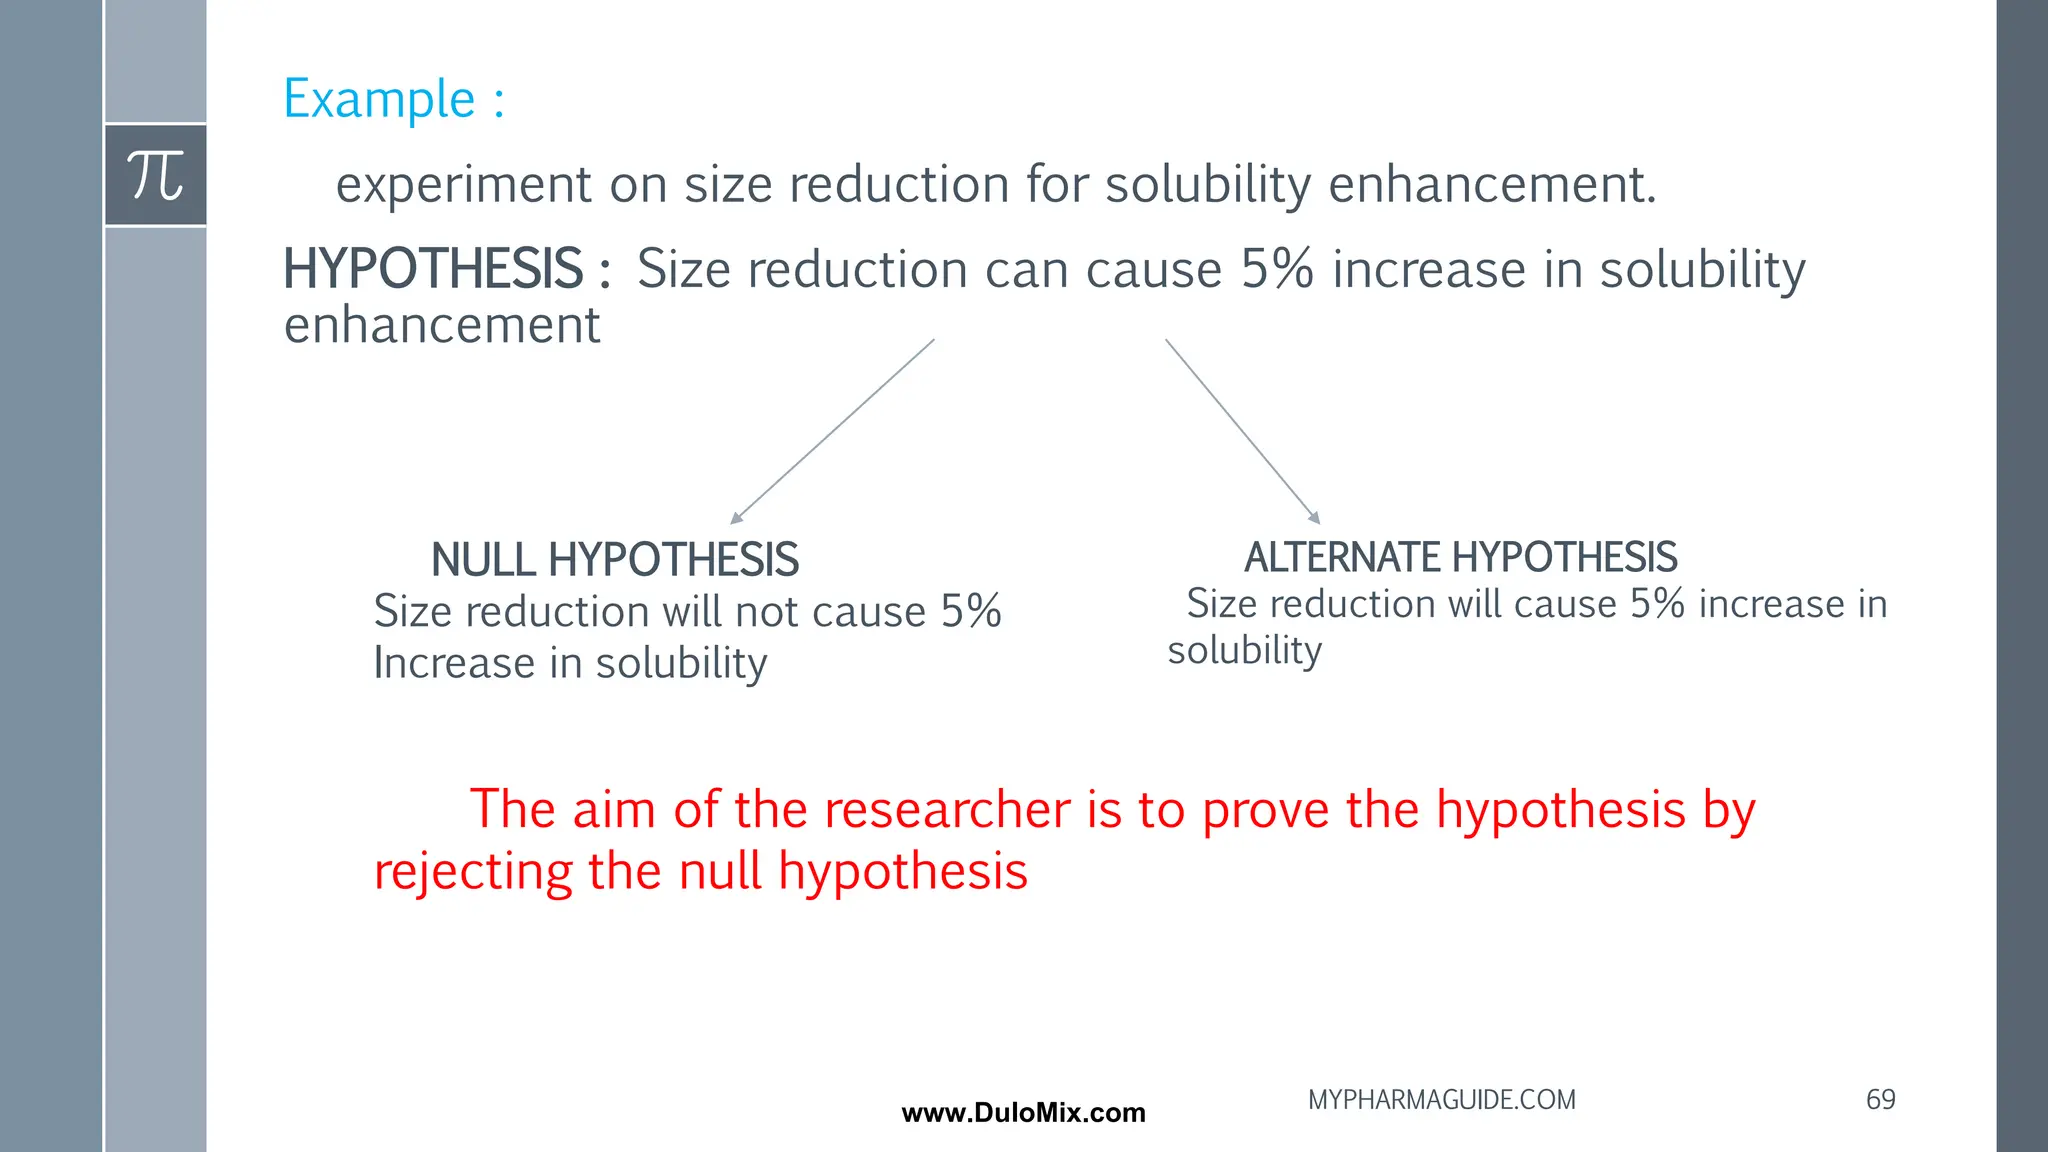
Example :
experiment onsize reduction for solubility enhancement.
HYPOTHESIS : Size reduction can cause 5% increase in solubility
enhancement
NULL HYPOTHESIS
Size reduction will not cause 5%
Increase in solubility
ALTERNATE HYPOTHESIS
Size reduction will cause 5% increase in
solubility
The aim of the researcher is to prove the hypothesis by
rejecting the null hypothesis
69
MYPHARMAGUIDE.COM
www.DuloMix.com
70.
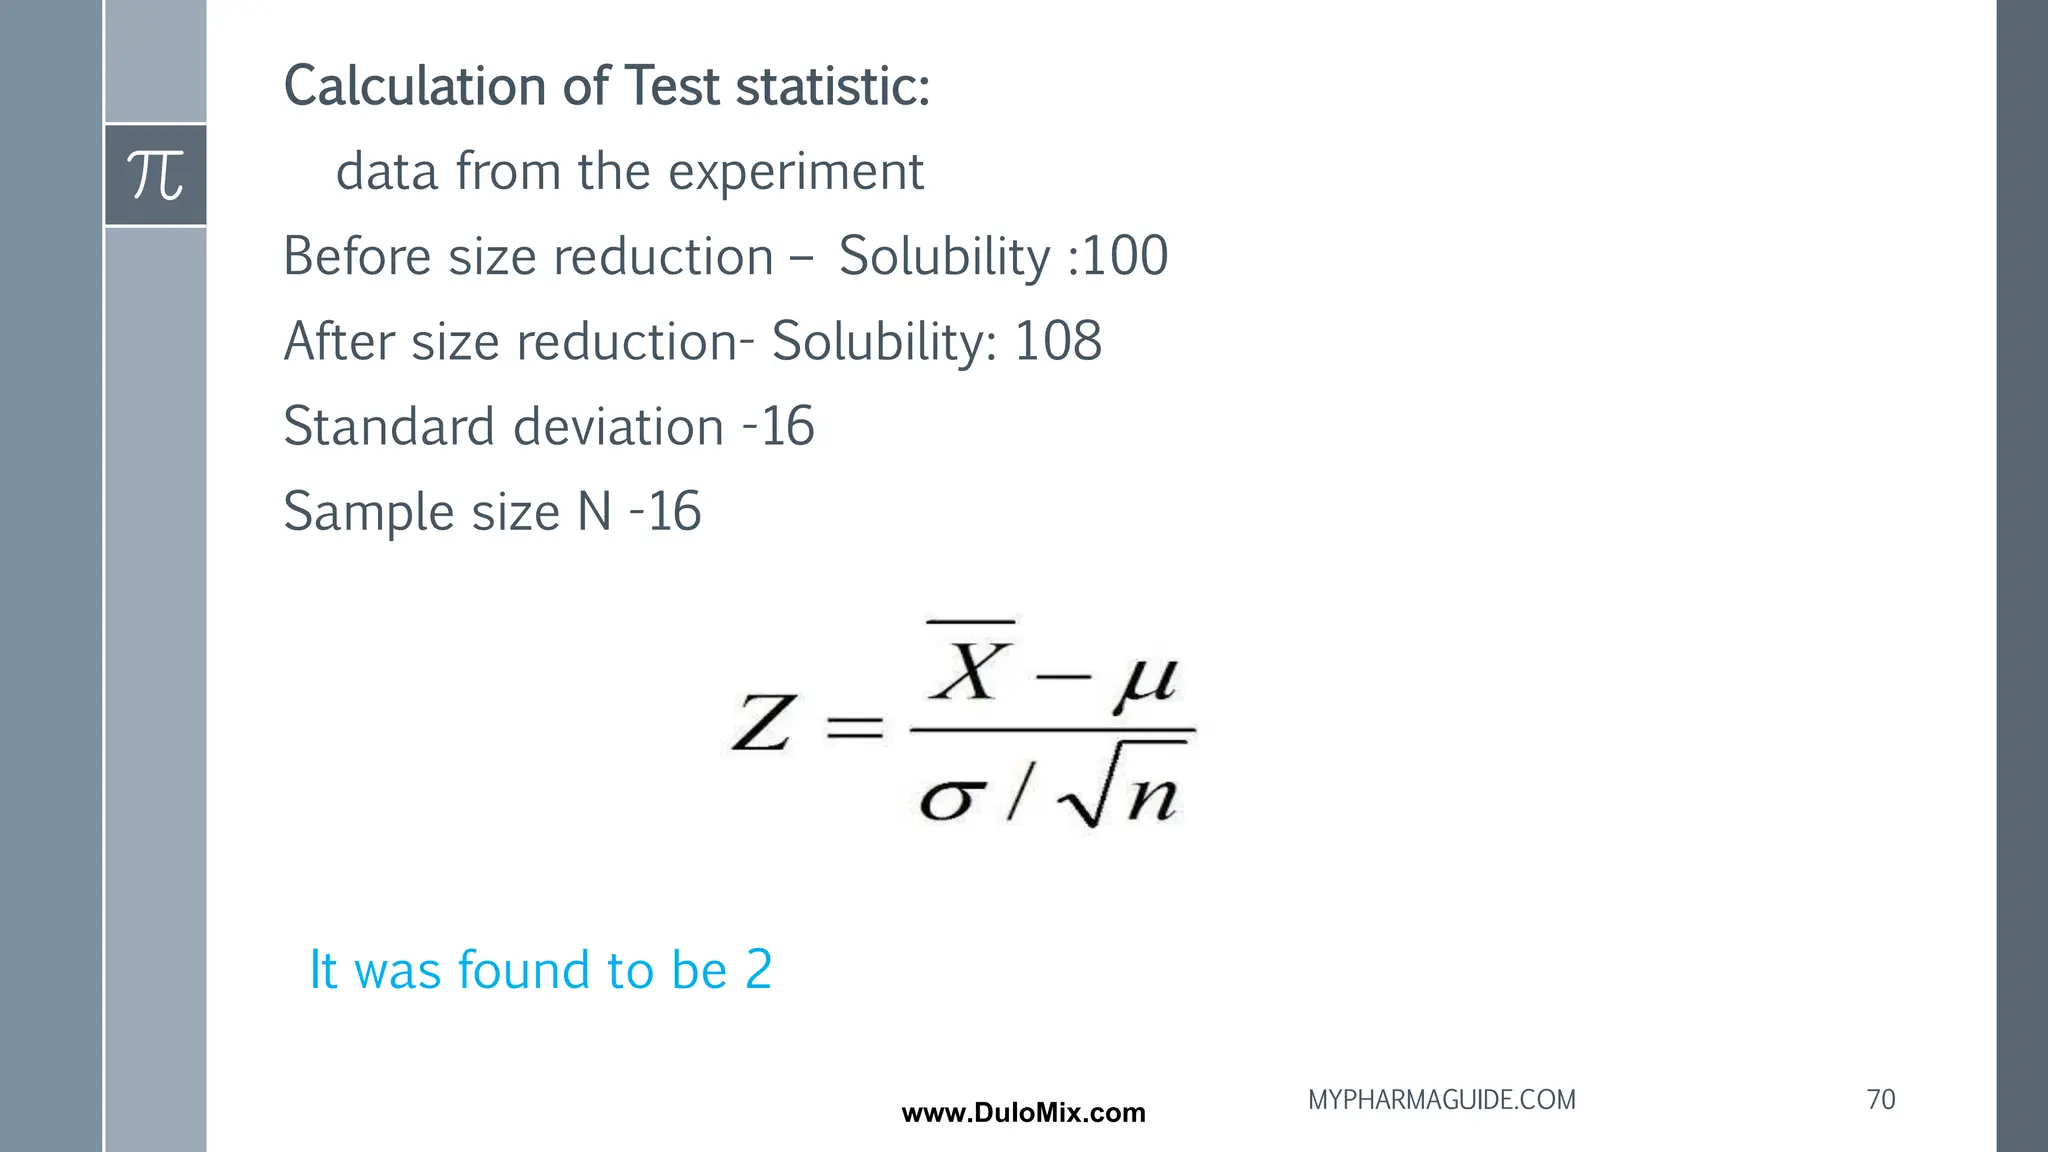
Calculation of Teststatistic:
data from the experiment
Before size reduction – Solubility :100
After size reduction- Solubility: 108
Standard deviation -16
Sample size N -16
It was found to be 2
70
MYPHARMAGUIDE.COM
www.DuloMix.com
71.
› P Value:
It represents the probability of getting this specific sample mean
score if it is actually no different from the population mean.
When the P-value is very small the research can strongly evidence
that null hypothesis is false.
› α- value : 0.05 or 5%
› P value > α :accept the null hypothesis
› P value <= α :reject the null hypothesis
71
MYPHARMAGUIDE.COM
www.DuloMix.com
72.
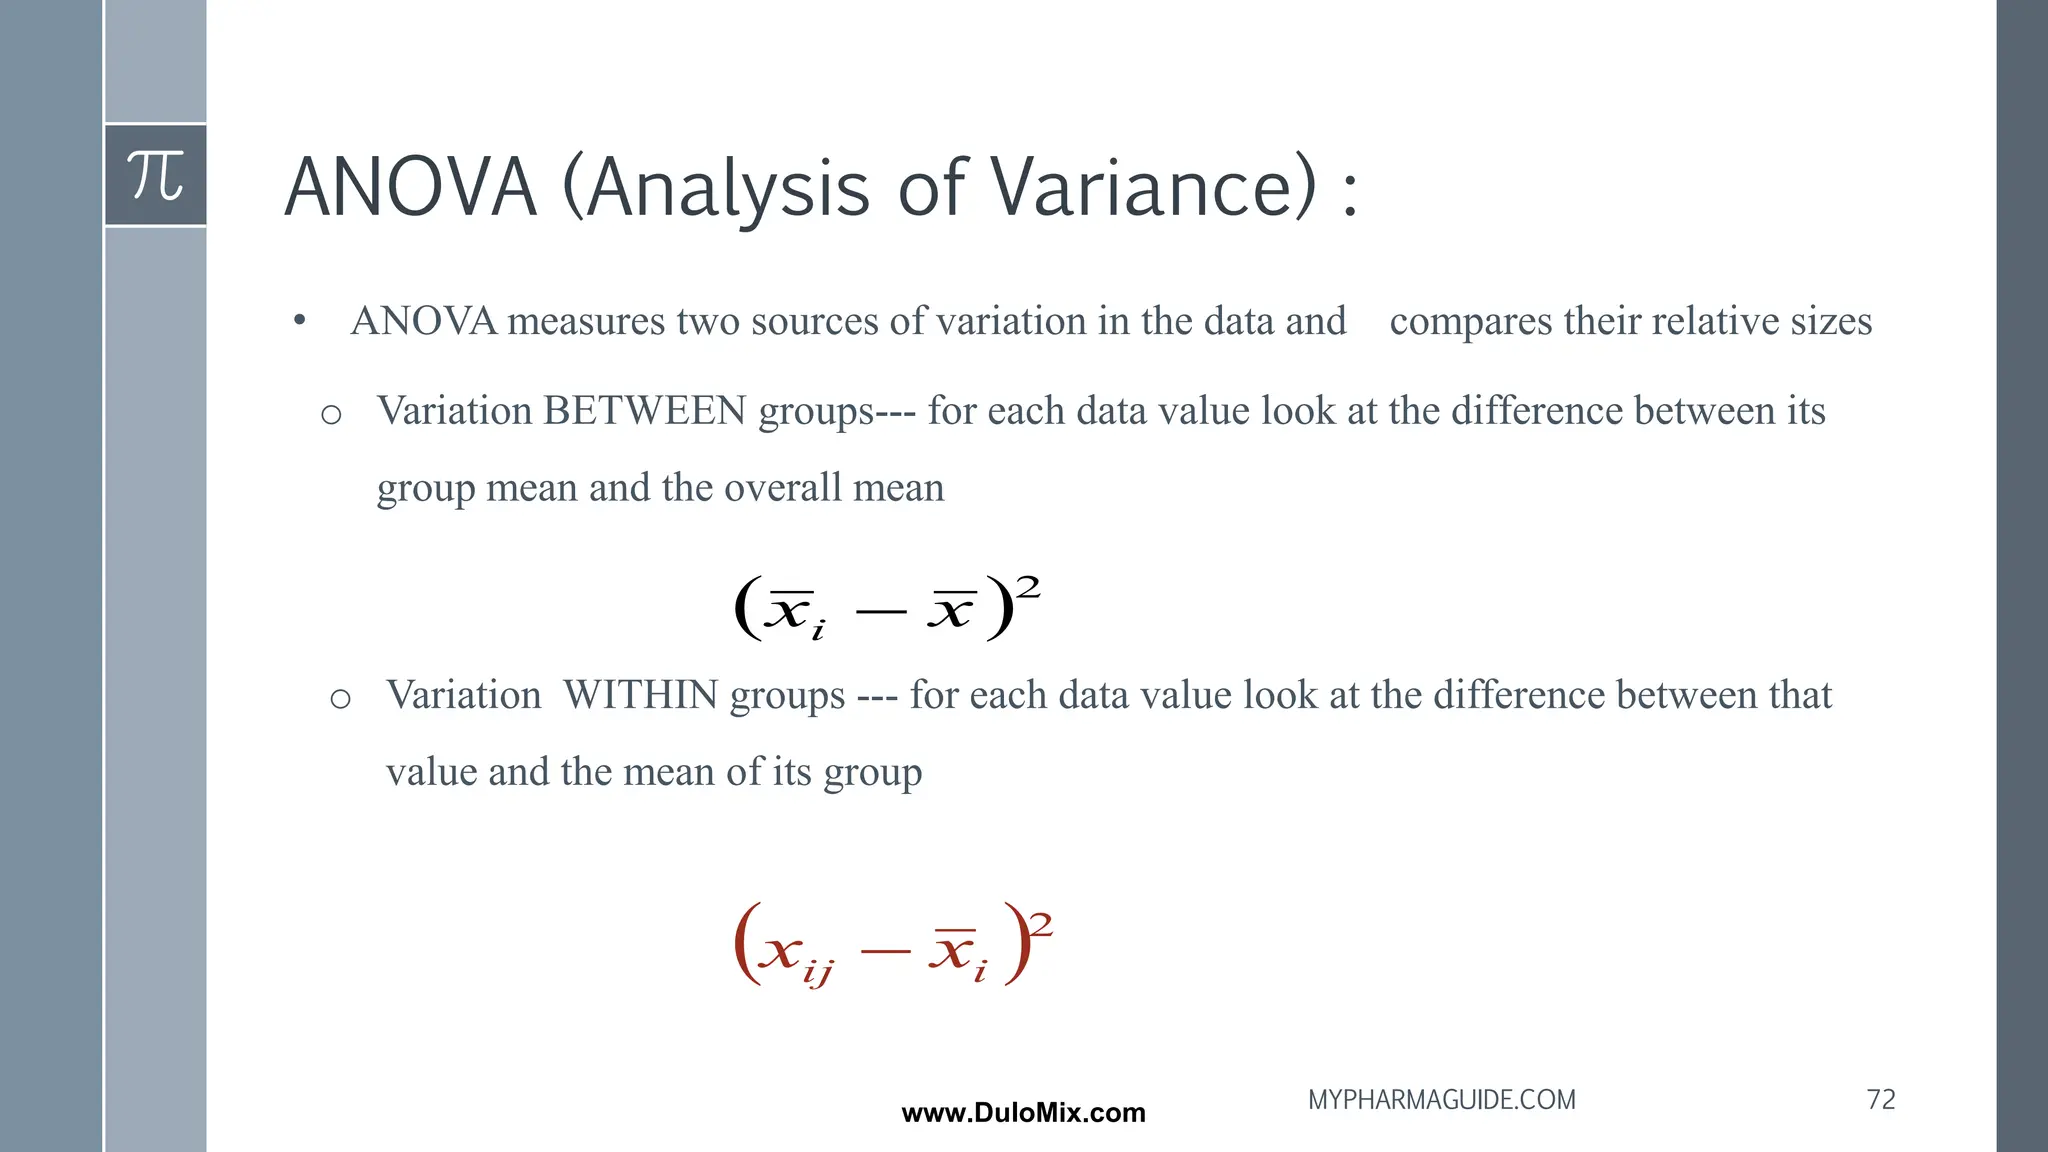
ANOVA (Analysis ofVariance) :
• ANOVA measures two sources of variation in the data and compares their relative sizes
o Variation BETWEEN groups--- for each data value look at the difference between its
group mean and the overall mean
o Variation WITHIN groups --- for each data value look at the difference between that
value and the mean of its group
( )2
x
xi −
( )2
i
ij x
x −
72
MYPHARMAGUIDE.COM
www.DuloMix.com
73.
Examples of obviousconfounding :
› (1) a clinical study in which patients are allowed to take various concomitant
drugs other than the test drug that affect the condition being treated and
› (2) a comparison of a new tablet formulation to the former formulation for
dissolution, with the tablets prepared on two different tablet presses, one
formulation on each press.
Differences in the performance of the presses (pressure, for example) can
contribute to differences in dissolution in addition to differences due to
formulation changes.
ANOVA does
Consider an experiment to assess the effects of lubricating agent and
disintegrating agent on the dissolution of a tablet.
73
MYPHARMAGUIDE.COM
www.DuloMix.com
74.
› The finalanalysis of variance would separate the effects of these factors by
computing that part of the total variation attributable to the lubricating and
disintegration agents isolated from that variation due to experimental error.
This separation serves as a basis for testing statistical hypotheses.
CONDITIONS USED :
➢ In two sample situation
➢ In paired set-up
➢ In repeated measures, when the same subject is measured at different time
points such as after 5 minutes, 15 minutes, 30 minutes, 60 minutes etc,.
➢ Removing the effect of a covariate
➢ Regression.
74
MYPHARMAGUIDE.COM
www.DuloMix.com
75.
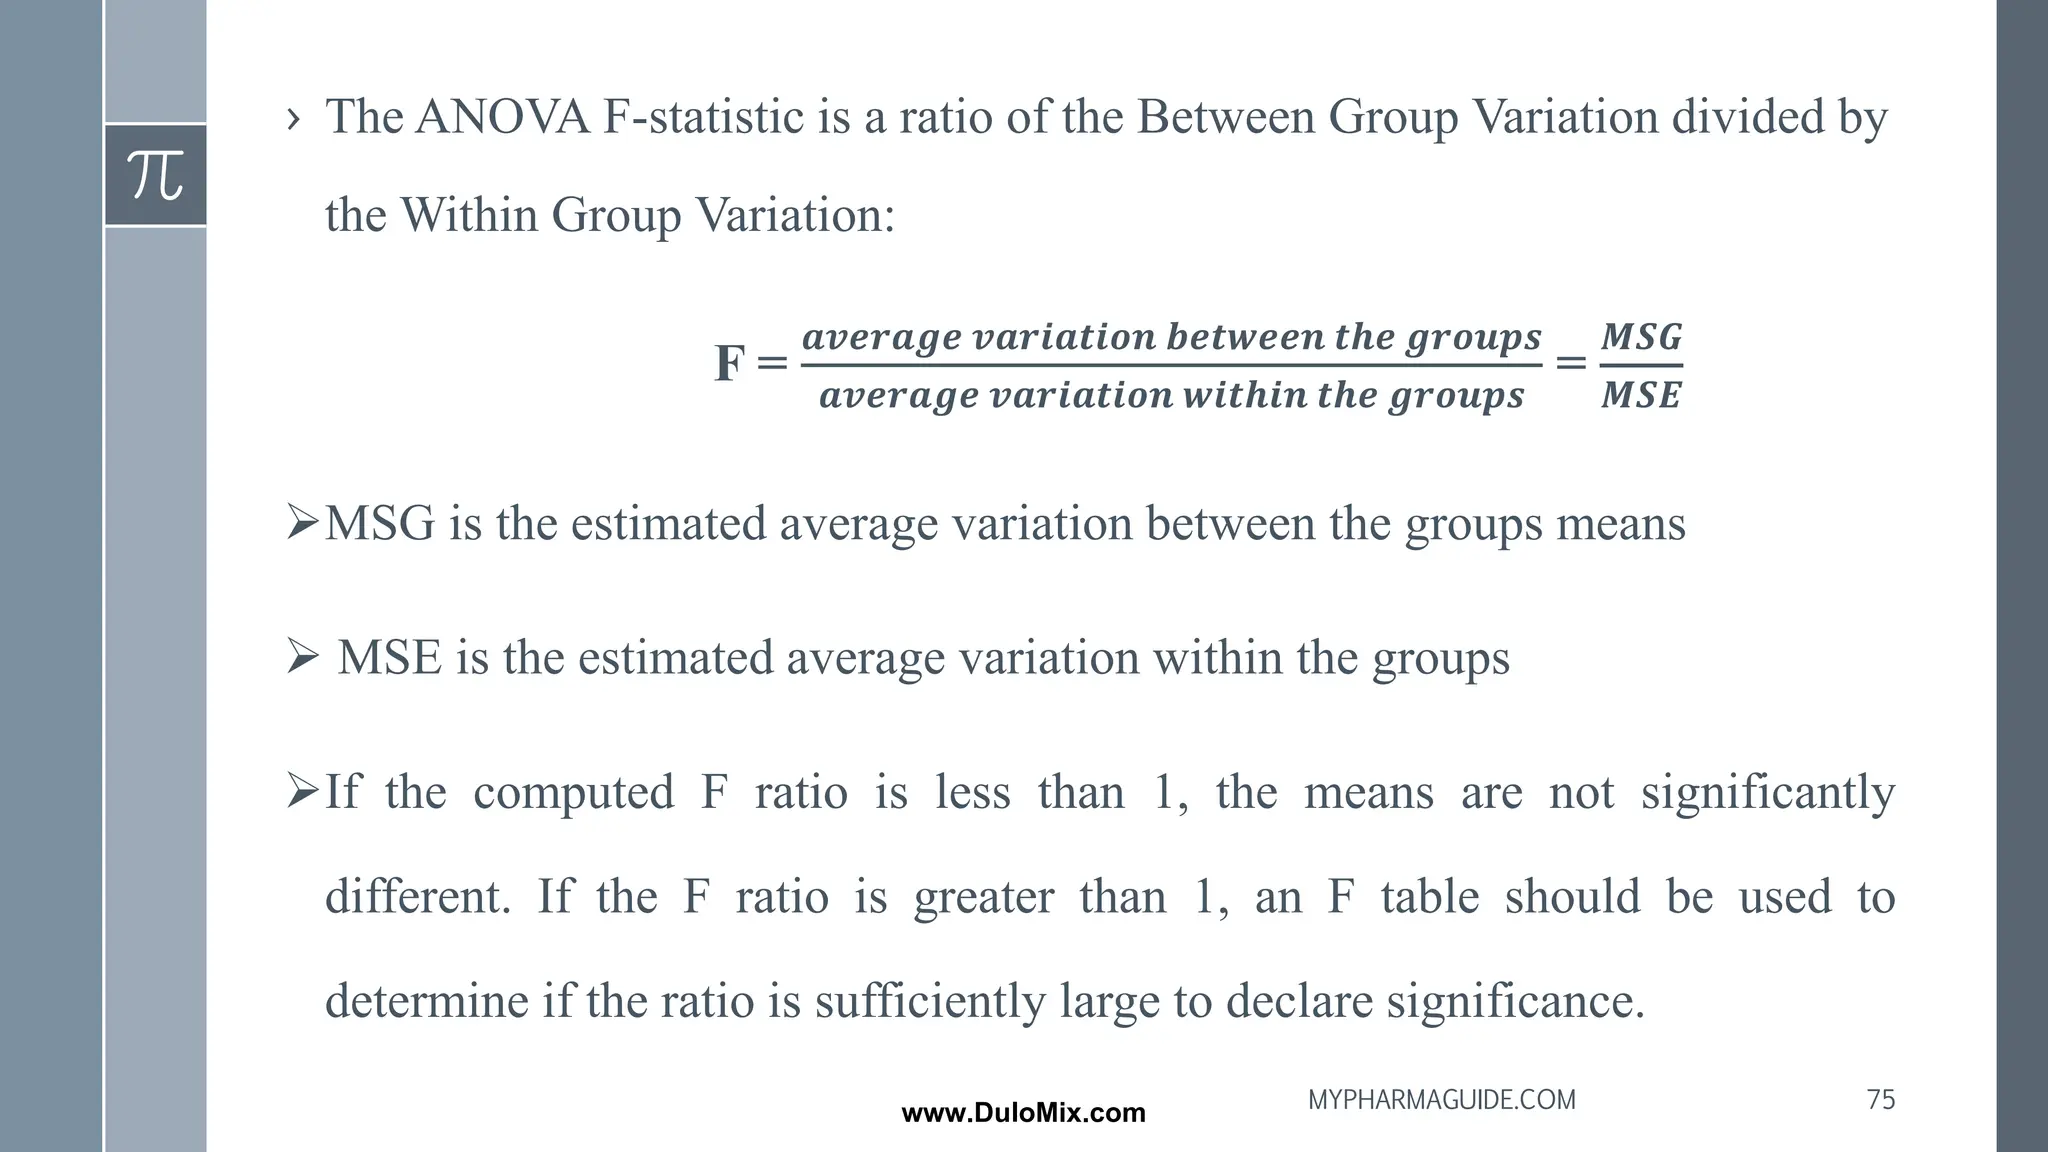
› The ANOVAF-statistic is a ratio of the Between Group Variation divided by
the Within Group Variation:
F =
𝒂𝒗𝒆𝒓𝒂𝒈𝒆 𝒗𝒂𝒓𝒊𝒂𝒕𝒊𝒐𝒏 𝒃𝒆𝒕𝒘𝒆𝒆𝒏 𝒕𝒉𝒆 𝒈𝒓𝒐𝒖𝒑𝒔
𝒂𝒗𝒆𝒓𝒂𝒈𝒆 𝒗𝒂𝒓𝒊𝒂𝒕𝒊𝒐𝒏 𝒘𝒊𝒕𝒉𝒊𝒏 𝒕𝒉𝒆 𝒈𝒓𝒐𝒖𝒑𝒔
=
𝑴𝑺𝑮
𝑴𝑺𝑬
➢MSG is the estimated average variation between the groups means
➢ MSE is the estimated average variation within the groups
➢If the computed F ratio is less than 1, the means are not significantly
different. If the F ratio is greater than 1, an F table should be used to
determine if the ratio is sufficiently large to declare significance.
75
MYPHARMAGUIDE.COM
www.DuloMix.com
76.
A large Fis evidence against H0, since it indicates that there is more
difference between groups than within groups.
Different types of ANOVA ;
› One-way ANOVA
› Two-way Analysis of Variance
› Mixed design ANOVAs
76
MYPHARMAGUIDE.COM
www.DuloMix.com
77.
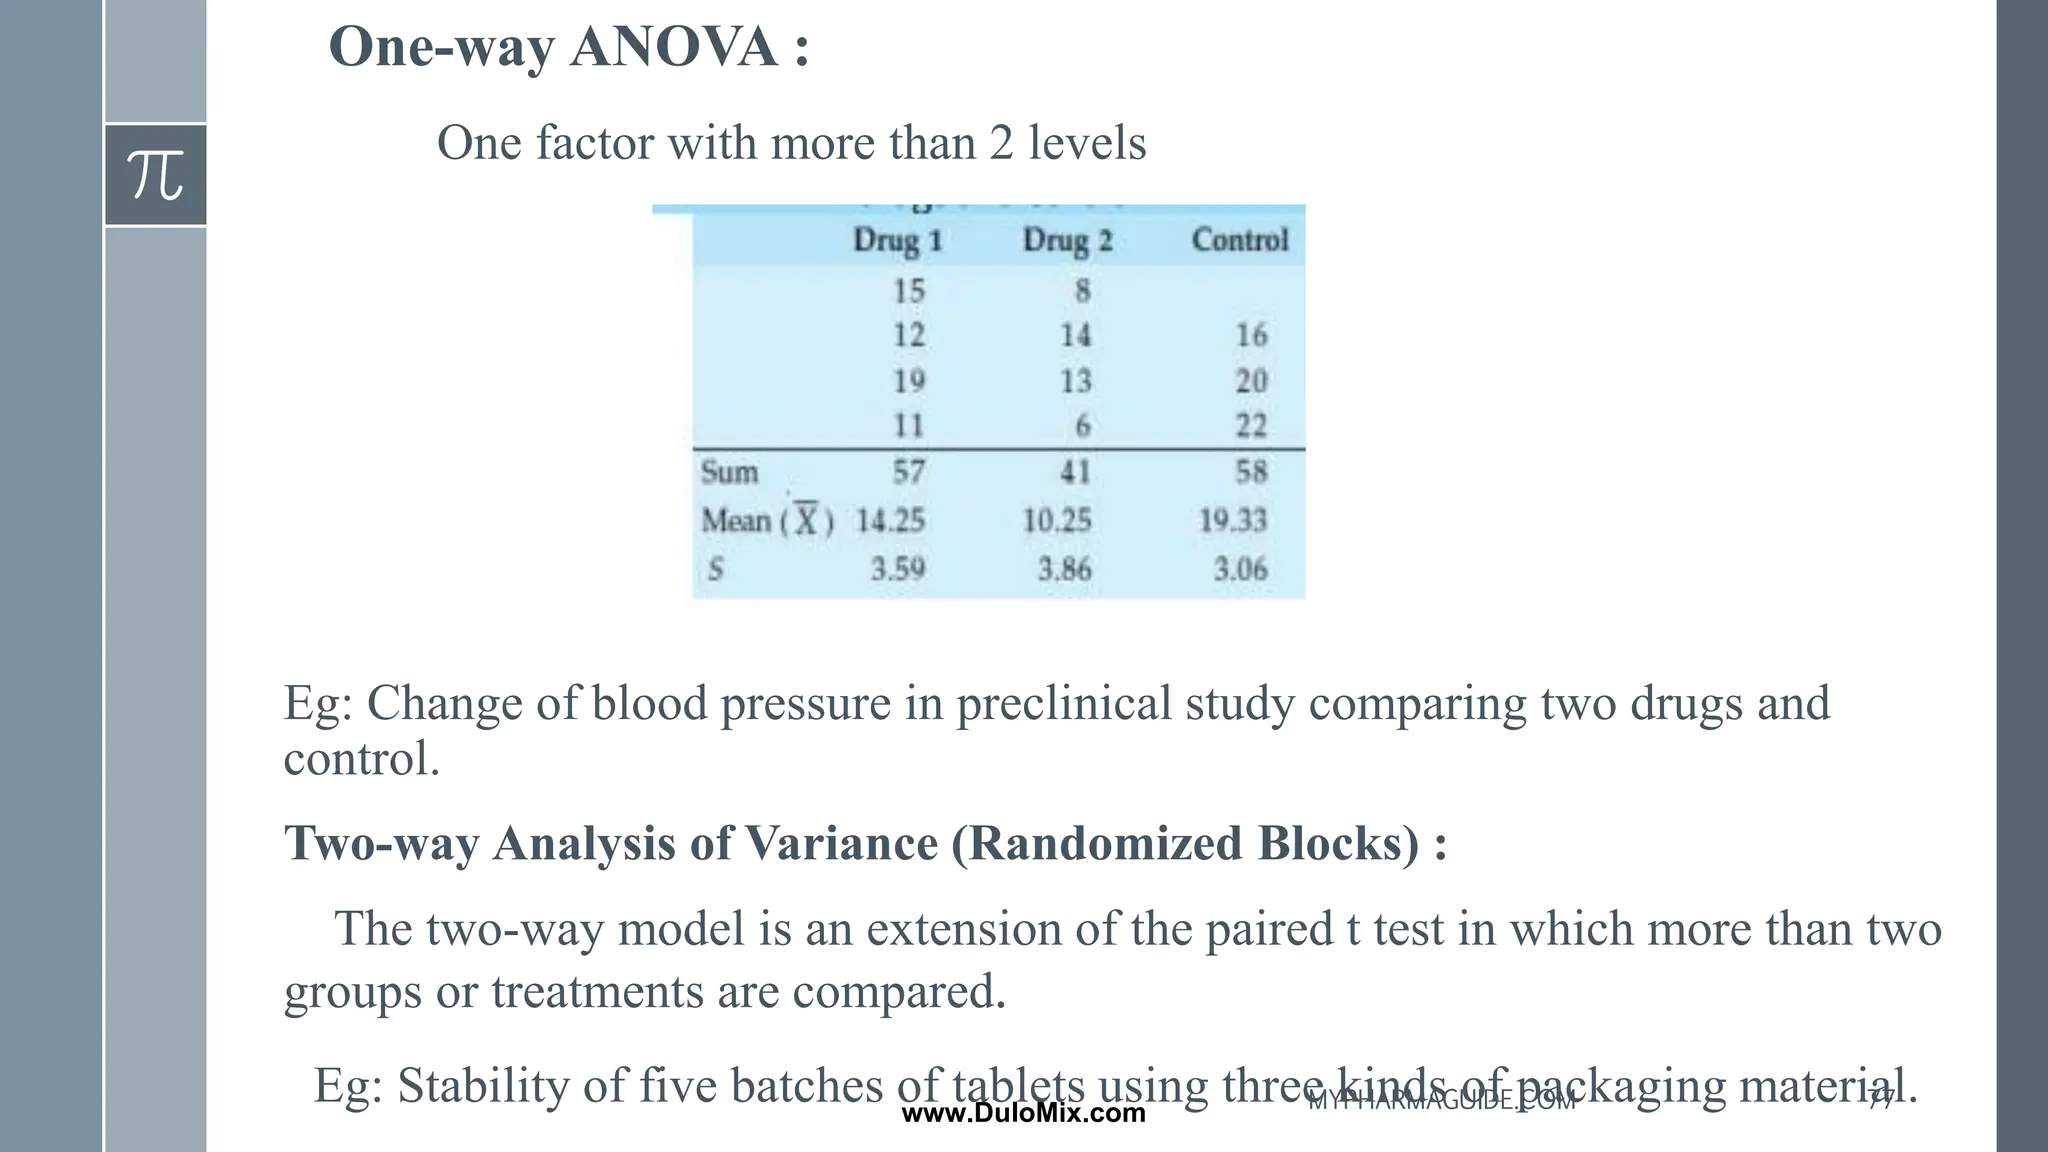
One-way ANOVA :
Onefactor with more than 2 levels
Eg: Change of blood pressure in preclinical study comparing two drugs and
control.
Two-way Analysis of Variance (Randomized Blocks) :
The two-way model is an extension of the paired t test in which more than two
groups or treatments are compared.
Eg: Stability of five batches of tablets using three kinds of packaging material.
77
MYPHARMAGUIDE.COM
www.DuloMix.com
78.
Mixed design ANOVAs
Somefactors independent, others related
Application :
1. If a pharma company, has 3 different medications for treating ulcers by
using ANOVA , we can determine the effectiveness of treating them.
can compare which medication works better for treatment and can choose
the best one.
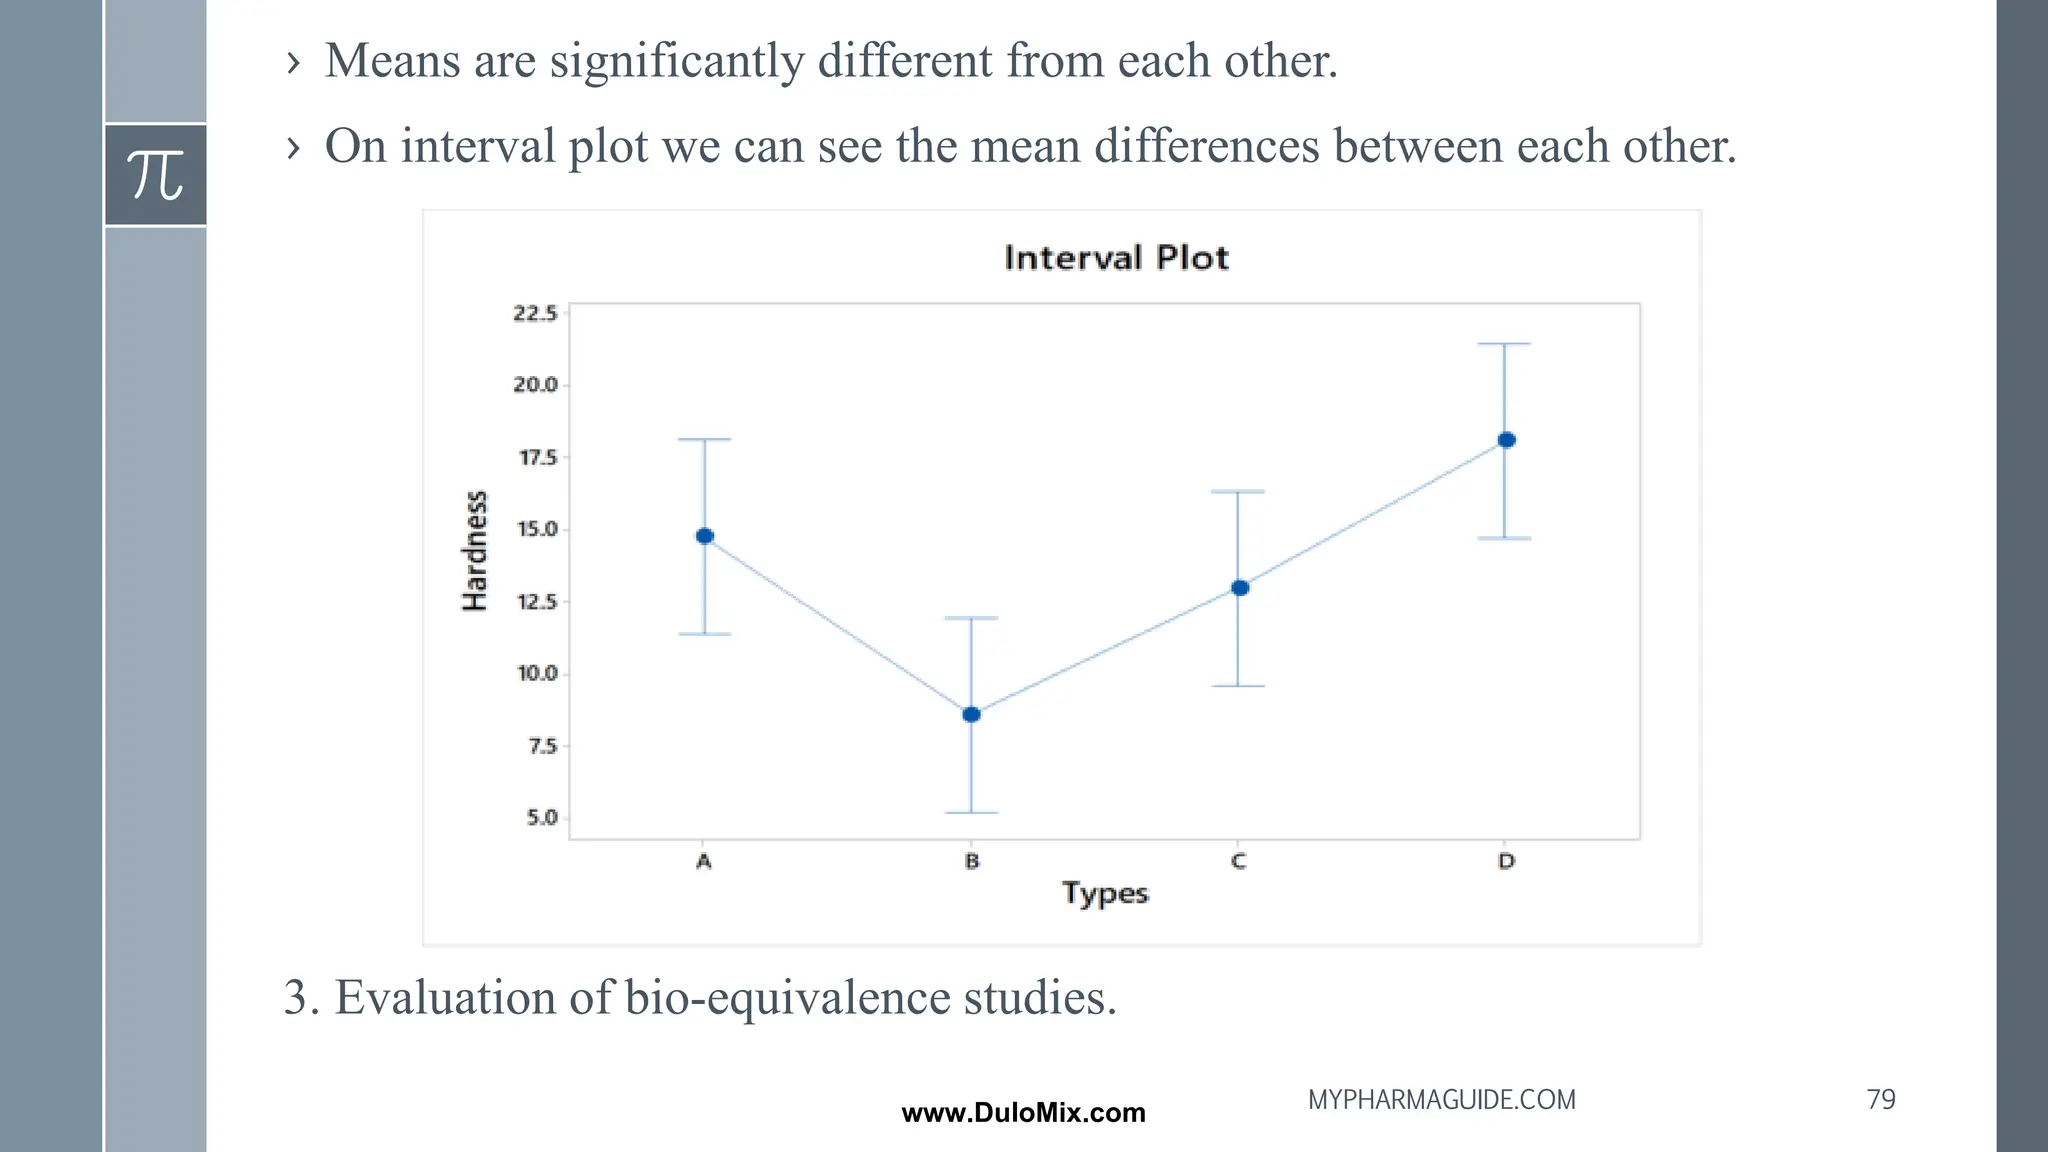
2. In Pharma company, QA officer collects four samples groups (A,B,C,D)
each of 6 tablets to measure the hardness of the tablet.
Observation :
P-value is 0.004 (From ANOVA Table) which is less than our alpha value
0.05
78
MYPHARMAGUIDE.COM
www.DuloMix.com
79.
› Means aresignificantly different from each other.
› On interval plot we can see the mean differences between each other.
3. Evaluation of bio-equivalence studies.
79
MYPHARMAGUIDE.COM
www.DuloMix.com
80.
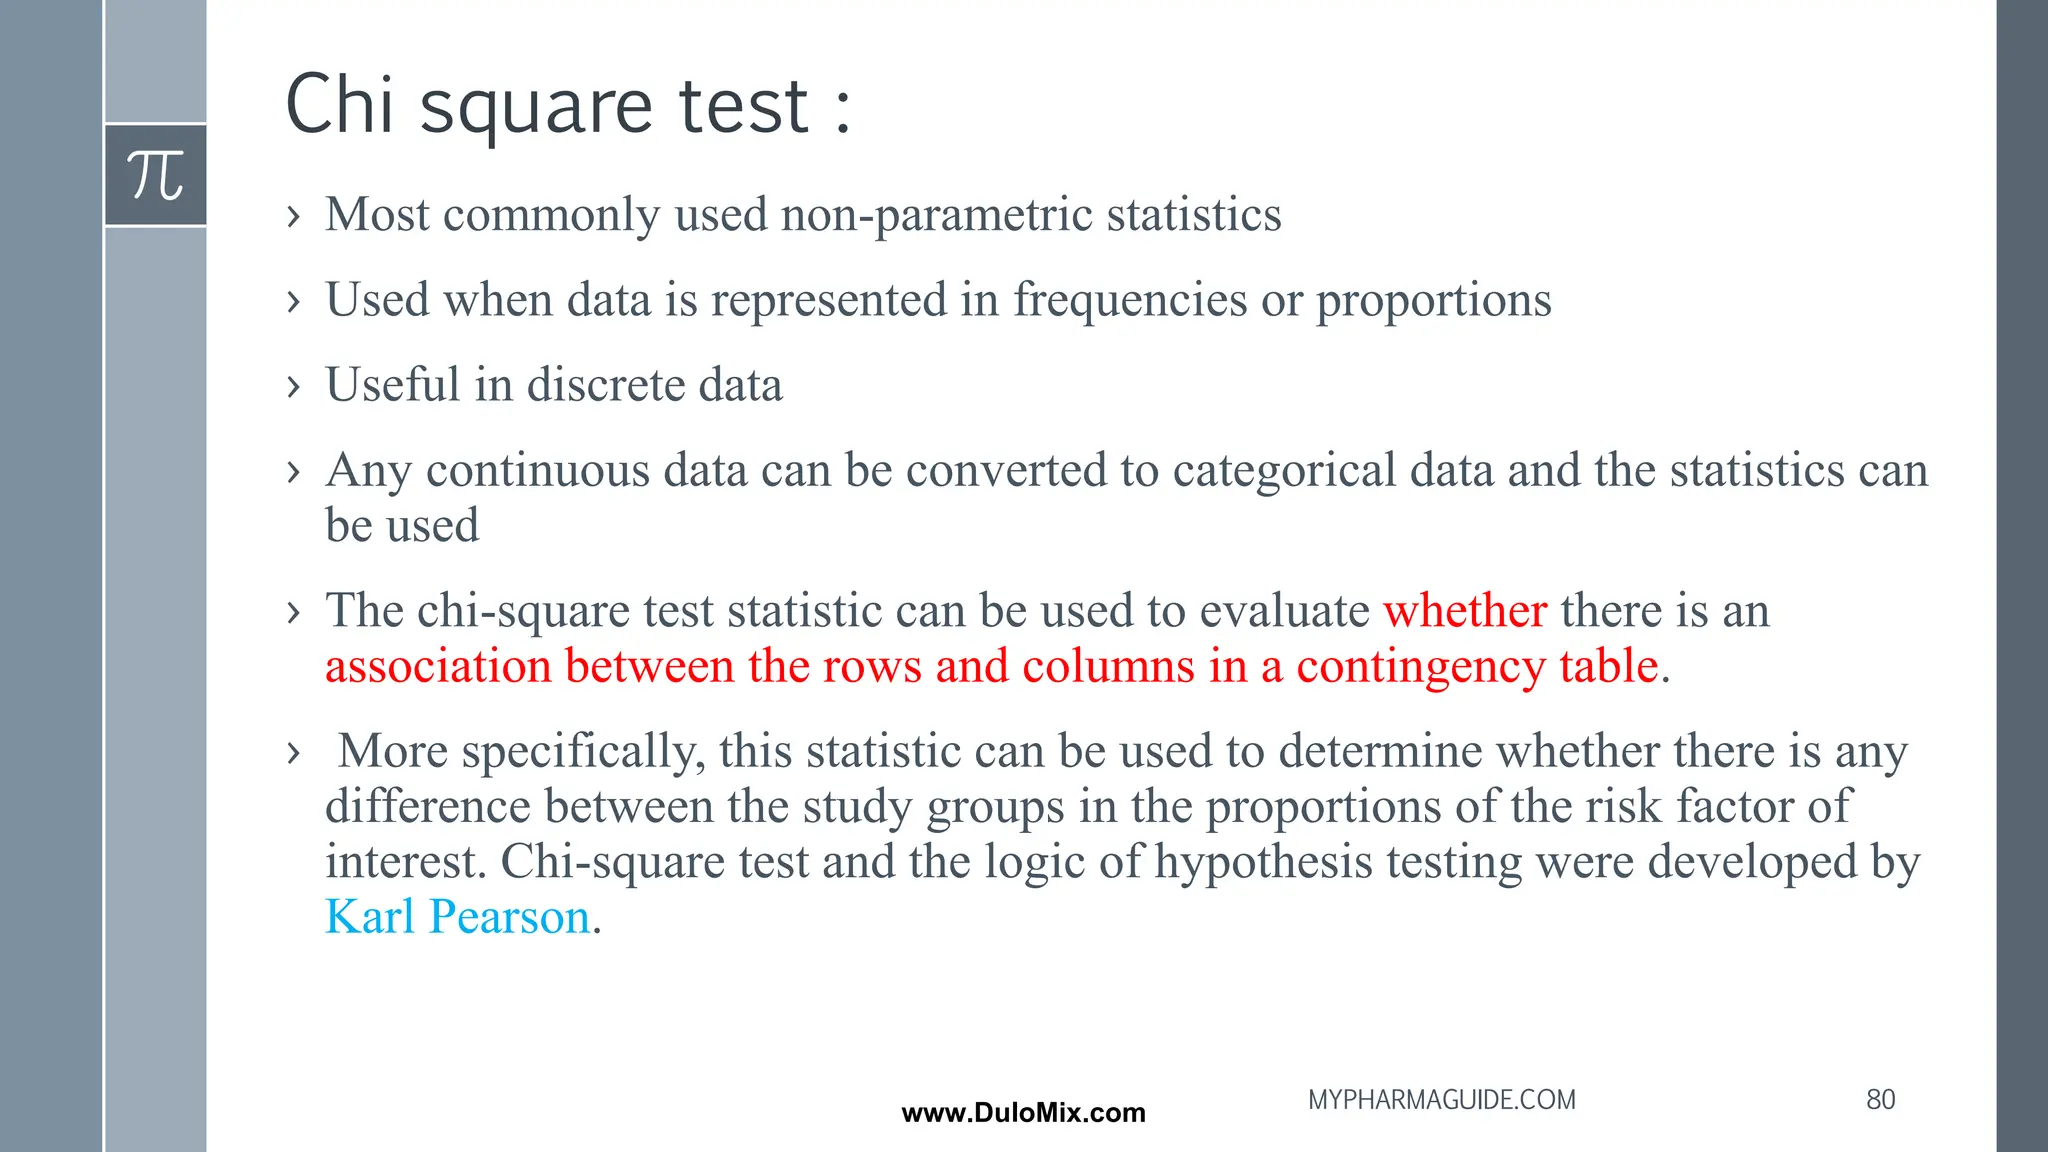
Chi square test:
› Most commonly used non-parametric statistics
› Used when data is represented in frequencies or proportions
› Useful in discrete data
› Any continuous data can be converted to categorical data and the statistics can
be used
› The chi-square test statistic can be used to evaluate whether there is an
association between the rows and columns in a contingency table.
› More specifically, this statistic can be used to determine whether there is any
difference between the study groups in the proportions of the risk factor of
interest. Chi-square test and the logic of hypothesis testing were developed by
Karl Pearson.
80
MYPHARMAGUIDE.COM
www.DuloMix.com
Students t Test:
›Pharmaceutical Company, they manufacture lakhs of tablets per day – in
such case, it is difficult to know the population parameters like mean and
standard deviation. So we apply sample t-tests.
Types of t-test
› There are various types of t-test namely
-one sample t-test,
-two sample t-test and
-paired sample t-tests.
83
MYPHARMAGUIDE.COM
www.DuloMix.com
84.
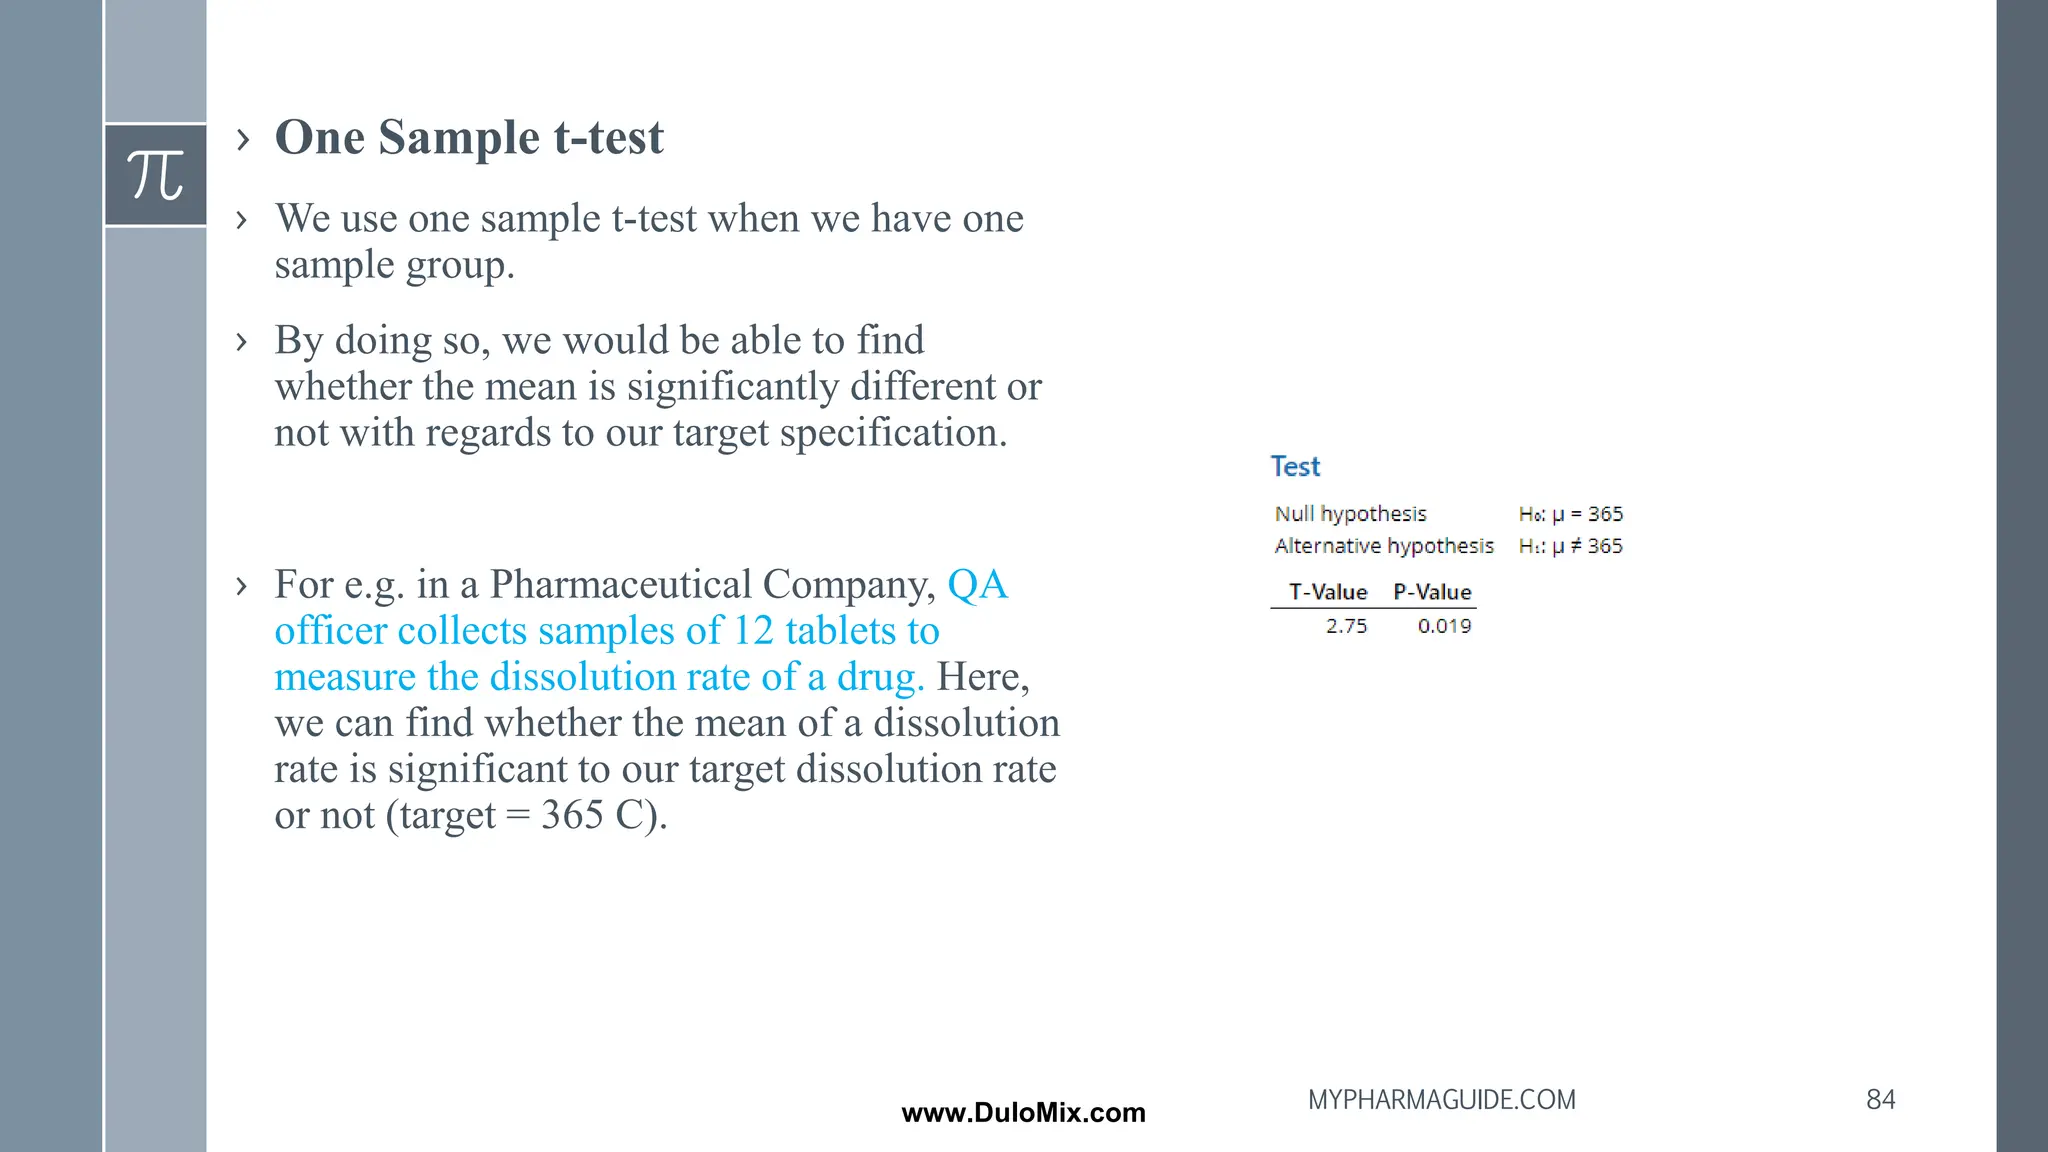
› One Samplet-test
› We use one sample t-test when we have one
sample group.
› By doing so, we would be able to find
whether the mean is significantly different or
not with regards to our target specification.
› For e.g. in a Pharmaceutical Company, QA
officer collects samples of 12 tablets to
measure the dissolution rate of a drug. Here,
we can find whether the mean of a dissolution
rate is significant to our target dissolution rate
or not (target = 365 C).
84
MYPHARMAGUIDE.COM
www.DuloMix.com
85.
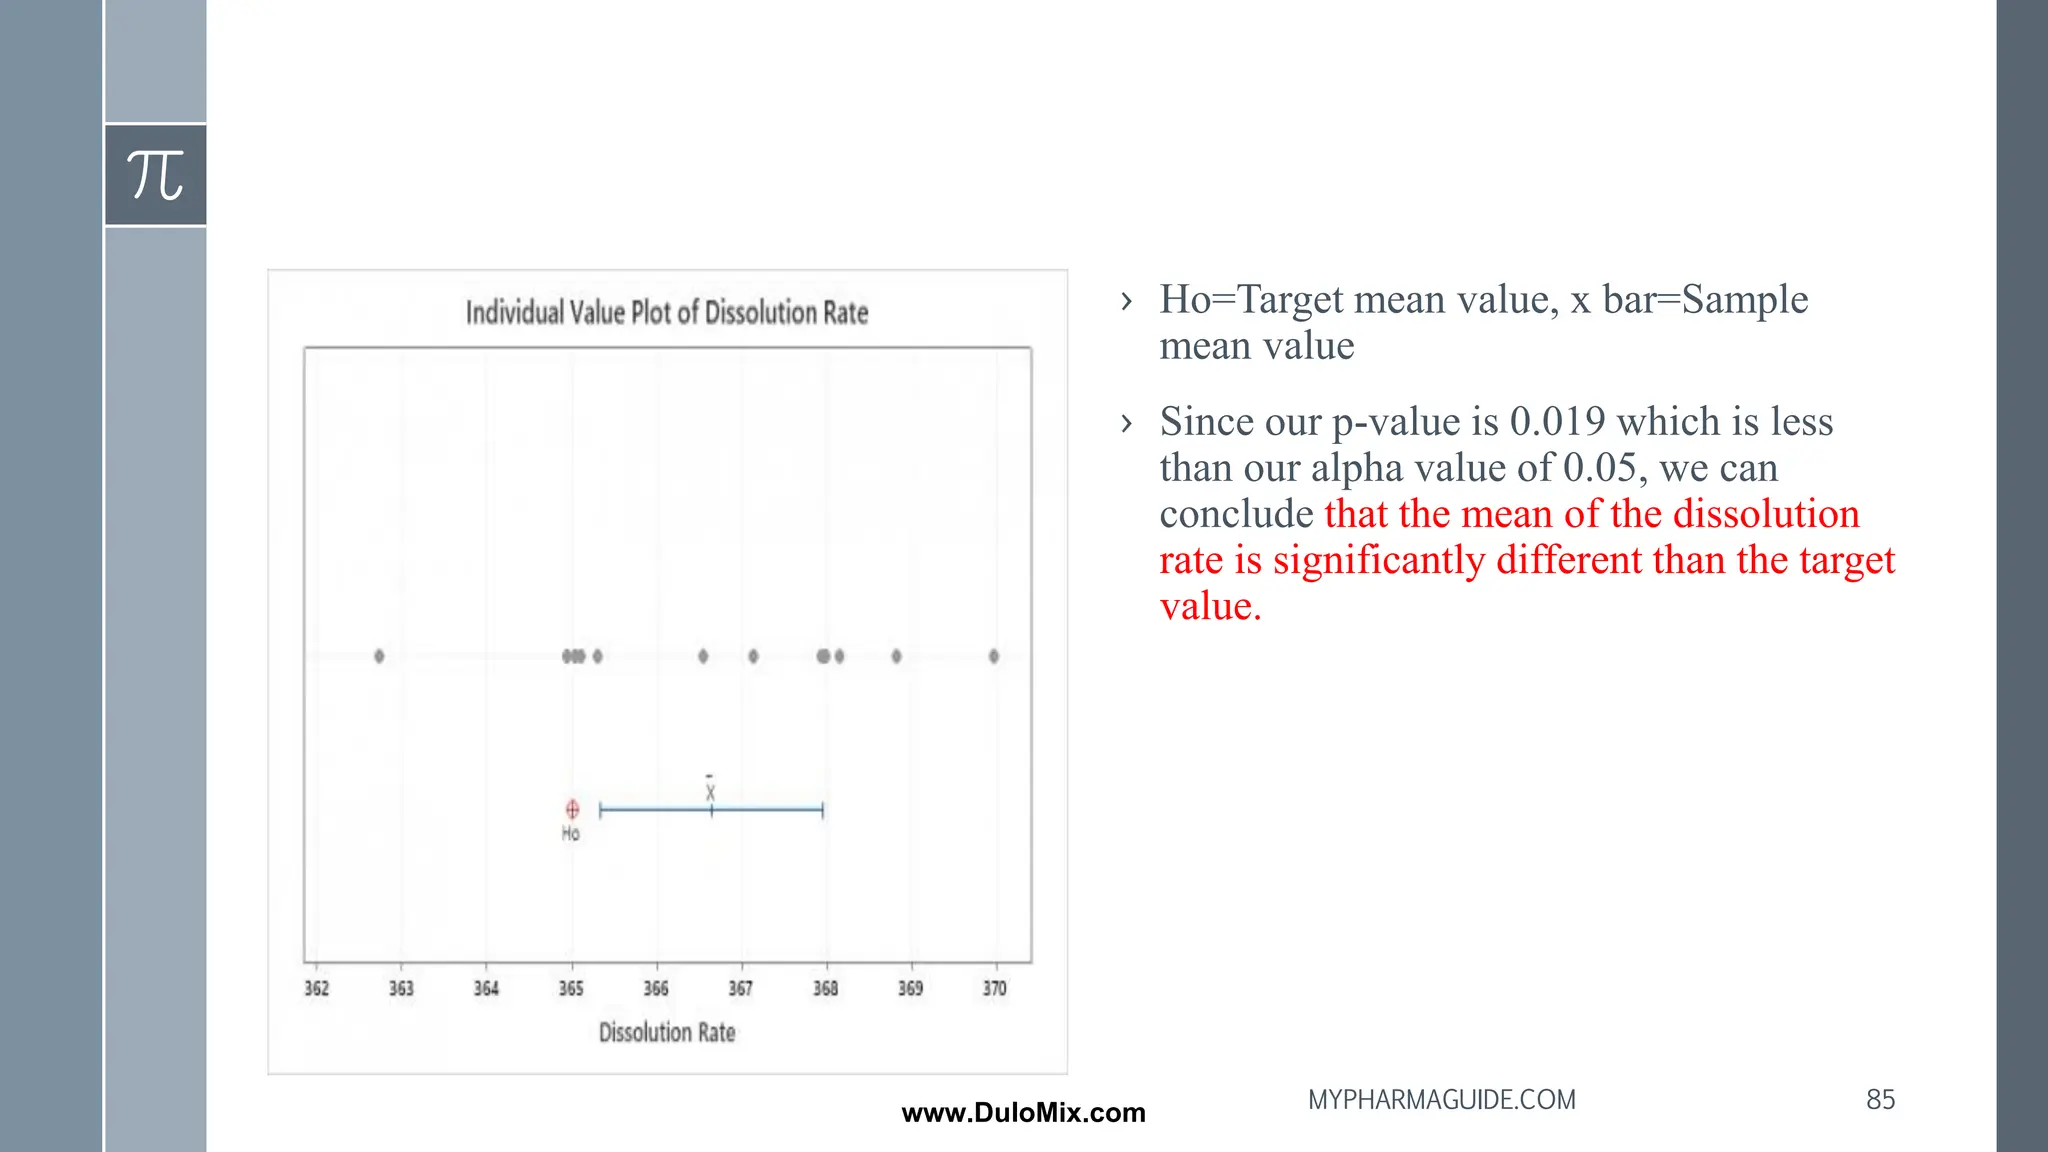
› Ho=Target meanvalue, x bar=Sample
mean value
› Since our p-value is 0.019 which is less
than our alpha value of 0.05, we can
conclude that the mean of the dissolution
rate is significantly different than the target
value.
85
MYPHARMAGUIDE.COM
www.DuloMix.com
86.
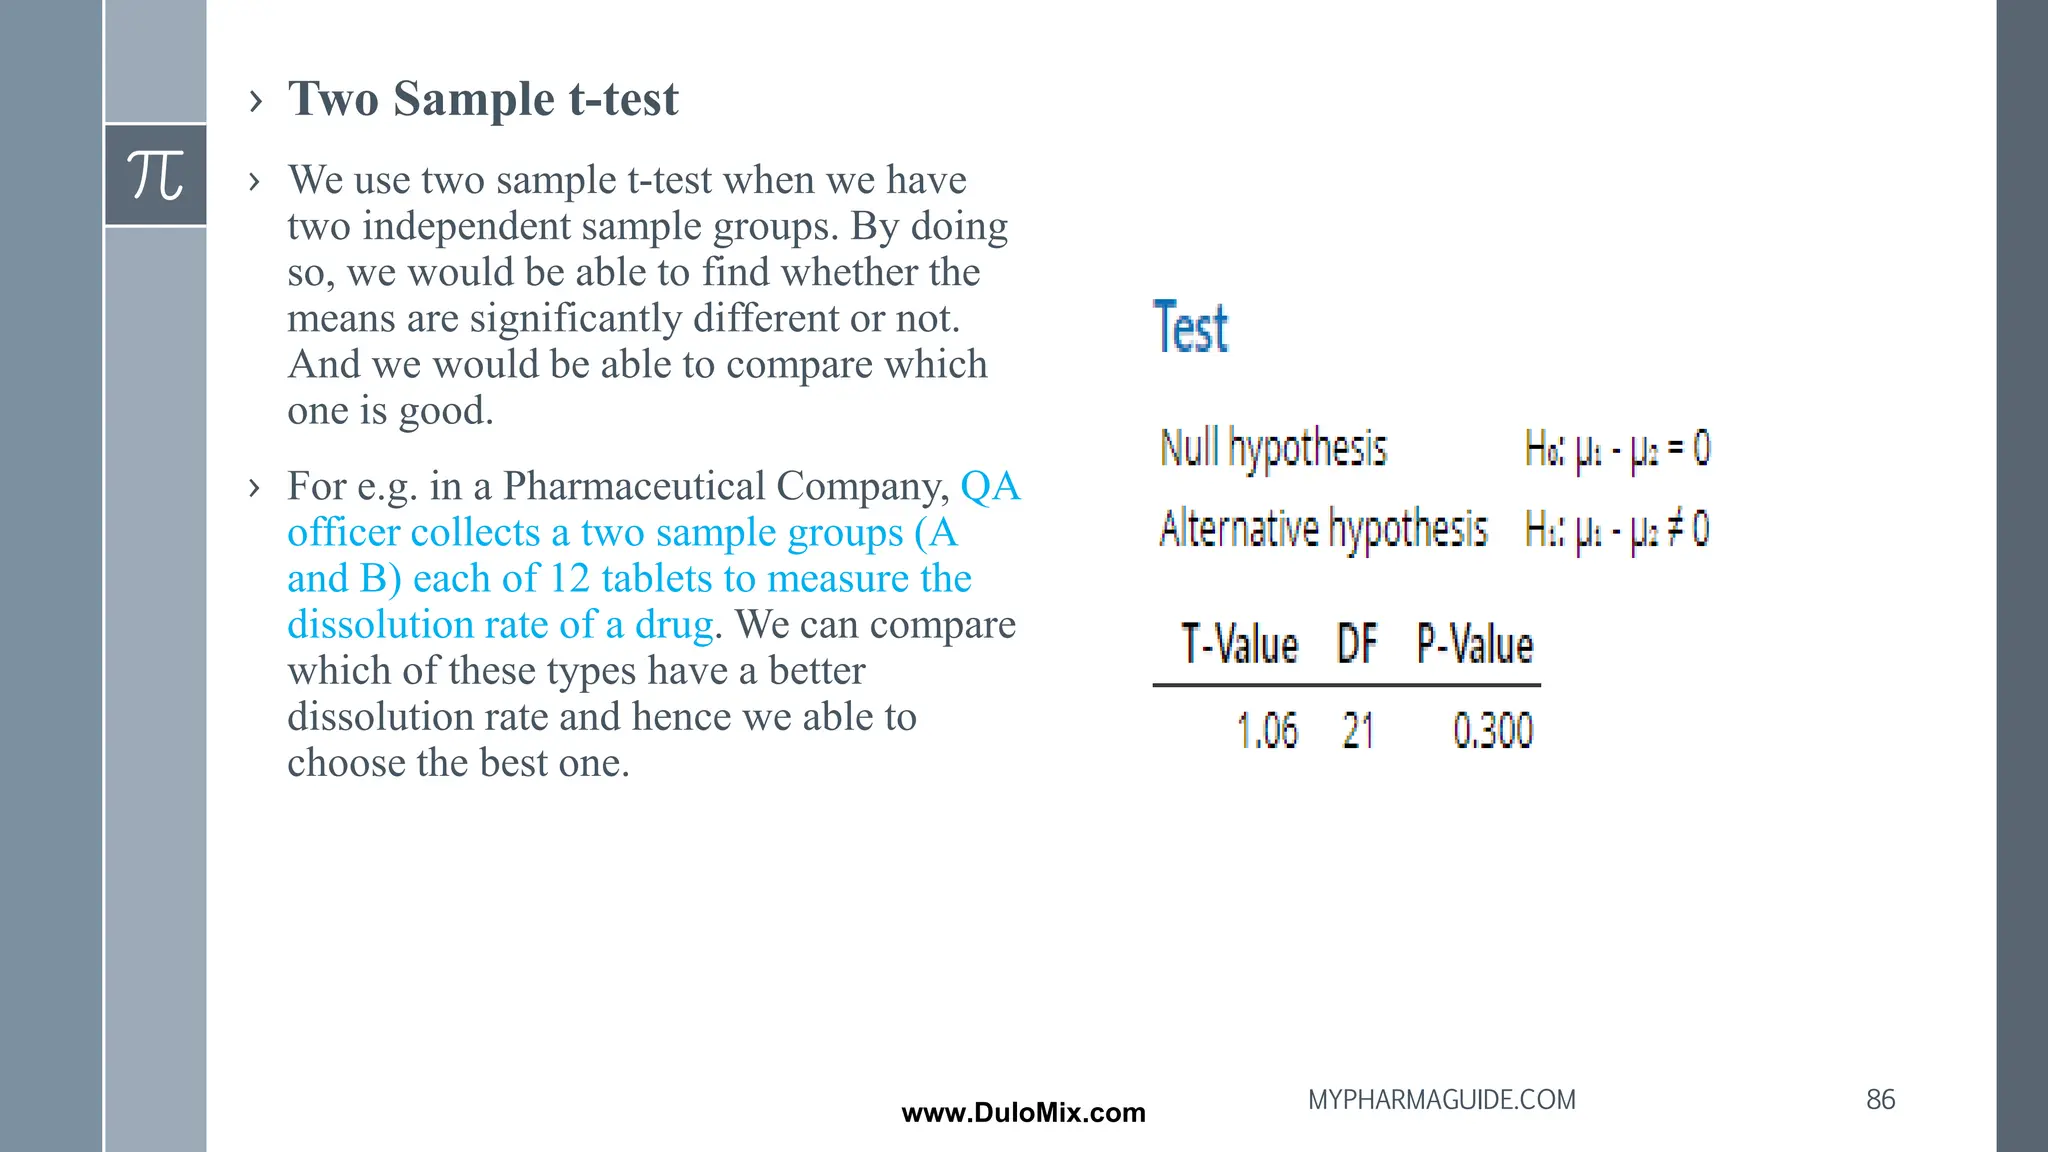
› Two Samplet-test
› We use two sample t-test when we have
two independent sample groups. By doing
so, we would be able to find whether the
means are significantly different or not.
And we would be able to compare which
one is good.
› For e.g. in a Pharmaceutical Company, QA
officer collects a two sample groups (A
and B) each of 12 tablets to measure the
dissolution rate of a drug. We can compare
which of these types have a better
dissolution rate and hence we able to
choose the best one.
86
MYPHARMAGUIDE.COM
www.DuloMix.com
87.
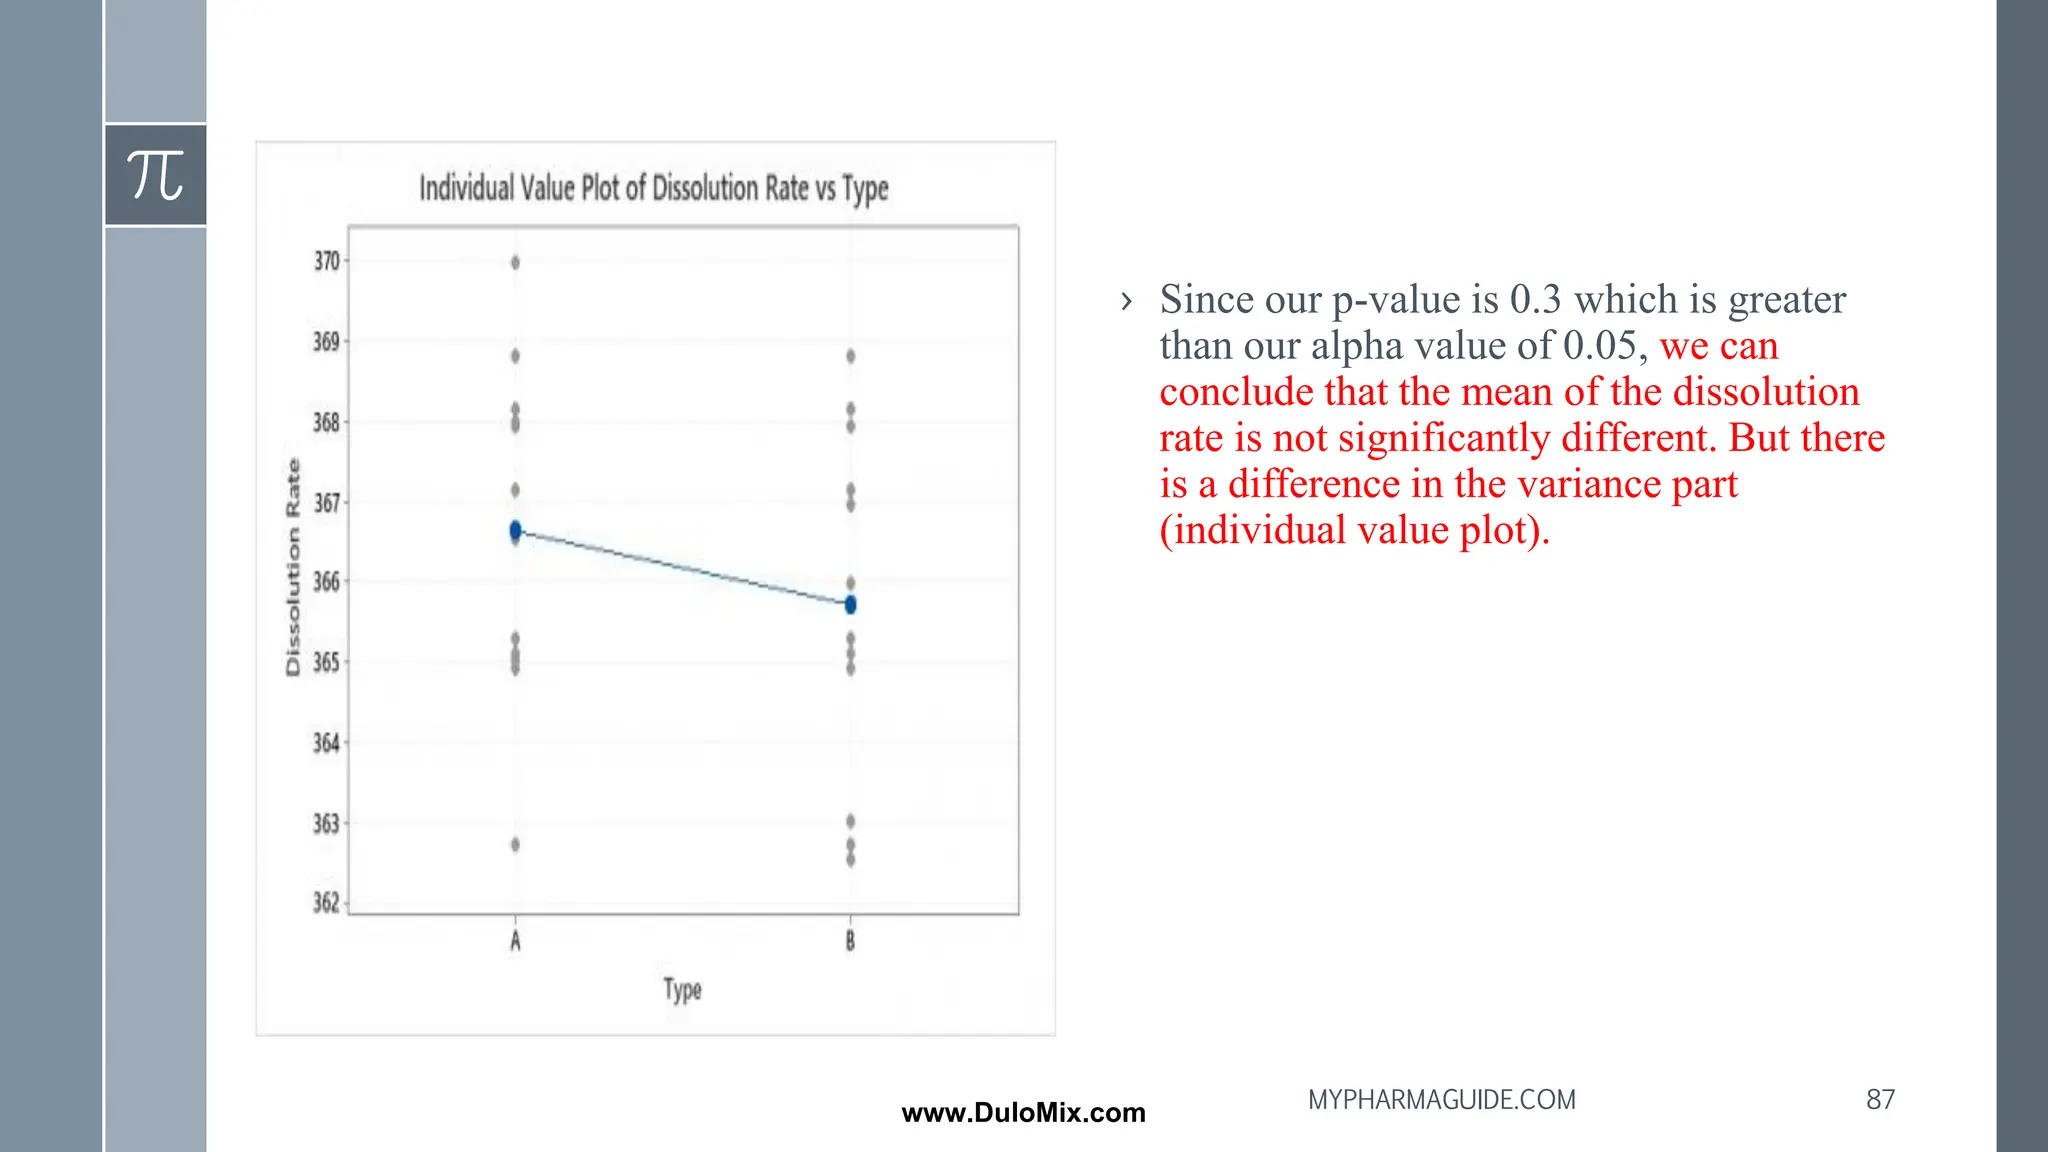
› Since ourp-value is 0.3 which is greater
than our alpha value of 0.05, we can
conclude that the mean of the dissolution
rate is not significantly different. But there
is a difference in the variance part
(individual value plot).
87
MYPHARMAGUIDE.COM
www.DuloMix.com
88.
Paired Sample t-test
›We use paired sample t-test when we have two dependent sample data of the
same subject i.e. to measure the effect on a particular group before and after
the treatment.
› For e.g. during a Clinical Trial, we choose 20 patients and measure their
weight before the drug treatment.
› And again, after the two months, we again measure their weight. By doing
so, we can check whether the drug is effective or not. Here we will have two
sets of data
› It is also called a dependent sample t-test. Here the patient’s weight is
dependent on drug treatment.
88
MYPHARMAGUIDE.COM
www.DuloMix.com
89.
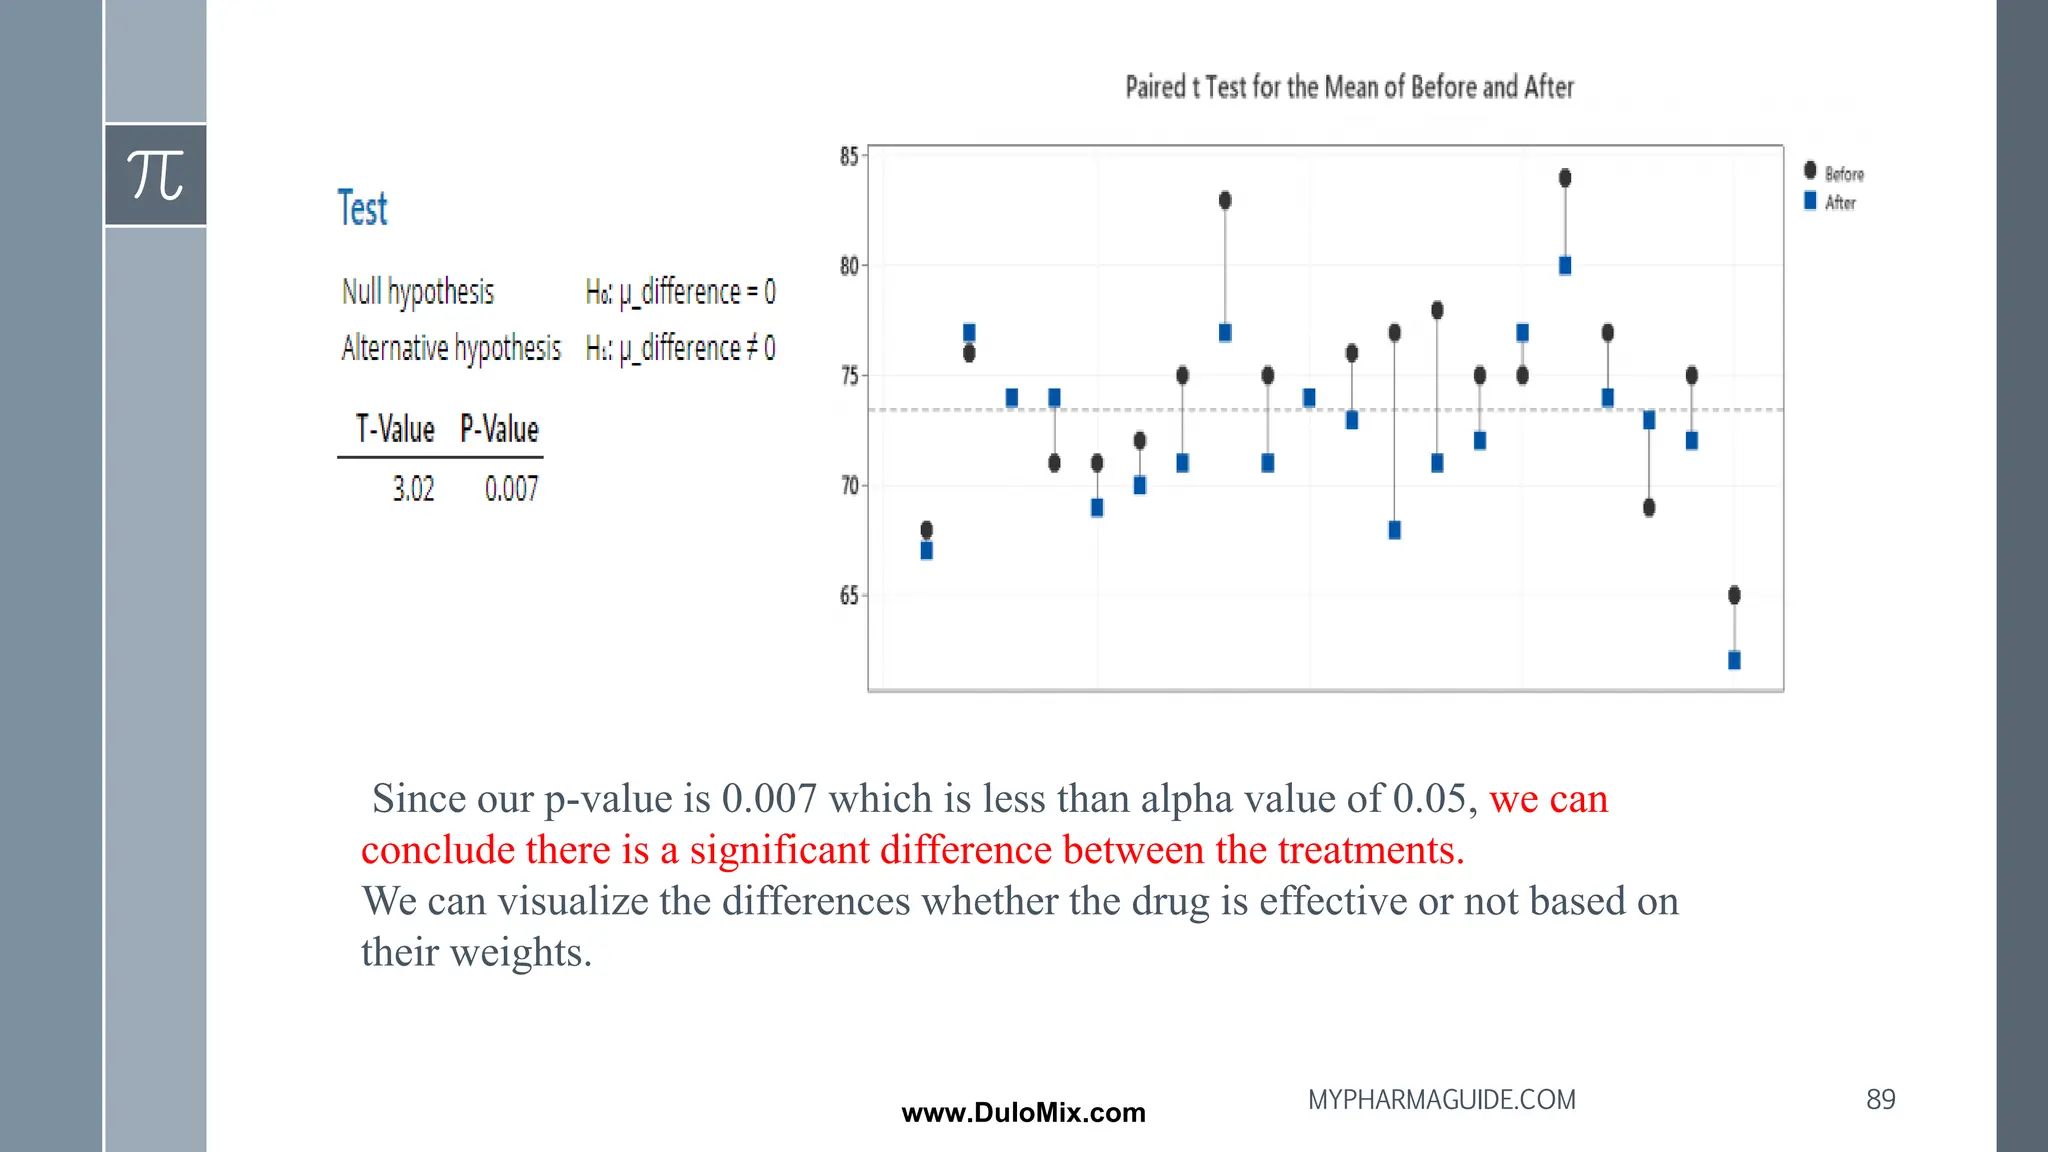
Since our p-valueis 0.007 which is less than alpha value of 0.05, we can
conclude there is a significant difference between the treatments.
We can visualize the differences whether the drug is effective or not based on
their weights.
89
MYPHARMAGUIDE.COM
www.DuloMix.com
90.
References :
1.Biopharmaceutics &Pharmacokinetics –a treatise by D M
Brahmankar, Sunil B. Jaiswal.
2.Textbook of Biopharmaceutics & pharmacokinetics –concept and
application by C.V.S.Subramaniyam.
3.Biopharmaceutics and pharmacokinetics by J.S. Kulkarni, A.P.
Pawar.
4. Martin’s Physical Pharmacy and Pharmaceutical sciences 6th
Edition.
5.Applied Biopharmaceutics and Pharmacokinetics by Leon Shargel,
PhD, RPh and Andrew B.C. Yu, PhD, RPh 7th edition.
90
MYPHARMAGUIDE.COM
www.DuloMix.com
91.
6..Lachmann Libermann, “Thetheory and practice of industrial
pharmacy”
7. https://qsutra.com/anova-in-pharmaceutical-and-healthcare/
8. https://qsutra.com/t-tests-in-pharmaceutical-industry/
9.Anoop Kumar Singh, “Formulation development of Paracetamol
tablet using natural plant based excipient as a binder”
10.Himankar Baishya et al., “Application of mathematical models
in drug release kinetics of Carbidopa and Levodopa ER tablets:
Journal of developing drugs 2017; 6(2): p(1-8)
11.Pharmaceutical Statistics : Clinical Practice & Application by
Stanford Balton.
91
MYPHARMAGUIDE.COM
www.DuloMix.com

![Relative density= Density of powder
True density of material
D=1 {when no pores left after compression}
D=0.3 or 0.1 {30% or 10% of volume of tablet consists of
Pores [porosity]}
Porosity(E) = 1-D
48
MYPHARMAGUIDE.COM
www.DuloMix.com](https://image.slidesharecdn.com/document5-240131120126-670919c5/75/Study-of-consolidation-Parameters-48-2048.jpg)
![Higuchi model is given by the equation,
C= [D (2qt-Cs) Cst] ½
C= Total amount of drug release per unit area of matrix (mg/cm2)
D= Diffusion coefficient
qt= Total amount of drug in a unit volume of matrix (mg/cm3)
Cs = Solubility of drug (mg/cm3)
t= Time
APPLICATIONS:
▪ By using this model dissolution of drug from several modified release dosage forms like
some trans-dermal system and matrix tablet with water soluble drugs are studied.
▪ Also used for study of poorly soluble drugs from variety of matrices including solids and
semisolids.
63
MYPHARMAGUIDE.COM
www.DuloMix.com](https://image.slidesharecdn.com/document5-240131120126-670919c5/75/Study-of-consolidation-Parameters-63-2048.jpg)