Study of C Parameters
Prepared by :PUTTAMREDDY
KAVYASRI
Under the guidance of Dr .V. Shanmugam
1 st year M.Pharm
Department of pharmaceutics
Mohan Babu School of pharmaceutical
sciences(MBU)
Contents:
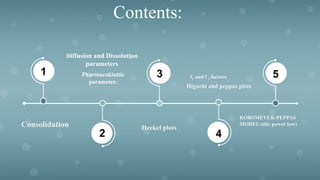
Diffusion and Dissolution
parameters
Pharmacokinitic
parameters
1
2
3
4
5
Heckel plots
f1 and f 2 factors
Consolidation
Higuchi and peppas plots
KORSMEYER-PEPPAS
MODEL:(the power law)
 Involves an increase in the mechanical strength of a
material resulting from particle- particle interactions.
 The action or process of making something stronger or
more solid.
consolidation
increase in mechanical
strength of material
on the particle-partical
interaction
by appling of
force/pressure
Consolidation process:
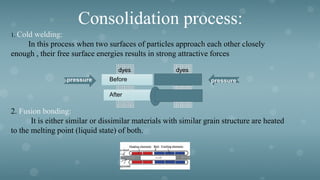
1. Cold welding:
In this process when two surfaces of particles approach each other closely
enough , their free surface energies results in strong attractive forces
2. Fusion bonding:
It is either similar or dissimilar materials with similar grain structure are heated
to the melting point (liquid state) of both.
pressure
pressure
dyes dyes
Before
After
3. Mechanical theory:
As particles undergo deformation , the particle boundaries that the edges
of the particle intermesh ,forming a mechanical bond..
4. Inter molecular forces theory:
Under pressure the molecules at the point of true contract between new,
clean surface of the granules are close enough so that vander walls forces interact
to consolidate the particle.
5. Liquid -surface film theory:
Thin liquid film form bond between the particles which binds them
together at the particle surface.the energy of compression produces melting of
solution at the particle interface followed by subsequent solidification or
crystallization thus resulting in the formation of bonded surfaces.
1.
2.
3.
4.
5.
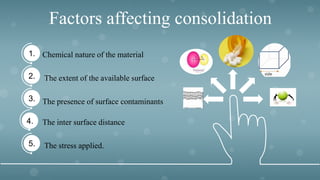
Factors affecting consolidation
Chemical nature of the material
The extent of the available surface
The presence of surface contaminants
The inter surface distance
The stress applied.
Diffusion parameters:
Diffusion is the net movement of any matter
moving from higher concentration to the region of lower
concentration.
Studying the diffusion parameters will help us to understand
the PERMEATION AND DISTRIBUTION of drug molecules
in living system
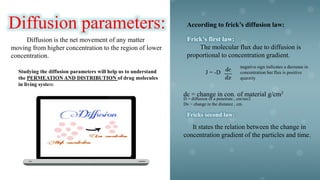
According to frick’s diffusion law:
Frick’s first law:
The molecular flux due to diffusion is
proportional to concentration gradient.
J = -D
negative sign indicates a decrease in
concentration but flux is positive
quantity
dc = change in con. of material g/cm3
D = diffusion of a penetrate , cm/sec2
Dx = change in the distance , cm.
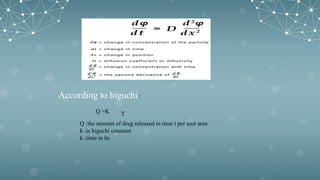
Fricks second law:
It states the relation between the change in
concentration gradient of the particles and time.
According to higuchi :
Q =K
Q :the amount of drug released in time t per unit area
k :is higuchi constant
k :time in hr.
T
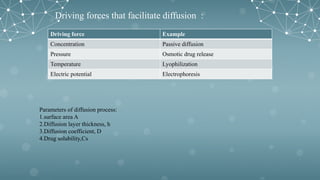
Driving force Example
Concentration Passive diffusion
Pressure Osmotic drug release
Temperature Lyophilization
Electric potential Electrophoresis
Driving forces that facilitate diffusion :
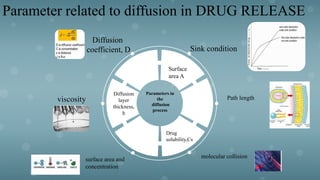
Parameters of diffusion process:
1.surface area A
2.Diffusion layer thickness, h
3.Diffusion coefficient, D
4.Drug solubility,Cs
Parameters in
the
diffusion
process
Surface
area A
Drug
solubility,Cs
Diffusion
layer
thickness,
h
Diffusion
coefficient, D Sink condition
Path length
molecular collision
viscosity
surface area and
concentration
Parameter related to diffusion in DRUG RELEASE
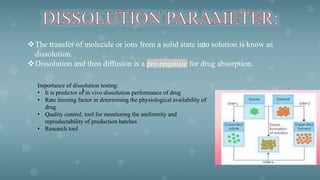
The transfer of molecule or ions from a solid state into solution is know as
dissolution.
Dissolution and then diffusion is a pre-requisite for drug absorption.
Importance of dissolution testing:
• It is predictor of in vivo dissolution performance of drug
• Rate limiting factor in determining the physiological availability of
drug
• Quality control, tool for monitoring the uniformity and
reproductability of production batches
• Research tool
l
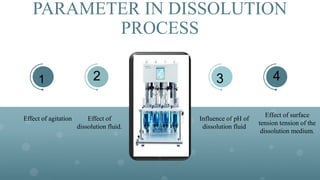
PARAMETER IN DISSOLUTION
PROCESS
Effect of agitation Effect of
dissolution fluid.
Influence of pH of
dissolution fluid
Effect of surface
tension tension of the
dissolution medium.
1 2 3 4
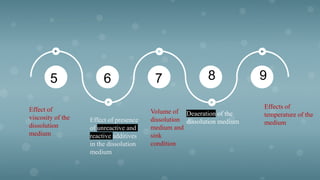
5 6 7 8 9
Effect of
viscosity of the
dissolution
medium
Effect of presence
of unreactive and
reactive additives
in the dissolution
medium
Volume of
dissolution
medium and
sink
condition
Deaeration of the
dissolution medium
Effects of
temperature of the
medium
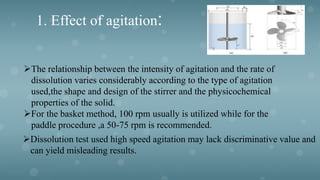
1. Effect of agitation:
The relationship between the intensity of agitation and the rate of
dissolution varies considerably according to the type of agitation
used,the shape and design of the stirrer and the physicochemical
properties of the solid.
For the basket method, 100 rpm usually is utilized while for the
paddle procedure ,a 50-75 rpm is recommended.
Dissolution test used high speed agitation may lack discriminative value and
can yield misleading results.
Effect of dissolution fluid:
Selection of proper medium for dissolution testing
depends largely on the physicochemical properties of
drug.
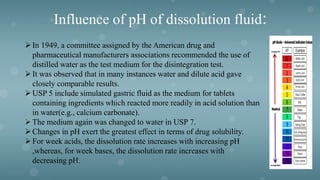
Influence of pH of dissolution fluid:
In 1949, a committee assigned by the American drug and
pharmaceutical manufacturers associations recommended the use of
distilled water as the test medium for the disintegration test.
It was observed that in many instances water and dilute acid gave
closely comparable results.
USP 5 include simulated gastric fluid as the medium for tablets
containing ingredients which reacted more readily in acid solution than
in water(e.g., calcium carbonate).
The medium again was changed to water in USP 7.
Changes in pH exert the greatest effect in terms of drug solubility.
For week acids, the dissolution rate increases with increasing pH
,whereas, for week bases, the dissolution rate increases with
decreasing pH.
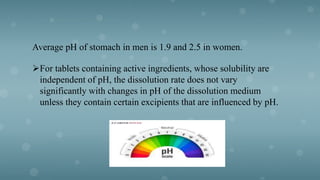
Average pH of stomach in men is 1.9 and 2.5 in women.
For tablets containing active ingredients, whose solubility are
independent of pH, the dissolution rate does not vary
significantly with changes in pH of the dissolution medium
unless they contain certain excipients that are influenced by pH.
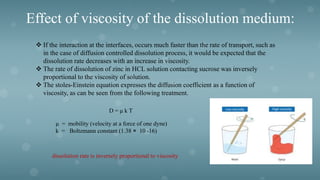
Effect of viscosity of the dissolution medium:
 If the interaction at the interfaces, occurs much faster than the rate of transport, such as
in the case of diffusion controlled dissolution process, it would be expected that the
dissolution rate decreases with an increase in viscosity.
 The rate of dissolution of zinc in HCL solution contacting sucrose was inversely
proportional to the viscosity of solution.
 The stoles-Einstein equation expresses the diffusion coefficient as a function of
viscosity, as can be seen from the following treatment.
D = μ k T
μ = mobility (velocity at a force of one dyne)
k = Boltzmann constant (1.38 Ɨ 10 -16)
dissolution rate is inversely proportional to viscosity
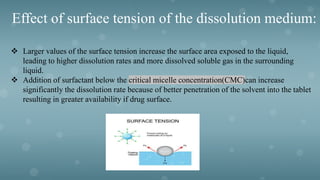
Effect of surface tension of the dissolution medium:
 Larger values of the surface tension increase the surface area exposed to the liquid,
leading to higher dissolution rates and more dissolved soluble gas in the surrounding
liquid.
 Addition of surfactant below the critical micelle concentration(CMC)can increase
significantly the dissolution rate because of better penetration of the solvent into the tablet
resulting in greater availability if drug surface.
Effect of presence of unreactive and reactive
additives in the dissolution medium
When neutral ionic compounds, such as sodium chloride and sodium
sulfate, or non ionic organic compounds,such as dextrose, were added to
the dissolution medium the dissolution of benzoic acid was dependent
linearly upon its solubility in the particular solvent.
When certain buffers or bases were added to the aqueous solvent ,an
increase in the dissolution rate was observed.
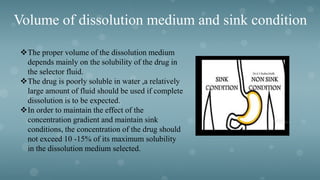
Volume of dissolution medium and sink condition
The proper volume of the dissolution medium
depends mainly on the solubility of the drug in
the selector fluid.
The drug is poorly soluble in water ,a relatively
large amount of fluid should be used if complete
dissolution is to be expected.
In order to maintain the effect of the
concentration gradient and maintain sink
conditions, the concentration of the drug should
not exceed 10 -15% of its maximum solubility
in the dissolution medium selected.
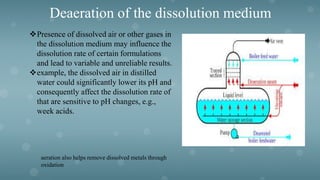
Deaeration of the dissolution medium
Presence of dissolved air or other gases in
the dissolution medium may influence the
dissolution rate of certain formulations
and lead to variable and unreliable results.

example, the dissolved air in distilled
water could significantly lower its pH and
consequently affect the dissolution rate of
that are sensitive to pH changes, e.g.,
week acids.
aeration also helps remove dissolved metals through
oxidation
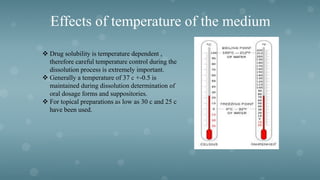
Effects of temperature of the medium
 Drug solubility is temperature dependent ,
therefore careful temperature control during the
dissolution process is extremely important.
 Generally a temperature of 37 c +-0.5 is
maintained during dissolution determination of
oral dosage forms and suppositories.
 For topical preparations as low as 30 c and 25 c
have been used.
:
Pharmacokinetics is defined as the kinetics of drug absorption,
distribution, metabolism, and excretion and their relationship with
pharmacologic, therapeutic or toxicological response in humans and
animals.
The important pharmacokinetic parameters:
1. Peak plasma concentration (C max).
2. Time of plasma concentration (t max).
3. Area under the curve (AUC).
1.Peak plasma concentration (C max):
• The point of maximum
concentration of a drug in
plasma is called as peak
and the concentration of
drug at peak is known as
peak plasma
concentration.
• It is also called as peak
height concentration and
maximum drug
concentration.
• C max is expressed in
mcg/ml.
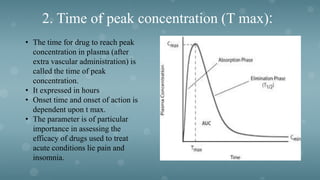
2. Time of peak concentration (T max):
• The time for drug to reach peak
concentration in plasma (after
extra vascular administration) is
called the time of peak
concentration.
• It expressed in hours
• Onset time and onset of action is
dependent upon t max.
• The parameter is of particular
importance in assessing the
efficacy of drugs used to treat
acute conditions lie pain and
insomnia.
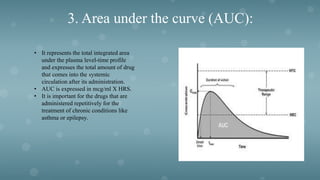
3. Area under the curve (AUC):
• It represents the total integrated area
under the plasma level-time profile
and expresses the total amount of drug
that comes into the systemic
circulation after its administration.
• AUC is expressed in mcg/ml X HRS.
• It is important for the drugs that are
administered repetitively for the
treatment of chronic conditions like
asthma or epilepsy.
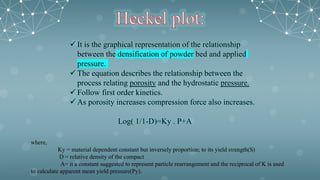
 It is the graphical representation of the relationship
between the densification of powder bed and applied
pressure.
 The equation describes the relationship between the
process relating porosity and the hydrostatic pressure.
 Follow first order kinetics.
 As porosity increases compression force also increases.
Log( 1/1-D)=Ky . P+A
where,
Ky = material dependent constant but inversely proportion; to its yield strength(S)
D = relative density of the compact
A= it a constant suggested to represent particle rearrangement and the reciprocal of K is used
to calculate apparent mean yield pressure(Py).
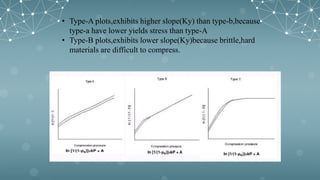
BASED ON HECKEL EQUATION:
3 types of powders:
1.Type-A,
2.Type-B,
3.Type-C.
FOR TYPE - A MATERIAL:
A linear relationship is observed , the plots remaining parallel as the applied
pressure is increased indicating deformation apparently only by plastic deformation.
Soft materials undergo plastic deformation readily and retain different degree of porosity,
depending upon the initial packing of die. thus, inturn influenced by the size distribution,shape etc.,
of the original particles.
e.g: sodium chloride
FOR TYPE -B MATERIAL:
There is an initial curved region followed by a straight line.
This indicates that the particles are fragmenting at the early stages of the
compression process.
Harder materials with higher yield pressure values usually undergo compression by
fragmentation first, to provide a denser packing.
e.g:Lactose;sucrose.
FOR TYPE-C MATERIALS:
There is an initial step linear region which become superimposed and
flatten out as applied pressure is increased.
This behaviour to the absence of a rearrangement stage and densification is
due to plastic deformation and asperity melting.
• Type-A plots,exhibits higher slope(Ky) than type-b,because
type-a have lower yields stress than type-A
• Type-B plots,exhibits lower slope(Ky)because brittle,hard
materials are difficult to compress.
Limitations:
• Heckel plot is influenced by:
1. Degree of lubrication.
2. Size of the die.
3residual porosity in particular formulations provide good mechanical
strength,rapid water intake and hence good disintegration characteristics..
Application:
1.Used for check lubricant efficacy.
2. For interpretation of consolidation mechanism
3.it identifies the predominant form of deformation for a given sample
4.heckel plot represent in two regions:
1. initial repacking state.
2. Subsequent deformation process..
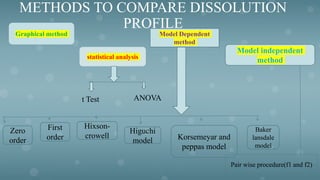
METHODS TO COMPARE DISSOLUTION
PROFILE
Graphical method
statistical analysis
Model Dependent
method
Model independent
method
t Test ANOVA
First
order
Hixson-
crowell
Higuchi
model Korsemeyar and
peppas model
Baker
lansdale
model
Zero
order
Pair wise procedure(f1 and f2)
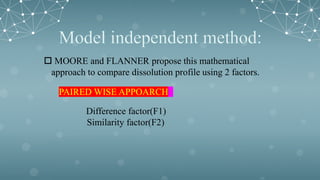
 MOORE and FLANNER propose this mathematical
approach to compare dissolution profile using 2 factors.
PAIRED WISE APPOARCH:
Difference factor(F1)
Similarity factor(F2)
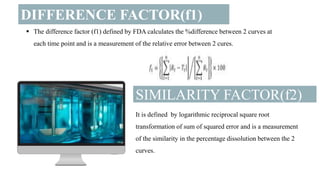
DIFFERENCE FACTOR(f1)
SIMILARITY FACTOR(f2)
ļ‚§ The difference factor (f1) defined by FDA calculates the %difference between 2 curves at
each time point and is a measurement of the relative error between 2 cures.
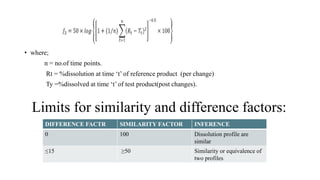
It is defined by logarithmic reciprocal square root
transformation of sum of squared error and is a measurement
of the similarity in the percentage dissolution between the 2
curves.
• where;
n = no.of time points.
Rt = %dissolution at time ā€˜t’ of reference product (per change)
Ty =%dissolved at time ā€˜t’ of test product(post changes).
DIFFERENCE FACTR SIMILARITY FACTOR INFERENCE
0 100 Dissolution profile are
similar
≤15 ≄50 Similarity or equivalence of
two profiles
Limits for similarity and difference factors:
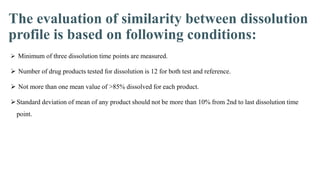
The evaluation of similarity between dissolution
profile is based on following conditions:
 Minimum of three dissolution time points are measured.
 Number of drug products tested for dissolution is 12 for both test and reference.
 Not more than one mean value of >85% dissolved for each product.
Standard deviation of mean of any product should not be more than 10% from 2nd to last dissolution time
point.
Advantage:
They are easy to compute.
They provide a single number to describe the comparison of dissolution profile data.
They are easy to produce.
Disadvantage:
• The values of f1 and f2 are sensitive to the number of dissolution time point used.
• If the test and reference formulation are interchanged ,f2 is unchanged but f1 is not, yet difference between two
mean profile remains same.
• The basis of criteria for the difference or similarity between dissolution profile in unclear.
Applications:
FOR F1:
F1 is specially used to compare two dissolution profiles being necessary to consider one of them as
reference and std. product.
It can measure the percent of error between two curves overall time points.
FOR F2:
This method is more appropriate when more than 3 or 4 dissolution time points are available.
The f2 may became invariant with respect to location change and consequence of failure to take
into account the shape of cure and unequal spacing between sampling time points leads to errors.
Nevertheless with the slight modification in the statistical analysis,similarity factor would
definitely serves as an efficient tool for reliable comparison of dissolution profiles.
HIGUCHI MODEL:
(Diffusion matrix formulation)
 Higuchi proposed is model to describe
 It is developed to study the water soluble and low soluble drugs incorporated in semisolid and solid
matric s.
 It is based on the hypothesis that;
1. Initial drug concentration in the matrix is much higher than drug solubility.
2. Drug diffusion takes place in only one direction(edge effect must be negligible.)
3. Drug particles are much smaller than system thickness.
4. Matrix swelling and dissolution are negligible.
5. Drug diffusivity is constant.
6. Prefect sink conditions are always attained in the release environment.
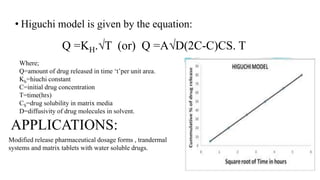
• Higuchi model is given by the equation:
Q =KH.√T (or) Q =A√D(2C-C)CS. T
Where;
Q=amount of drug released in time ā€˜t’per unit area.
Kh=hiuchi constant
C=initial drug concentration
T=time(hrs)
CS=drug solubility in matrix media
D=diffusivity of drug molecules in solvent.
APPLICATIONS:
Modified release pharmaceutical dosage forms , trandermal
systems and matrix tablets with water soluble drugs.
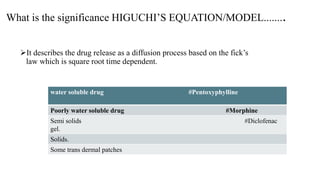
What is the significance HIGUCHI’S EQUATION/MODEL........
It describes the drug release as a diffusion process based on the fick’s
law which is square root time dependent.
water soluble drug #Pentoxyphylline
Poorly water soluble drug #Morphine
Semi solids #Diclofenac
gel.
Solids.
Some trans dermal patches
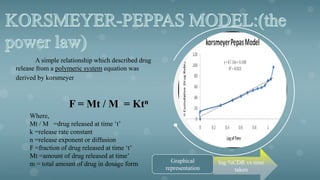
A simple relationship which described drug
release from a polymeric system equation was
derived by korsmeyer
F = Mt / M = Ktn
Where,
Mt / M =drug released at time ā€˜t’
k =release rate constant
n =release exponent or diffusion
F =fraction of drug released at time ā€˜t’
Mt =amount of drug released at time’
m = total amount of drug in dosage form Graphical
representation
log %CDR vs time
taken
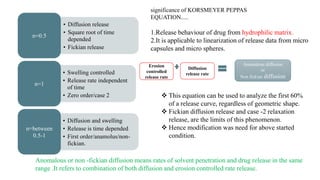
• Diffusion release
• Square root of time
depended
• Fickian release
n=0.5
• Swelling controlled
• Release rate independent
of time
• Zero order/case 2
n=1
• Diffusion and swelling
• Release is time depended
• First order/anamolus/non-
fickian.
n=between
0.5-1
significance of KORSMEYER PEPPAS
EQUATION.....
1.Release behaviour of drug from hydrophilic matrix.
2.It is applicable to linearization of release data from micro
capsules and micro spheres.
 This equation can be used to analyze the first 60%
of a release curve, regardless of geometric shape.
 Fickian diffusion release and case -2 relaxation
release, are the limits of this phenomenon.
 Hence modification was need for above started
condition.
Erosion
controlled
release rate
Diffusion
release rate
Anomalous diffusion
or
Non fickian diffusion
Anomalous or non -fickian diffusion means rates of solvent penetration and drug release in the same
range .It refers to combination of both diffusion and erosion controlled rate release.
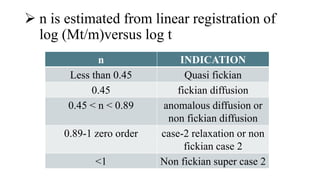
 n is estimated from linear registration of
log (Mt/m)versus log t
n INDICATION
Less than 0.45 Quasi fickian
0.45 fickian diffusion
0.45 < n < 0.89 anomalous diffusion or
non fickian diffusion
0.89-1 zero order case-2 relaxation or non
fickian case 2
<1 Non fickian super case 2
REFERENCES:
1. Theory and Practice of Industrial Pharmacy By Lachmann and Lieberman
2. Pharmaceutical dosage forms: Tablets Vol. 1-3 by Leon Lachmann. 3. Pharmaceutical Dosage
forms: Disperse systems, Vol, 1-2; By Leon
Lachmann.
4. Pharmaceutical Dosage forms: Parenteral medications Vol. 1-2; By Leon
Lachmann.
5. Modern Pharmaceutics; By Gillbert and S. Banker.
6.https://www.slideshare.net/sagarsavale1/drug-release-kinetics
7.Biopharmaceutics and pharmacokinetics by D.M. Bhramankar and Sunil b.Jaiswal
THANK YOU