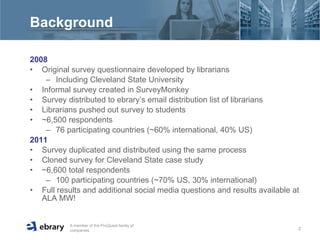
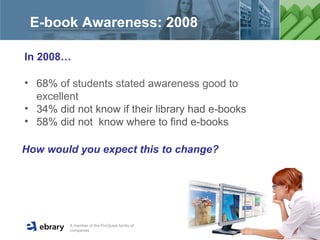
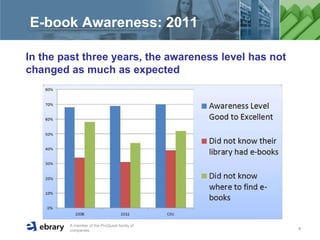
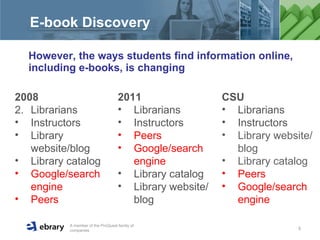
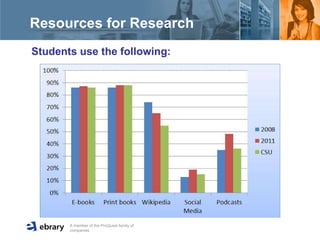
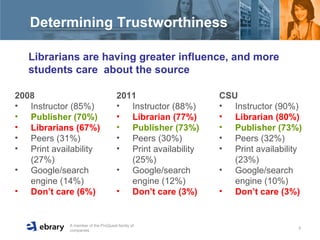
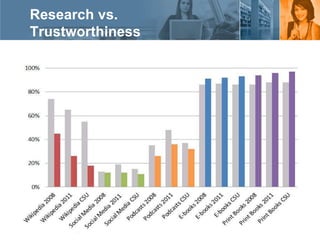
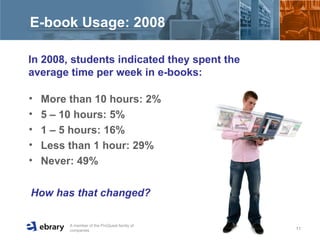
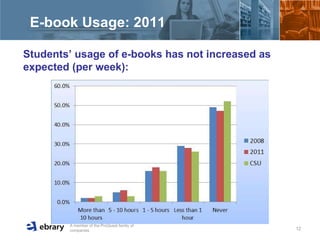
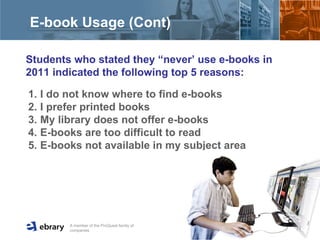
Are We Meeting Students’ Research Needs?  A Comparison of ebrary’s 2008 and 2011 Global Student  E-book Surveys
Background 2008 Original survey questionnaire developed by librarians  Including Cleveland State University Informal survey created in SurveyMonkey Survey distributed to ebrary’s email distribution list of librarians Librarians pushed out survey to students ~6,500 respondents  76 participating countries (~60% international, 40% US)  2011 Survey duplicated and distributed using the same process Cloned survey for Cleveland State case study ~6,600 total respondents  100 participating countries (~70% US, 30% international) Full results and additional social media questions and results available at ALA MW!
E-book Awareness: 2008  68%  of students stated awareness good to excellent 34% did not know if their library had e-books 58% did not  know where to find e-books How would you expect this to change?  In 2008…
E-book Awareness: 2011  In the past three years, the awareness level has not changed as much as expected
E-book Discovery However, the ways students find information online, including e-books, is changing 2008 Librarians  Instructors  Library website/blog  Library catalog  Google/search engine Peers  2011  Librarians  Instructors  Peers Google/search engine  Library catalog  Library website/blog  CSU Librarians  Instructors  Library website/blog  Library catalog   Peers  Google/search engine
Resources for Research  Students use the following:
Determining Trustworthiness 2008 Instructor (85%) Publisher (70%) Librarians (67%) Peers (31%) Print availability (27%) Google/search engine (14%) Don’t care (6%) 2011  Instructor (88%) Librarian (77%) Publisher (73%) Peers (30%) Print availability (25%) Google/search engine (12%) Don’t care (3%) CSU Instructor (90%) Librarian (80%) Publisher (73%) Peers (32%) Print availability (23%) Google/search engine (10%) Don’t care (3%) Librarians are having greater influence, and more  students care  about the source
Research vs. Trustworthiness
E-book Features  Collaborative and accessibility features are increasingly important to students
E-book Features:  2011 Social Media 58% likely to use social media to share info with peers, while 59% would use it if recommended by peers Importance of specialized apps – students prefer Facebook and Google Special apps will drive discovery
E-book Usage: 2008  In 2008, students indicated they spent the average time per week in e-books:  More than 10 hours: 2% 5 – 10 hours: 5% 1 – 5 hours: 16% Less than 1 hour: 29% Never: 49% How has that changed?
E-book Usage: 2011 Students’ usage of e-books has not increased as expected (per week):
E-book Usage (Cont)  Students who stated they “never’ use e-books in 2011 indicated the following top 5 reasons:  I do not know where to find e-books I prefer printed books My library does not offer e-books E-books are too difficult to read E-books not available in my subject area
E-book Usage (Cont)  When asked what would make e-books more suitable, students indicated the following in 2011:
E vs. P Books: 2008 In 2008, students indicated how often they would use E over P if available Very often: 23% Often: 28% Sometimes: 32% Rarely: 14% Never: 3% How has that changed?
E vs. P Books (Cont)  The majority would still prefer e-books if available
Conclusions  According to data from this informal survey  Students’ perceptions and trend have not changed as much as expected in the last three years Students are now relying more on their librarians to determine information trustworthiness Students are sharing information more now than three years ago (including social media), but are still not trusting it as a resource
Implications  What can we do as vendors, librarians, and publishers to better address student needs?
Q&A

Student Survey Charleston ebrary

  • 1.
    Are We MeetingStudents’ Research Needs? A Comparison of ebrary’s 2008 and 2011 Global Student E-book Surveys
  • 2.
    Background 2008 Originalsurvey questionnaire developed by librarians Including Cleveland State University Informal survey created in SurveyMonkey Survey distributed to ebrary’s email distribution list of librarians Librarians pushed out survey to students ~6,500 respondents 76 participating countries (~60% international, 40% US) 2011 Survey duplicated and distributed using the same process Cloned survey for Cleveland State case study ~6,600 total respondents 100 participating countries (~70% US, 30% international) Full results and additional social media questions and results available at ALA MW!
  • 3.
    E-book Awareness: 2008 68% of students stated awareness good to excellent 34% did not know if their library had e-books 58% did not know where to find e-books How would you expect this to change? In 2008…
  • 4.
    E-book Awareness: 2011 In the past three years, the awareness level has not changed as much as expected
  • 5.
    E-book Discovery However,the ways students find information online, including e-books, is changing 2008 Librarians Instructors Library website/blog Library catalog Google/search engine Peers 2011 Librarians Instructors Peers Google/search engine Library catalog Library website/blog CSU Librarians Instructors Library website/blog Library catalog Peers Google/search engine
  • 6.
    Resources for Research Students use the following:
  • 7.
    Determining Trustworthiness 2008Instructor (85%) Publisher (70%) Librarians (67%) Peers (31%) Print availability (27%) Google/search engine (14%) Don’t care (6%) 2011 Instructor (88%) Librarian (77%) Publisher (73%) Peers (30%) Print availability (25%) Google/search engine (12%) Don’t care (3%) CSU Instructor (90%) Librarian (80%) Publisher (73%) Peers (32%) Print availability (23%) Google/search engine (10%) Don’t care (3%) Librarians are having greater influence, and more students care about the source
  • 8.
  • 9.
    E-book Features Collaborative and accessibility features are increasingly important to students
  • 10.
    E-book Features: 2011 Social Media 58% likely to use social media to share info with peers, while 59% would use it if recommended by peers Importance of specialized apps – students prefer Facebook and Google Special apps will drive discovery
  • 11.
    E-book Usage: 2008 In 2008, students indicated they spent the average time per week in e-books: More than 10 hours: 2% 5 – 10 hours: 5% 1 – 5 hours: 16% Less than 1 hour: 29% Never: 49% How has that changed?
  • 12.
    E-book Usage: 2011Students’ usage of e-books has not increased as expected (per week):
  • 13.
    E-book Usage (Cont) Students who stated they “never’ use e-books in 2011 indicated the following top 5 reasons: I do not know where to find e-books I prefer printed books My library does not offer e-books E-books are too difficult to read E-books not available in my subject area
  • 14.
    E-book Usage (Cont) When asked what would make e-books more suitable, students indicated the following in 2011:
  • 15.
    E vs. PBooks: 2008 In 2008, students indicated how often they would use E over P if available Very often: 23% Often: 28% Sometimes: 32% Rarely: 14% Never: 3% How has that changed?
  • 16.
    E vs. PBooks (Cont) The majority would still prefer e-books if available
  • 17.
    Conclusions Accordingto data from this informal survey Students’ perceptions and trend have not changed as much as expected in the last three years Students are now relying more on their librarians to determine information trustworthiness Students are sharing information more now than three years ago (including social media), but are still not trusting it as a resource
  • 18.
    Implications Whatcan we do as vendors, librarians, and publishers to better address student needs?
  • 19.