Download to read offline

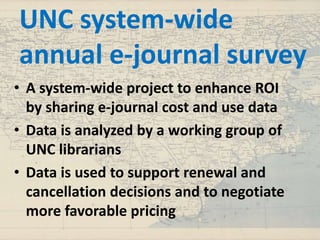
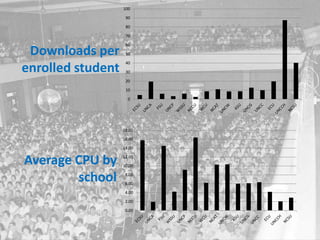
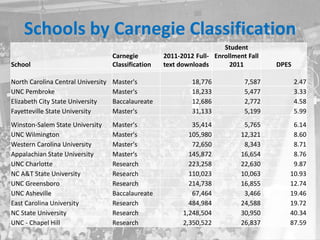


This document discusses collaborating across universities in the UNC system to analyze e-journal usage data and costs. It proposes a system-wide annual survey where libraries share e-journal cost and usage information to help make renewal and cancellation decisions and negotiate prices. The data shows downloads per enrolled student varies widely between schools, from around 2 downloads per student to over 87 downloads per student. The data could help libraries better understand value from e-resources across different types of institutions.


