Download to read offline


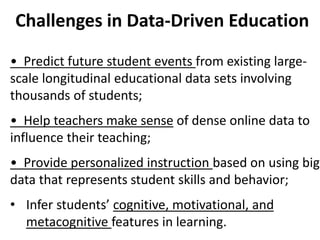
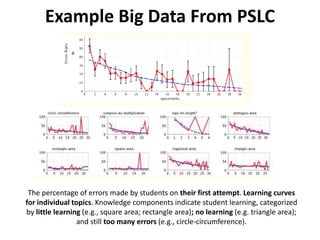
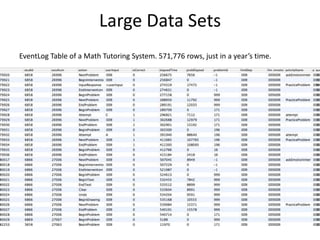
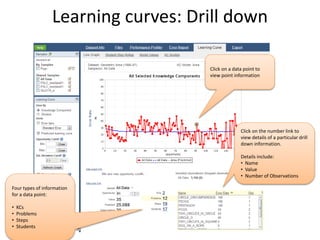
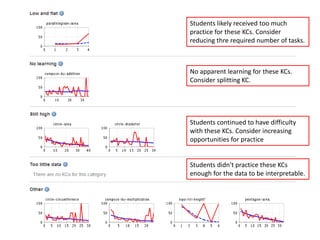
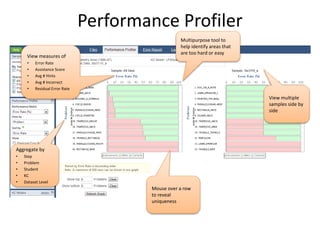
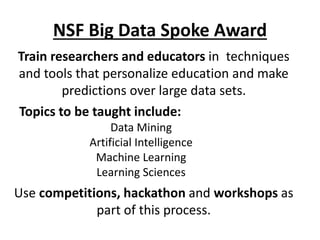
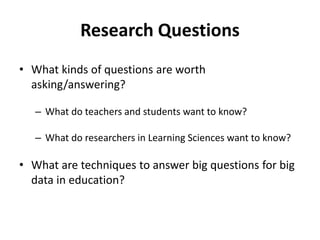
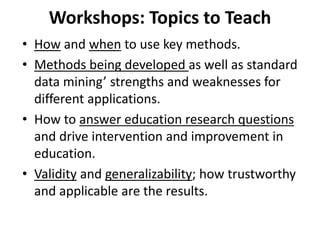
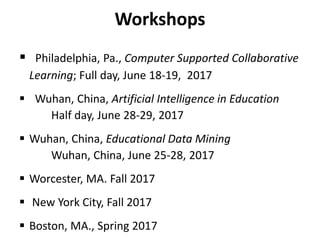


The document discusses challenges and advancements in data-driven education, aiming to personalize tutoring for millions of schoolchildren using extensive educational data. It highlights the need for predictive analytics to assess student behavior and performance through large datasets and various analytical tools like learning curves and performance profilers. Additionally, it outlines workshops, competitions, and training aimed at empowering educators and researchers to leverage big data in educational settings.


![Data driven ppt_presentation[1]](https://cdn.slidesharecdn.com/ss_thumbnails/datadrivenpptpresentation1-100710102551-phpapp02-thumbnail.jpg?width=640&height=640&fit=bounds)


![Polymer [ बहुलक ] Chemistry Notes PDF - Irfanullah Mehar - JJ Sir Chemistry.pdf](https://cdn.slidesharecdn.com/ss_thumbnails/polymerchemistrynotespdf-irfanullahmehar-jjsirchemistry-260210172118-3f9b37f7-thumbnail.jpg?width=640&height=640&fit=bounds)