Downloaded 10 times
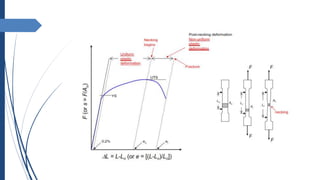
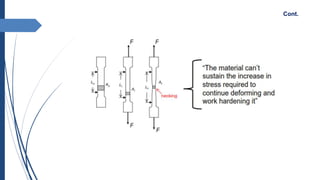
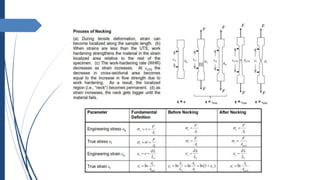
![ Local ↓ in A (i.e., deformation) causes that region to strain harden locally (relative to
the rest of the cross section). The remainder of the cross section then deforms until
a uniform cross-section is re-established.
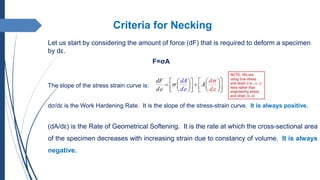
The rate balance at the UTS [(dA/dε) = dσ/dε)].
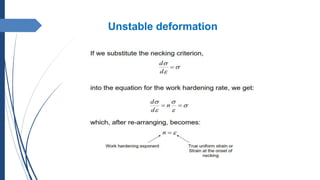
When (dA/dε) > (dσ/dε), deformation becomes unstable. The material cannot strain
harden fast enough to inhibit necking.
Cont.](https://image.slidesharecdn.com/stress-straincurves-plasticdeformation-240107072727-8a52aa2c/85/Stress-strain-curves-Plastic-deformation-12-320.jpg)
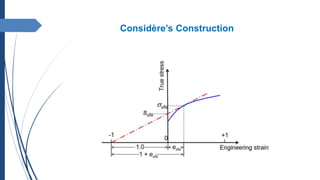
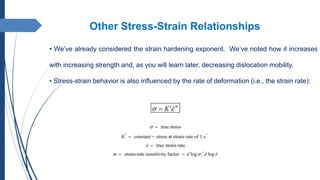
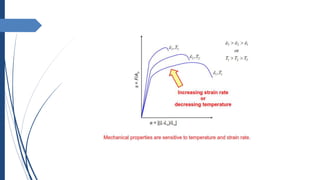


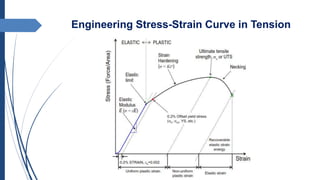
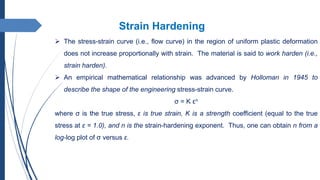
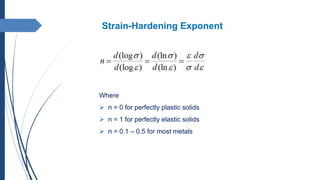
The document discusses stress-strain curves and plastic deformation, highlighting the phases of elastic and plastic deformation, including necking. It explains the concepts of strain hardening and the Holloman relationship to describe stress-strain behavior, emphasizing how necking occurs at maximum load due to the interaction of strain hardening and geometric changes in the material. Additionally, criteria for necking instability are analyzed through mathematical relationships, incorporating various factors influencing material deformation.