Downloaded 606 times
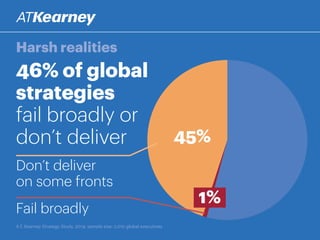
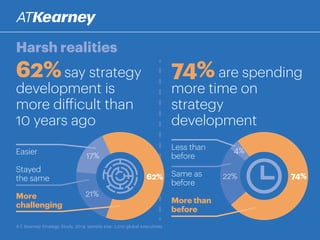
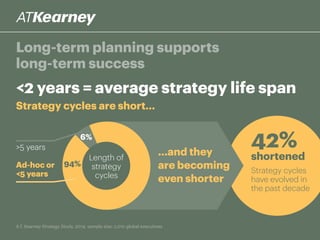
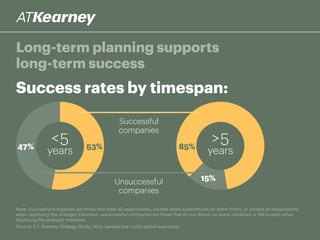
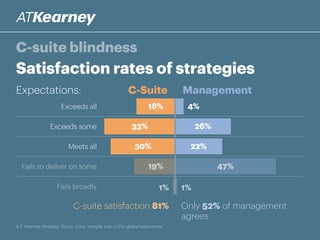
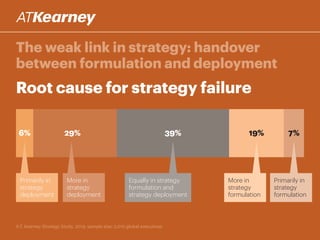
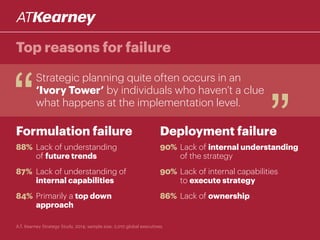
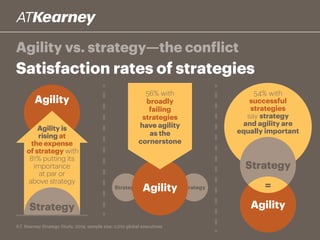
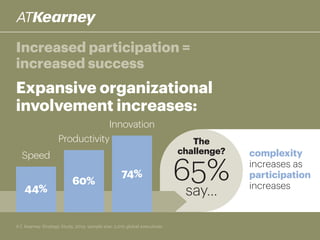
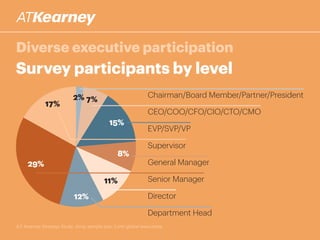
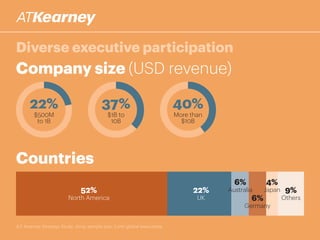


The A.T. Kearney 2014 strategy study reveals that 46% of global strategies fail or do not deliver, with 62% of executives stating that strategy development has become more challenging over the past decade. Increased participation from diverse executives is linked to greater success, though the study highlights a concerning gap between strategy formulation and deployment. Additionally, while agility is deemed increasingly important, successful strategies often arise from a balance between agility and traditional strategy planning.


