Global trends and China situation


The future of commercial vehicle
powertrains
China-U.S. Clean Truck and Bus Summit
October 2012


Dr. Stephen W. Dyer
Partner
A.T. Kearney (Shanghai) Management Consulting Co., Ltd.
This document is exclusively intended for selected client employees. Distribution, quotations
and duplications – even in the form of extracts – for third parties is only permitted upon prior
written consent of A.T. Kearney.
A.T. Kearney used the text and charts compiled in this report in a presentation; they do not
represent a complete documentation of the presentation.


                                                                                A.T. Kearney xx/mm.yyyy/00000   2
Agenda
• Global trends in clean commercial vehicles
• China clean commercial vehicle situation


                                               A.T. Kearney xx/mm.yyyy/00000   3
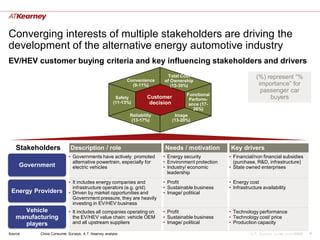
Converging interests of multiple stakeholders are driving the
development of the alternative energy automotive industry
EV/HEV customer buying criteria and key influencing stakeholders and drivers

                                                           Convenience
                                                                           Total Cost                             (%) represent “%
                                                                          of Ownership
                                                             (9-11%)         (15-35%)                              importance” for
                                                                                                                    passenger car
                                                                                       Functional
                                                      Safety        Customer            Perform-                       buyers
                                                     (11-13%)        decision           ance (17-
                                                                                          26%)
                                                            Reliability          Image
                                                             (13-17%)           (13-20%)


    Stakeholders            Description / role                            Needs / motivation         Key drivers
                           • Governments have actively promoted           • Energy security          • Financial/non financial subsidies
                             alternative powertrain, especially for       • Environment protection     (purchase, R&D, infrastructure)
      Government             electric vehicles                            • Industry/ economic       • State owned enterprises
                                                                            leadership
                           • It includes energy companies and             • Profit                   • Energy cost
                             infrastructure operators (e.g. grid)         • Sustainable business     • Infrastructure availability
 Energy Providers          • Driven by market opportunities and           • Image/ political
                             Government pressure, they are heavily
                             investing in EV/HEV business
      Vehicle              • It includes all companies operating on       • Profit                   • Technology performance
    manufacturing            the EV/HEV value chain: vehicle OEM          • Sustainable business     • Technology cost/ price
      players                and all upstream suppliers                   • Image/ political         • Production capacity

Source:    China Consumer Surveys; A.T. Kearney analysis                                                        A.T. Kearney xx/mm.yyyy/00000   4
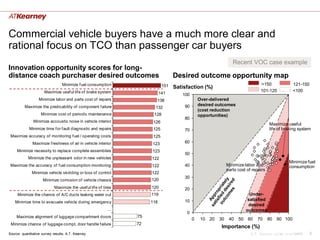
Commercial vehicle buyers have a much more clear and
rational focus on TCO than passenger car buyers
                                                                                                                     Recent VOC case example
Innovation opportunity scores for long-
distance coach purchaser desired outcomes                                               Desired outcome opportunity map
                                  Minimize f uel consumption                   151151 Satisfaction (%)                           >150             121-150
                      Maximize usef ul lif e of brake system                 141141                                             101-120           <100
                                                                                          100
                   Minimize labor and parts cost of repairs                  138 138            Over-delivered
                                                                                           90   desired outcomes
          Maximize the predicability of component f ailure                  132 132
                                                                                                (cost reduction
                    Minimize cost of periodic maintenance                  128 128              opportunities)
                                                                                           80
               Minimize accoustic noise in vehicle interior                126 126                                                  Maximize useful
             Minimize time f or f ault diagnostic and repairs              125 125         70                                       life of braking system
 Maximize accuracy of monitoring f uel / operating costs                   125 125
               Maximize f reshness of air in vehicle interior             123 123          60

     Minimize necessity to replace complete assemblies                    123 123          50
            Minimize the unpleasant odor in new vehicles                  122 122
                                                                                                                                                Minimize fuel
 Maximize the accuracy of f uel consumption monitoring                    122 122          40                 Minimize labor and                consumption
                                                                                                              parts cost of repairs
              Minimize vehicle skidding or loss of control                122 122
                                                                                           30
                     Minimize corrosion of vehicle chassis                120 120
                             Maximize the usef ul lif e of tires          120 120          20
     Minimize the chance of A/C ducts leaking water out                  119 119                                          Under-
                                                                                           10                            satisfied
    Minimize time to evacuate vehicle during emergency                   116 116                                          desired
                                                             …                                                             outcomes
                                                                                               0
     Maximize alignment of luggage compartment doors               75   75
                                                                                                   0   10 20   30   40   50 60   70    80 90 100
 Minimize chance of luggage compt. door handle f ailure            72   72
                                                                                                                Importance (%)
Source: quantitative survey results; A.T. Kearney                                                                             A.T. Kearney xx/mm.yyyy/00000   5
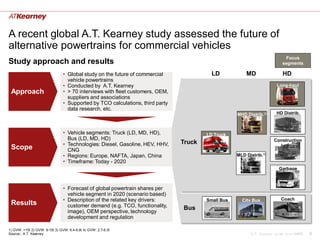
A recent global A.T. Kearney study assessed the future of
alternative powertrains for commercial vehicles
                                                                                                                            Focus
Study approach and results                                                                                                segments

                                • Global study on the future of commercial               LD            MD                 HD
                                  vehicle powertrains
                                • Conducted by A.T. Kearney                                                            Long-haul
 Approach                       • > 70 interviews with fleet customers, OEM,
                                  suppliers and associations
                                • Supported by TCO calculations, third party
                                  data research, etc.
                                                                                                   MHD Distrib.2)      HD Distrib.


                                • Vehicle segments: Truck (LD, MD, HD),                LD Truck
                                  Bus (LD, MD, HD)                                                                   Construction
                                • Technologies: Diesel, Gasoline, HEV, HHV,    Truck
 Scope                            CNG
                                • Regions: Europe, NAFTA, Japan, China                             MLD Distrib.3)
                                • Timeframe: Today - 2020
                                                                                                                        Garbage


                                • Forecast of global powertrain shares per
                                  vehicle segment in 2020 (scenario based)
                                • Description of the related key drivers:              Small Bus     City Bus            Coach
 Results                          customer demand (e.g. TCO, functionality,    Bus
                                  image), OEM perspective, technology
                                  development and regulation

1) GVW: >15t 2) GVW: 9-15t 3) GVW: 6.4-8.9t 4) GVW: 2.7-6.3t
Source:; A.T. Kearney                                                                                    A.T. Kearney xx/mm.yyyy/00000   6
We applied a scenario based-approach using customer and
OEM strategies to model future powertrain developments
Factors and scenarios impacting the 2020 powertrain landscape

               Boundary conditions                                                                                                         Scenarios
                                                                                     Perspective             Parameter                                “Mod-
        How do macro parameters impact                                                                                                     “Low”                   “High”
                                                                                                                                                      erate”
           powertrain developments?
                                                                                     Customer
                                     Tech-
              Regula                                      Fuel                                               Fuel price increase, e.g.                              Signif-
                                     nolog                                                                                                 Limited Moderate
               -tion
                                         y
                                                         prices                                              • Crude oil price 2020                                  icant
                                                                                                                                             70      140
                                                                                                               [$/barrel]                                             210

                                                                                     OEM
                                                                                                             Component cost reduction,
                                                                                                                                                                    Aggre-
                                                                                                             e.g.                          Limited Moderate
         Customer                                  OEM                                                                                                               ssive
                                                                                                             • HEV Li-ion battery cell       26      18
                                                                                                                                                                       9
          needs                                 strategies                                                      costs 2020 [$/kW]
          What do                             What do OEMs
      customers want?                         plan to offer?                         Technology
                                                                                                             OEM‟s drive to introduce
      • Total costs of                       • Technology                                                                                  Limited Moderate Strong
                                                                                                             alternative powertrains, e.g.
         ownership                             strategy                                                      • Avg. SOP HEV for HD
                                                                                                                                            2018    2016     2014
      • Functionality                        • Development                                                      Long-haul, Europe
      • Image                                  status
                                                                                     Regulation
                                             • SOP/ramp-up                                                   Maturity of new drivetrain
                                               planning                                                      technology, e.g.               Low      Moderate        High
                                                                                                             • HEV battery lifetime 2020     4          6             8
                                                                                                                [years] 1)
1. Example MD Upper Distribution profile
2. Only vehicle technology related reduction; additional targets might include biofuels, speed limitation, etc.                                    Focus of this
Source: A.T. Kearney                                                                                                                         A.T. Kearney xx/mm.yyyy/00000
                                                                                                                                                    presentation              7
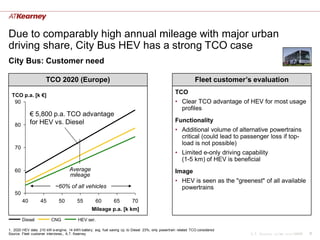
Due to comparably high annual mileage with major urban
driving share, City Bus HEV has a strong TCO case
City Bus: Customer need

                      TCO 2020 (Europe)                                                                           Fleet customer‟s evaluation

  TCO p.a. [k €]
                                                                                                      TCO
   90                                                                                                 • Clear TCO advantage of HEV for most usage
                                                                                                        profiles
             € 5,800 p.a. TCO advantage
             for HEV vs. Diesel                                                                       Functionality
   80
                                                                                                      • Additional volume of alternative powertrains
                                                                                                        critical (could lead to passenger loss if top-
                                                                                                        load is not possible)
   70
                                                                                                      • Limited e-only driving capability
                                                                                                        (1-5 km) of HEV is beneficial
   60                                Average                                                          Image
                                     mileage
                                                                                                      • HEV is seen as the "greenest" of all available
                            ~60% of all vehicles                                                        powertrains
   50
        40         45         50          55         60         65         70
                                                  Mileage p.a. [k km]
        Diesel            CNG             HEV ser.

1. 2020 HEV data: 210 kW e-engine, 14 kWh battery; avg. fuel saving cp. to Diesel: 23%; only powertrain related TCO considered
Source: Fleet customer interviews,, A.T. Kearney                                                                                  A.T. Kearney xx/mm.yyyy/00000   8
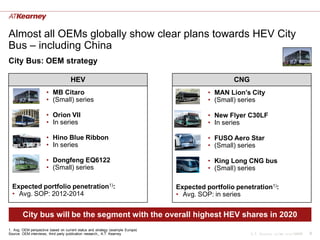
Almost all OEMs globally show clear plans towards HEV City
Bus – including China
City Bus: OEM strategy

                                     HEV                                                          CNG
                      • MB Citaro                                                         • MAN Lion‟s City
                      • (Small) series                                                    • (Small) series

                      • Orion VII                                                         • New Flyer C30LF
                      • In series                                                         • In series

                      • Hino Blue Ribbon                                                  • FUSO Aero Star
                      • In series                                                         • (Small) series

                      • Dongfeng EQ6122                                                   • King Long CNG bus
                      • (Small) series                                                    • (Small) series

  Expected portfolio penetration1):                                             Expected portfolio penetration1):
  • Avg. SOP: 2012-2014                                                         • Avg. SOP: in series


        City bus will be the segment with the overall highest HEV shares in 2020
1. Avg. OEM perspective based on current status and strategy (example Europe)
Source: OEM interviews, third party publication research,, A.T. Kearney                                 A.T. Kearney xx/mm.yyyy/00000   9
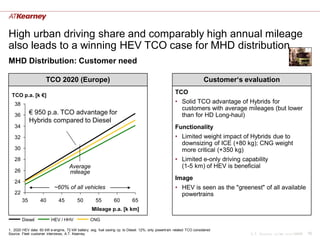
High urban driving share and comparably high annual mileage
also leads to a winning HEV TCO case for MHD distribution
MHD Distribution: Customer need

                      TCO 2020 (Europe)                                                                                Customer„s evaluation

  TCO p.a. [k €]
                                                                                                      TCO
   38                                                                                                 • Solid TCO advantage of Hybrids for
                                                                                                        customers with average mileages (but lower
   36        € 950 p.a. TCO advantage for                                                               than for HD Long-haul)
             Hybrids compared to Diesel
   34                                                                                                 Functionality
   32                                                                                                 • Limited weight impact of Hybrids due to
                                                                                                        downsizing of ICE (+80 kg); CNG weight
   30                                                                                                   more critical (+350 kg)
   28                                                                                                 • Limited e-only driving capability
                                     Average                                                            (1-5 km) of HEV is beneficial
   26                                mileage
                                                                                                      Image
   24
                            ~60% of all vehicles                                                      • HEV is seen as the "greenest" of all available
   22                                                                                                   powertrains
        35         40         45          50         55         60          65
                                                   Mileage p.a. [k km]
        Diesel            HEV / HHV               CNG

1. 2020 HEV data: 60 kW e-engine, 72 kW battery; avg. fuel saving cp. to Diesel: 12%; only powertrain related TCO considered
Source: Fleet customer interviews, A.T. Kearney                                                                                     A.T. Kearney xx/mm.yyyy/00000   10
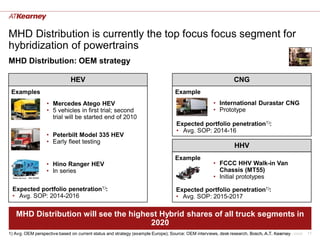
MHD Distribution is currently the top focus focus segment for
hybridization of powertrains
MHD Distribution: OEM strategy

                               HEV                                                                              CNG
 Examples                                                                          Example
                   • Mercedes Atego HEV                                                               • International Durastar CNG
                   • 5 vehicles in first trial; second                                                • Prototype
                     trial will be started end of 2010
                                                                                   Expected portfolio penetration1):
                                                                                   • Avg. SOP: 2014-16
                   • Peterbilt Model 335 HEV
                   • Early fleet testing
                                                                                                                HHV
                                                                                   Example
                  • Hino Ranger HEV                                                                   • FCCC HHV Walk-in Van
                  • In series                                                                           Chassis (MT55)
                                                                                                      • Initial prototypes

 Expected portfolio penetration1):                                                 Expected portfolio penetration1):
 • Avg. SOP: 2014-2016                                                             • Avg. SOP: 2015-2017

   MHD Distribution will see the highest Hybrid shares of all truck segments in
                                      2020
1) Avg. OEM perspective based on current status and strategy (example Europe); Source: OEM interviews, desk research, Bosch, A.T. Kearney
                                                                                                                      A.T. Kearney xx/mm.yyyy/00000   11
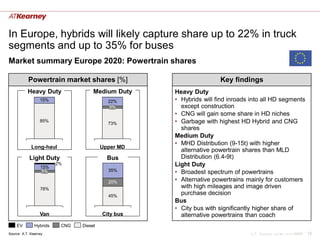
In Europe, hybrids will likely capture share up to 22% in truck
segments and up to 35% for buses
Market summary Europe 2020: Powertrain shares

           Powertrain market shares [%]                             Key findings
           Heavy Duty                Medium Duty    Heavy Duty
                  15%                      22%      • Hybrids will find inroads into all HD segments
                                           5%         except construction
                                                    • CNG will gain some share in HD niches
                  85%
                                           73%      • Garbage with highest HD Hybrid and CNG
                                                      shares
                                                    Medium Duty
                                                    • MHD Distribution (9-15t) with higher
             Long-haul                   Upper MD
                                                      alternative powertrain shares than MLD
            Light Duty                     Bus        Distribution (6.4-9t)
                  15%
                         2%                         Light Duty
                   5%                      35%      • Broadest spectrum of powertrains
                                           20%      • Alternative powertrains mainly for customers
                  78%                                 with high mileages and image driven
                                           45%
                                                      purchase decision
                                                    Bus
                                                    • City bus with significantly higher share of
                  Van                    City bus     alternative powertrains than coach
    EV         Hybrids    CNG   Diesel
Source: A.T. Kearney                                                           A.T. Kearney xx/mm.yyyy/00000   12
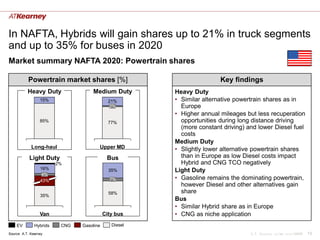
In NAFTA, Hybrids will gain shares up to 21% in truck segments
and up to 35% for buses in 2020
Market summary NAFTA 2020: Powertrain shares

           Powertrain market shares [%]                                Key findings
           Heavy Duty               Medium Duty        Heavy Duty
                  15%                        21%       • Similar alternative powertrain shares as in
                                             2%          Europe
                                                       • Higher annual mileages but less recuperation
                  85%                        77%         opportunities during long distance driving
                                                         (more constant driving) and lower Diesel fuel
                                                         costs
                                                       Medium Duty
             Long-haul                 Upper MD        • Slightly lower alternative powertrain shares
            Light Duty                      Bus          than in Europe as low Diesel costs impact
                         2%                              Hybrid and CNG TCO negatively
                  16%                        35%       Light Duty
                   4%
                  43%                        7%        • Gasoline remains the dominating powertrain,
                                                         however Diesel and other alternatives gain
                                             58%         share
                  35%
                                                       Bus
                                                       • Similar Hybrid share as in Europe
                  Van                      City bus    • CNG as niche application
    EV         Hybrids    CNG   Gasoline      Diesel
Source: A.T. Kearney                                                              A.T. Kearney xx/mm.yyyy/00000   13
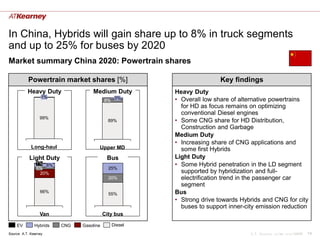
In China, Hybrids will gain share up to 8% in truck segments
and up to 25% for buses by 2020
Market summary China 2020: Powertrain shares

           Powertrain market shares [%]                                 Key findings
           Heavy Duty              Medium Duty          Heavy Duty
                   1%
                                          8%
                                                3%      • Overall low share of alternative powertrains
                                                          for HD as focus remains on optimizing
                                                          conventional Diesel engines
                  99%
                                            89%         • Some CNG share for HD Distribution,
                                                          Construction and Garbage
                                                        Medium Duty
                                                        • Increasing share of CNG applications and
             Long-haul                Upper MD            some first Hybrids
            Light Duty
               100                         Bus          Light Duty
                1% 8%
                5%
                                                        • Some Hybrid penetration in the LD segment
                                            25%
                 20%                                      supported by hybridization and full-
                                            20%           electrification trend in the passenger car
                                                          segment
                  66%
                                            55%         Bus
                                                        • Strong drive towards Hybrids and CNG for city
                                                          buses to support inner-city emission reduction
                  Van                     City bus

    EV         Hybrids   CNG   Gasoline        Diesel
Source: A.T. Kearney                                                               A.T. Kearney xx/mm.yyyy/00000   14
Agenda
• Global trends in clean commercial vehicles
• China clean commercial vehicle situation


                                               A.T. Kearney xx/mm.yyyy/00000   15
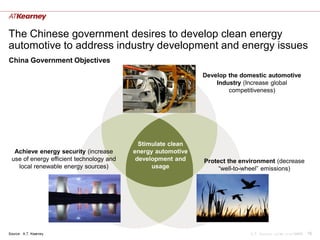
The Chinese government desires to develop clean energy
automotive to address industry development and energy issues
China Government Objectives

                                                              Develop the domestic automotive
                                                                  Industry (Increase global
                                                                      competitiveness)


                                            Stimulate clean
  Achieve energy security (increase       energy automotive
 use of energy efficient technology and    development and    Protect the environment (decrease
   local renewable energy sources)              usage              “well-to-wheel” emissions)


Source: A.T. Kearney                                                         A.T. Kearney xx/mm.yyyy/00000   16
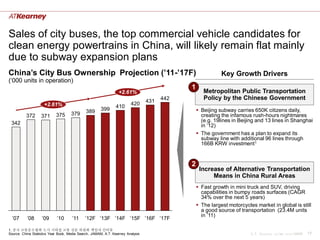
Sales of city buses, the top commercial vehicle candidates for
clean energy powertrains in China, will likely remain flat mainly
due to subway expansion plans
China‟s City Bus Ownership Projection (‟11-‟17F)                                                            Key Growth Drivers
(„000 units in operation)
                                                                                             1
                                                                 +2.61%                             Metropolitan Public Transportation
                                                                                 431   442          Policy by the Chinese Government
                     +2.61%                                             420
                                                               410
                                              389     399                                         Beijing subway carries 650K citizens daily,
          372      371      375      379                                                           creating the infamous rush-hours nightmares
 342                                                                                               (e.g. 19lines in Beijing and 13 lines in Shanghai
                                                                                                   in „12)
                                                                                                  The government has a plan to expand its
                                                                                                   subway line with additional 96 lines through
                                                                                                   166B KRW investment1


                                                                                             2
                                                                                                  Increase of Alternative Transportation
                                                                                                       Means in China Rural Areas
                                                                                                  Fast growth in mini truck and SUV, driving
                                                                                                   capabilities in bumpy roads surfaces (CAGR
                                                                                                   34% over the next 5 years)
                                                                                                  The largest motorcycles market in global is still
                                                                                                   a good source of transportation (23.4M units
                                                                                                   in ‟11)
  ‟07      ‟08     ‟09      ‟10      ‟11     ‟12F ‟13F ‟14F ‟15F ‟16F ‟17F

1. 중국 교통운수협회 도시 지하철 교통 전문 위원회 책임자 인터뷰
Source: China Statistics Year Book, Media Search, JAMAM, A.T. Kearney Analysis                                           A.T. Kearney xx/mm.yyyy/00000   17
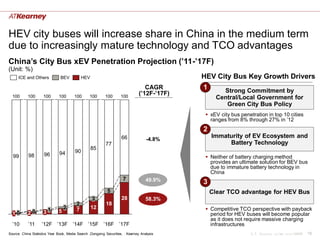
HEV city buses will increase share in China in the medium term
due to increasingly mature technology and TCO advantages
China‟s City Bus xEV Penetration Projection (‟11-‟17F)
(Unit: %)
      ICE and Others           BEV           HEV                                              HEV City Bus Key Growth Drivers
                                                                                   CAGR       1       Strong Commitment by
  100      100       100      100       100      100       100      100
                                                                                (‟12F-‟17F)
                                                                                                    Central/Local Government for
                                                                                                       Green City Bus Policy
                                                                                                xEV city bus penetration in top 10 cities
                                                                                                 ranges from 8% through 27% in ‟12
                                                                                              2
                                                                     66                           Immaturity of EV Ecosystem and
                                                                                    -4.8%
                                                           77                                          Battery Technology
                                                   85
                               94       90
  99        98       96                                                                         Neither of battery charging method
                                                                                                 provides an ultimate solution for BEV bus
                                                                                                 due to immature battery technology in
                                                                                                 China
                                                                      7             49.9%     3
                                                            5                                     Clear TCO advantage for HEV Bus
                                                   3                 28             58.3%
                                         2                 18
                                  2      7         12                                           Competitive TCO perspective with payback
  10       20        31       5
                                                                                                 period for HEV buses will become popular
                                                                                                 as it does not require massive charging
  ‟10       ‟11     ‟12F ‟13F ‟14F ‟15F ‟16F ‟17F                                                infrastructures
Source: China Statistics Year Book, Media Search ,Dongxing Securities, . Kearney Analysis                         A.T. Kearney xx/mm.yyyy/00000   18
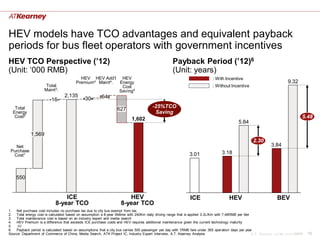
HEV models have TCO advantages and equivalent payback
periods for bus fleet operators with government incentives
HEV TCO Perspective (‟12)                                                                           Payback Period (‟12)6
(Unit: „000 RMB)                                                                                    (Unit: years)
                                           HEV HEV Add‟l HEV                                                                : With Incentive
                                         Premium4 Maint4. Energy                                                                                                          9.32
                      Total                                Cost                                                             : Without Incentive
                     Maint3.                              Saving5
                                  2,135                  64
                          16                  30
   Total                                                          627                   -25%TCO
  Energy                                                                                 Saving
   Cost2                                                                                                                                                                           5.48
                                                                           1,602
                                                                                                                                            5.84

             1,569
                                                                                                                                                     2.30
   Net                                                                                                                                                          3.84
 Purchase                                                                                                                         3.18
  Cost1                                                                                                       3.01


    550


                                ICE                                    HEV                                     ICE                    HEV                           BEV
                            8-year TCO                              8-year TCO
1. Net purchase cost includes no purchase tax due to city bus exempt from tax,
2. Total energy cost is calculated based on assumption a 8-year lifetime with 240Km daily driving range that is applied 0.3L/Km with 7.46RMB per liter
3. Total maintenance cost is based on an industry expert and media search
4. HEV Premium is a difference that exceeds ICE purchase costs and HEV requires additional maintenance given the current technology maturity
5.   ////
6. Payback period is calculated based on assumptions that a city bus carries 500 passenger per day with 1RMB fare under 365 operation days per year
Source: Department of Commerce of China, Media Search, ATK Project IC, Industry Expert Interview, A.T. Kearney Analysis                                A.T. Kearney xx/mm.yyyy/00000   19
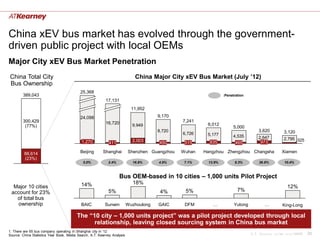
China xEV bus market has evolved through the government-
driven public project with local OEMs
Major City xEV Bus Market Penetration
China Total City                                                             China Major City xEV Bus Market (July ‟12)
Bus Ownership
                                           25,368
        389,043                                                                                                 :Penetration
                                                           17,131
                                                                            11,952

                                           24,098                                      9,170
        300,429                                            16,720                              7,241
         (77%)                                                              9,949                       6,012
                                                                                                                     5,000
                                                                                       8,720                                       3,620         3,120
                                                                                               6,726    5,177        4,535         2,647
                                                                            2,003                                                                2,795 325
                                            1,270            411                       450      515      835           465          973

         88,614                            Beijing       Shanghai         Shenzhen Guangzhou   Wuhan   Hangzhou Zhengzhou Changsha              Xiamen
         (23%)
                                             5.0%           2.4%            16.8%      4.9%     7.1%    13.9%         9.3%         26.9%         10.4%


                                                                   Bus OEM-based in 10 cities – 1,000 units Pilot Project
                                            14%                             18%
  Major 10 cities                                                                                                                                  12%
 account for 23%                                            5%                          4%      5%                      7%
   of total bus
    ownership                               BAIC          Sunwin          Wuzhoulong   GAIC     DFM       …           Yutong          …         King-Long

                                         The “10 city – 1,000 units project” was a pilot project developed through local
                                               relationship, leaving closed sourcing system in China bus market
1. There are 65 bus company operating in Shanghai city in „12
Source: China Statistics Year Book, Media Search, A.T. Kearney Analysis                                                        A.T. Kearney xx/mm.yyyy/00000   20
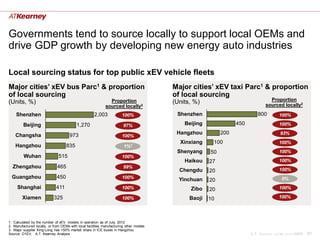
Governments tend to source locally to support local OEMs and
drive GDP growth by developing new energy auto industries

Local sourcing status for top public xEV vehicle fleets
Major cities‟ xEV bus Parc1 & proportion                                                 Major cities‟ xEV taxi Parc1 & proportion
of local sourcing                                                                        of local sourcing
                                                               Proportion                                                         Proportion
(Units, %)                                                                               (Units, %)                             sourced locally2
                                                             sourced locally2
    Shenzhen                                          2,003            100%               Shenzhen                         800         100%

         Beijing                           1,270                        97%                  Beijing              450                  100%

    Changsha                          973                                                 Hangzhou          200                         93%
                                                                       100%
                                                                                           Xinxiang     100                            100%
    Hangzhou                        835                                 1%3
                                                                                          Shenyang     50                              100%
         Wuhan                 515                                     100%
                                                                                             Haikou    27                              100%
  Zhengzhou                   465                                       99%
                                                                                           Chengdu     20                              100%
  Guangzhou                   450                                      100%                Yinchuan                                      0%
                                                                                                       20
     Shanghai                 411                                      100%                    Zibo    20                              100%

        Xiamen              325                                        100%                    Baoji   10                              100%


1. Calculated by the number of xEV models in operation as of July, 2012
2. Manufactured locally, or from OEMs with local facilities manufacturing other models
3. Major supplier King-Long has >50% market share in ICE buses in Hangzhou
Source: D1EV, A.T. Kearney Analysis                                                                                     A.T. Kearney xx/mm.yyyy/00000   21
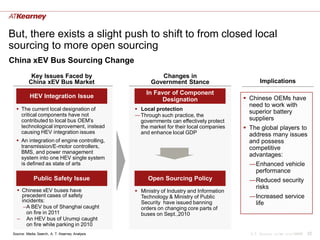
But, there exists a slight push to shift to from closed local
sourcing to more open sourcing
China xEV Bus Sourcing Change
          Key Issues Faced by                           Changes in
         China xEV Bus Market                        Government Stance                         Implications
                                                   In Favor of Component
          HEV Integration Issue                                                          Chinese OEMs have
                                                         Designation
                                                                                          need to work with
   The current local designation of            Local protection
                                                                                          superior battery
    critical components have not               ― Through such practice, the
    contributed to local bus OEM‟s               governments can effectively protect      suppliers
    technological improvement, instead           the market for their local companies    The global players to
    causing HEV integration issues               and enhance local GDP                    address many issues
   An integration of engine controlling,                                                 and possess
    transmission/E-motor controllers,                                                     competitive
    BMS, and power management
    system into one HEV single system
                                                                                          advantages:
    is defined as state of arts                                                           ―Enhanced vehicle
                                                                                           performance
            Public Safety Issue                     Open Sourcing Policy                  ―Reduced security
                                                                                           risks
   Chinese xEV buses have                      Ministry of Industry and Information
    precedent cases of safety                    Technology & Ministry of Public          ―Increased service
    incidents:                                   Security have issued banning              life
     –A BEV bus of Shanghai caught               orders on changing core parts of
      on fire in 2011                            buses on Sept.,2010
  – An HEV bus of Urumqi caught
      on fire while parking in 2010
Source: Media Search, A. T. Kearney Analysis                                              A.T. Kearney xx/mm.yyyy/00000   22
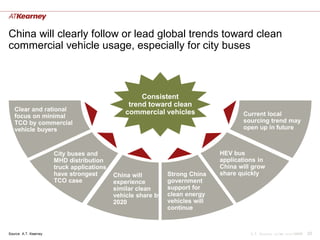
China will clearly follow or lead global trends toward clean
commercial vehicle usage, especially for city buses


                                                     Consistent
                                                 trend toward clean
   Clear and rational                           commercial vehicles
   focus on minimal                                                                   Current local
   TCO by commercial                                                                  sourcing trend may
   vehicle buyers                                                                     open up in future


                       City buses and                                          HEV bus
                       MHD distribution                                        applications in
                       truck applications                                      China will grow
                       have strongest       China will         Strong China    share quickly
                       TCO case             experience         government
                                            similar clean      support for
                                            vehicle share by   clean energy
                                            2020               vehicles will
                                                               continue


Source: A.T. Kearney                                                                     A.T. Kearney xx/mm.yyyy/00000   23
A.T. Kearney is a global team of forward-thinking, collaborative partners that delivers immediate, meaningful
results and long-term transformative advantage to clients.
Since 1926, we have been trusted advisors on CEO-agenda issues to the world‟s leading organizations across
all major industries and sectors. A.T. Kearney‟s offices are located in major business centers in 39 countries.

Americas       Atlanta     Chicago        Detroit        Mexico City   San Francisco   Toronto
               Calgary     Dallas         Houston        New York      São Paulo       Washington, D.C.

Asia Pacific   Bangkok     Hong Kong      Kuala Lumpur   Mumbai        Seoul           Singapore          Tokyo
               Beijing     Jakarta        Melbourne      New Delhi     Shanghai        Sydney

Europe         Amsterdam   Budapest       Helsinki       Ljubljana     Moscow          Prague             Vienna
               Berlin      Copenhagen     Istanbul       London        Munich          Rome               Warsaw
               Brussels    Düsseldorf     Kiev           Madrid        Oslo            Stockholm          Zurich
               Bucharest   Frankfurt      Lisbon         Milan         Paris           Stuttgart

Middle East    Abu Dhabi   Johannesburg   Riyadh
and Africa     Dubai       Manama


                                                                                              A.T. Kearney xx/mm.yyyy/00000   24