Downloaded 402 times

![143 CONFIDENTIAL | DRAFT
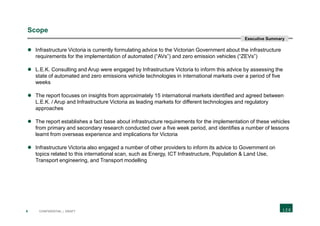
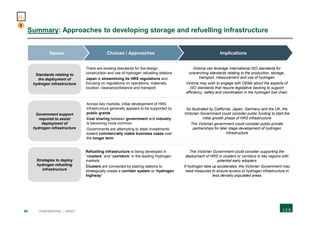
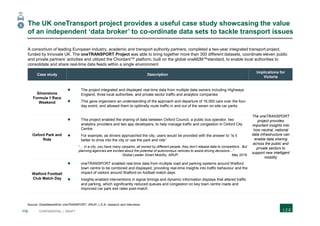
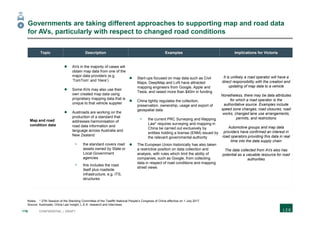
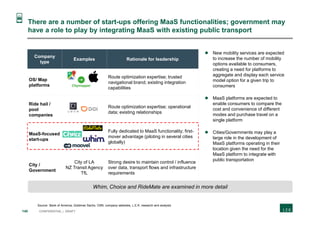
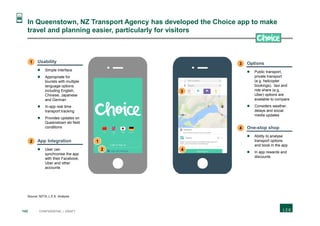
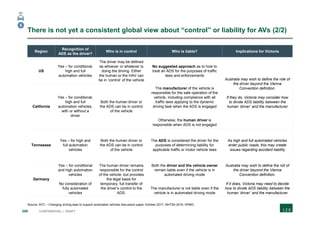
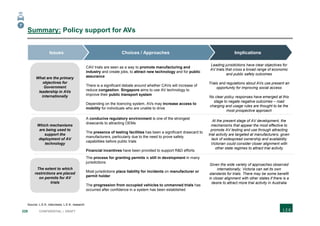
Choice has provided Queenstown tourists with the opportunity to access
personalised transport information and book their most efficient option
Coordination
Transport
accessibility
Mobility suppliers
Government
Assists visitors in accessing information and booking transport between
Queenstown airport, the city and ski areas
Facilitates the trip-planning process, providing a quicker, personalised journey for
customers
Information is simple, understandable and on one platform
Greater utilisation of existing government transport services
Increased tourism as travel locations (e.g. ski resorts) become more accessible
Benefits
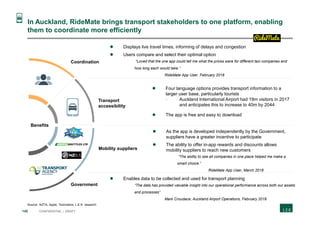
The app improves accessibility to transport information for the 2m
tourists that visit annually
“Choice is available in three languages and will be a boost for the tourism
industry, reducing the language barriers for tourists using the local transport
system”
Simon Bridges, former NZ Transport Minister, August 2017
As the app is developed by the Government, suppliers have a greater
incentive to participate
“[The] obstacle of commercial rivalry was removed, and all transport providers
had an incentive to get on board”
Simon Bridges, former NZ Transport Minister, August 2017
Source: NZTA; L.E.K. Analysis](https://image.slidesharecdn.com/infrastructurevictoriaavzevinternationalscan-180815121018/85/Infrastructure-Victoria-AZ-ZEV-International-Scan-143-320.jpg)
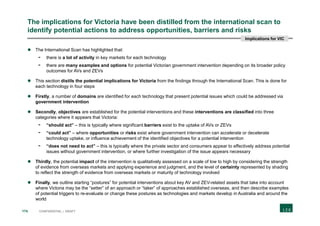
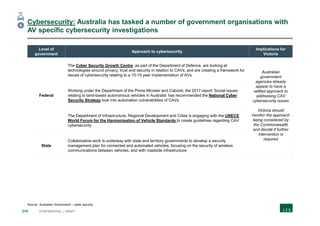
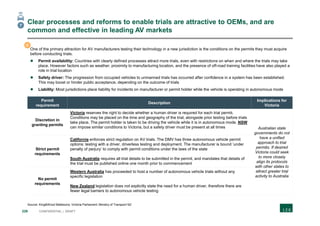
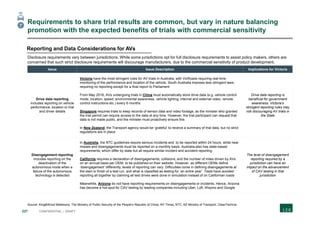

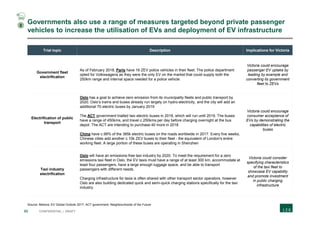
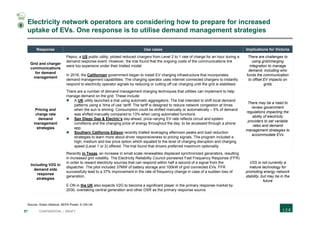
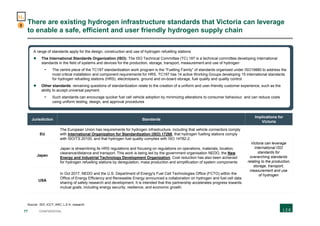
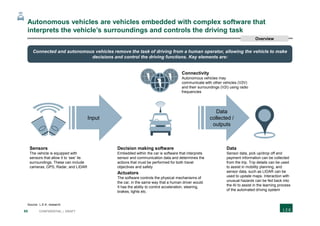
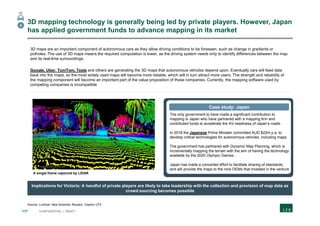
The document discusses a report by L.E.K. Consulting focused on the infrastructure requirements for implementing autonomous and zero emission vehicles in Victoria, Australia. It emphasizes the immaturity of these technologies while outlining potential government interventions to facilitate their adoption, such as promoting zero emissions electricity production and supporting hydrogen infrastructure. The report presents findings from an international scan of approximately 15 markets, identifying insights, implications, and possible strategies for the Victorian government to consider.


