Download as PDF, PPTX

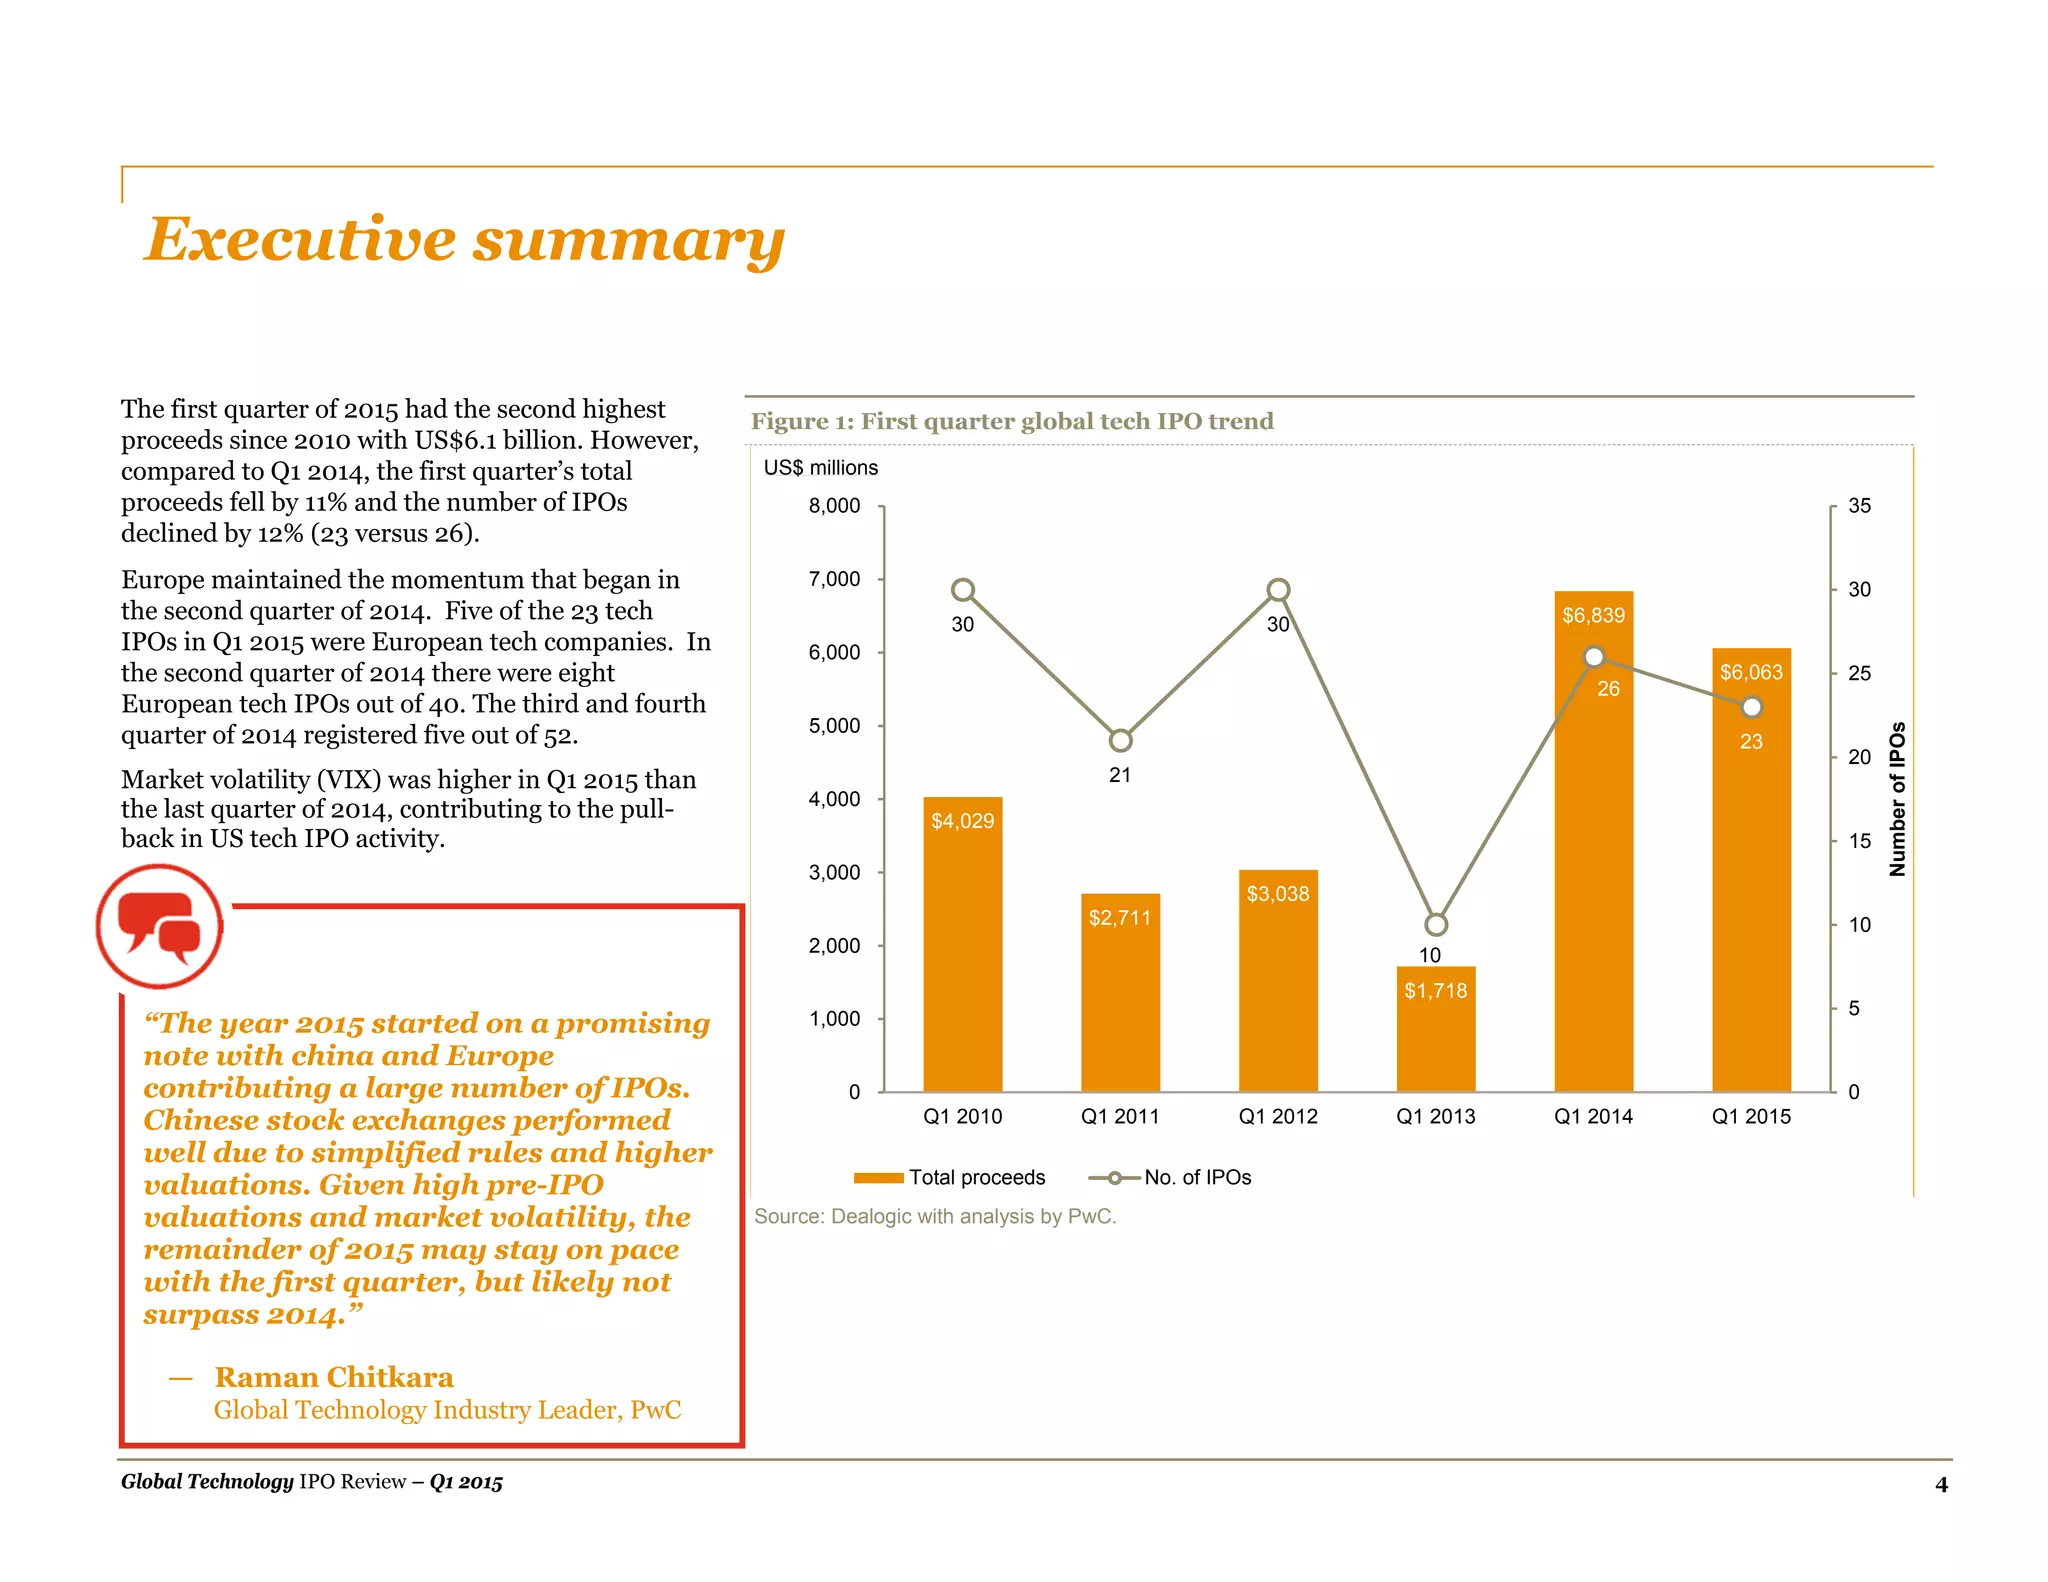
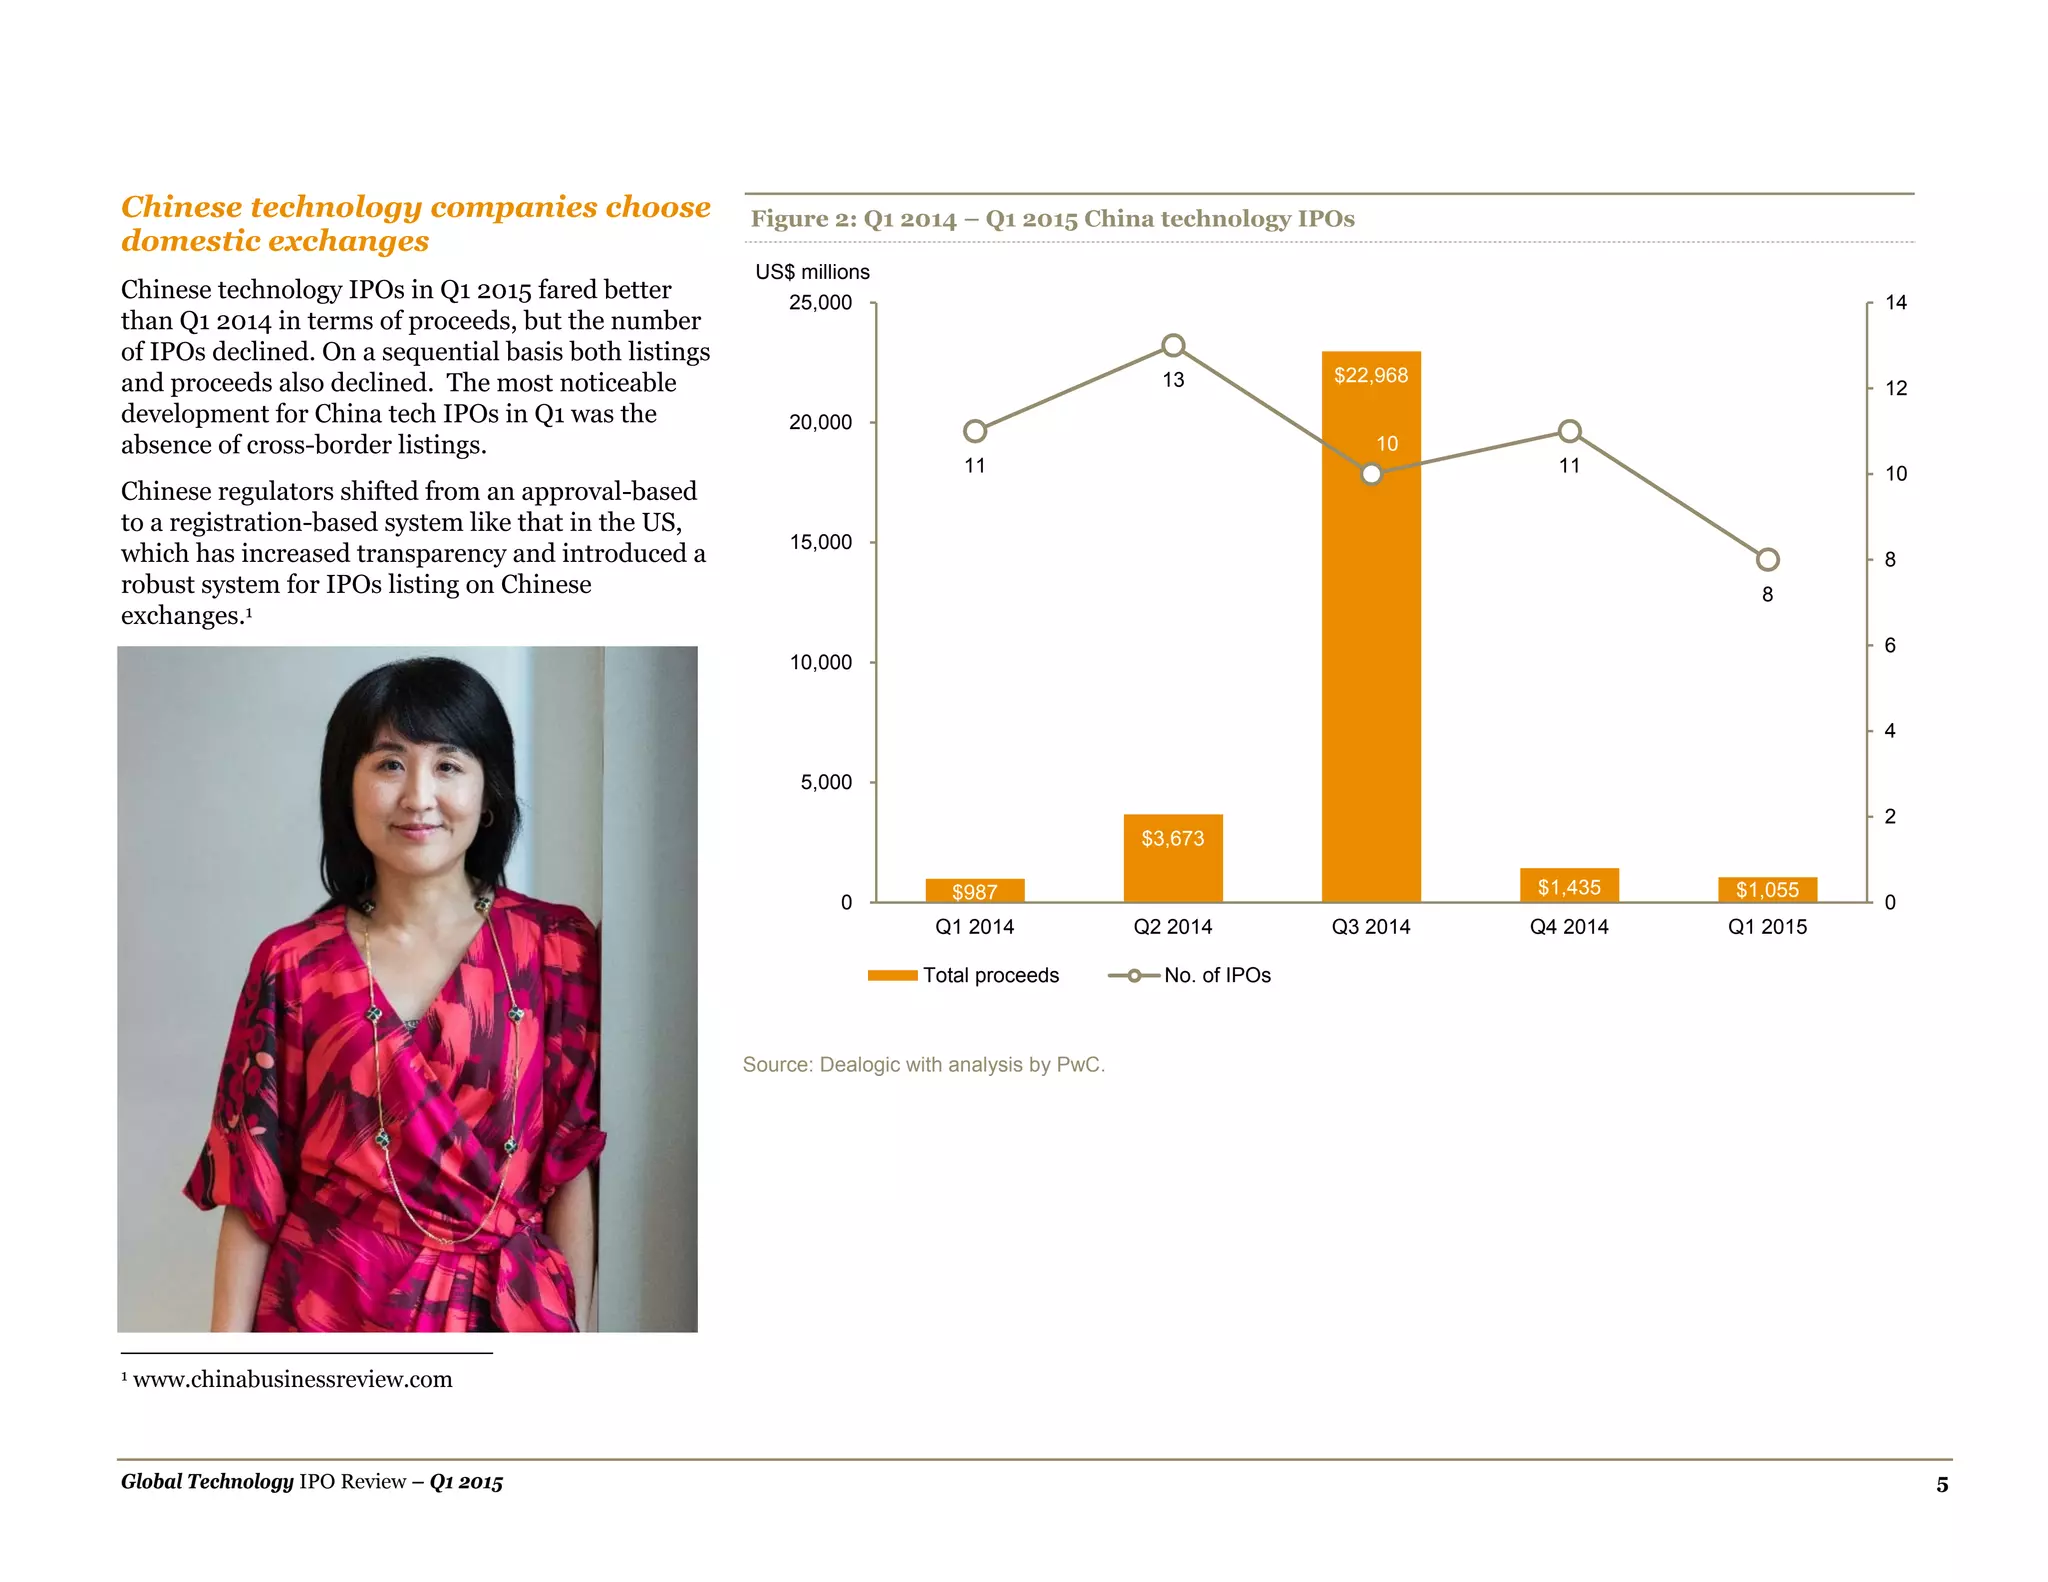

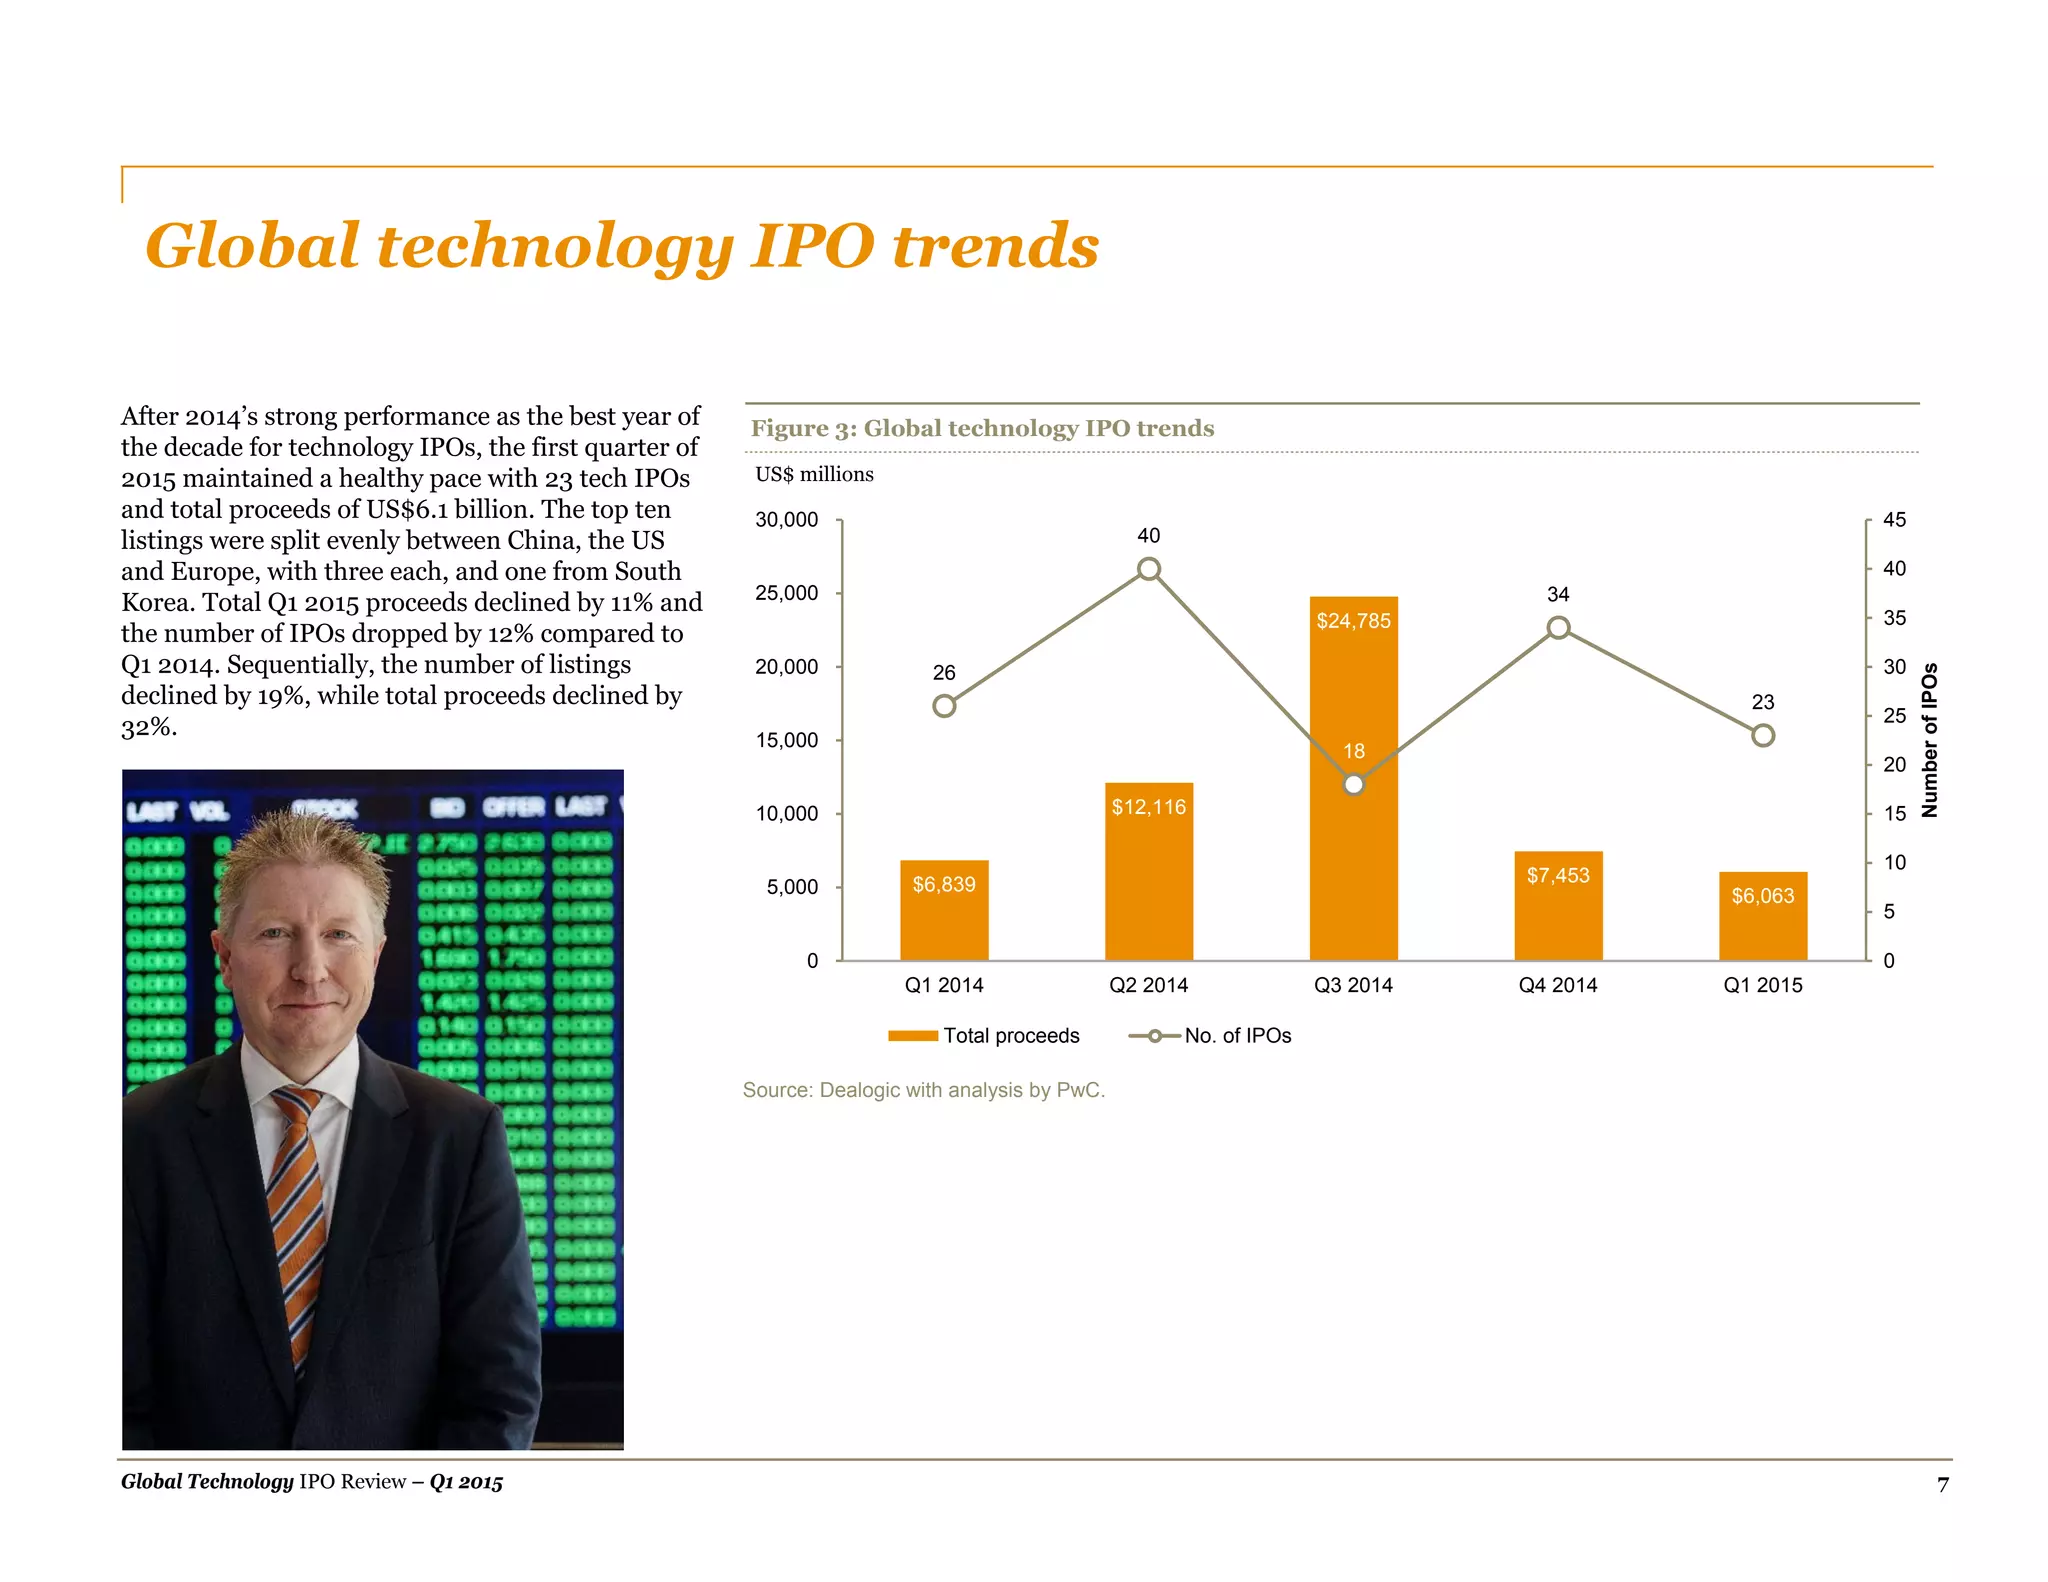
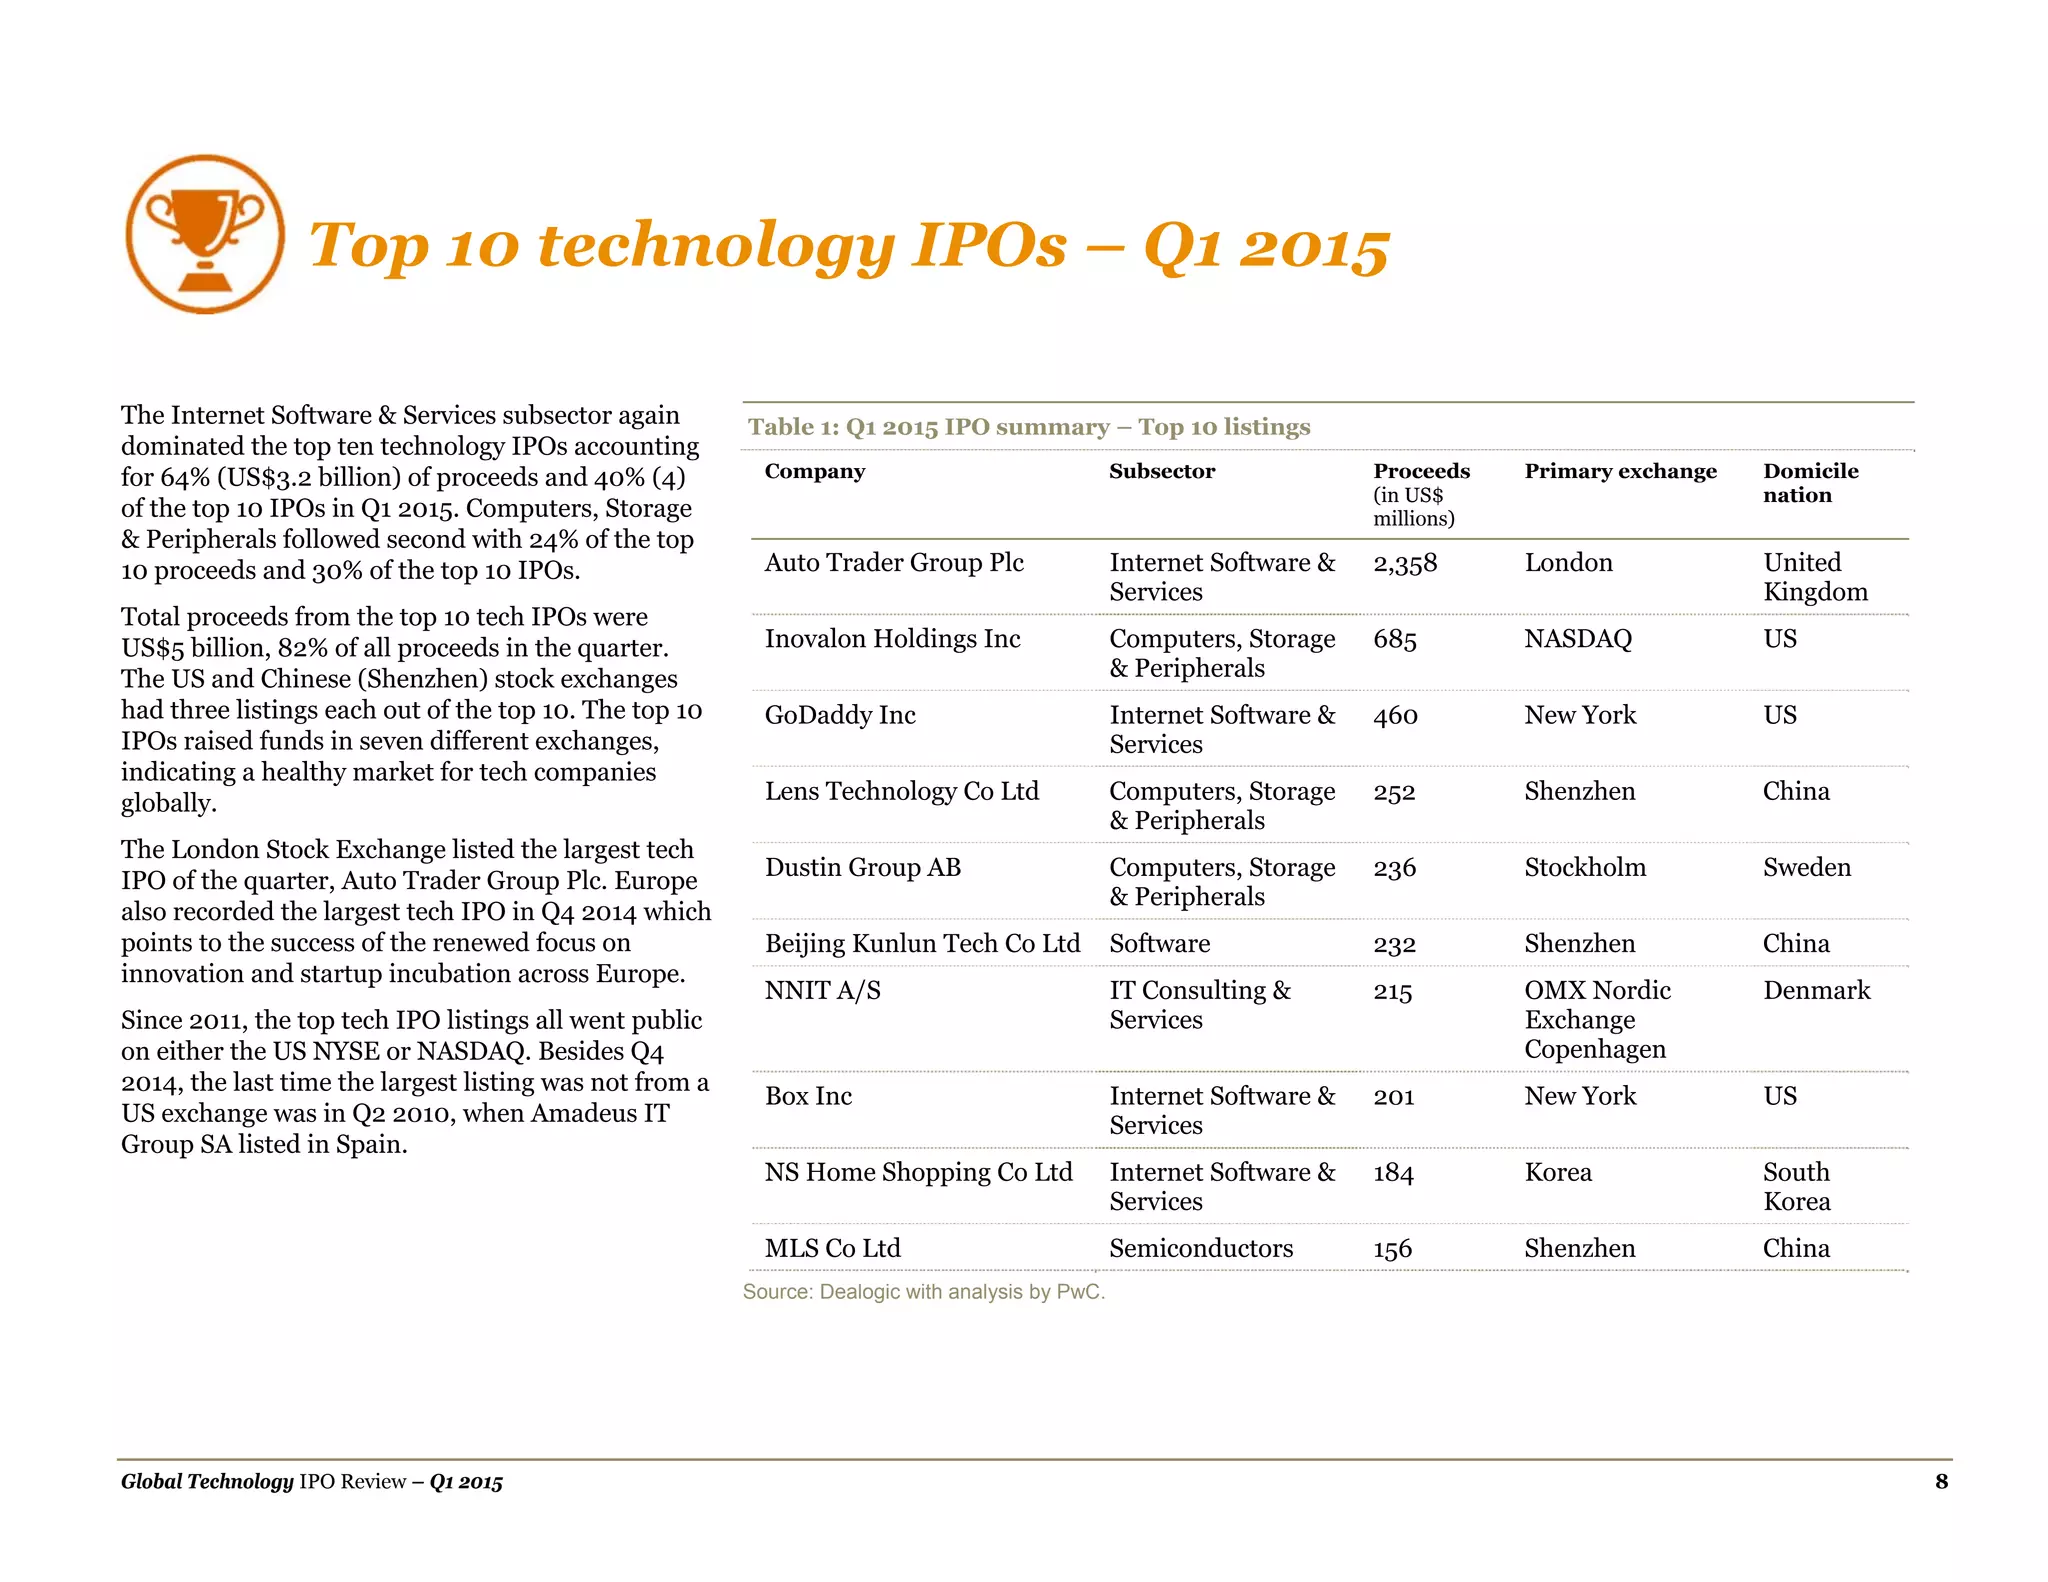
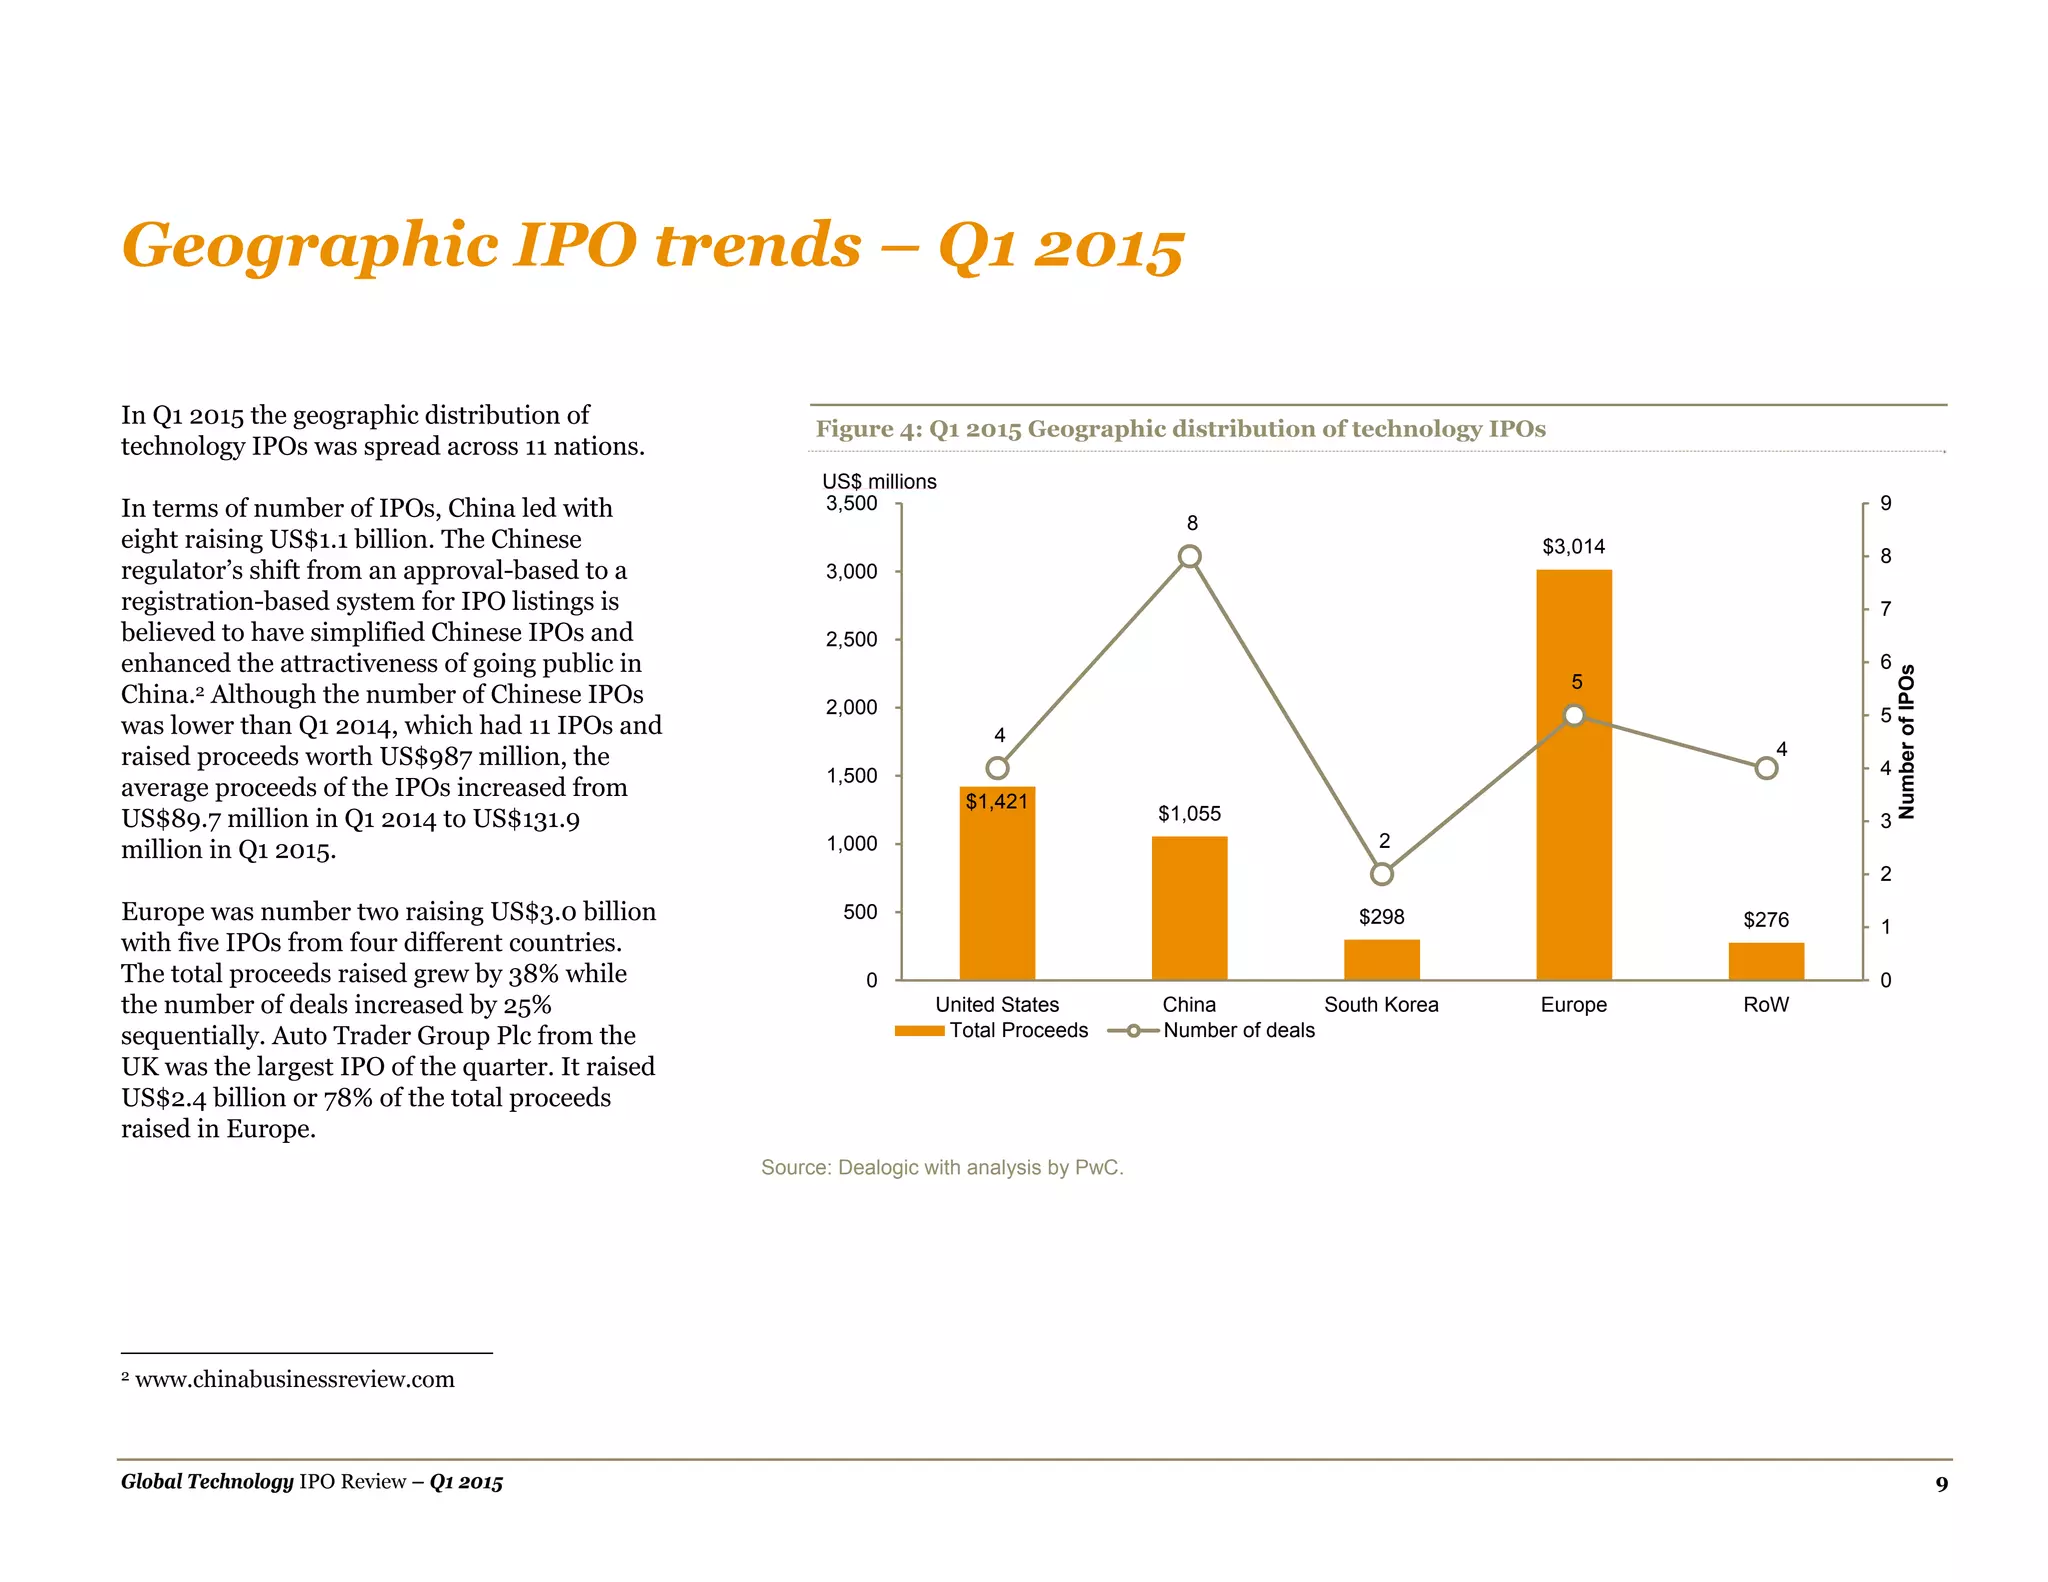
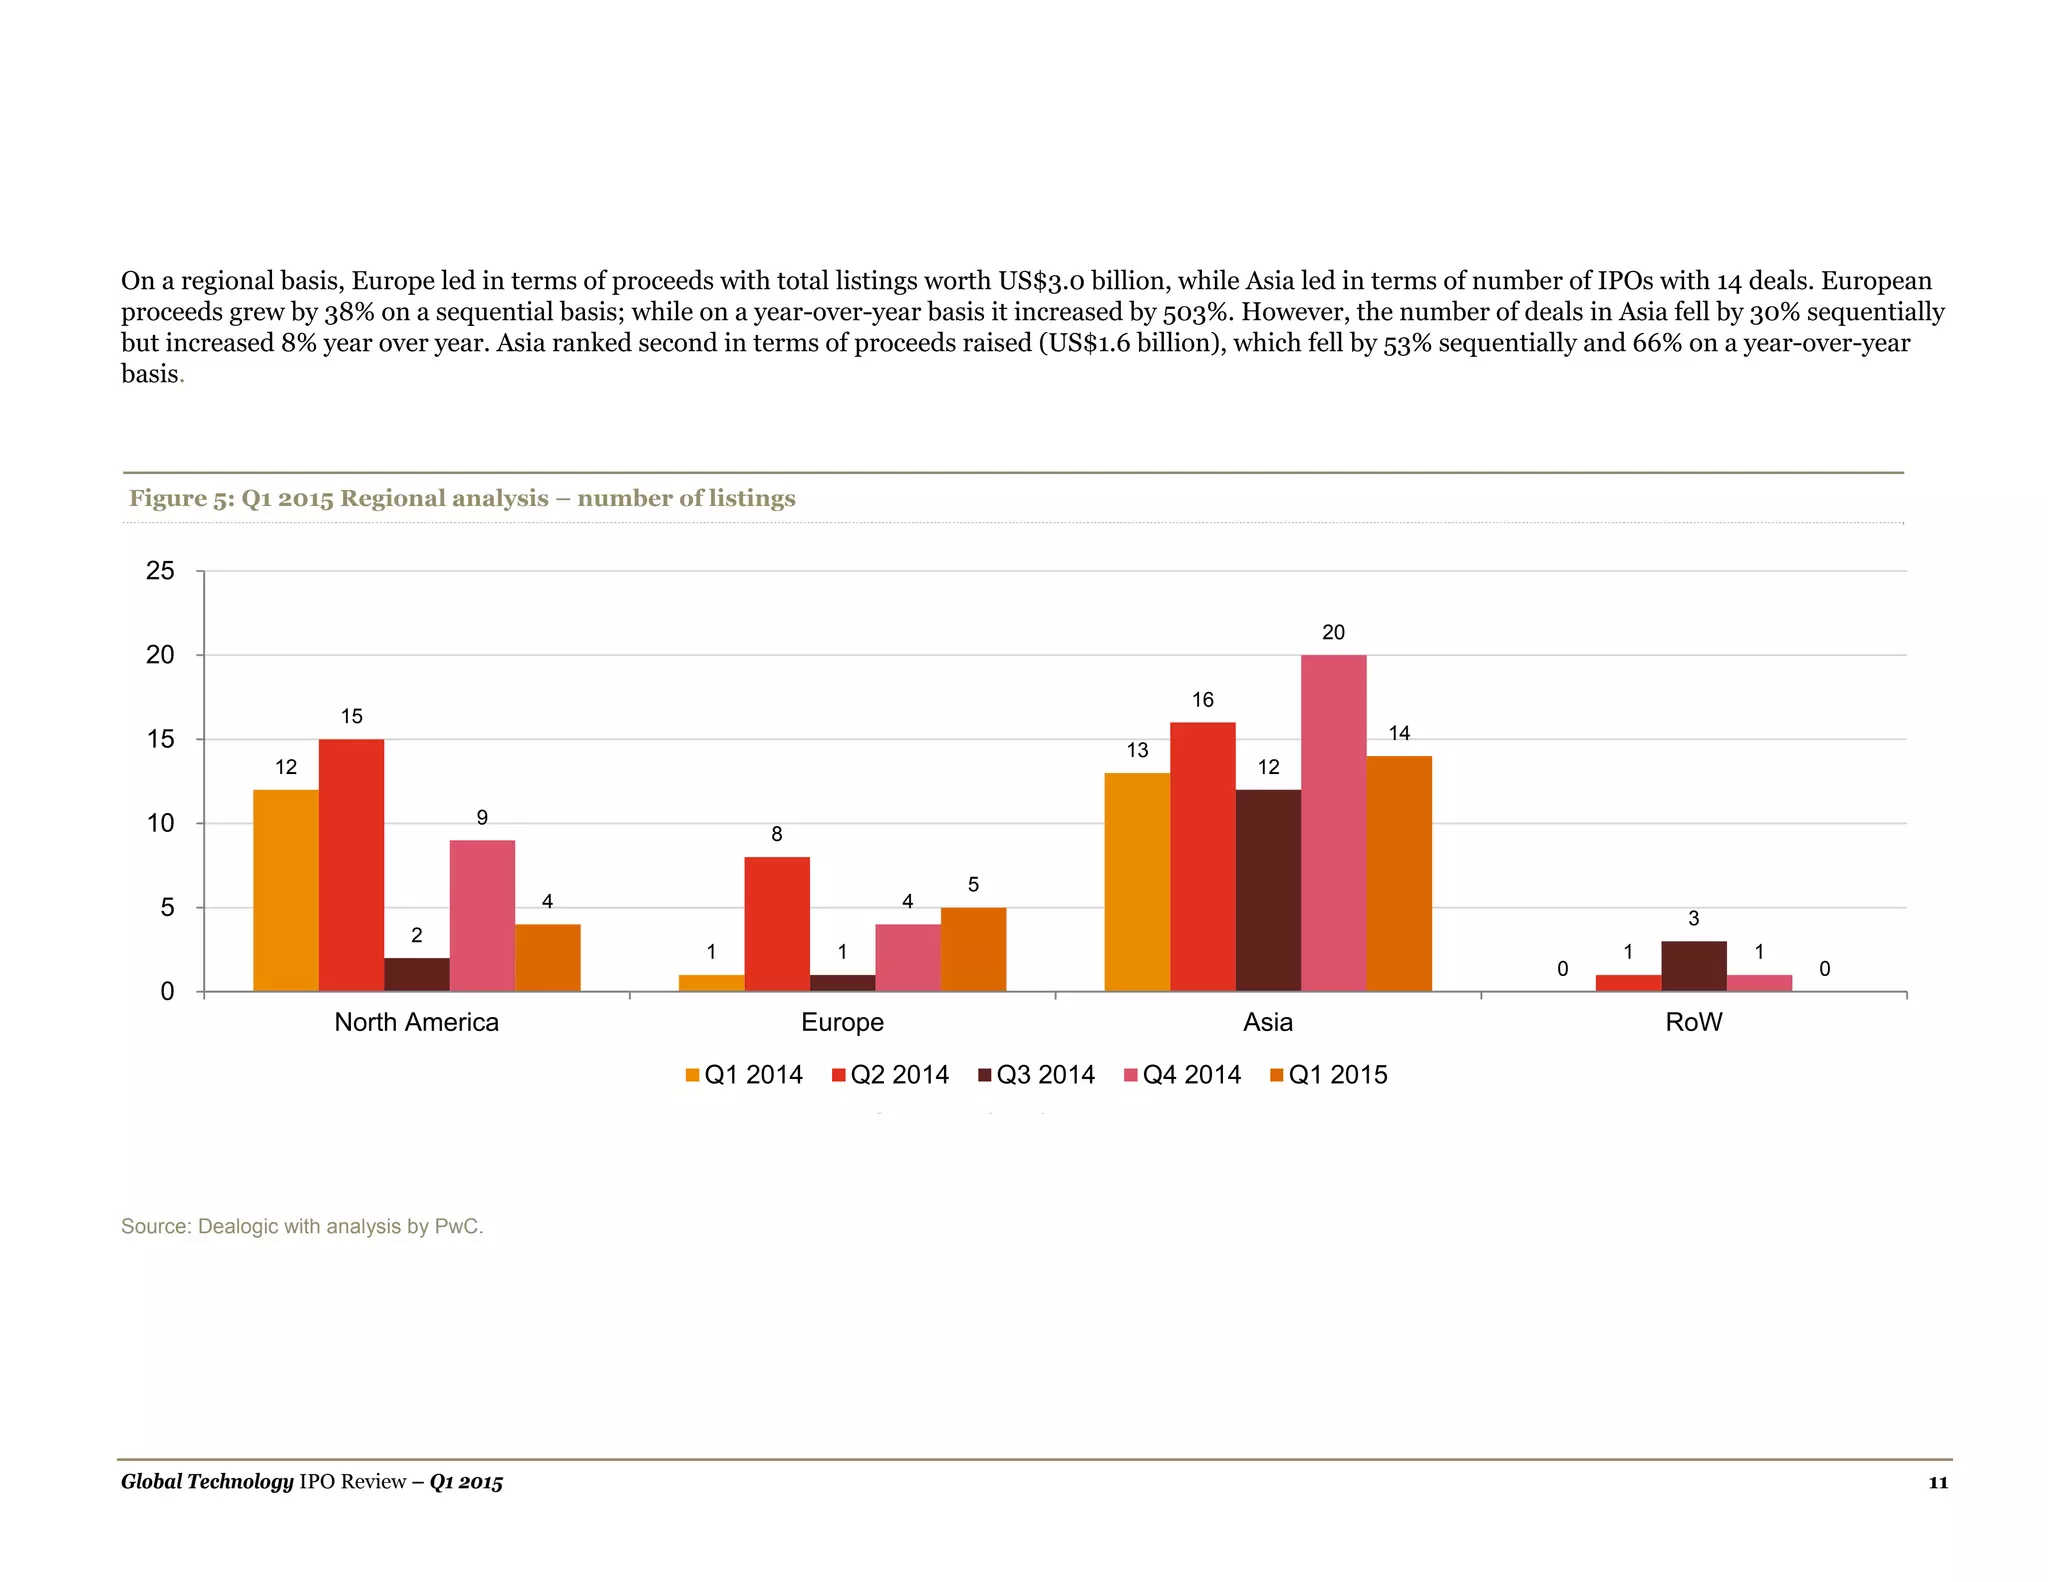
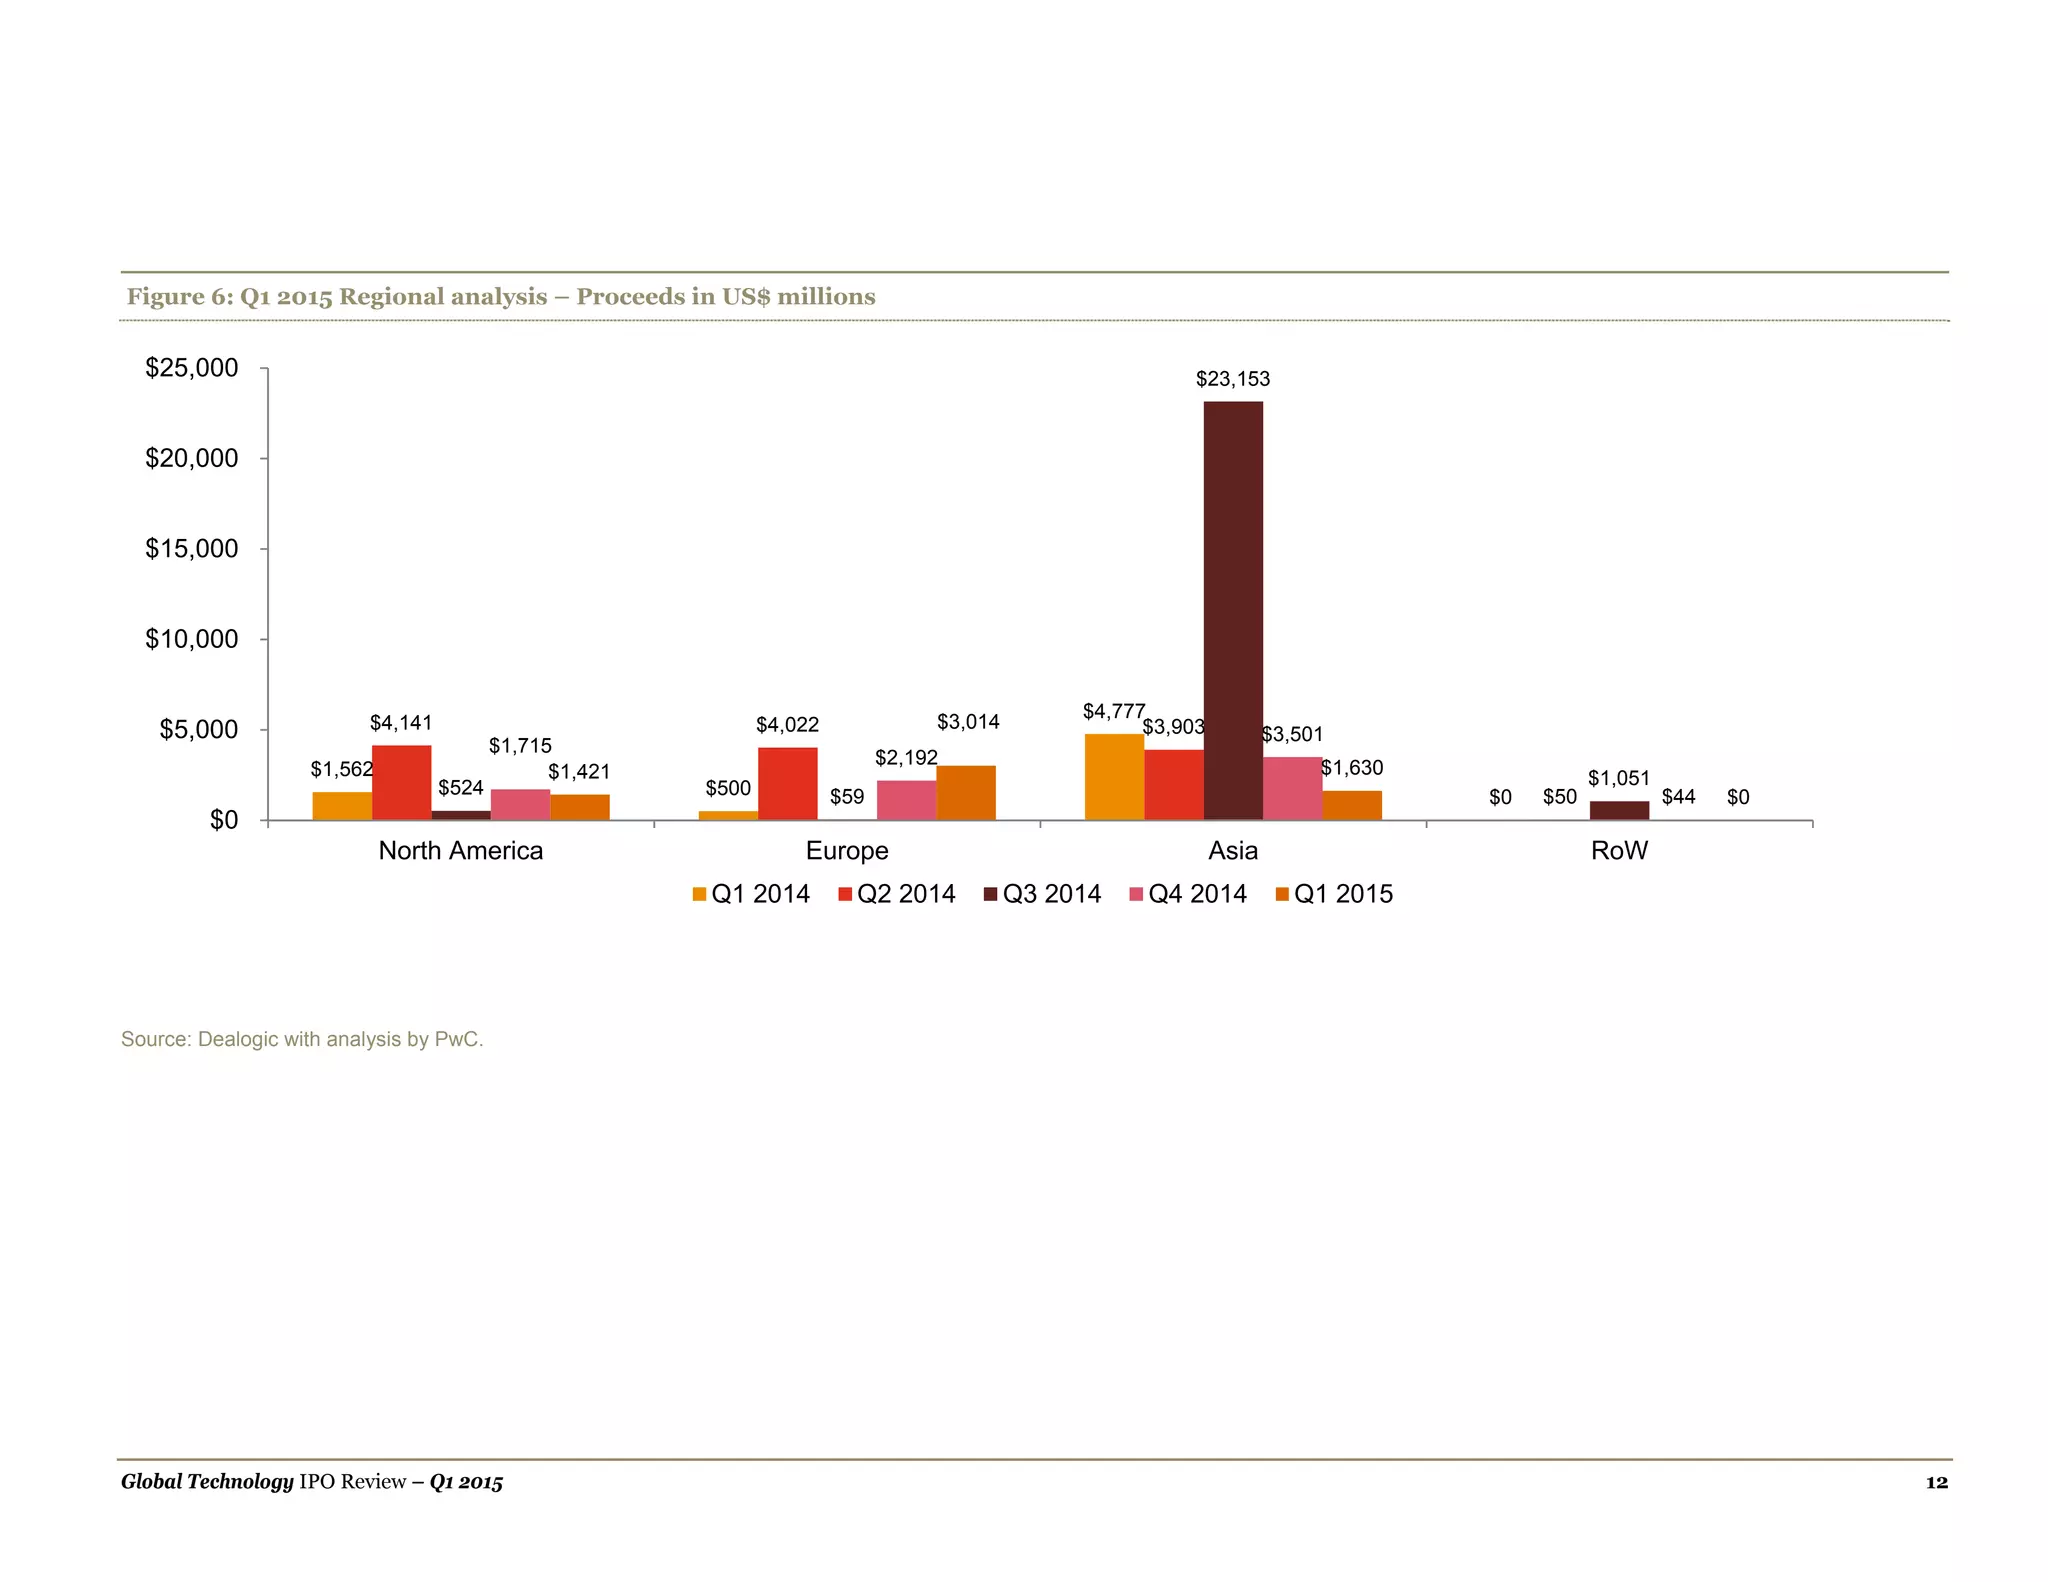
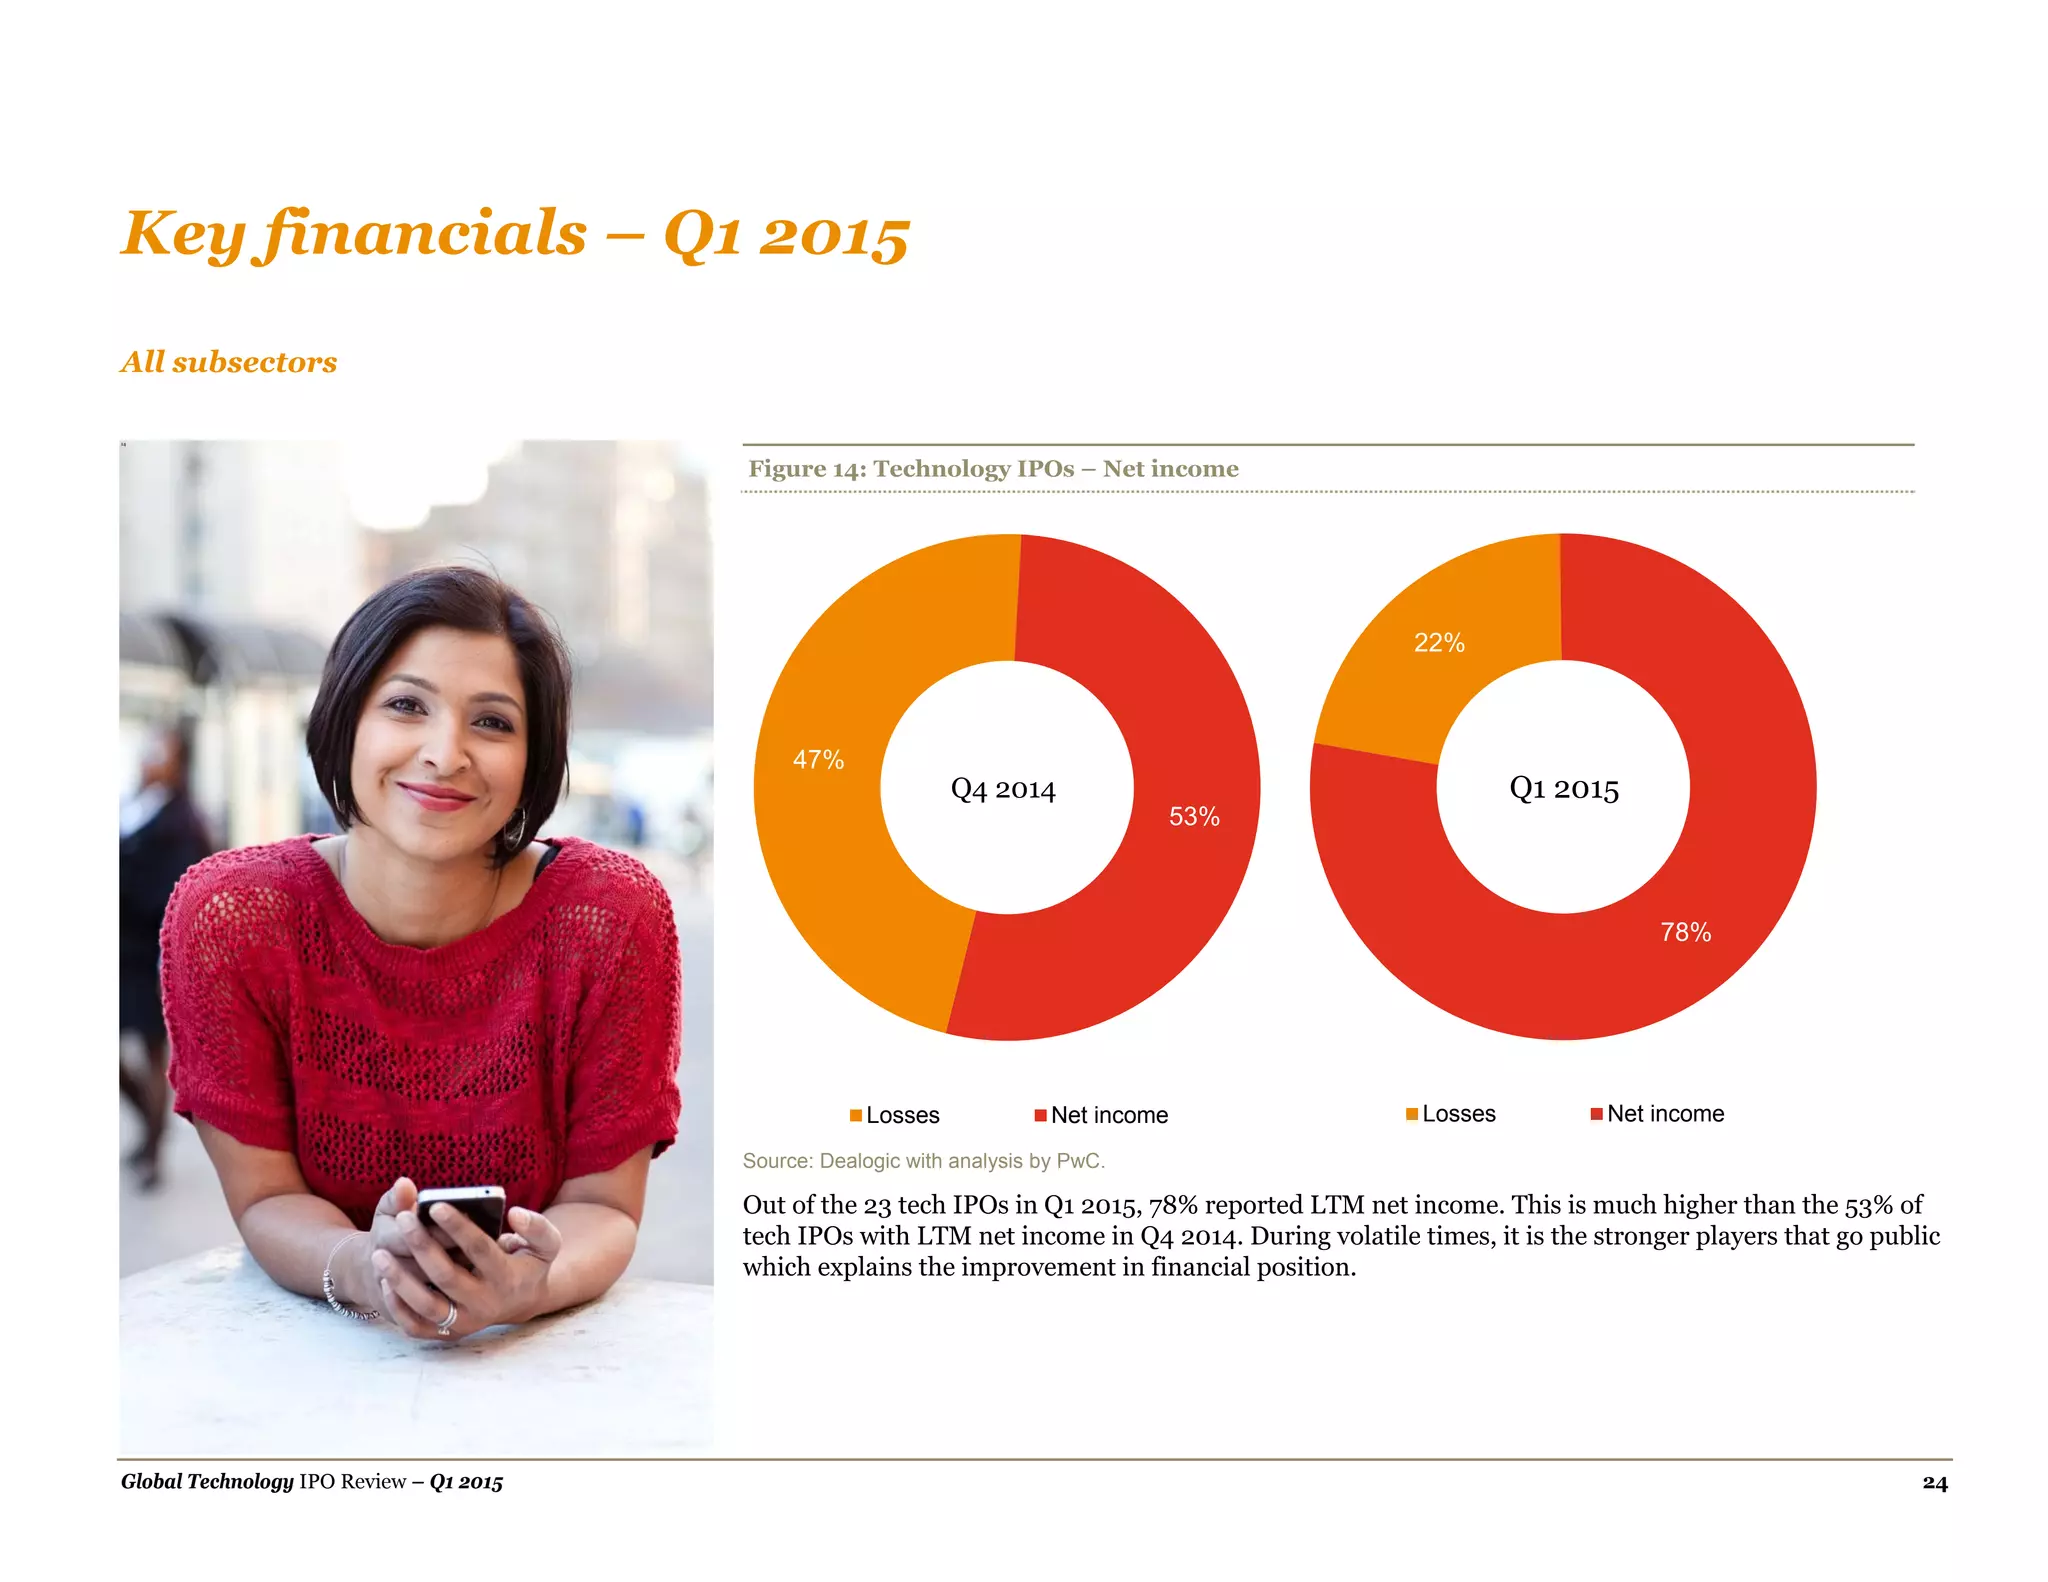
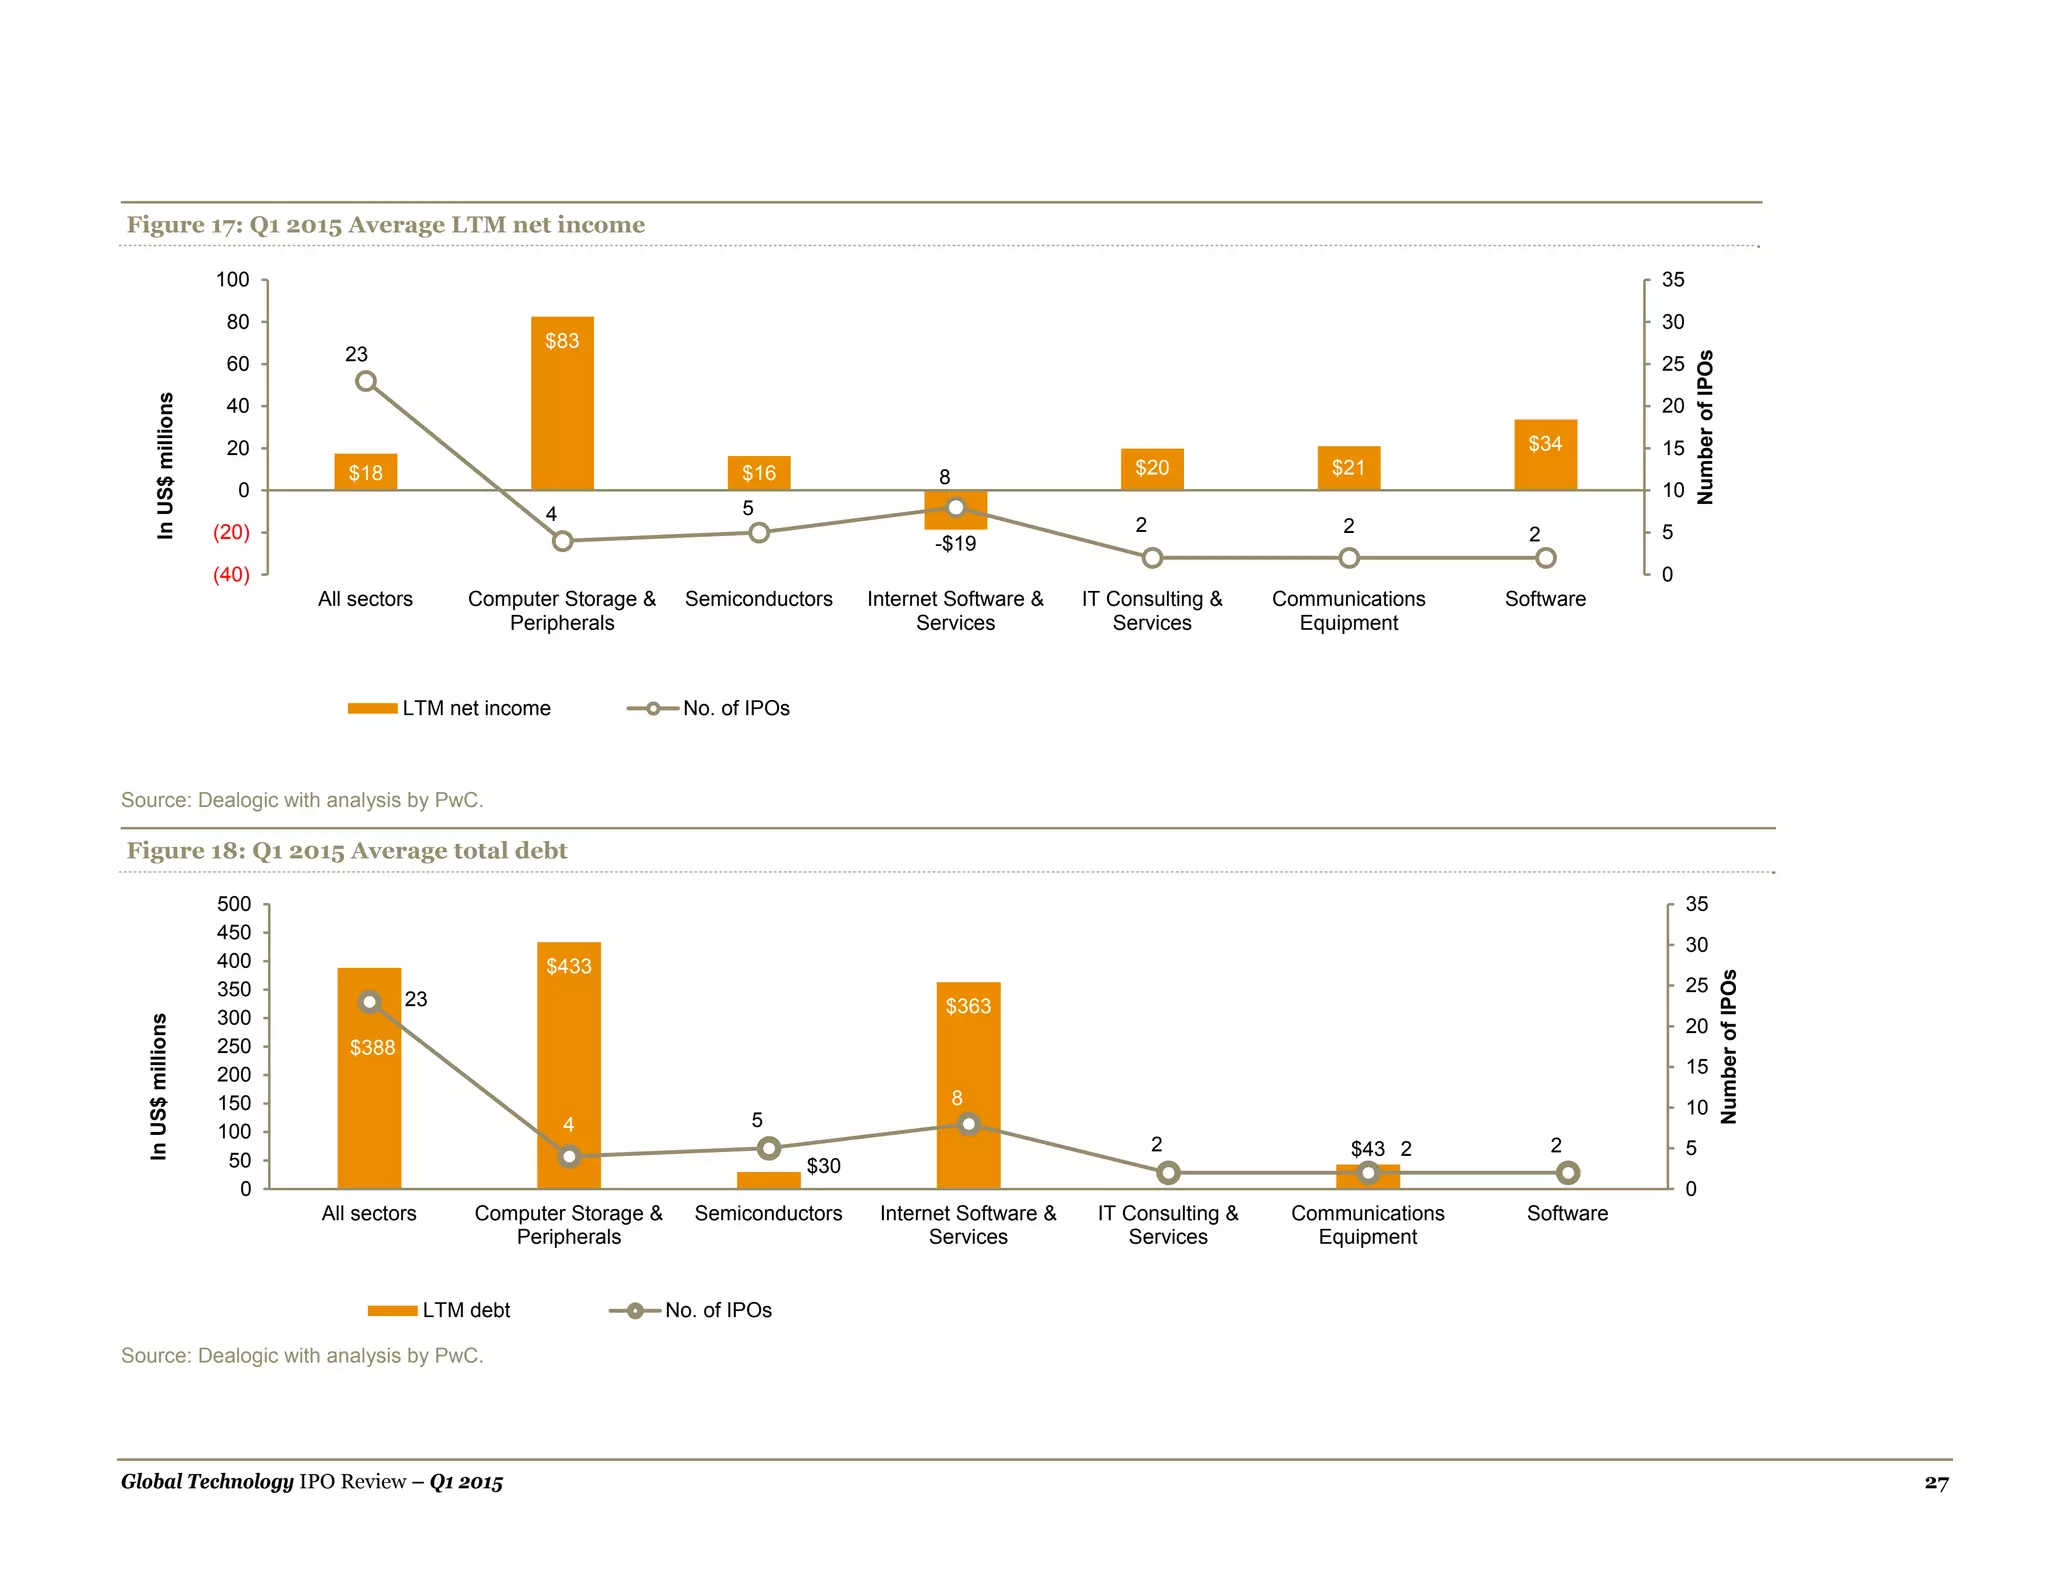
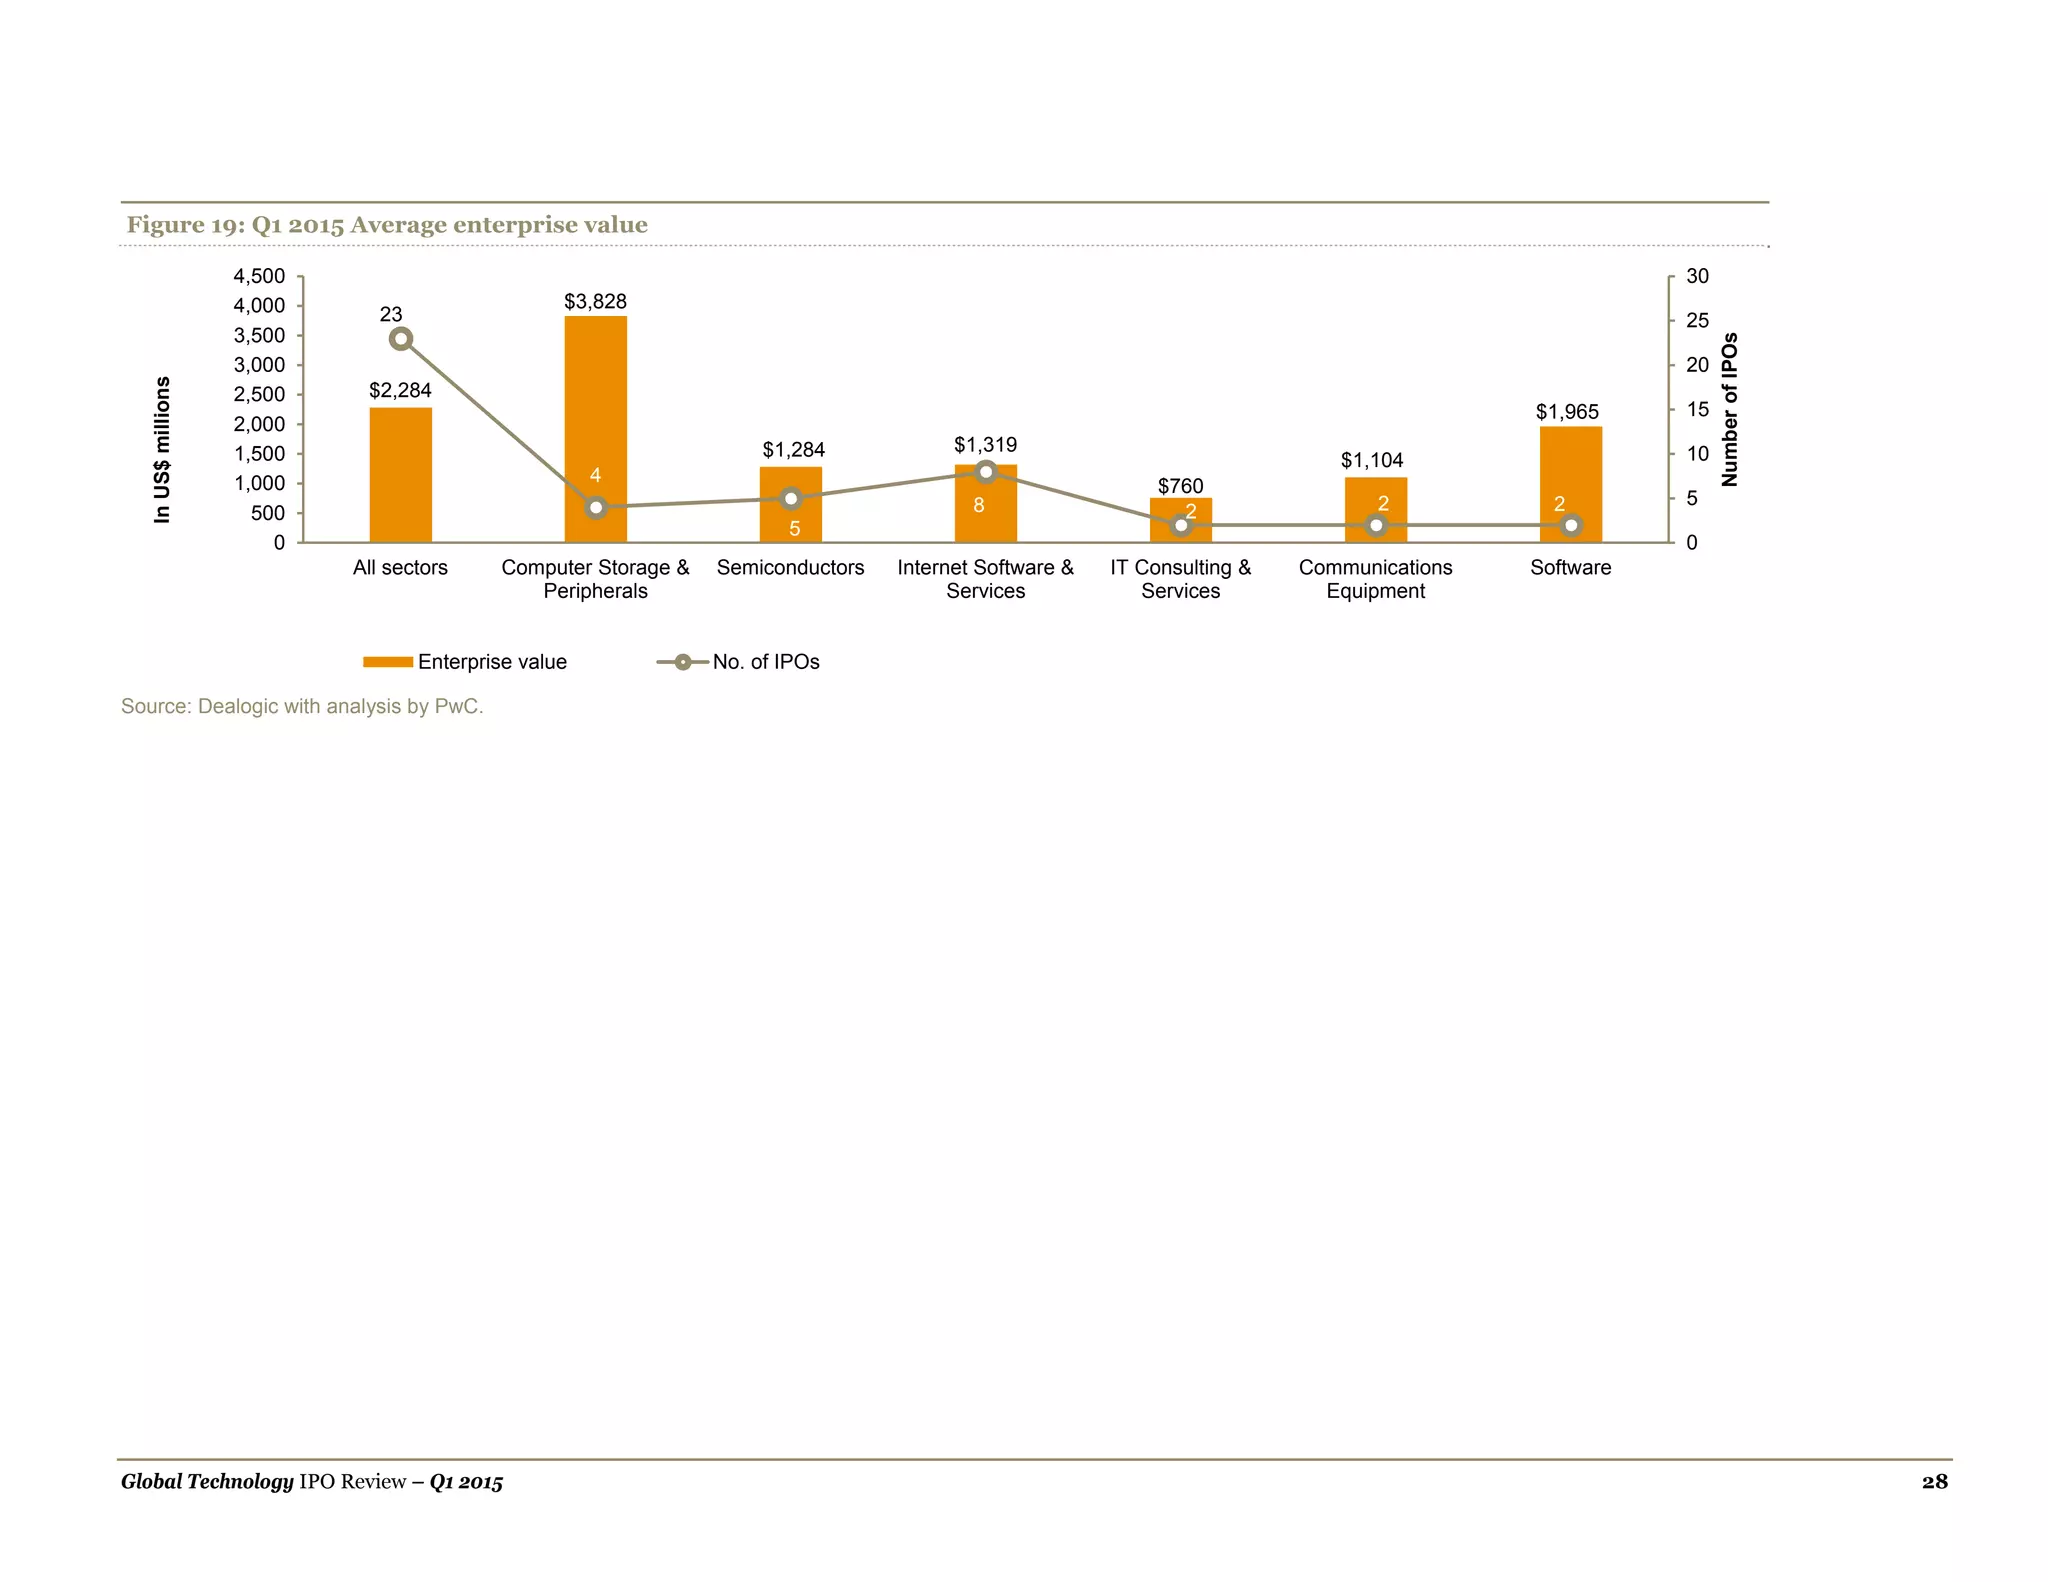
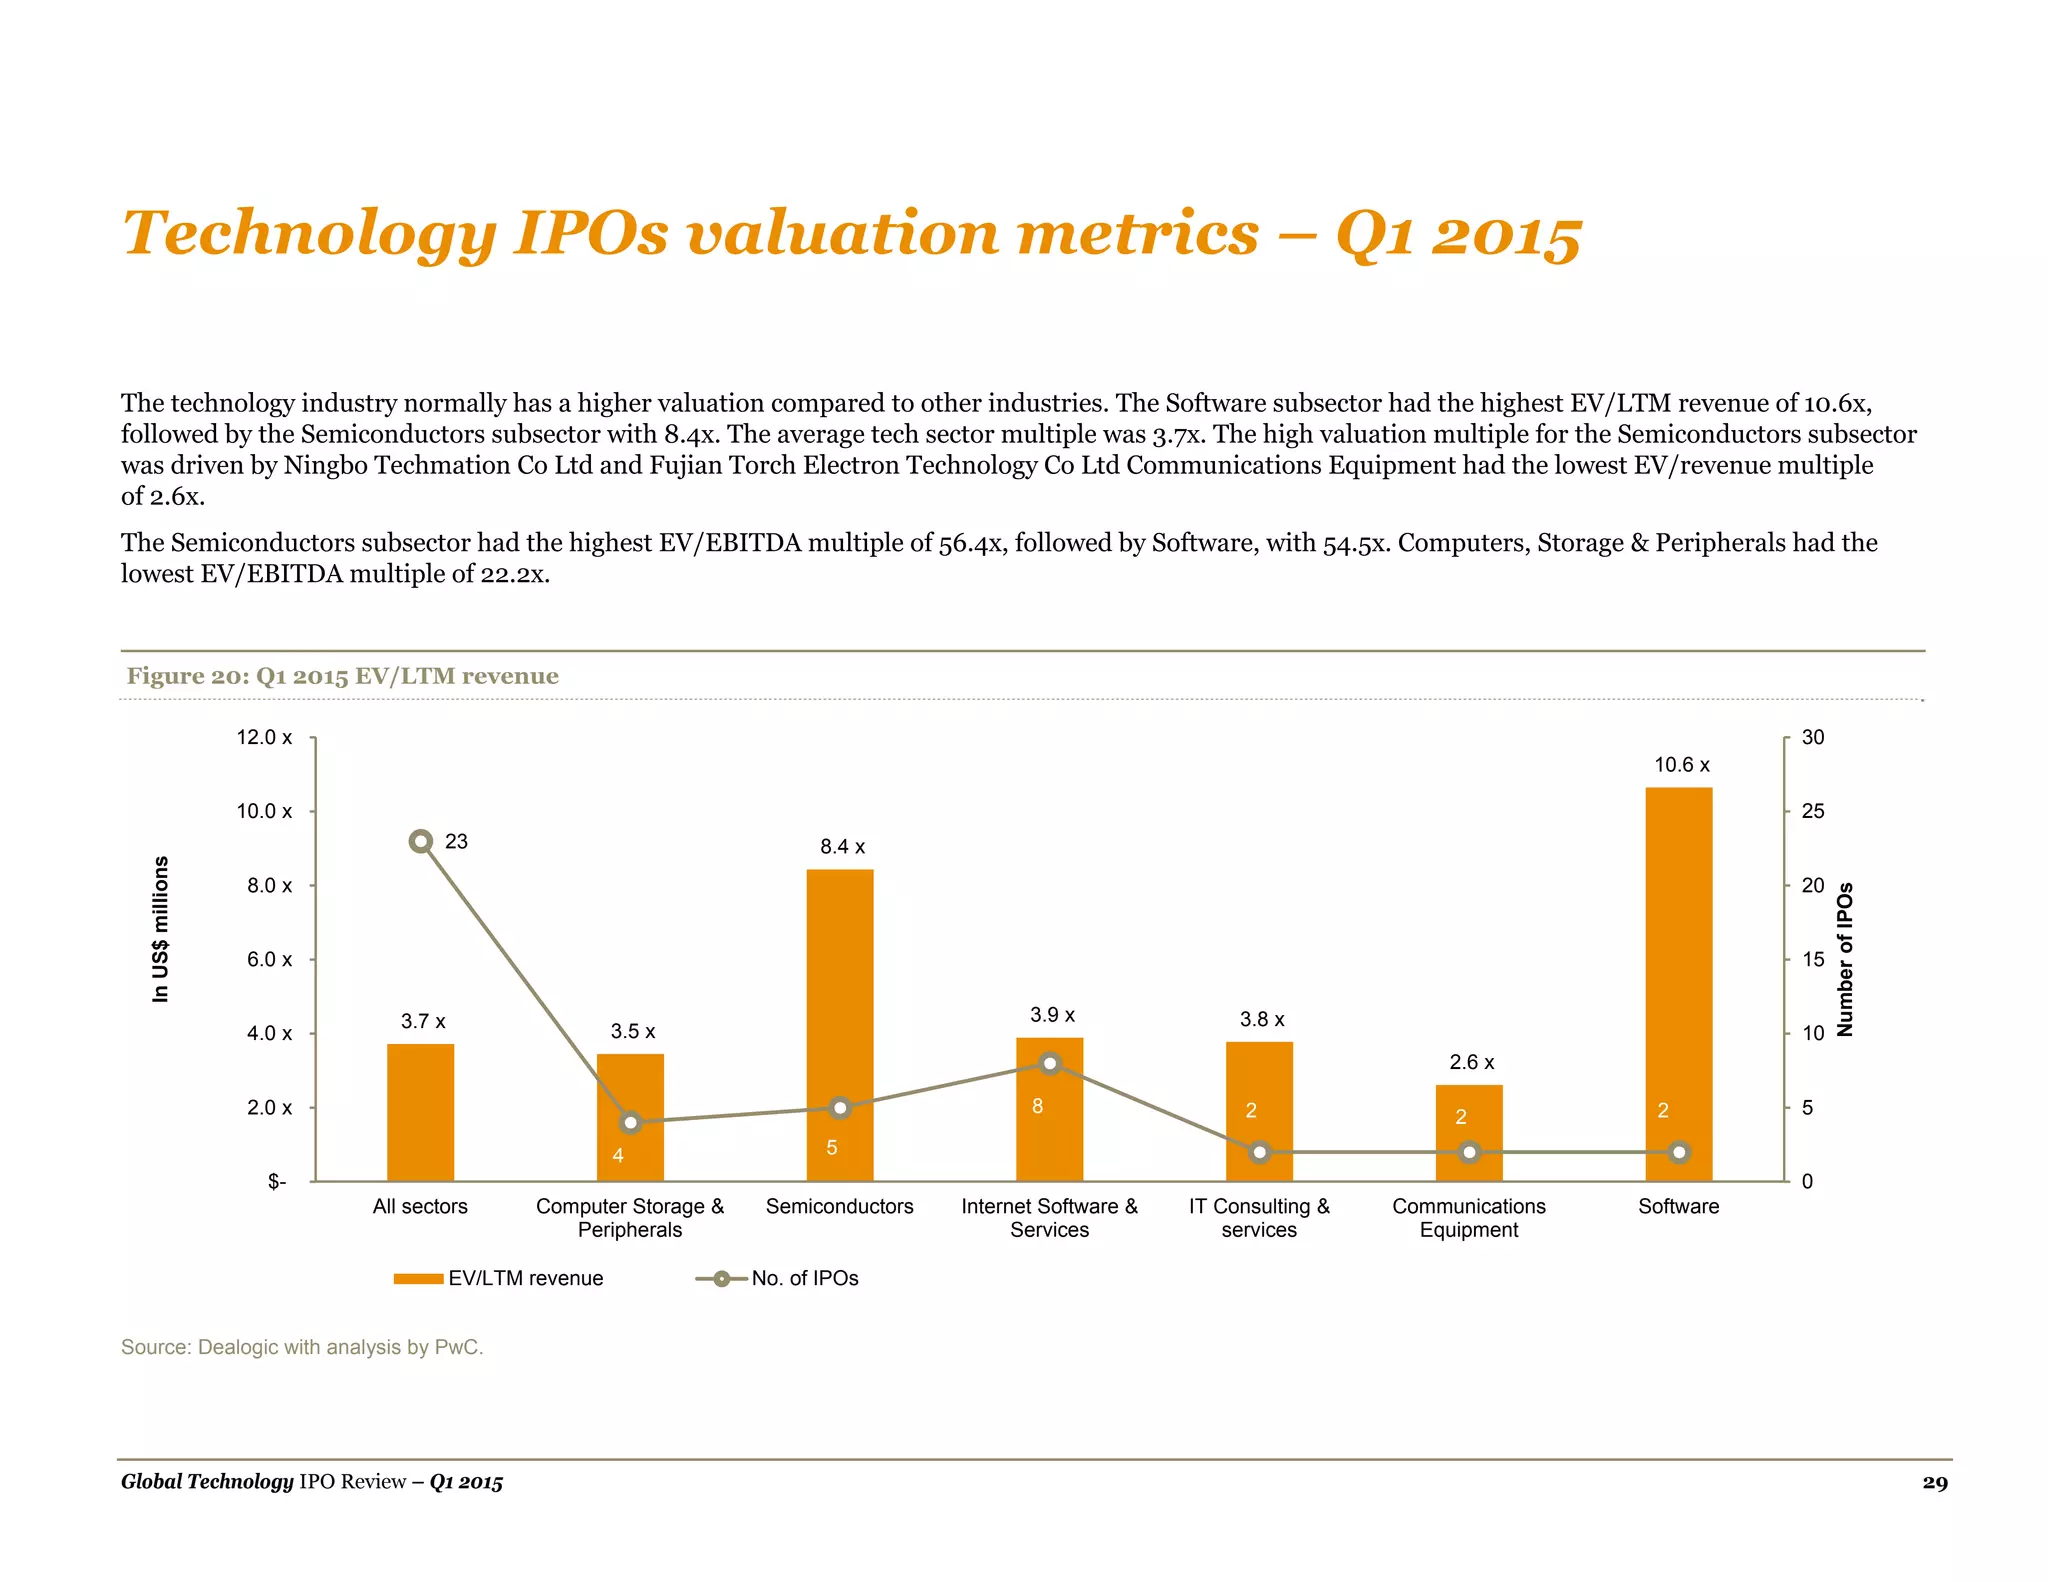
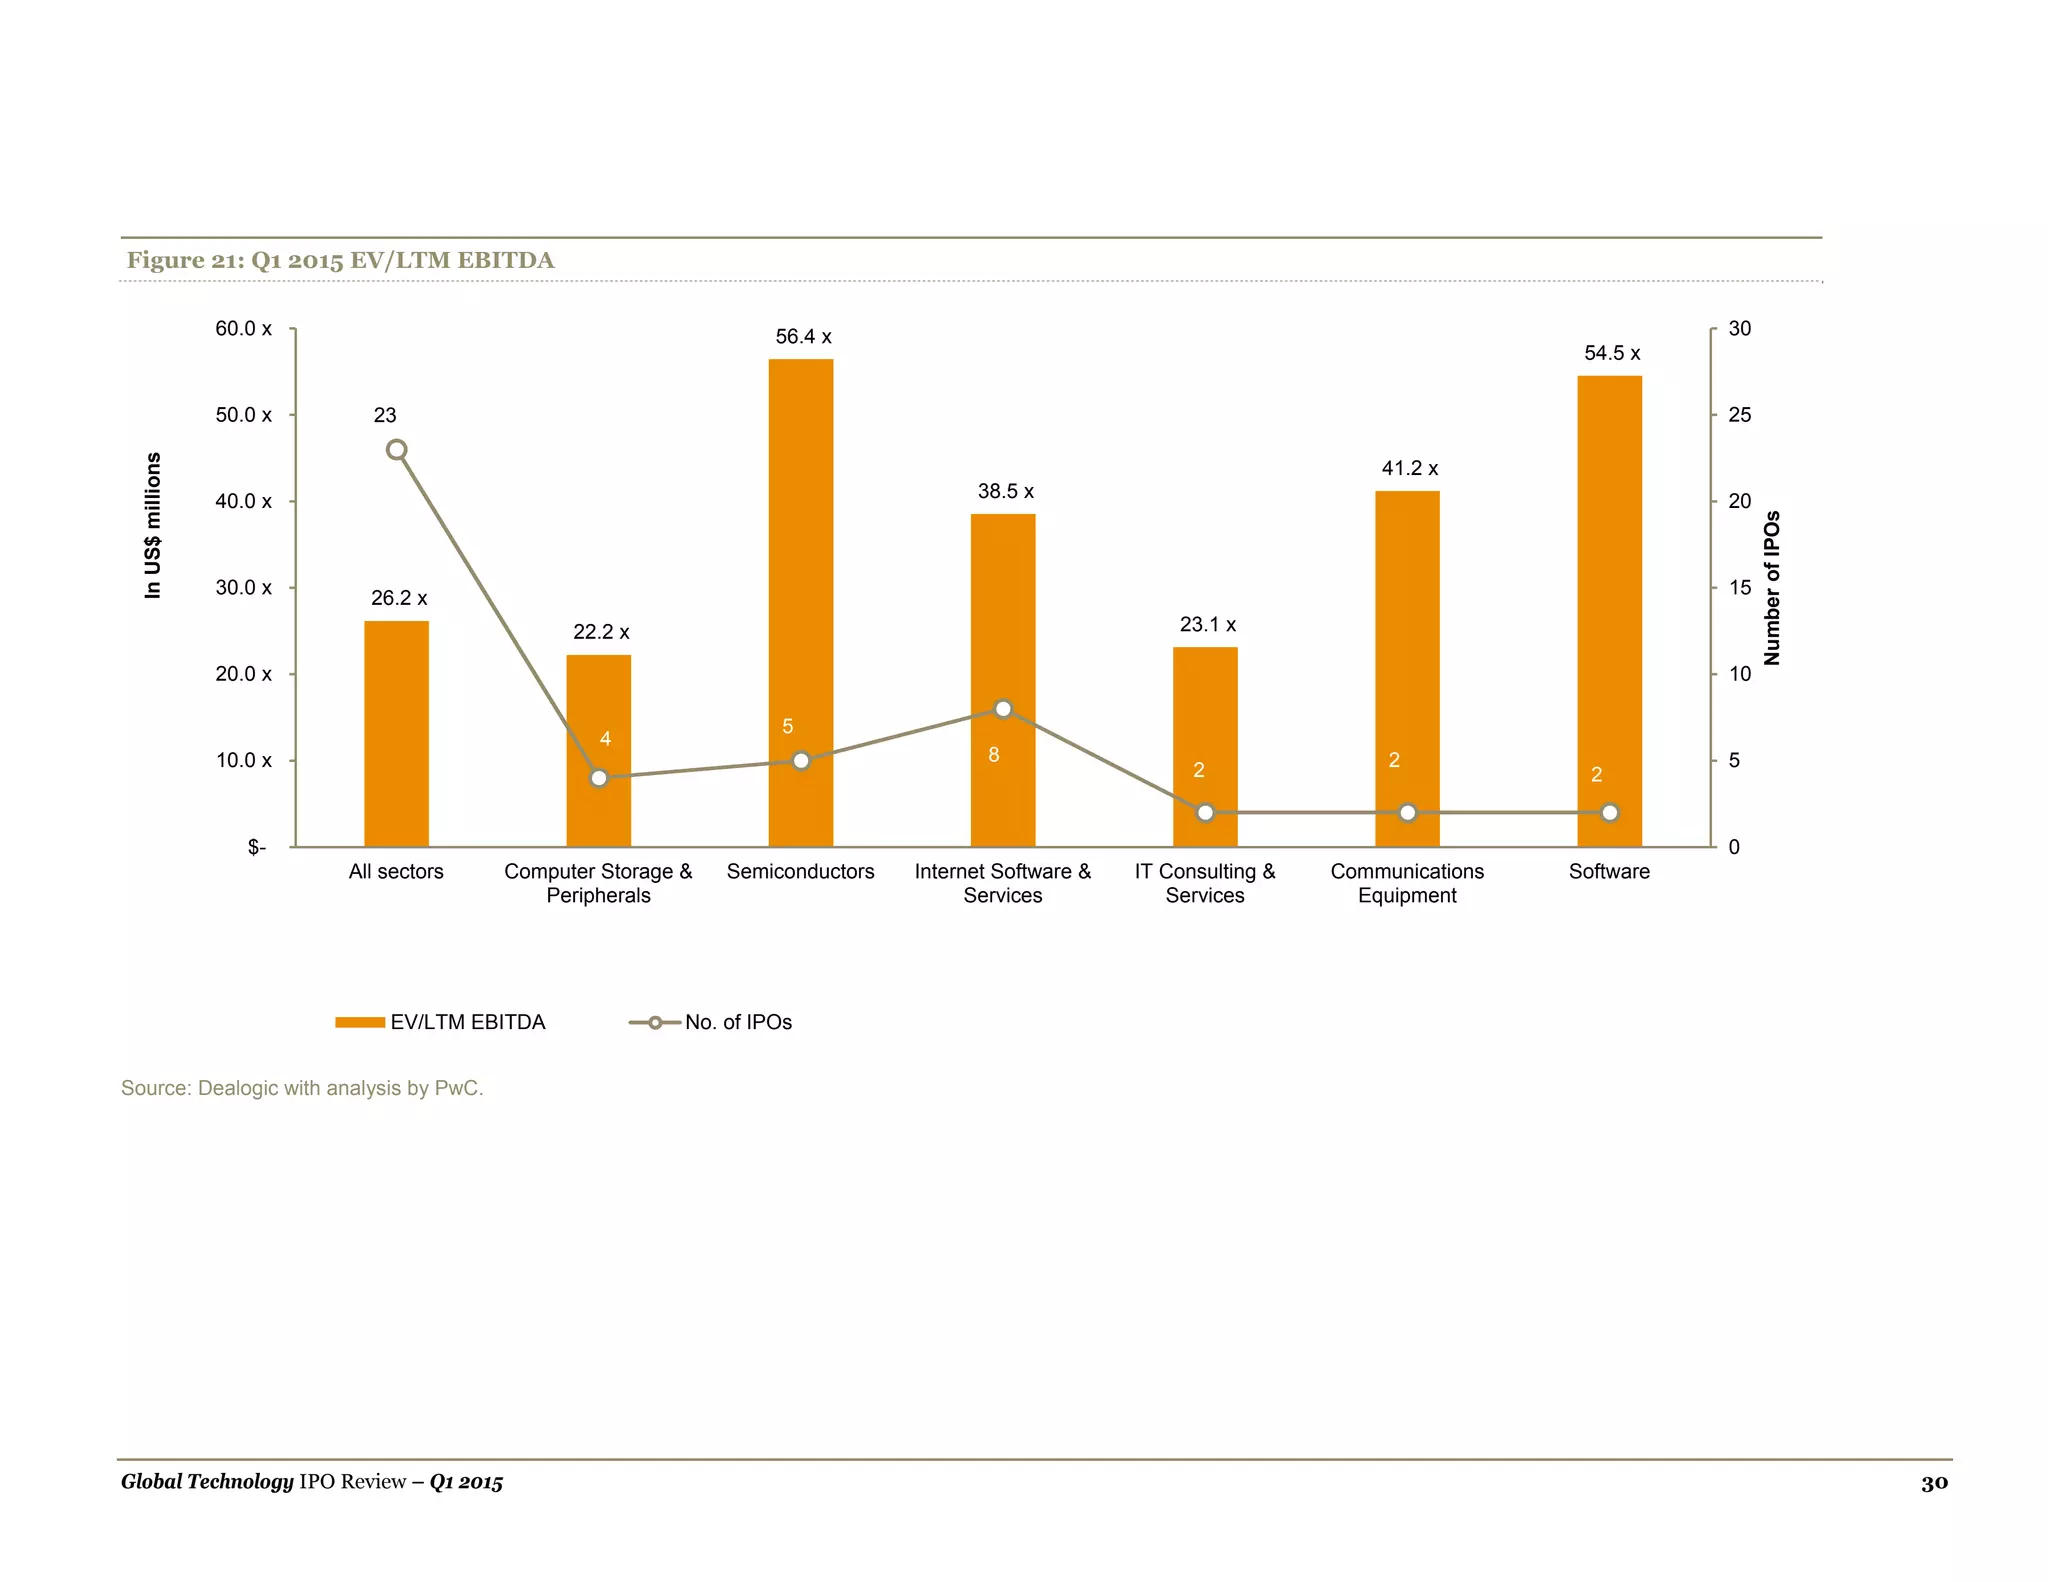

In the first quarter of 2015, the technology IPO market raised US$6.1 billion from 23 IPOs, marking a promising but lower performance compared to the previous year. China led in IPO activity with eight listings, while Europe showed strong growth with five tech IPOs, including the largest IPO of the quarter. However, the U.S. saw a significant decline in both the number of IPOs and proceeds due to increased market volatility and the availability of private funding.


![Coded Agents – with UiPath SDK + LangGraph [Virtual Hands-on Workshop]](https://cdn.slidesharecdn.com/ss_thumbnails/codedagentsdeck-251215155422-5497c599-thumbnail.jpg?width=640&height=640&fit=bounds)


