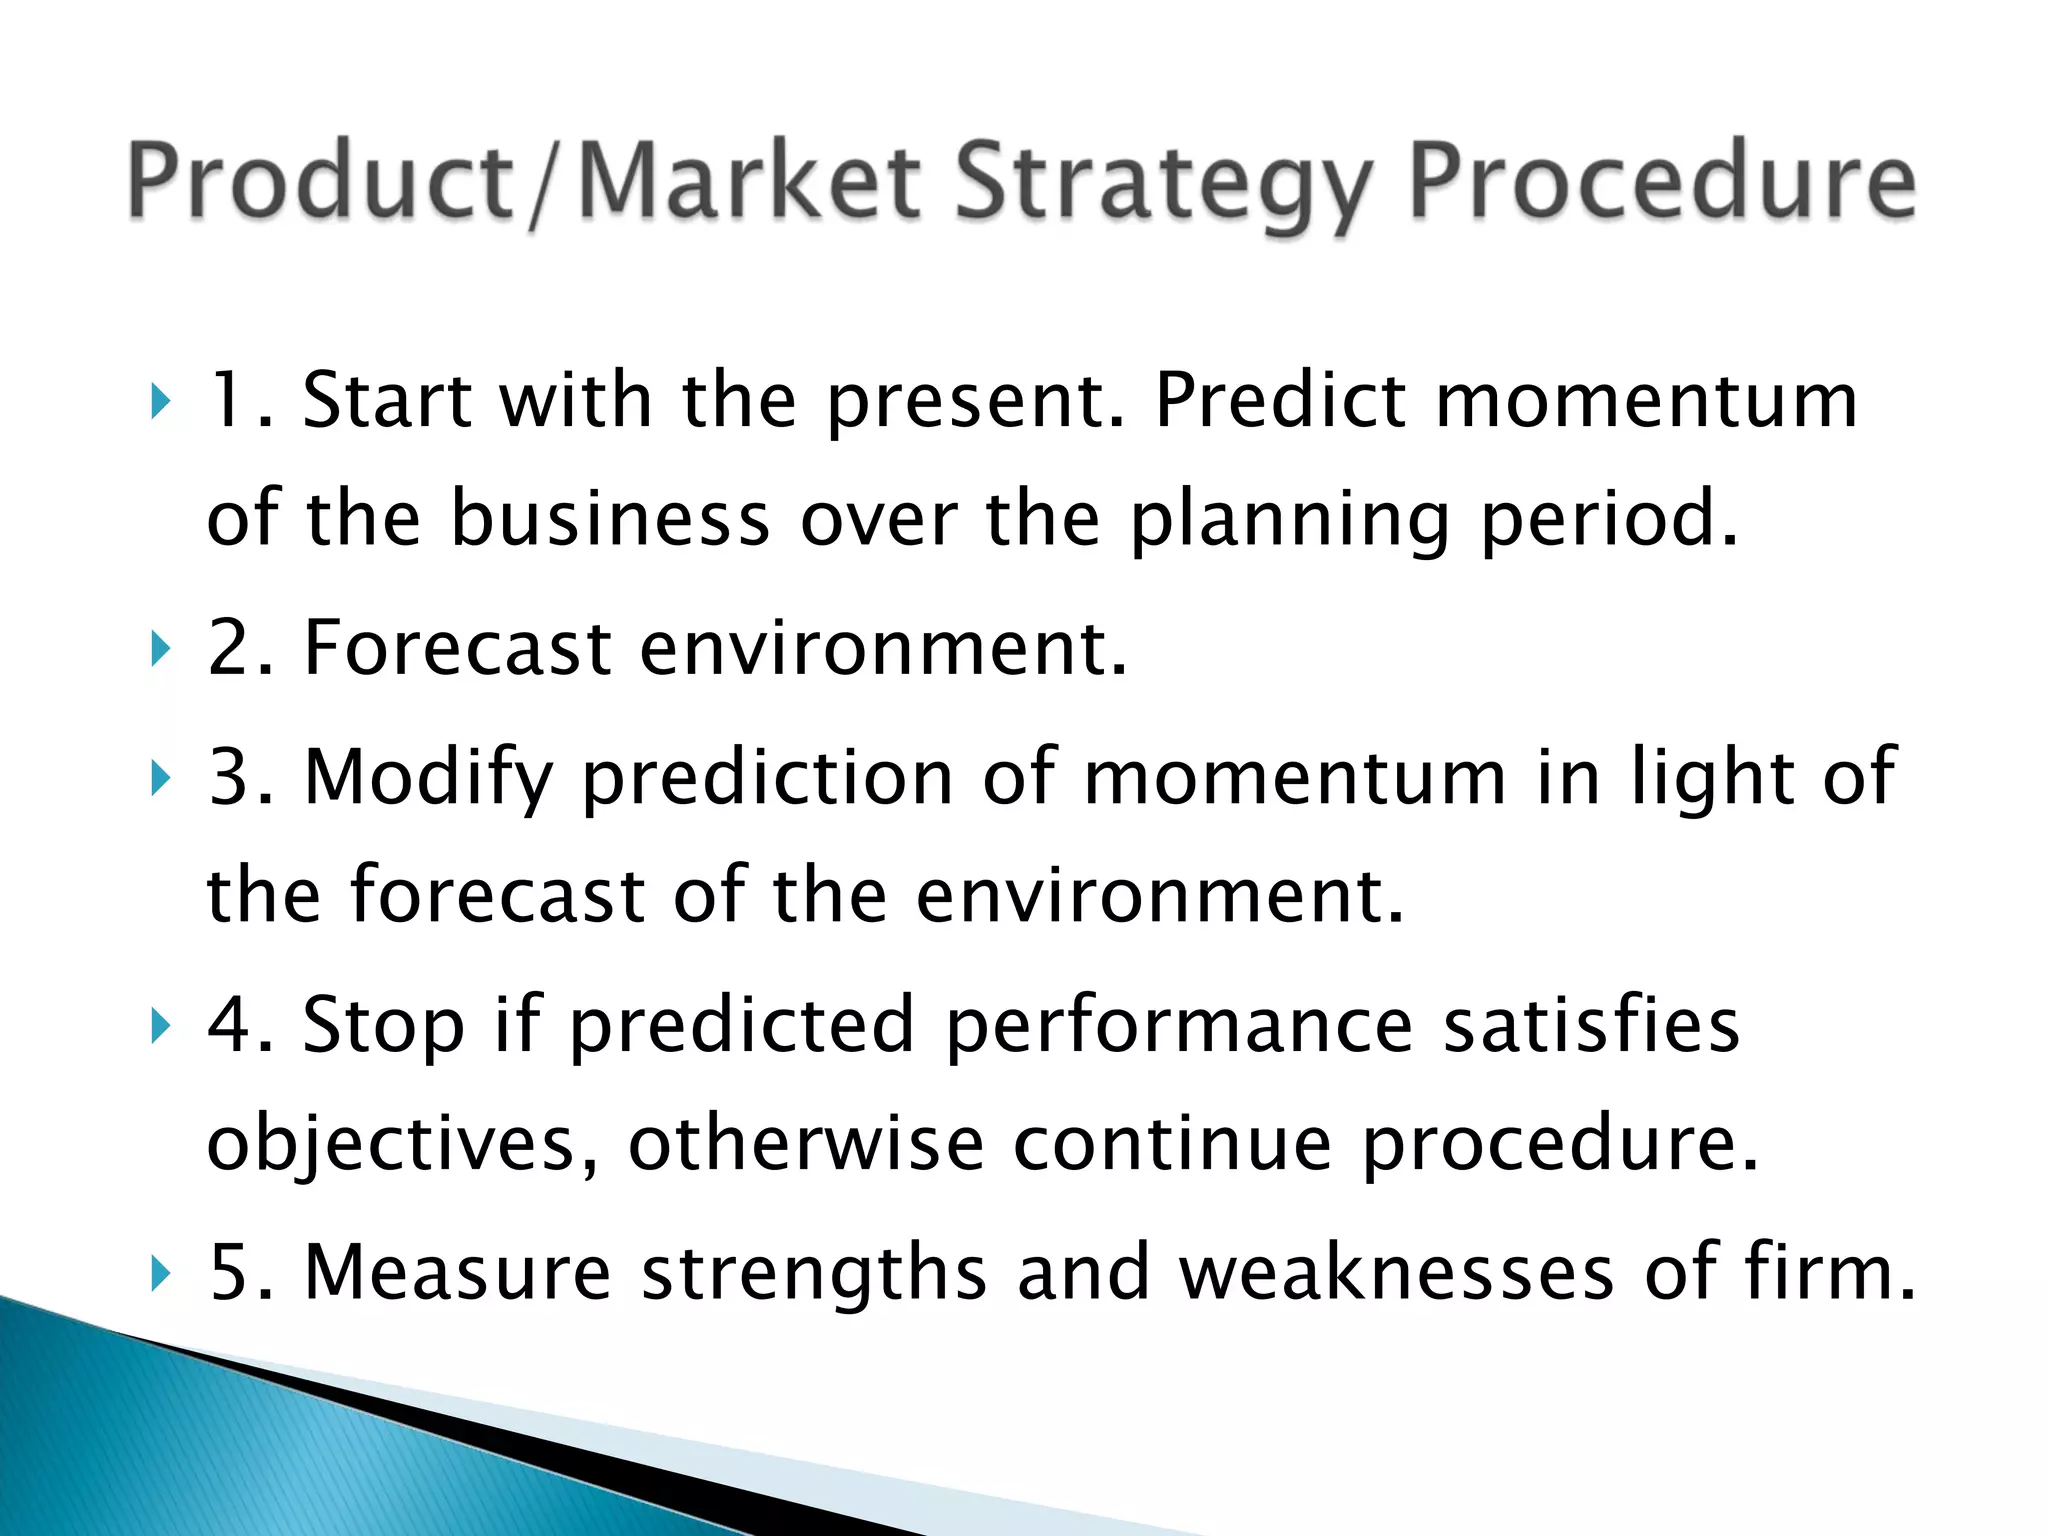
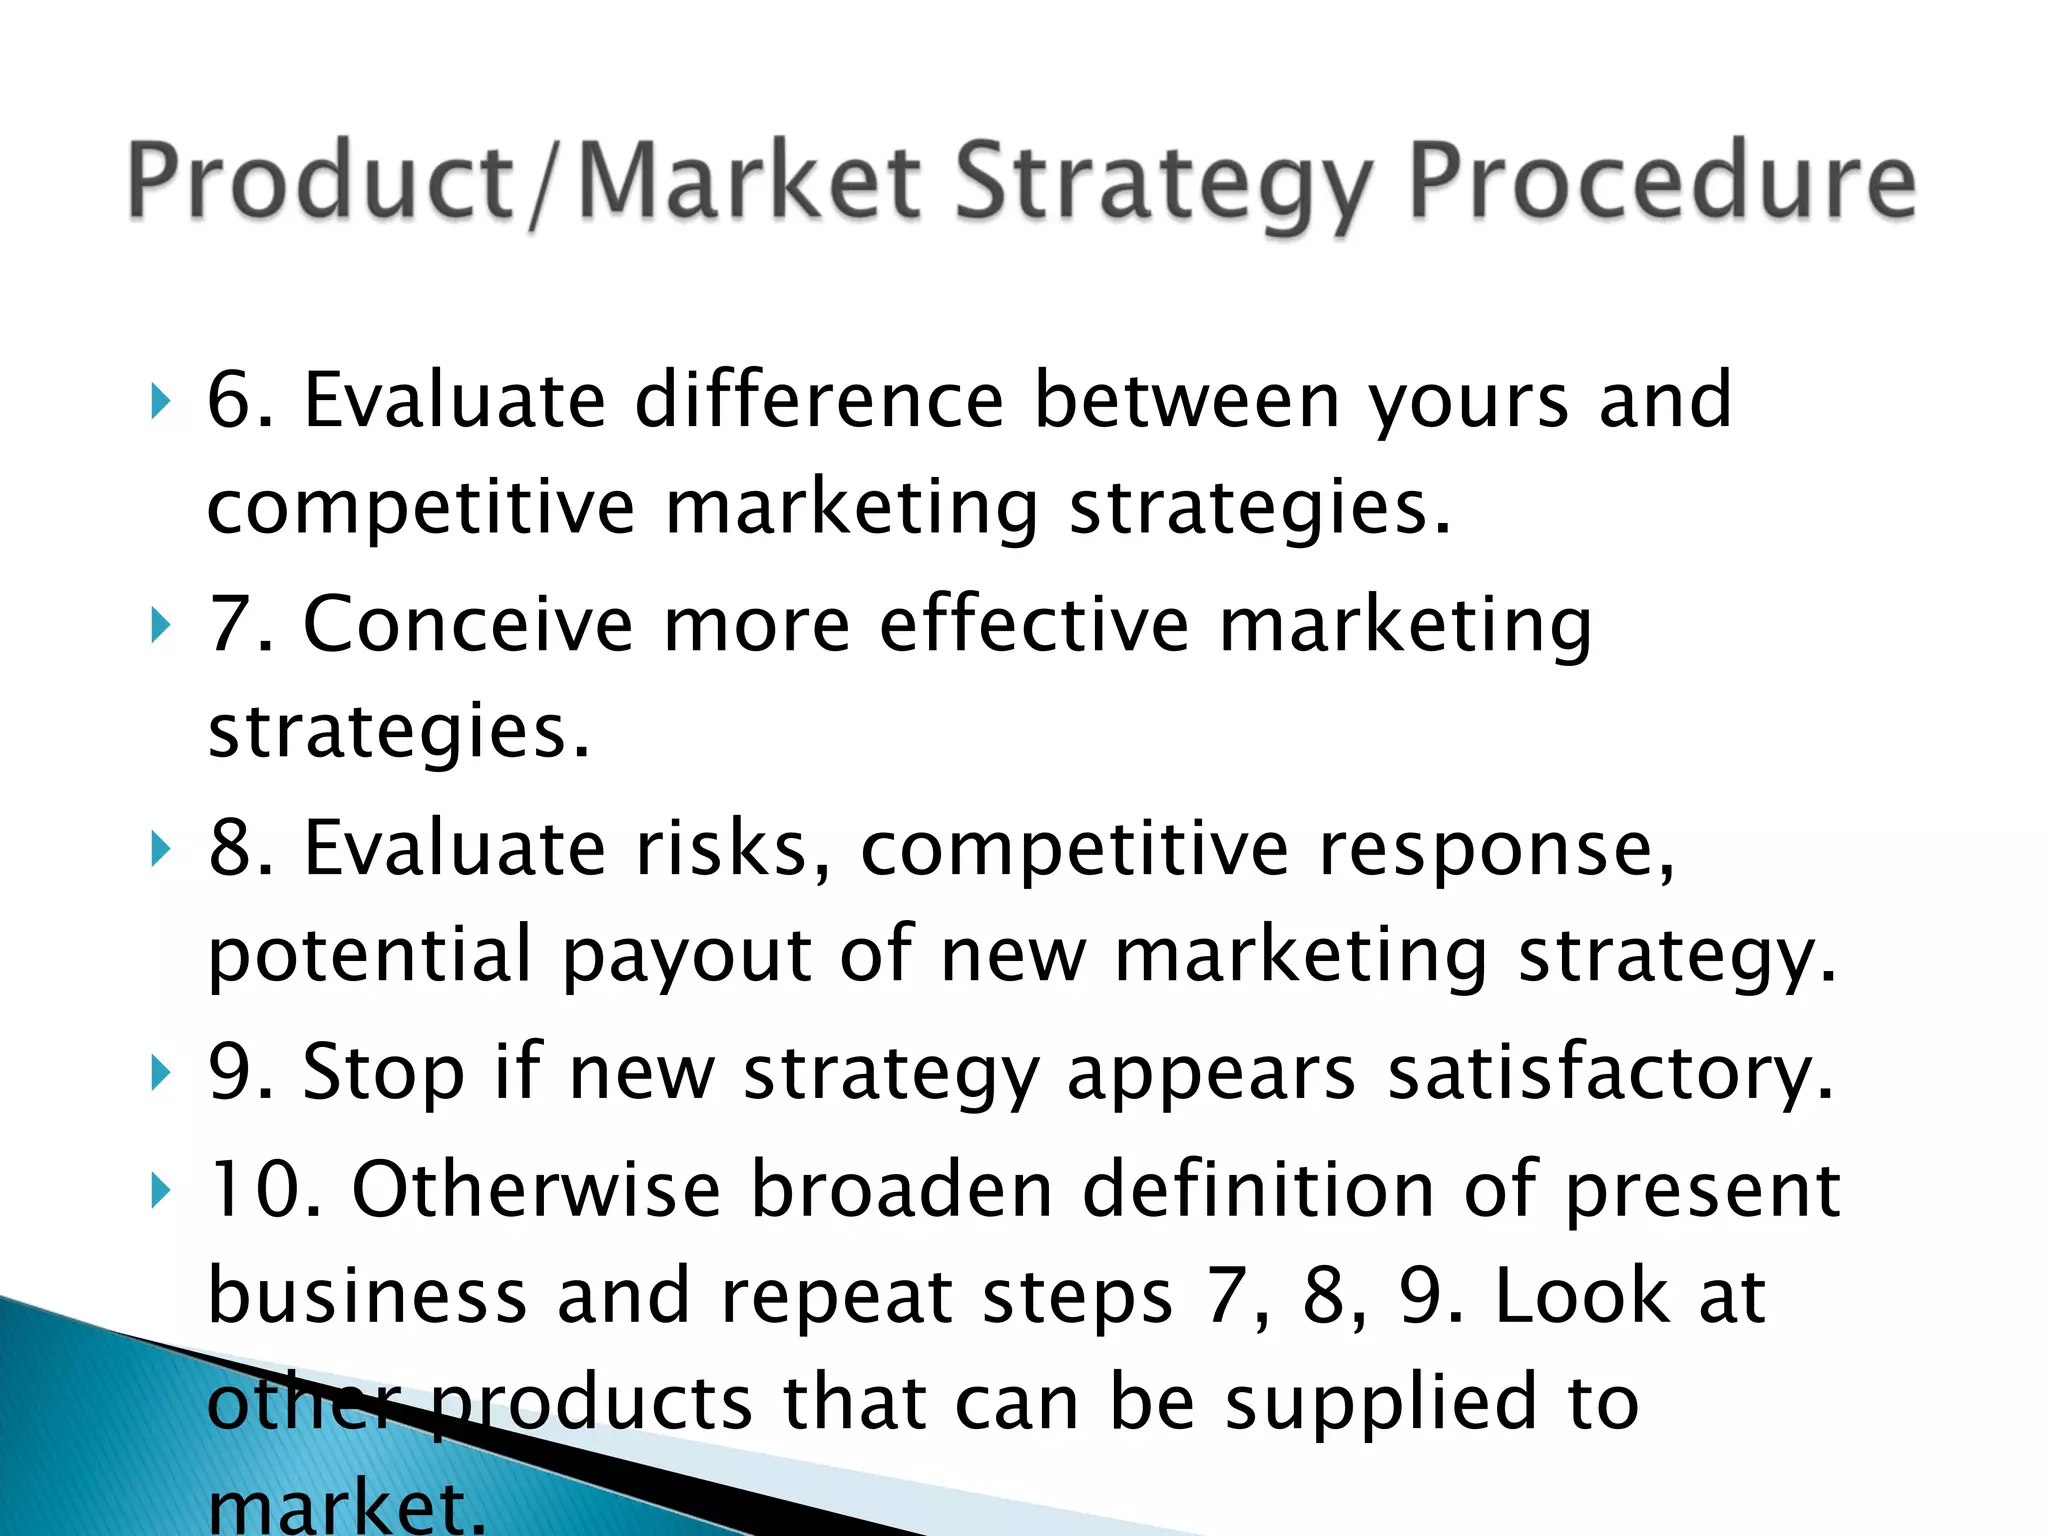
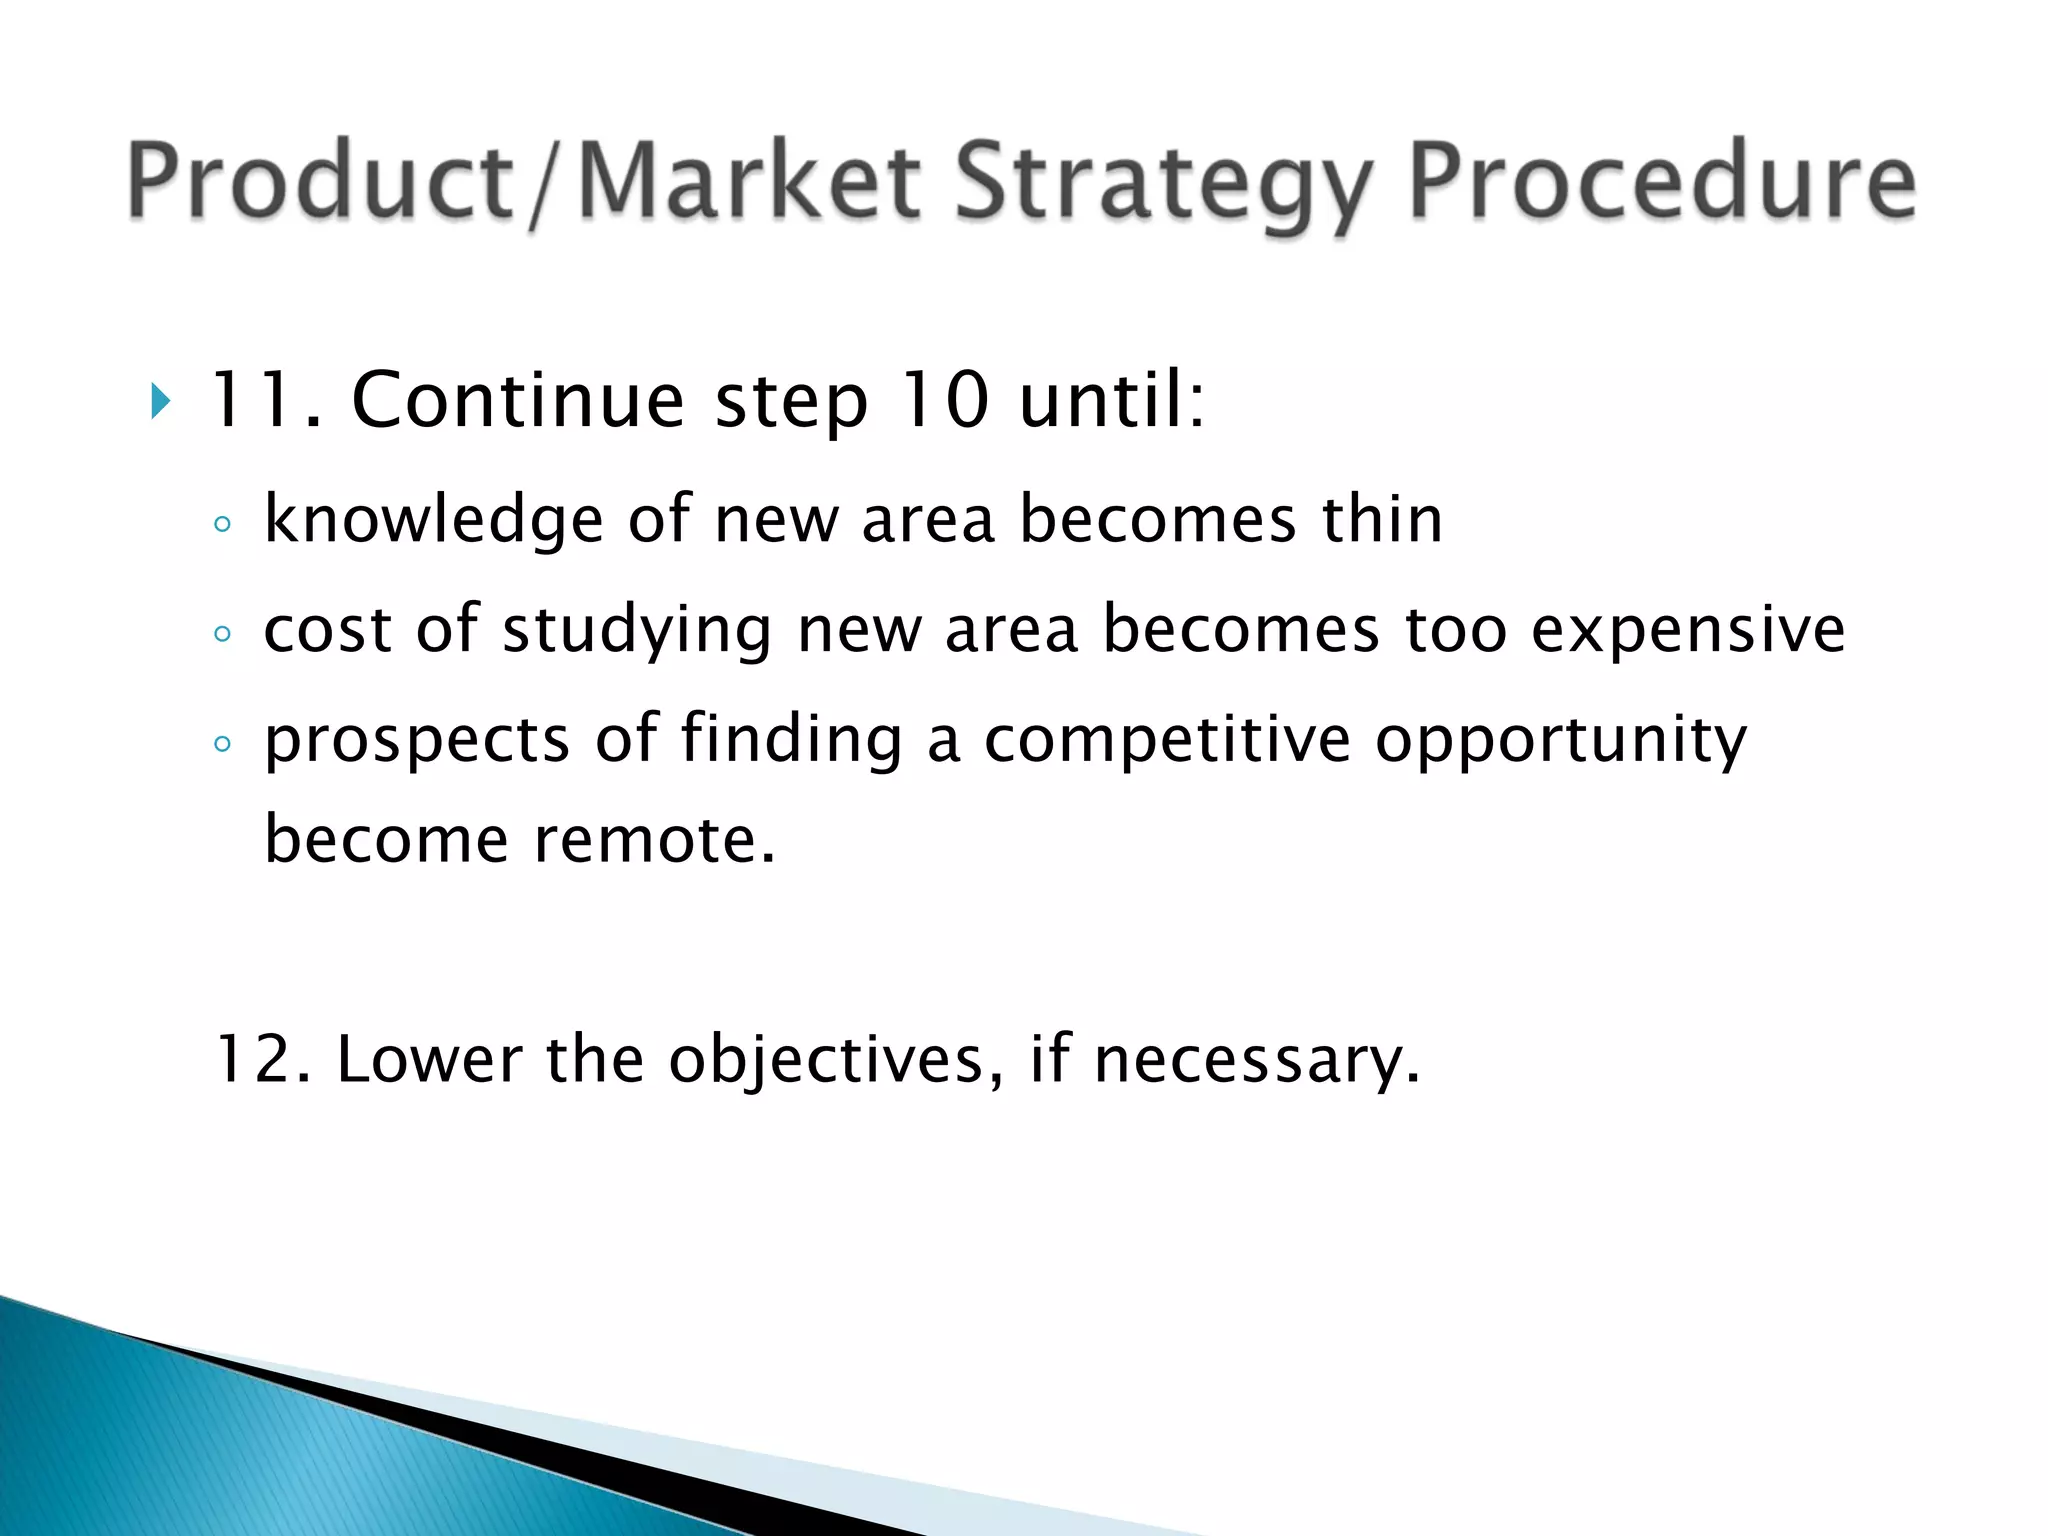
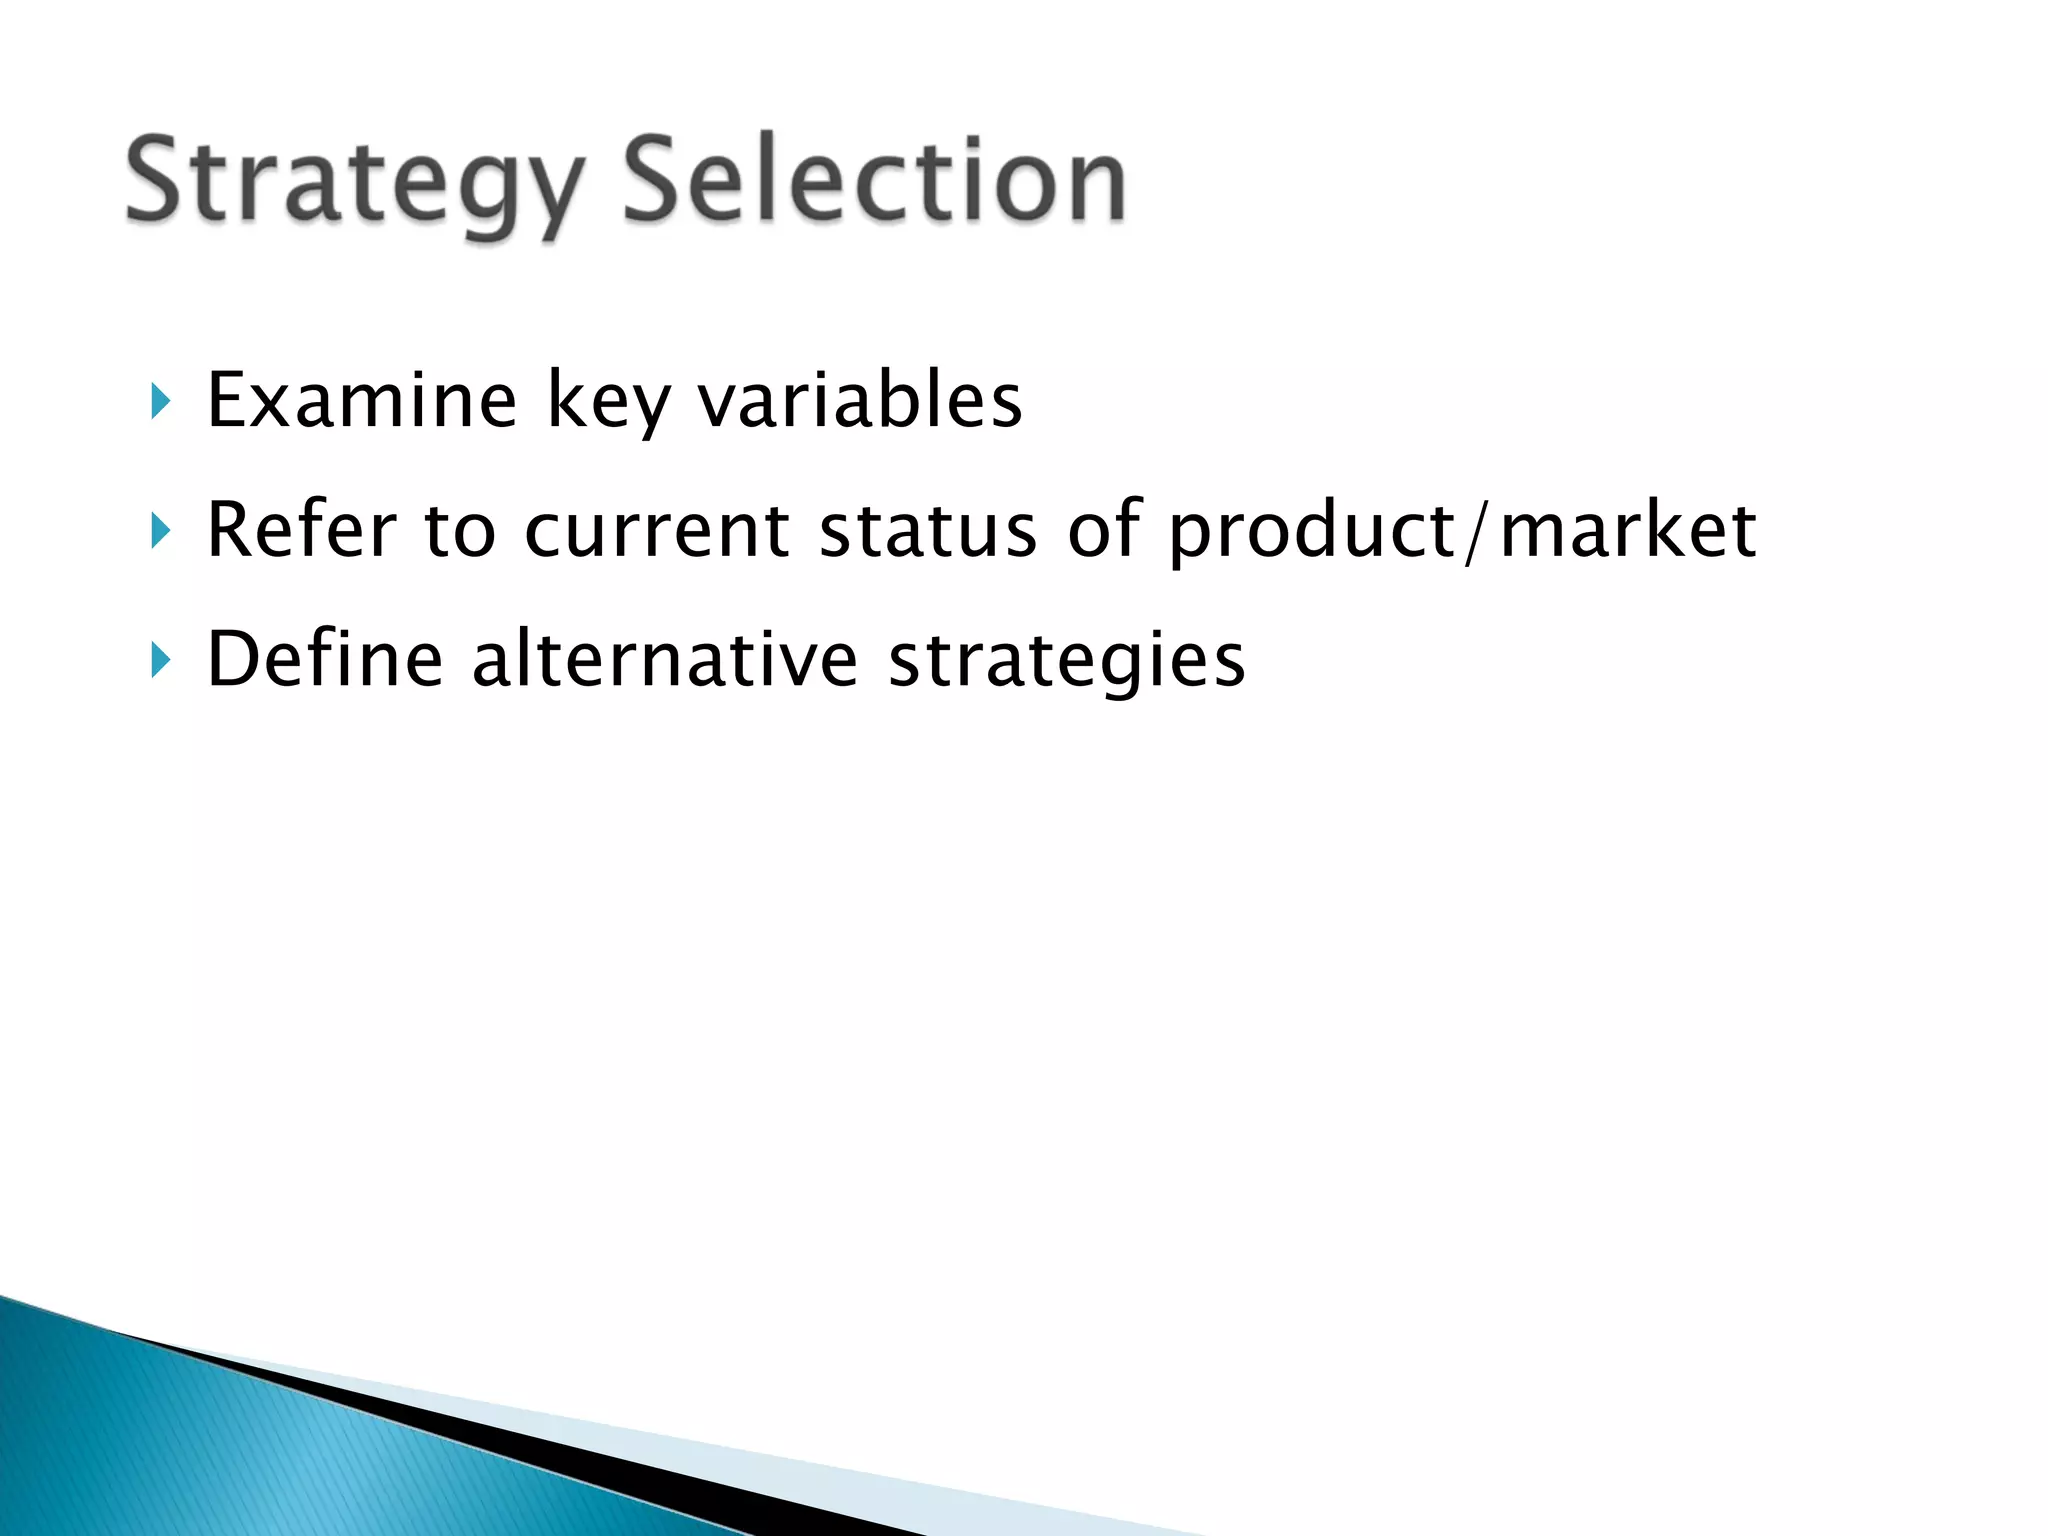
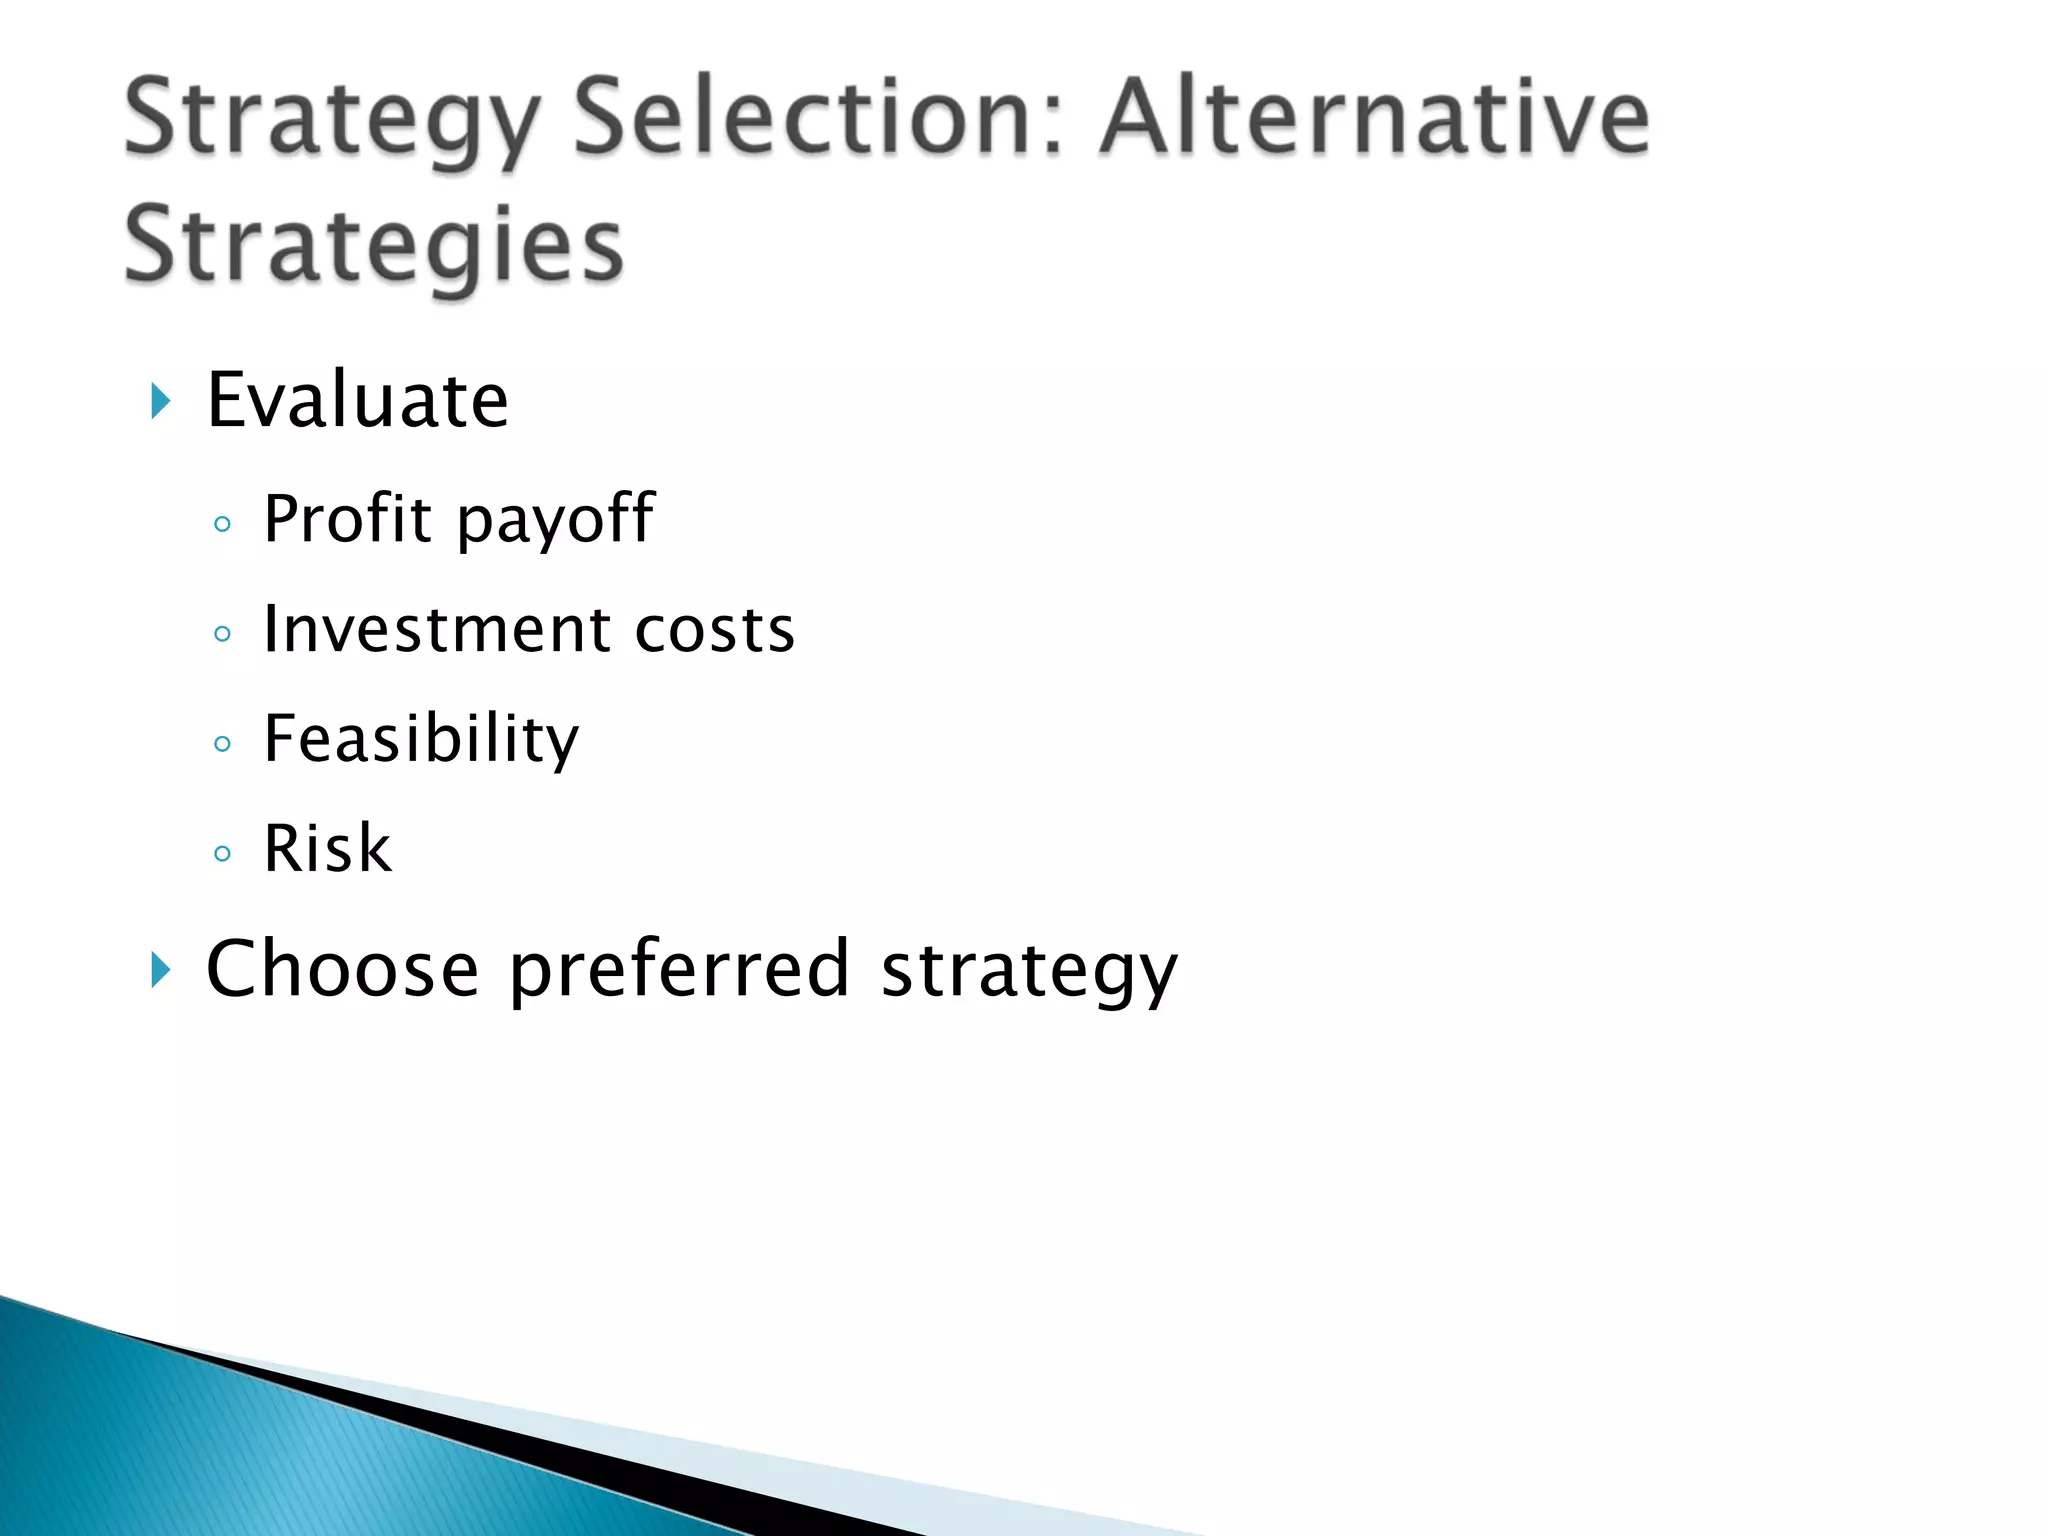
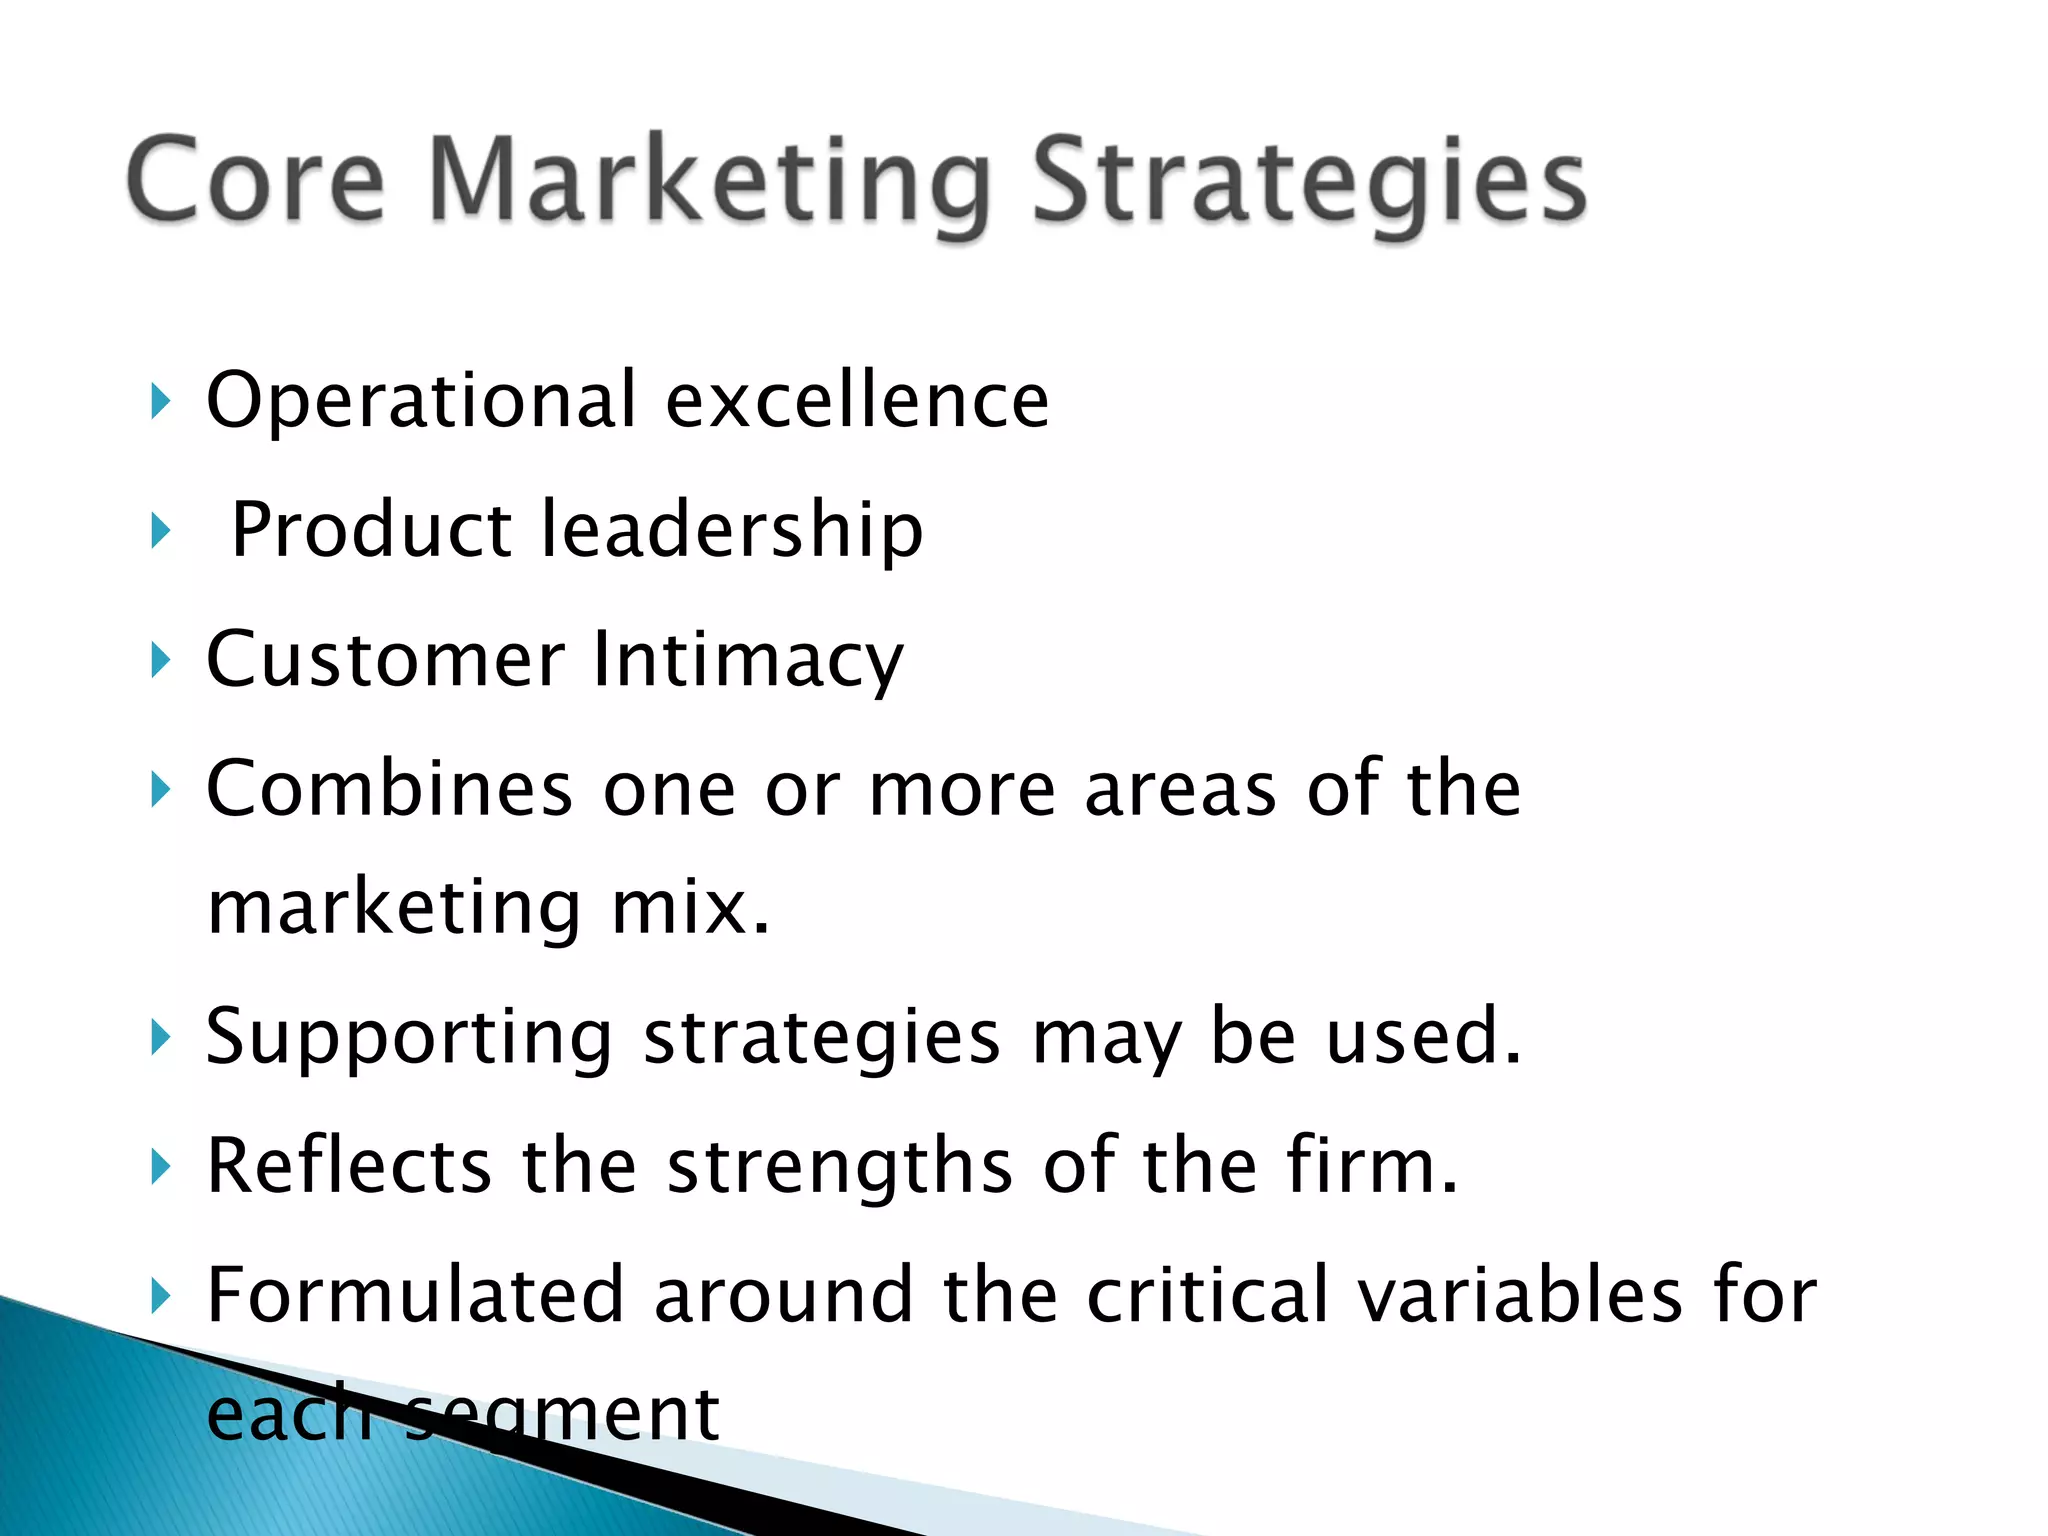
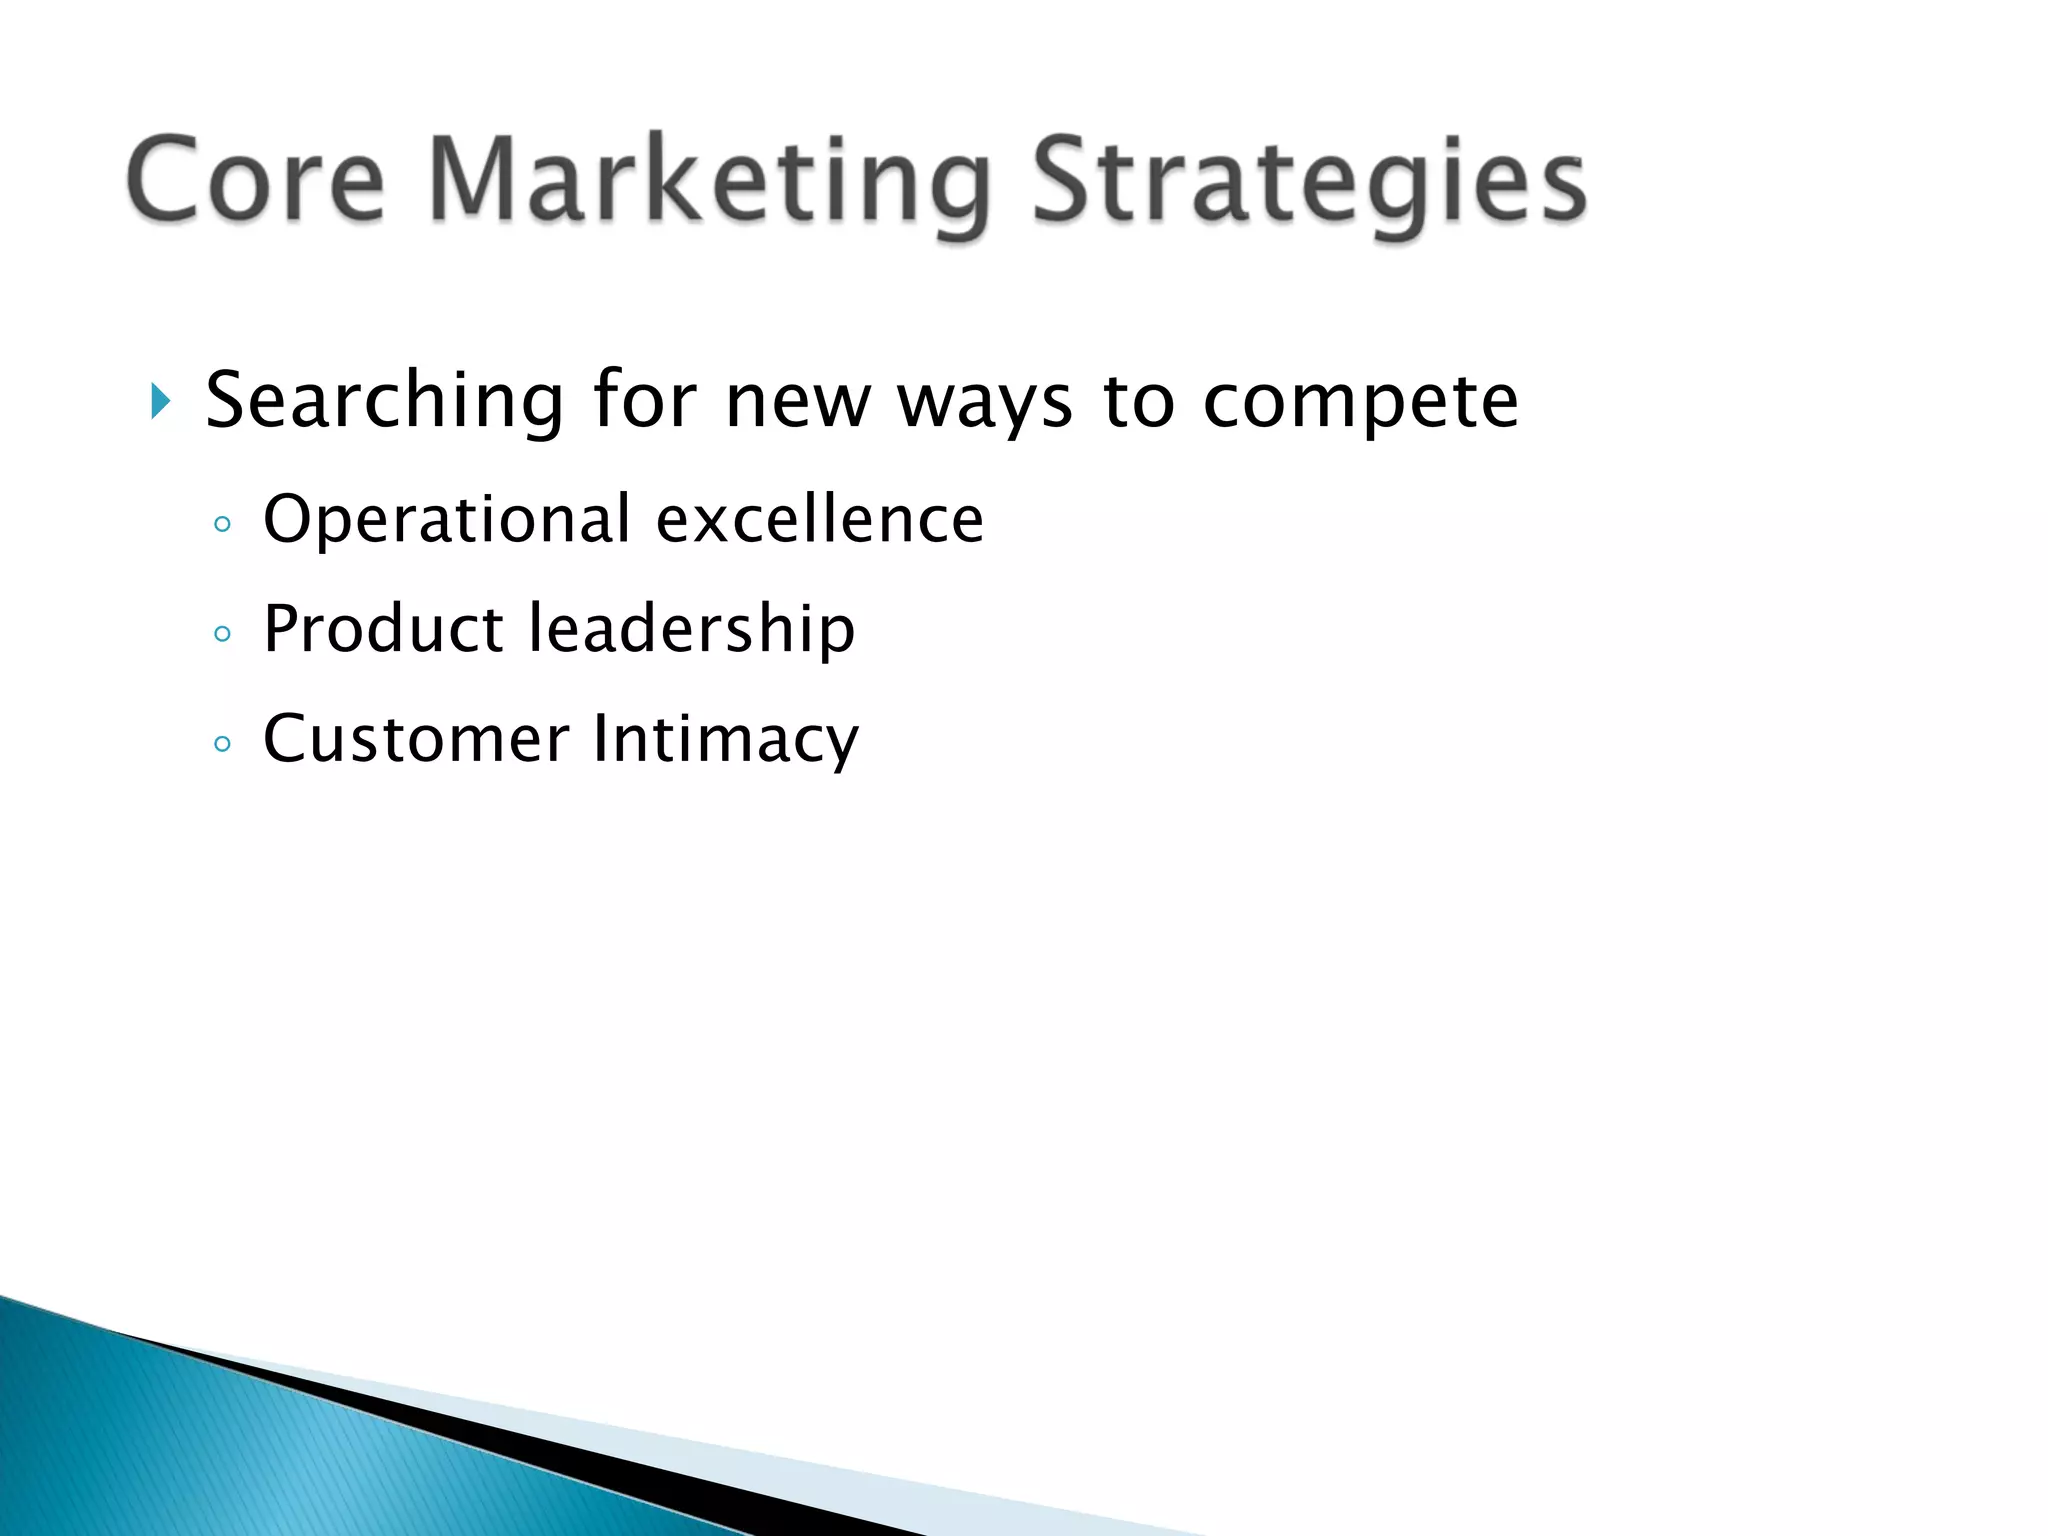
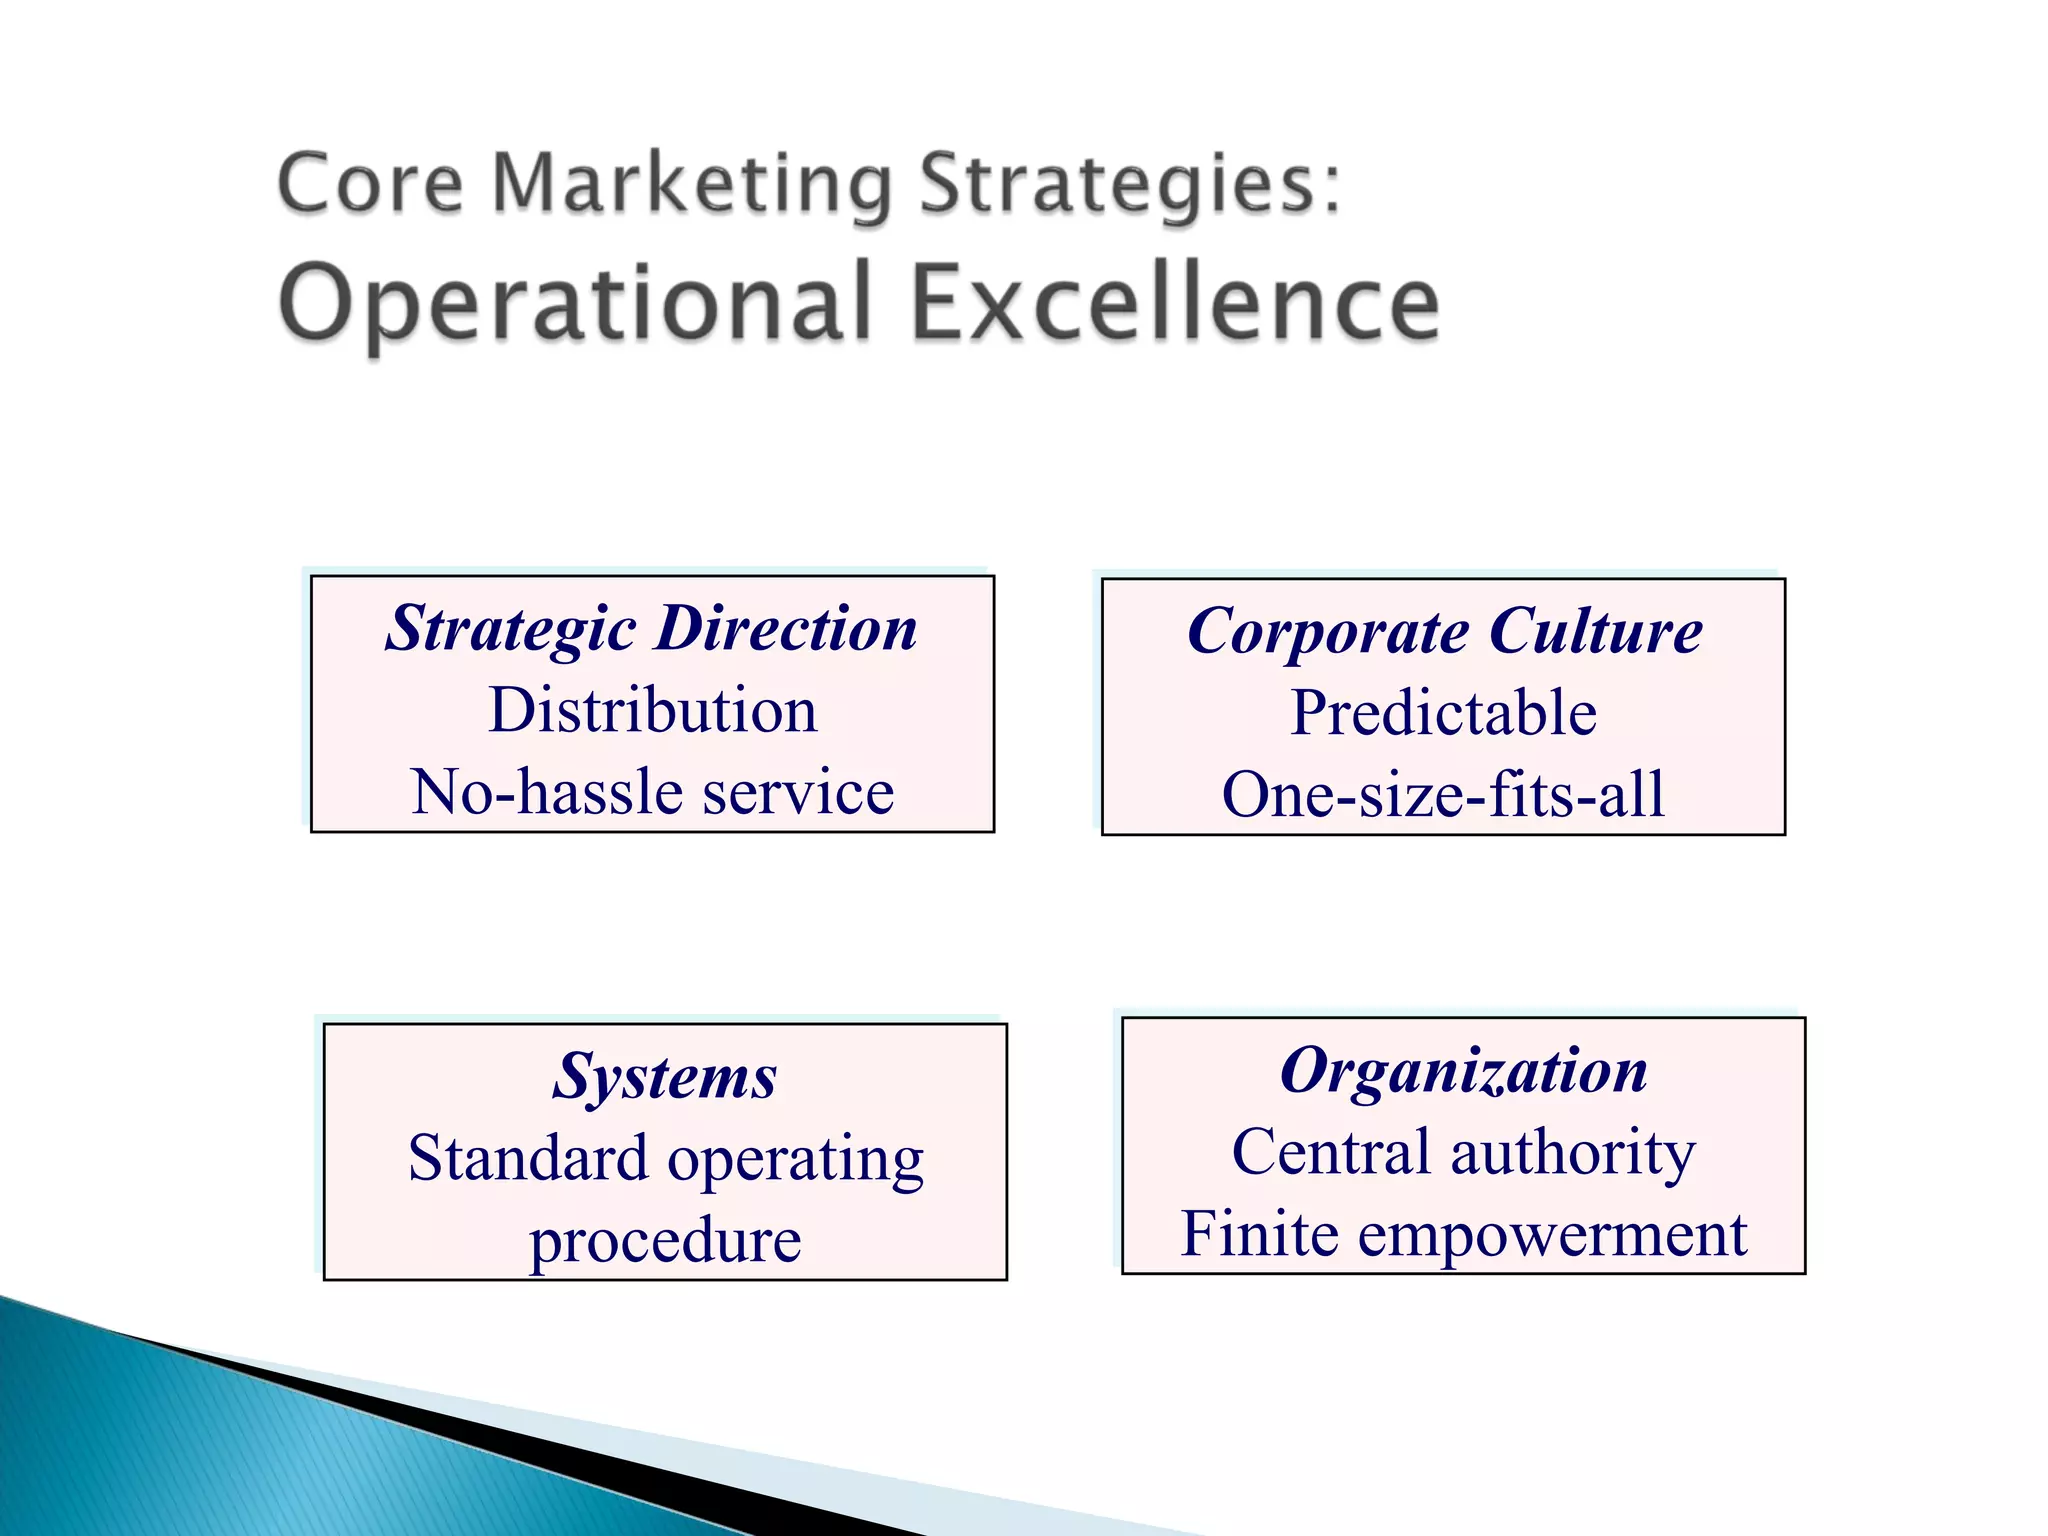
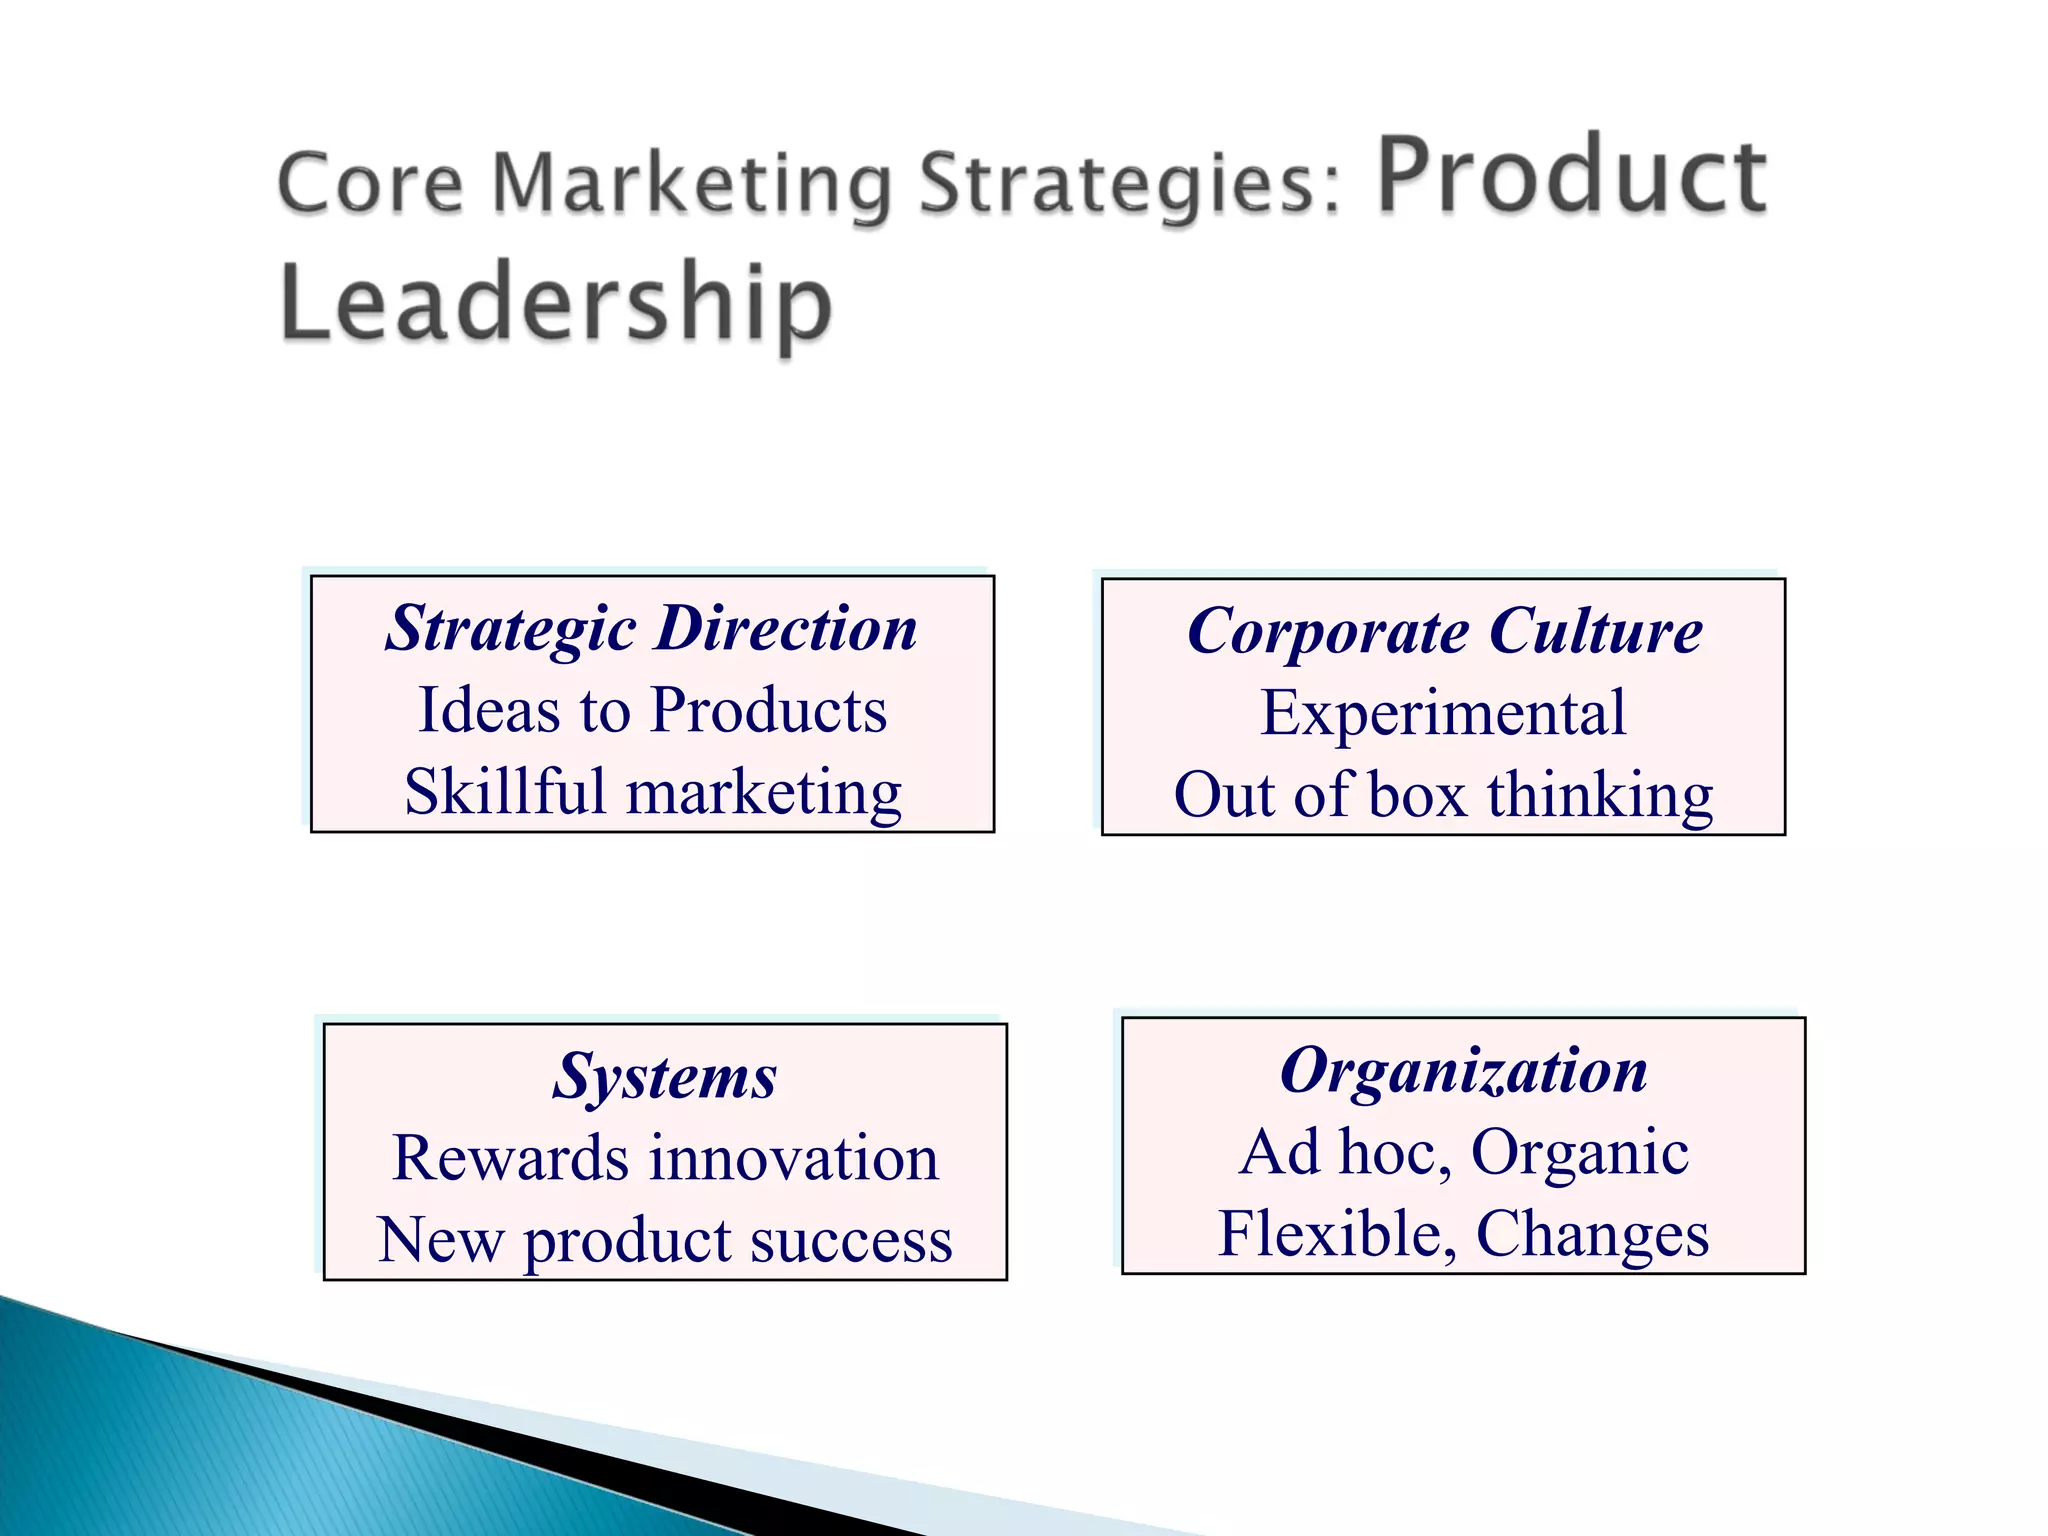
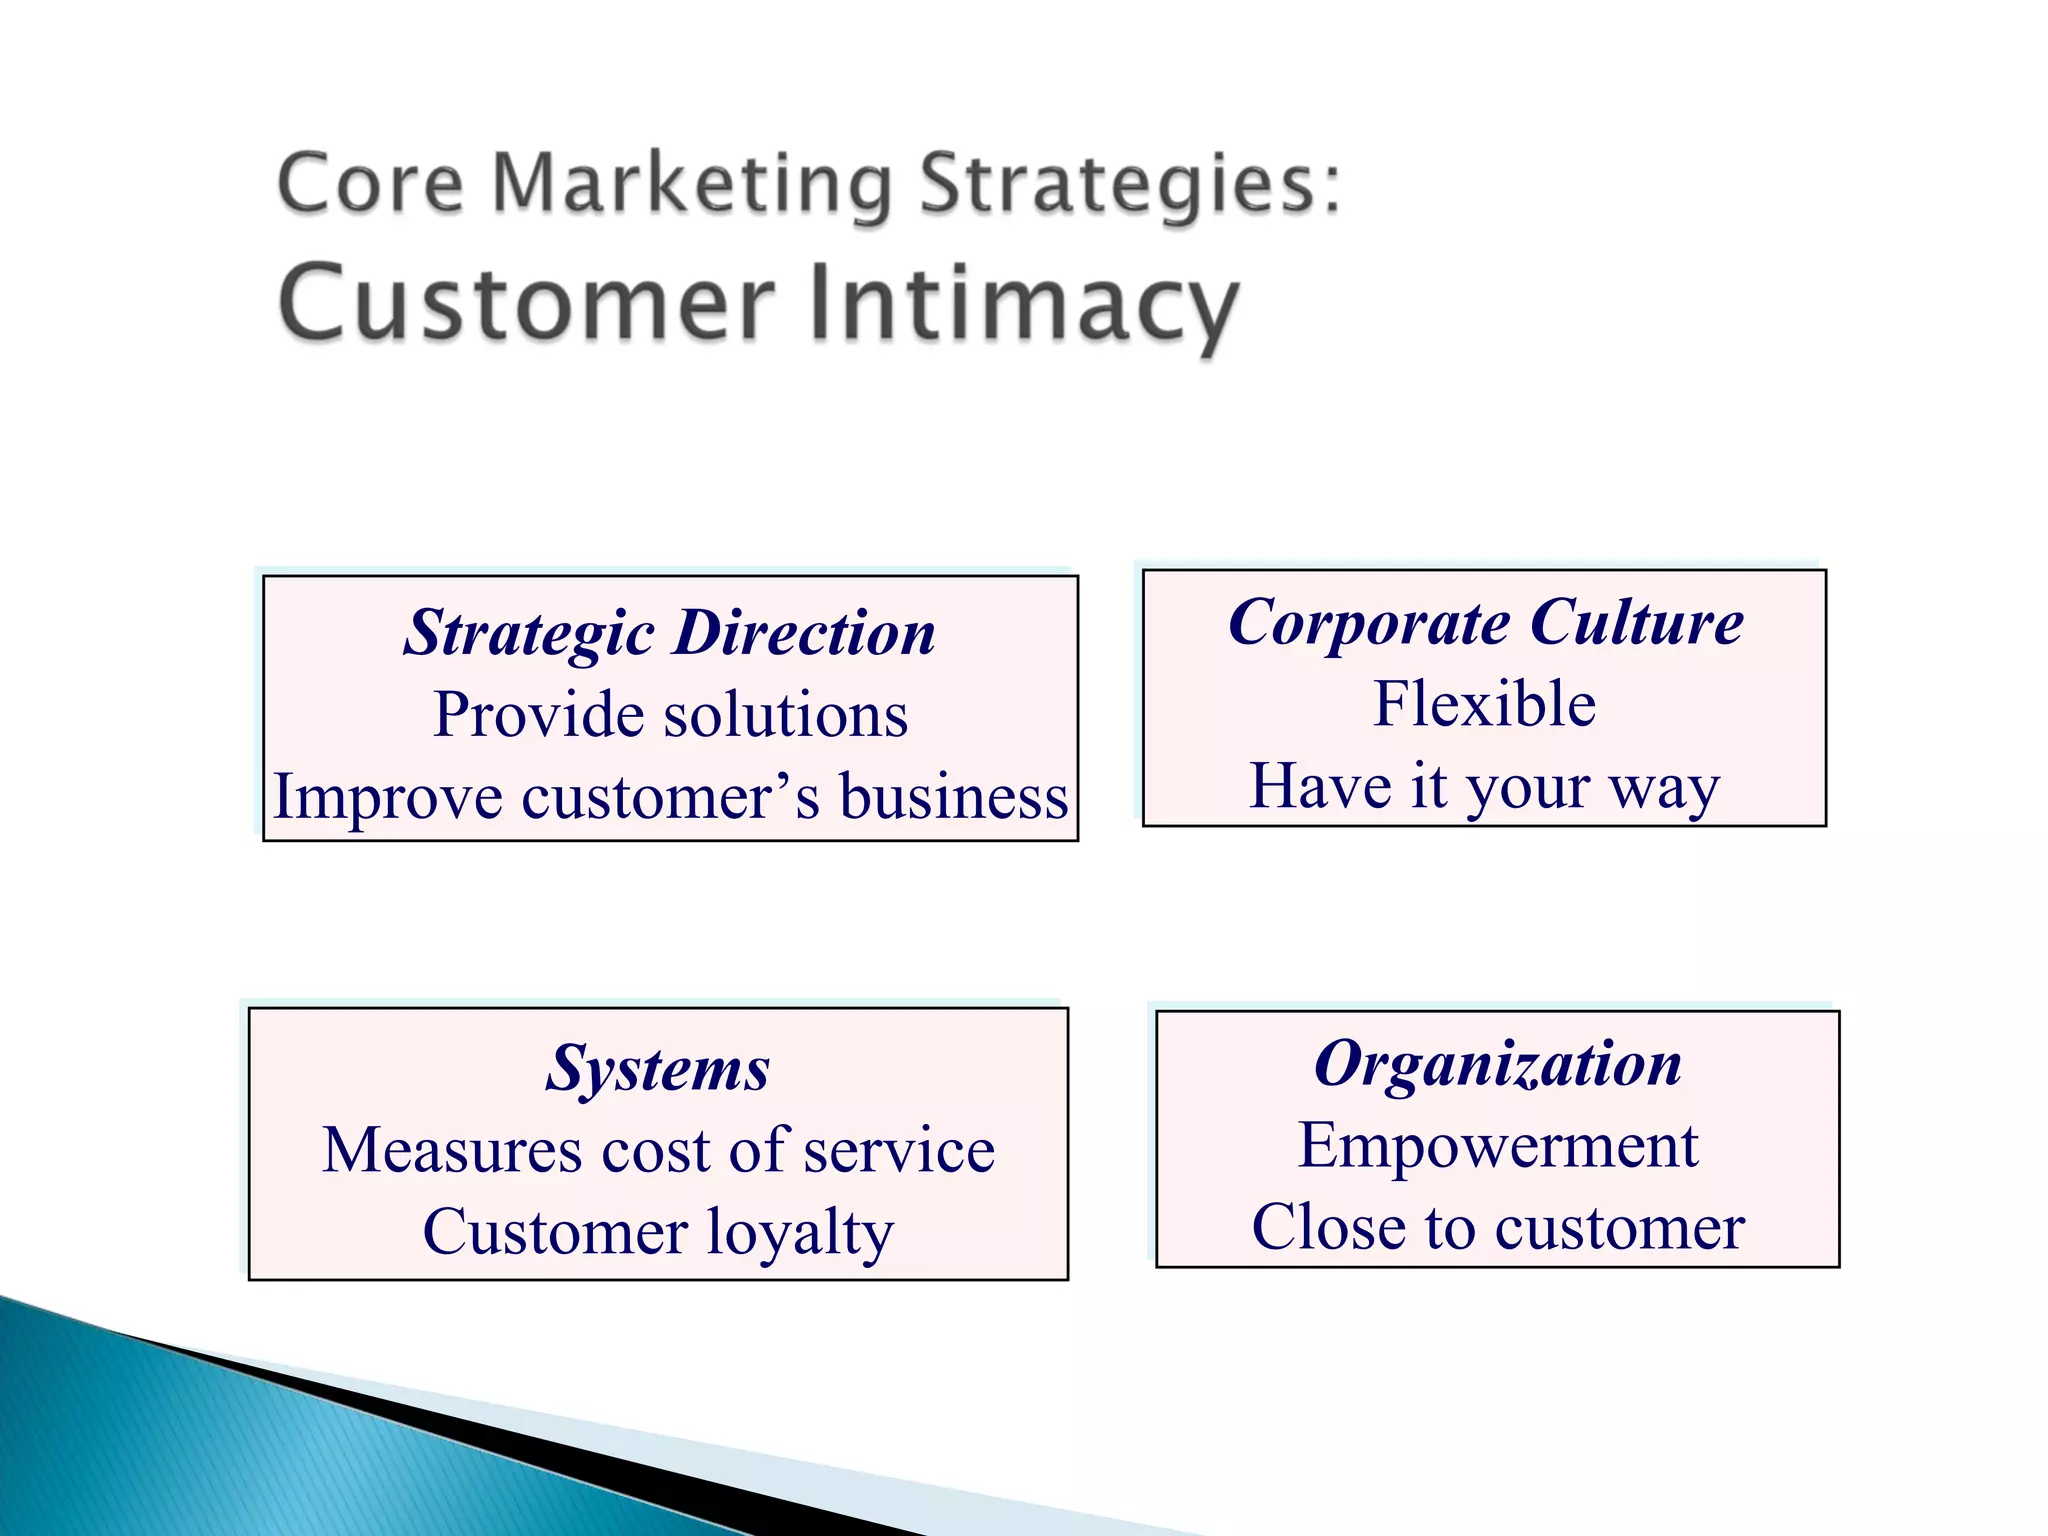
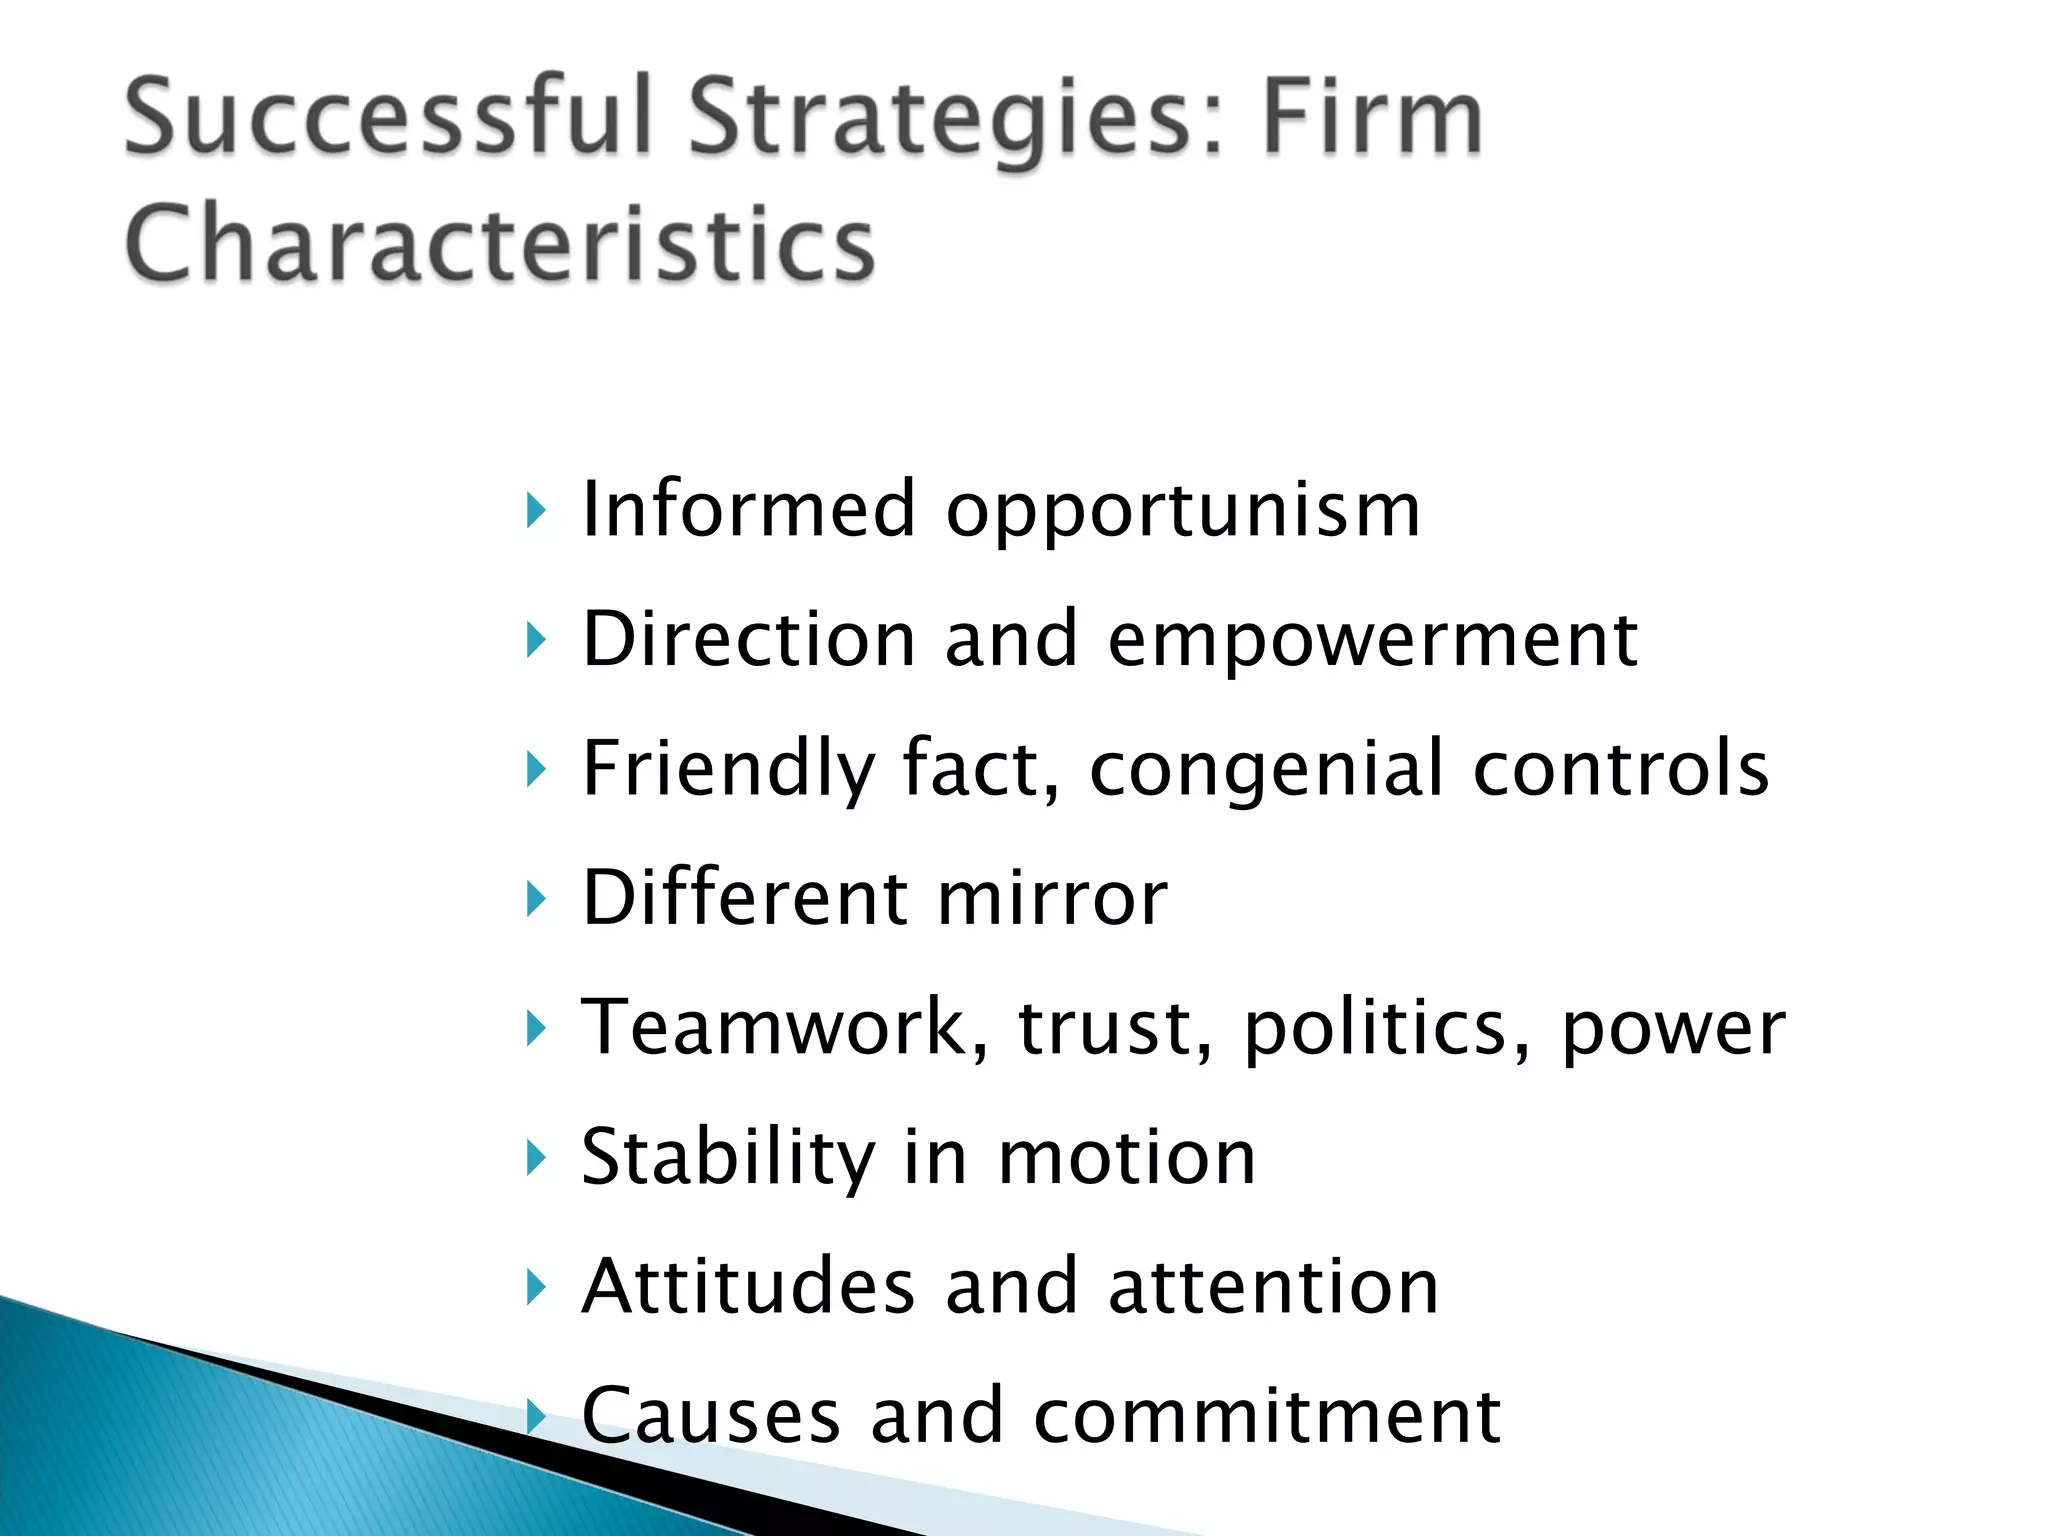
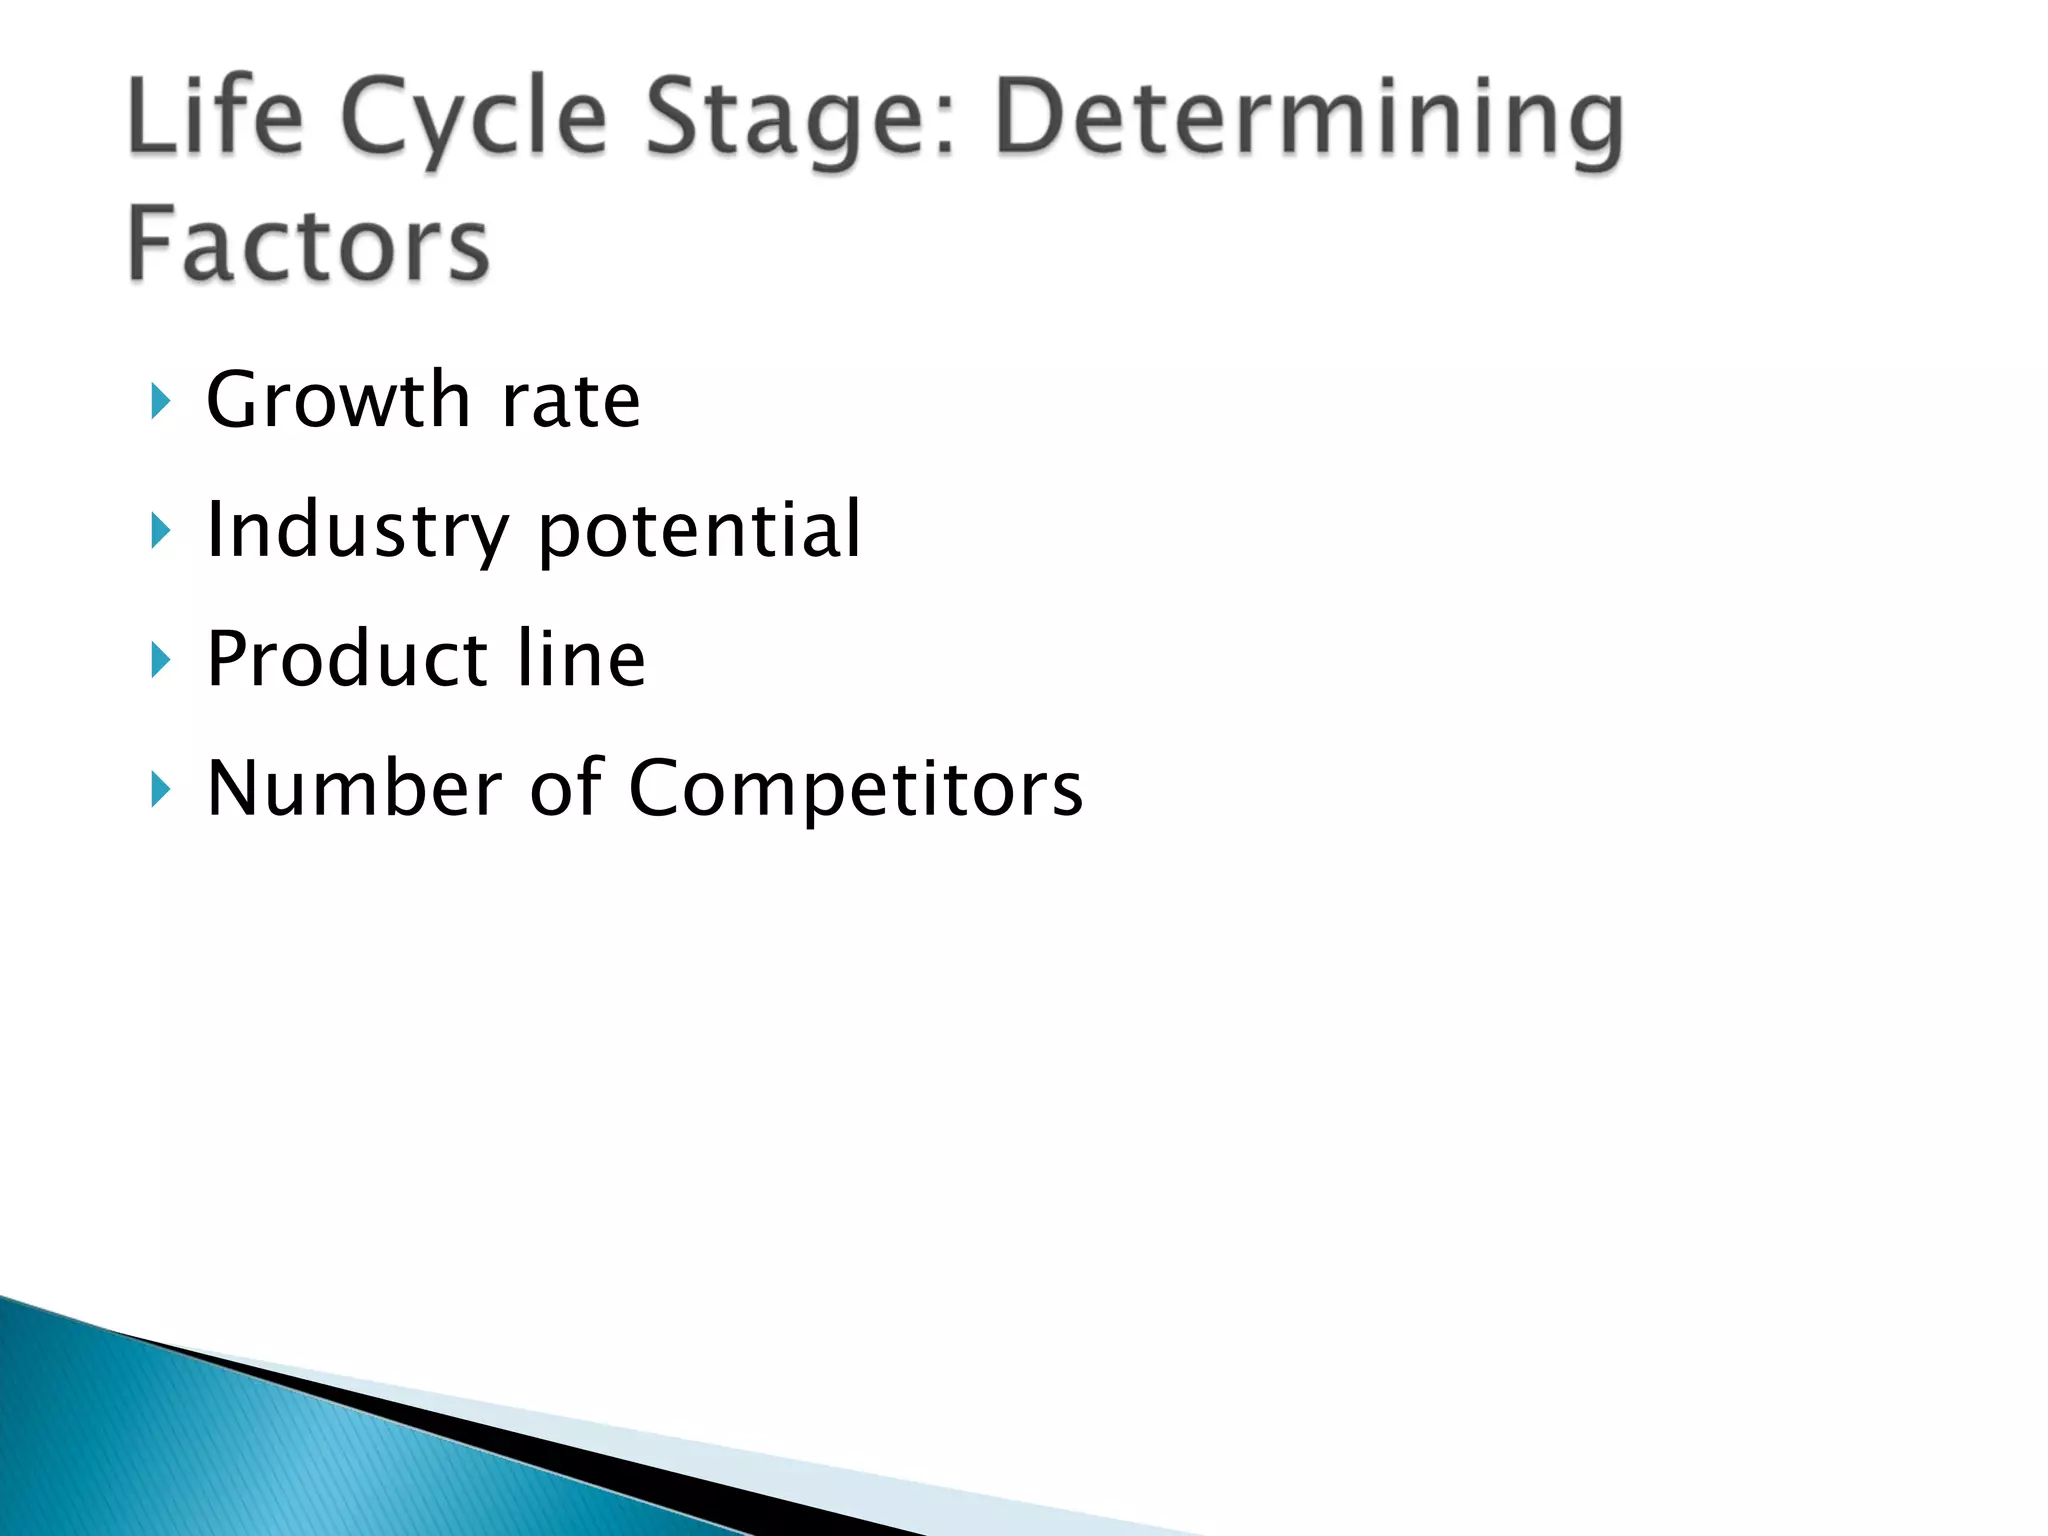
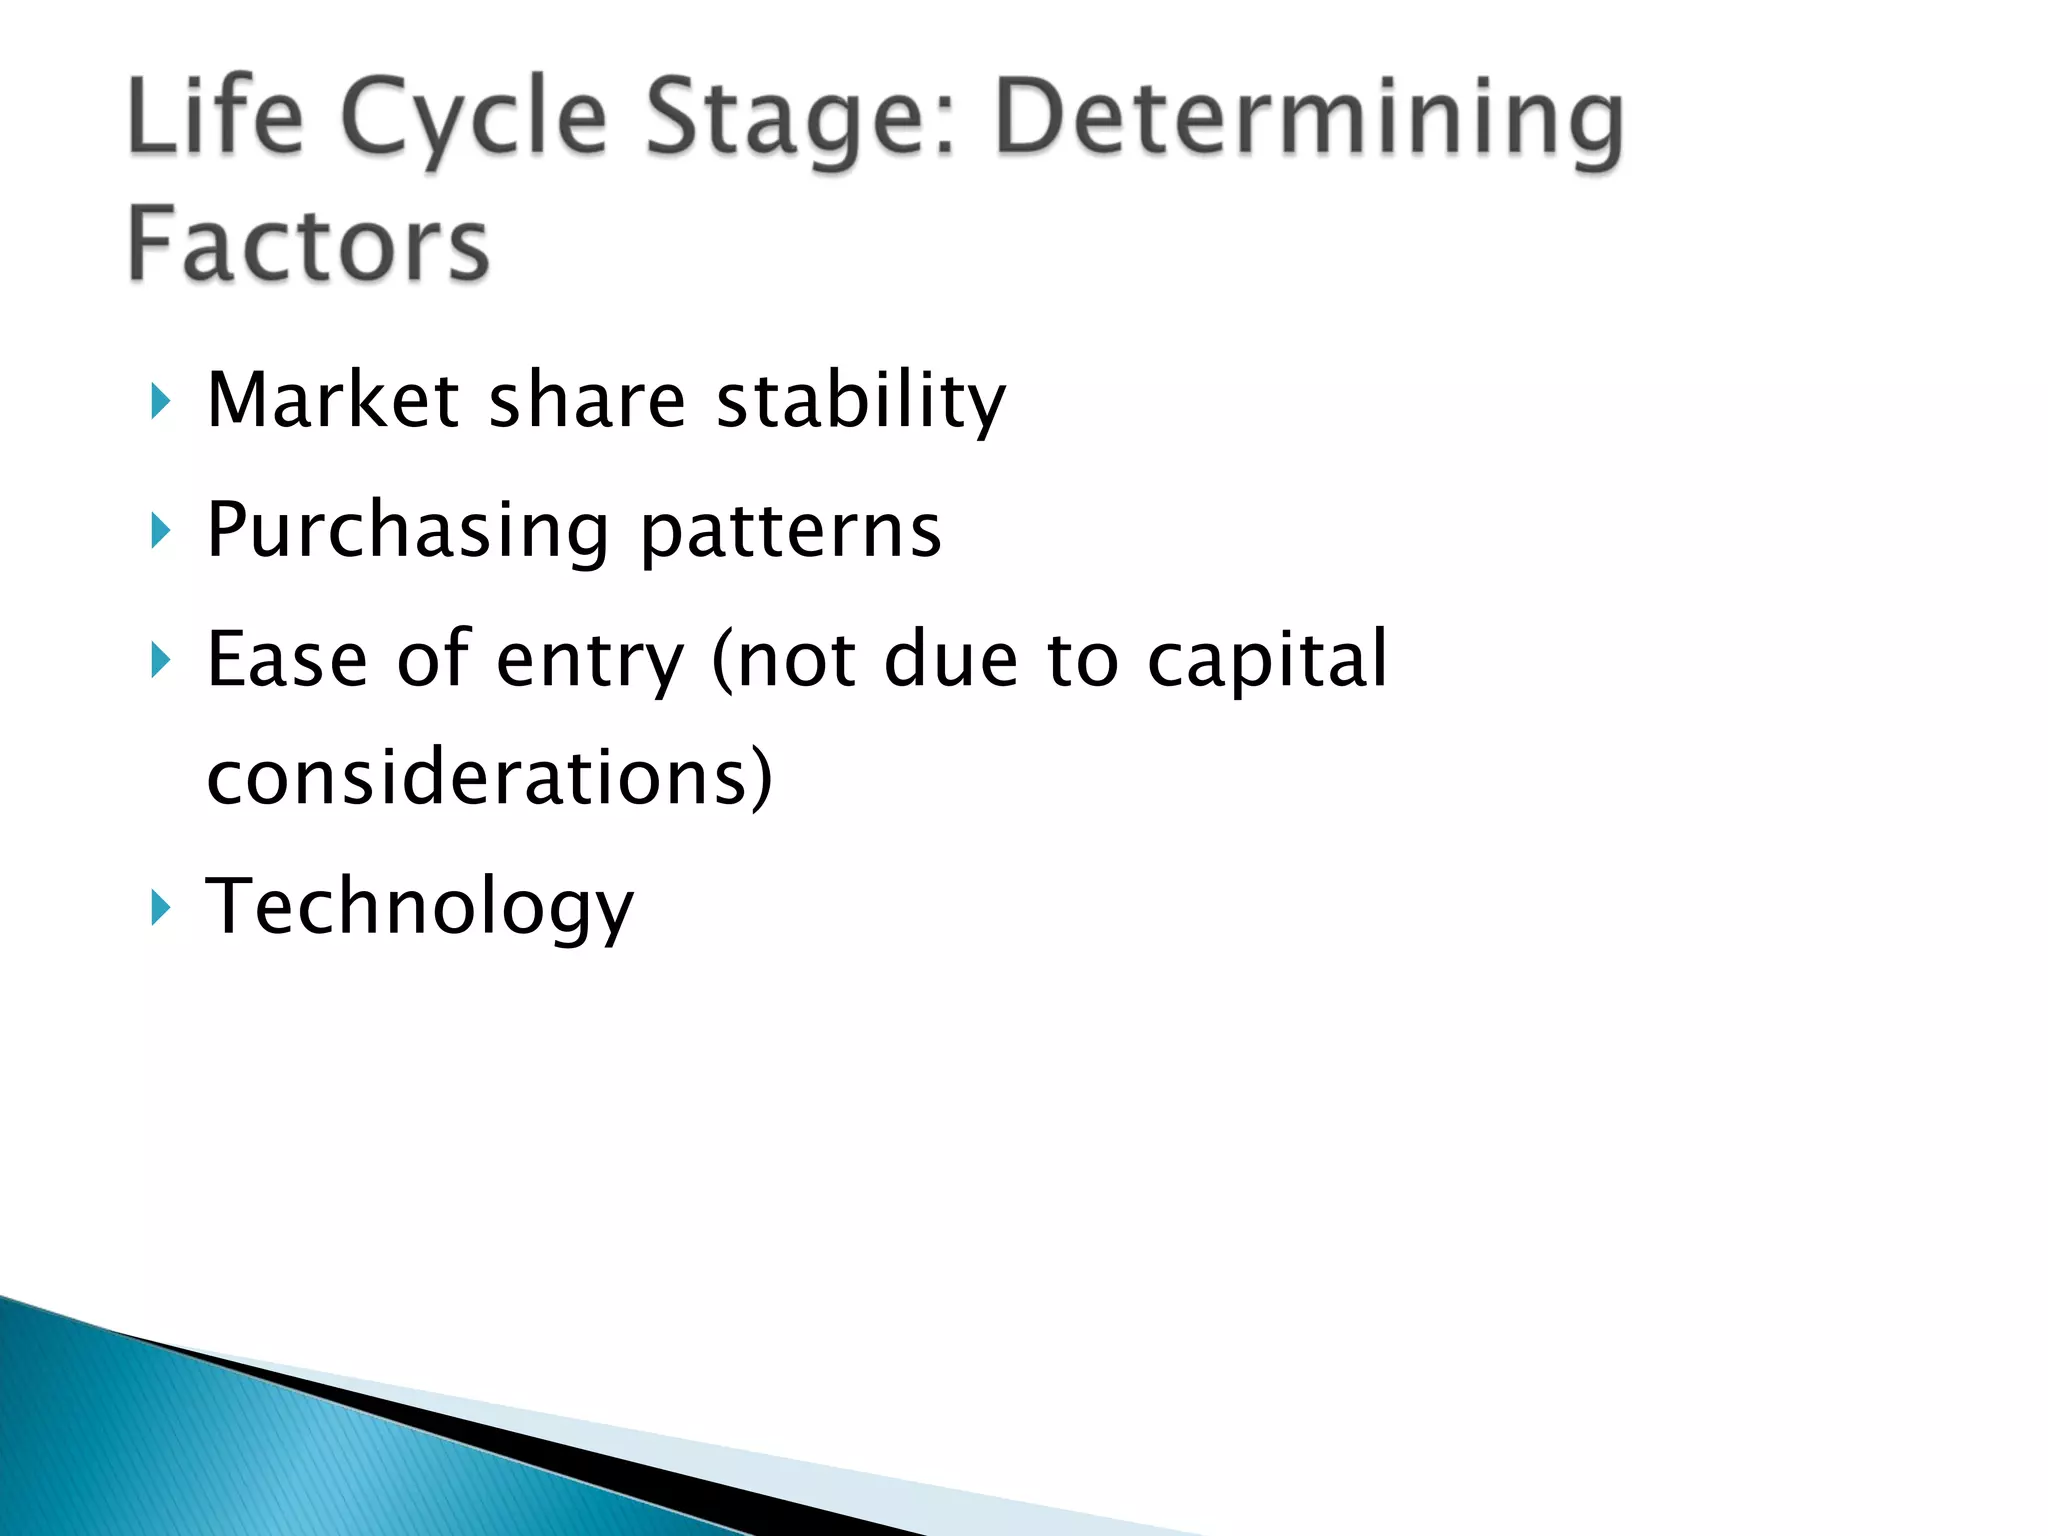
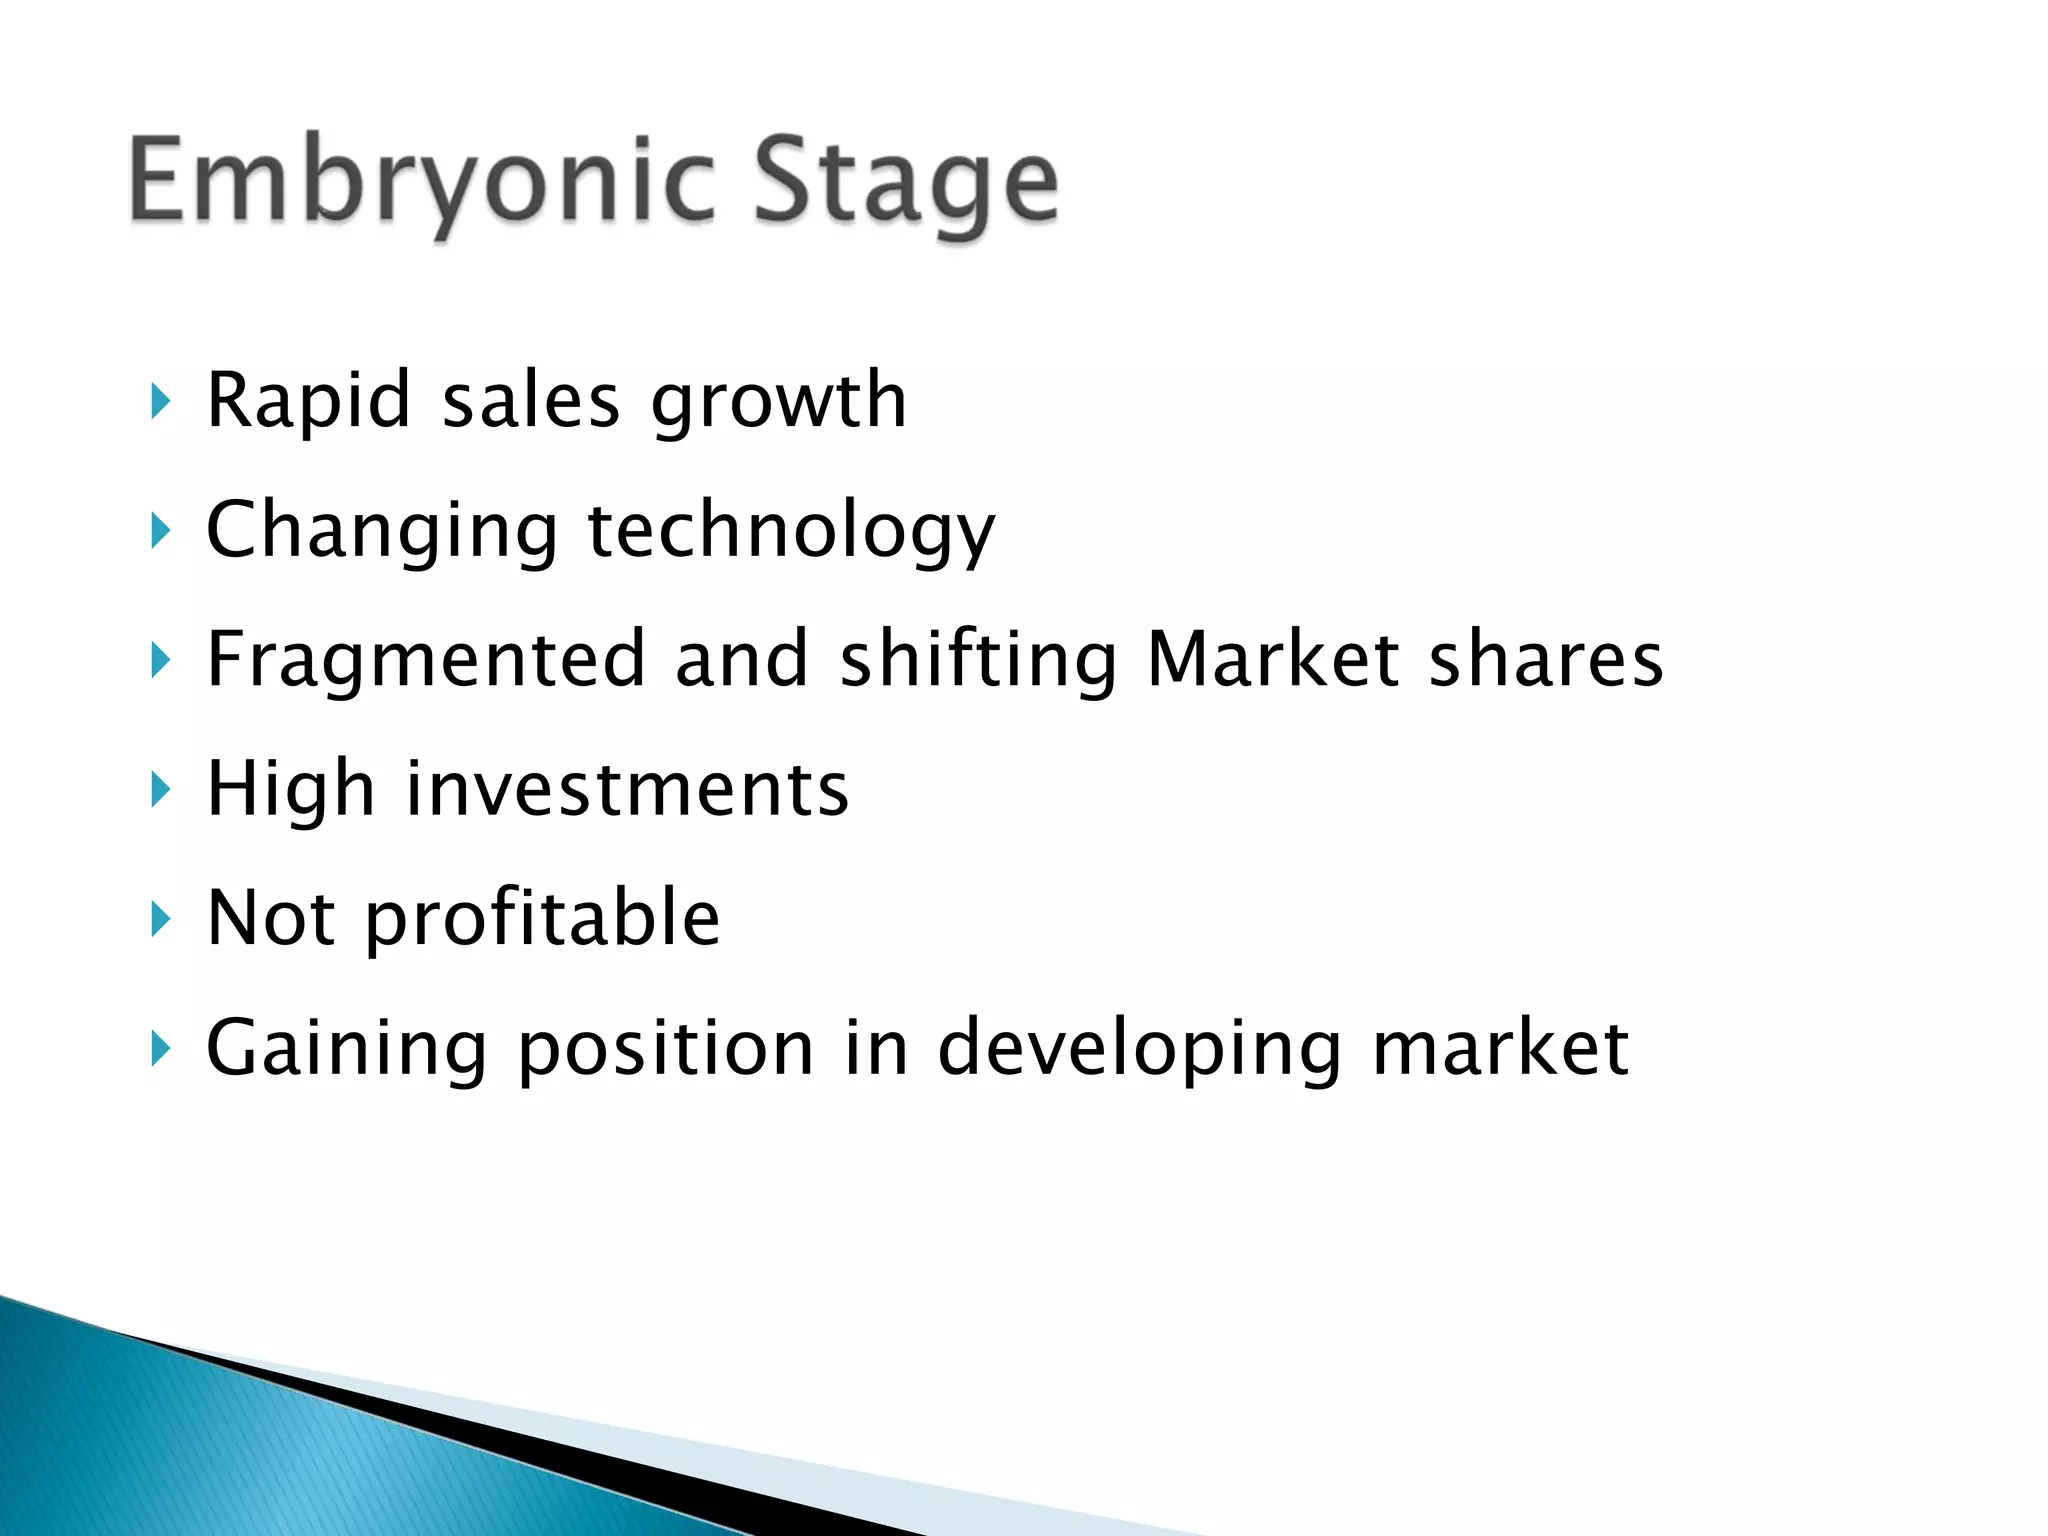
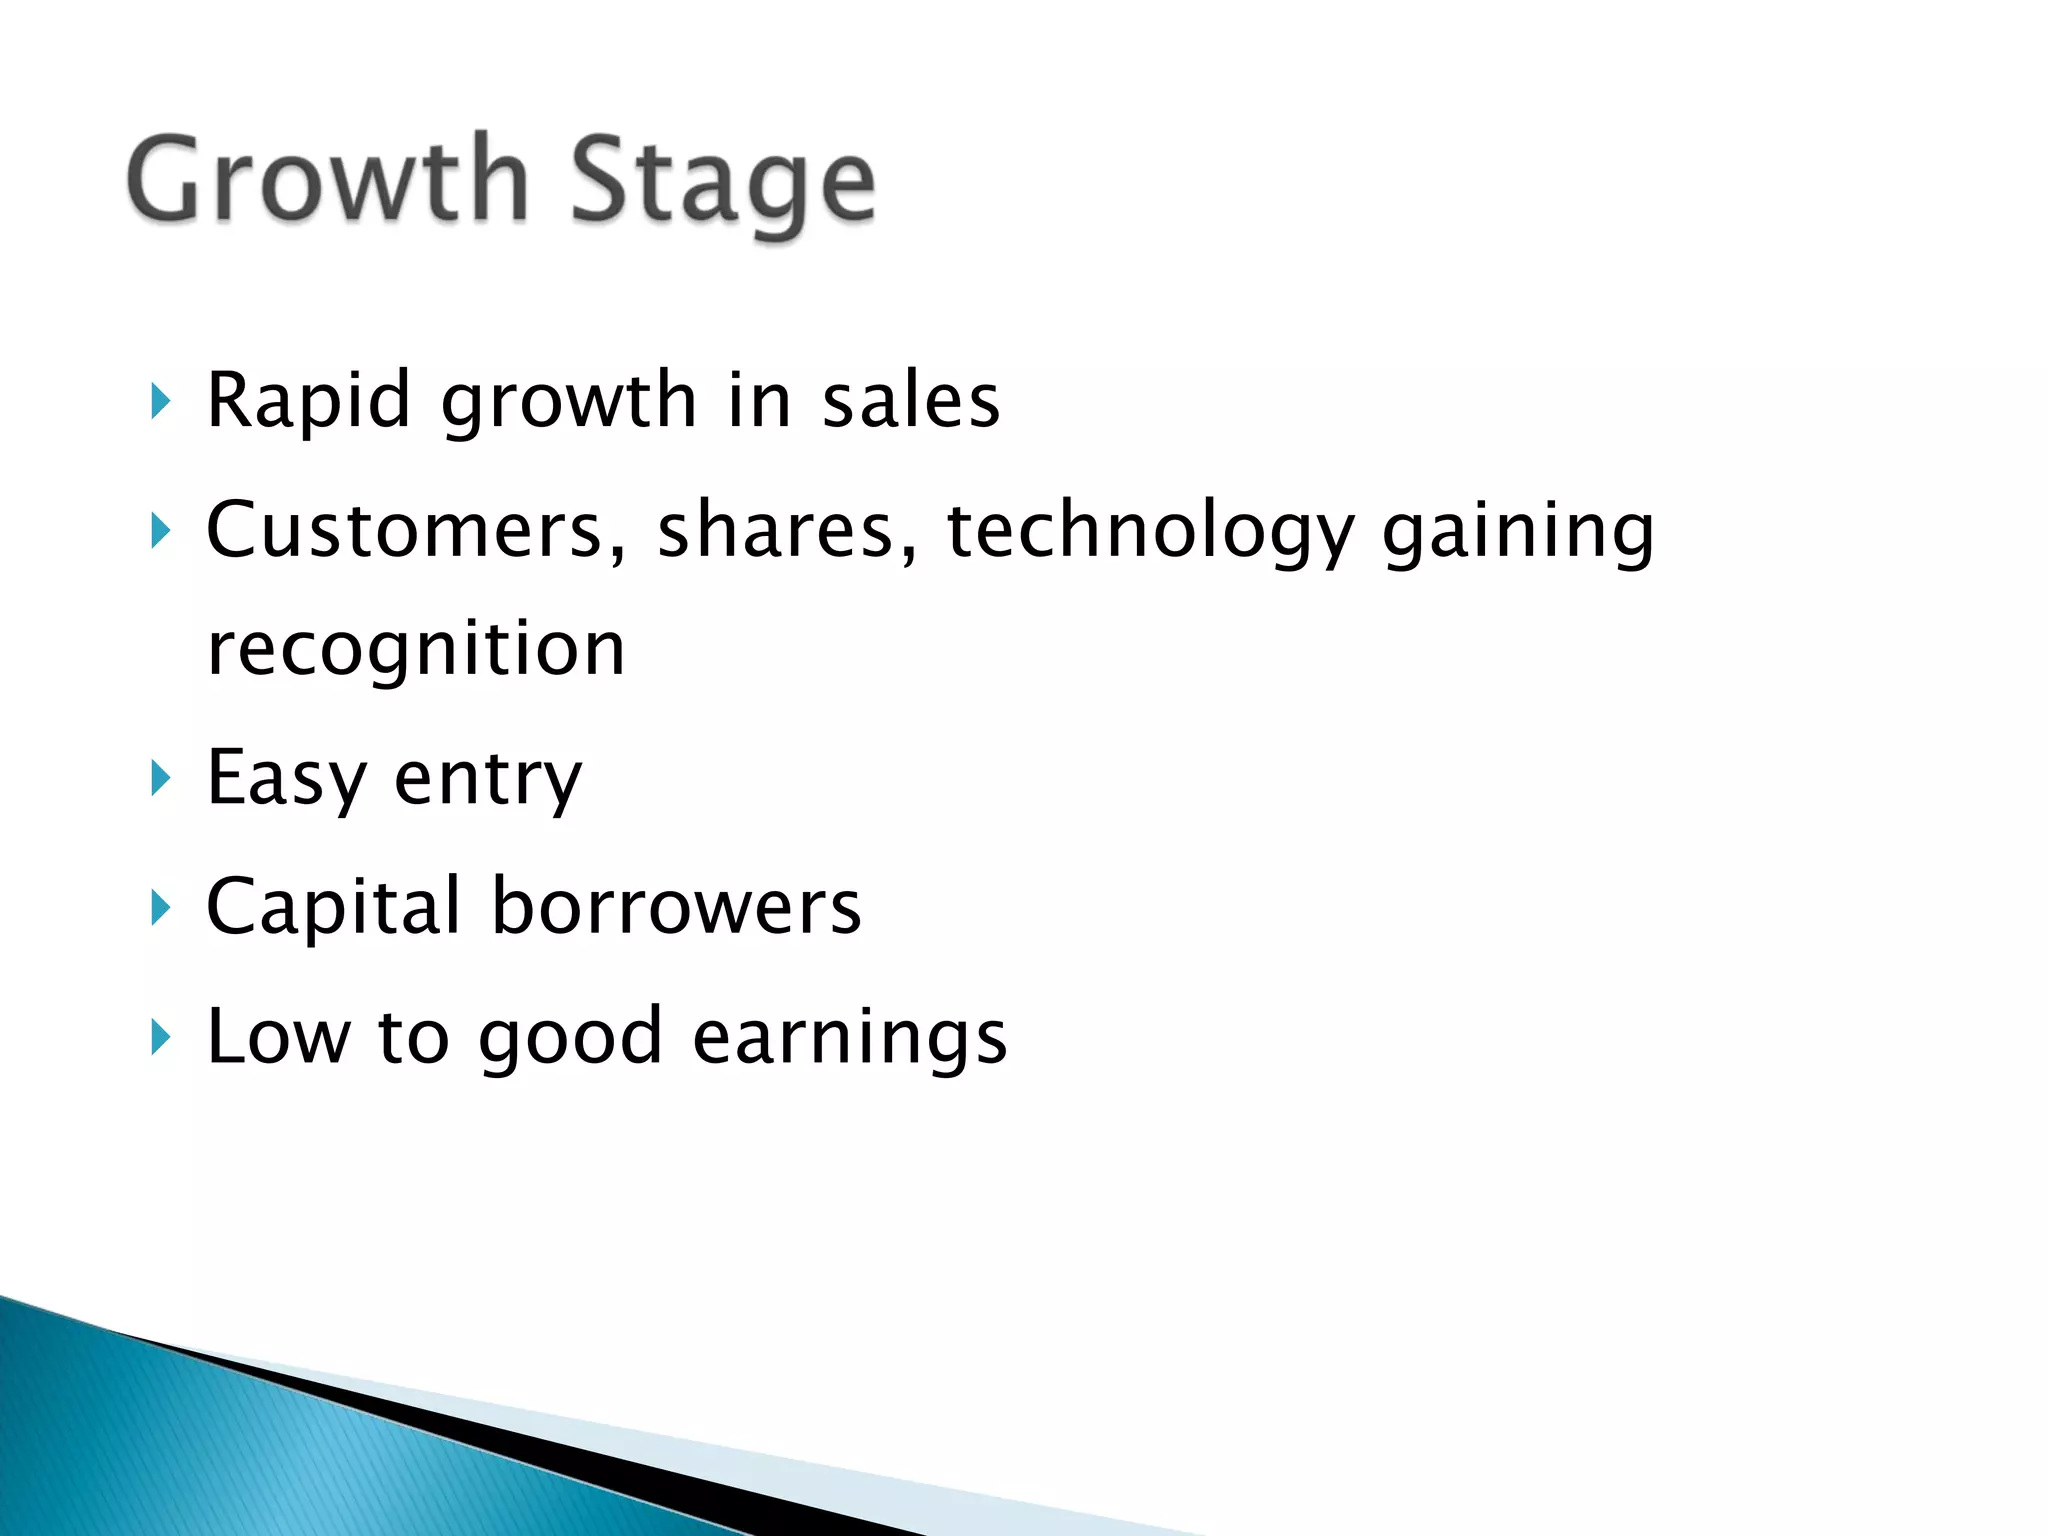
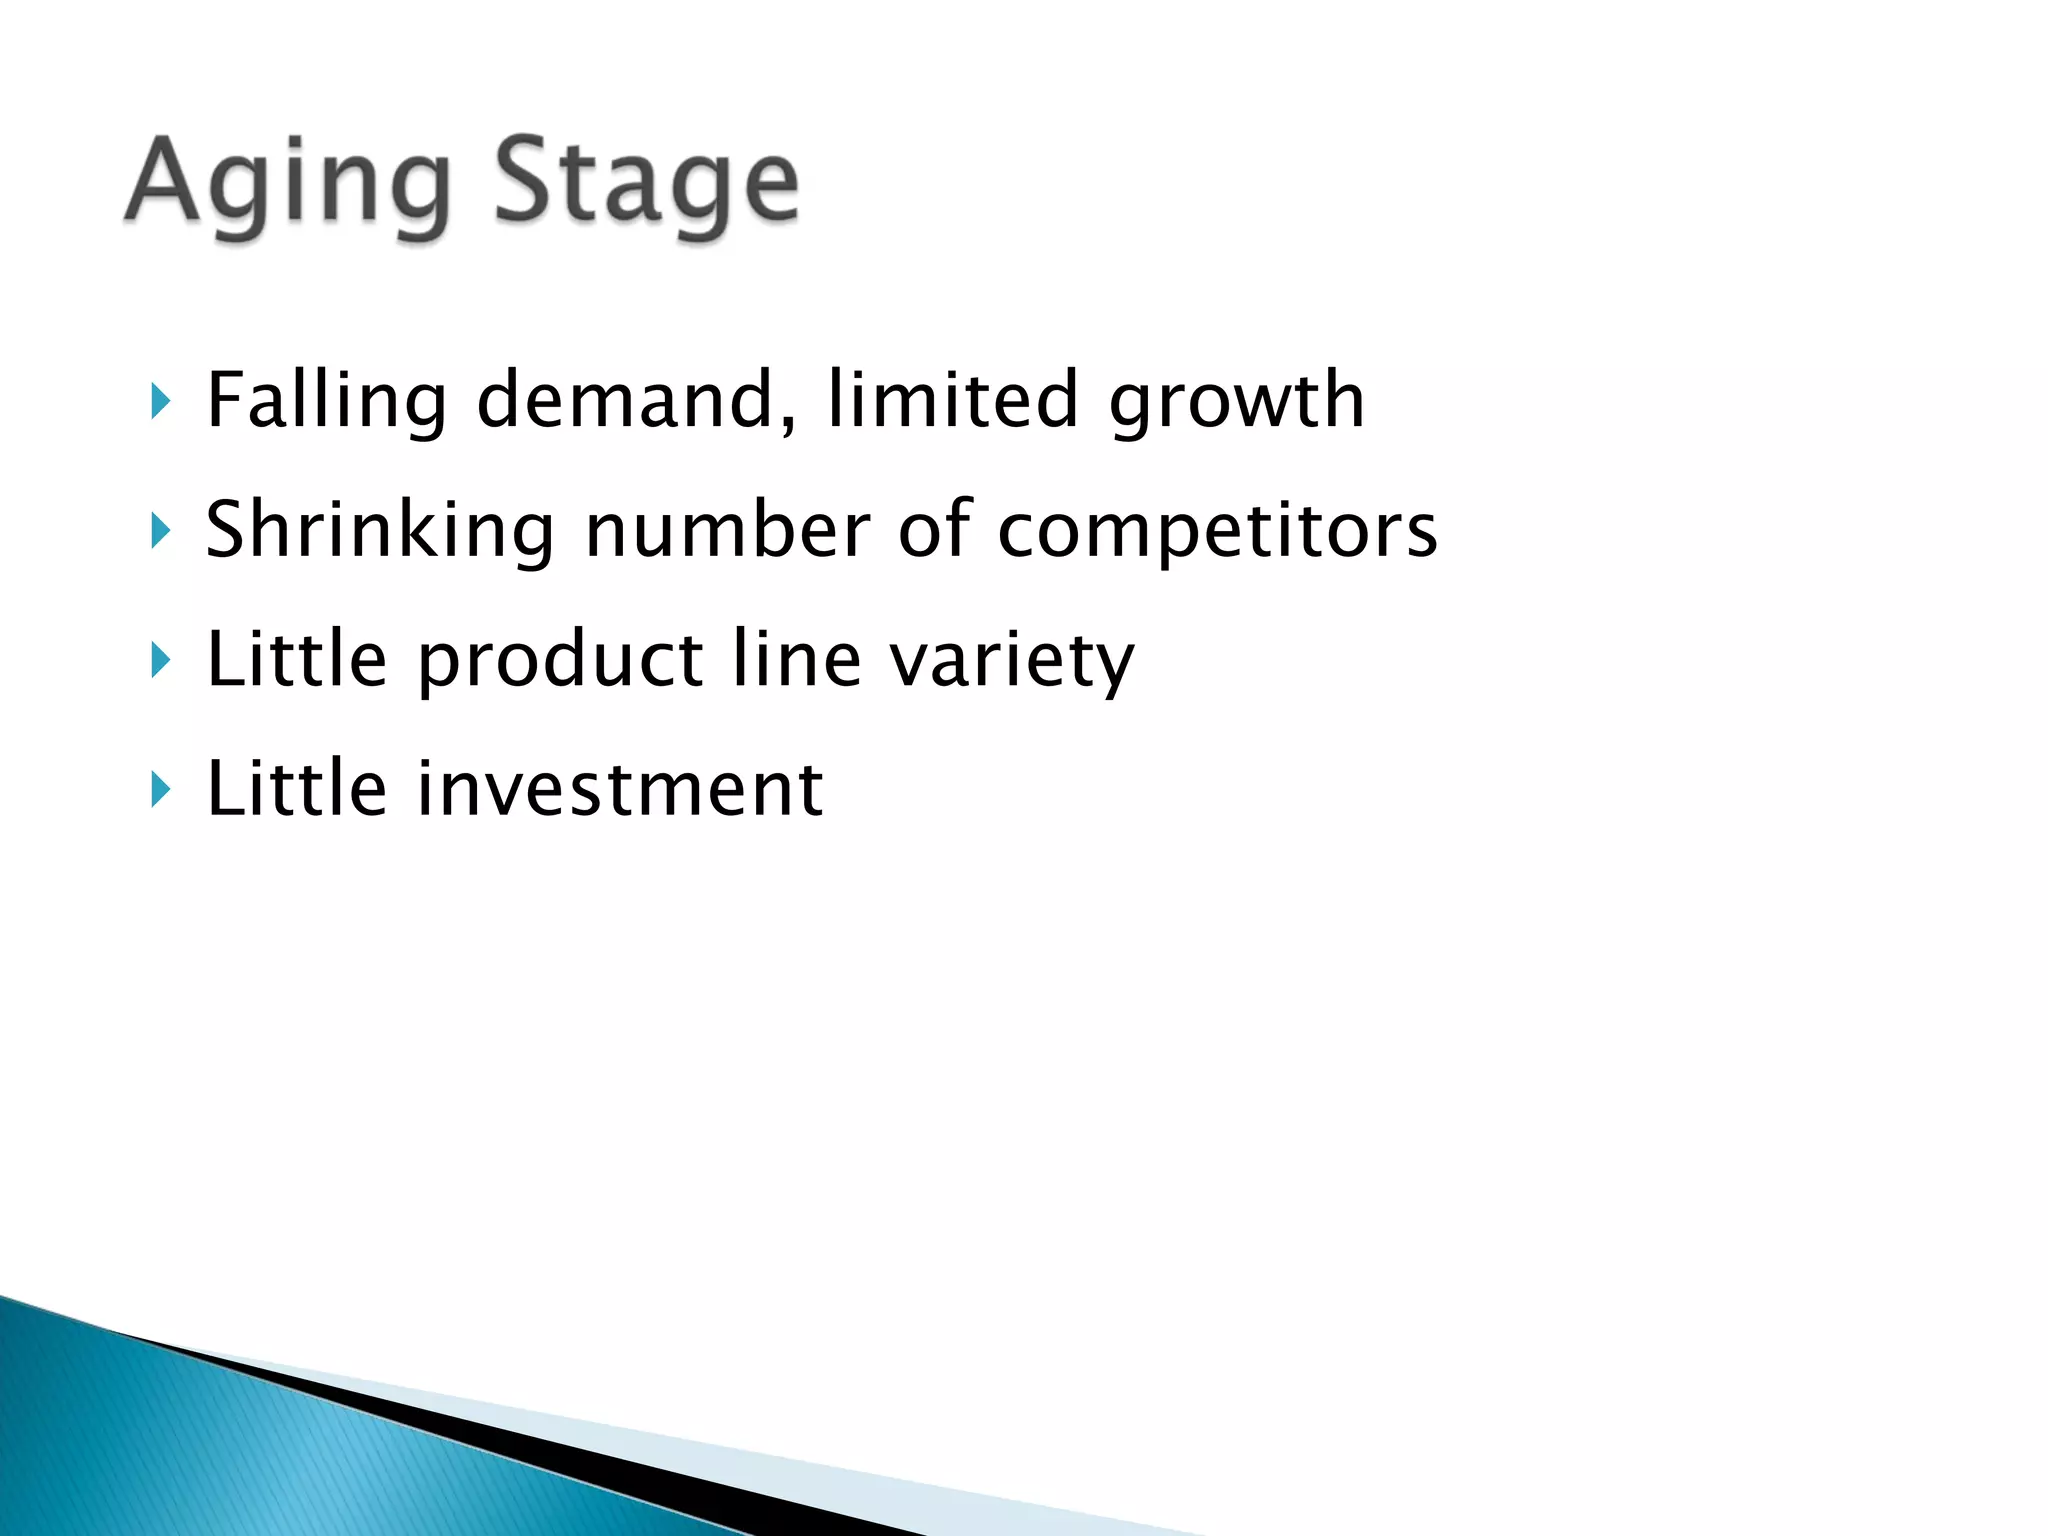
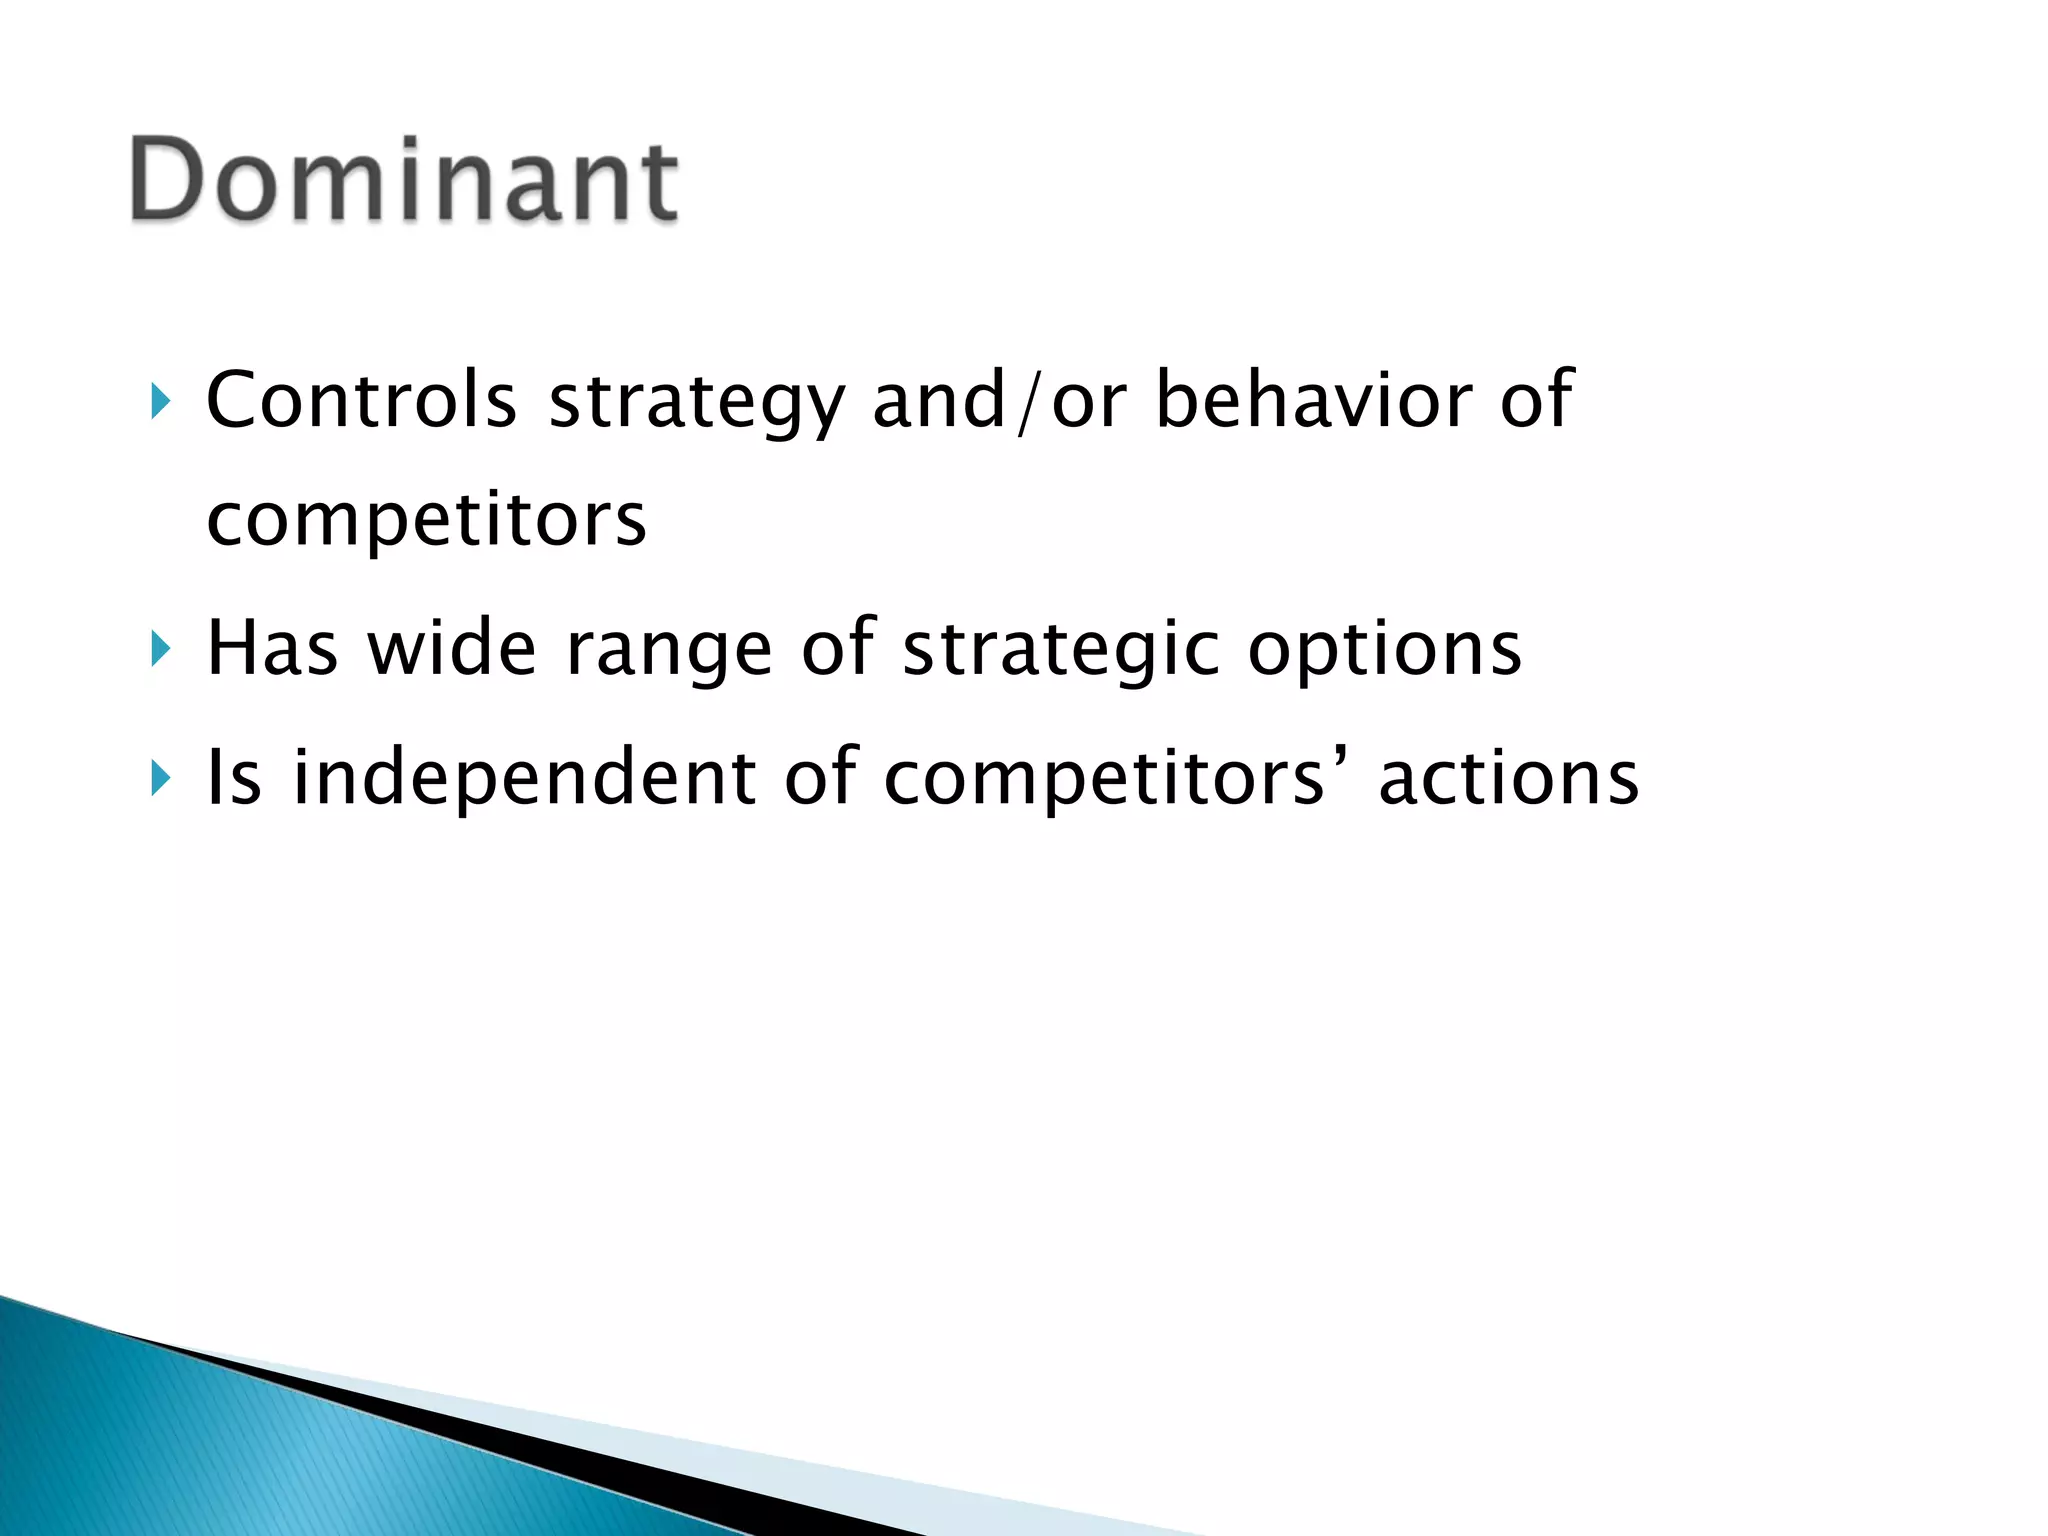
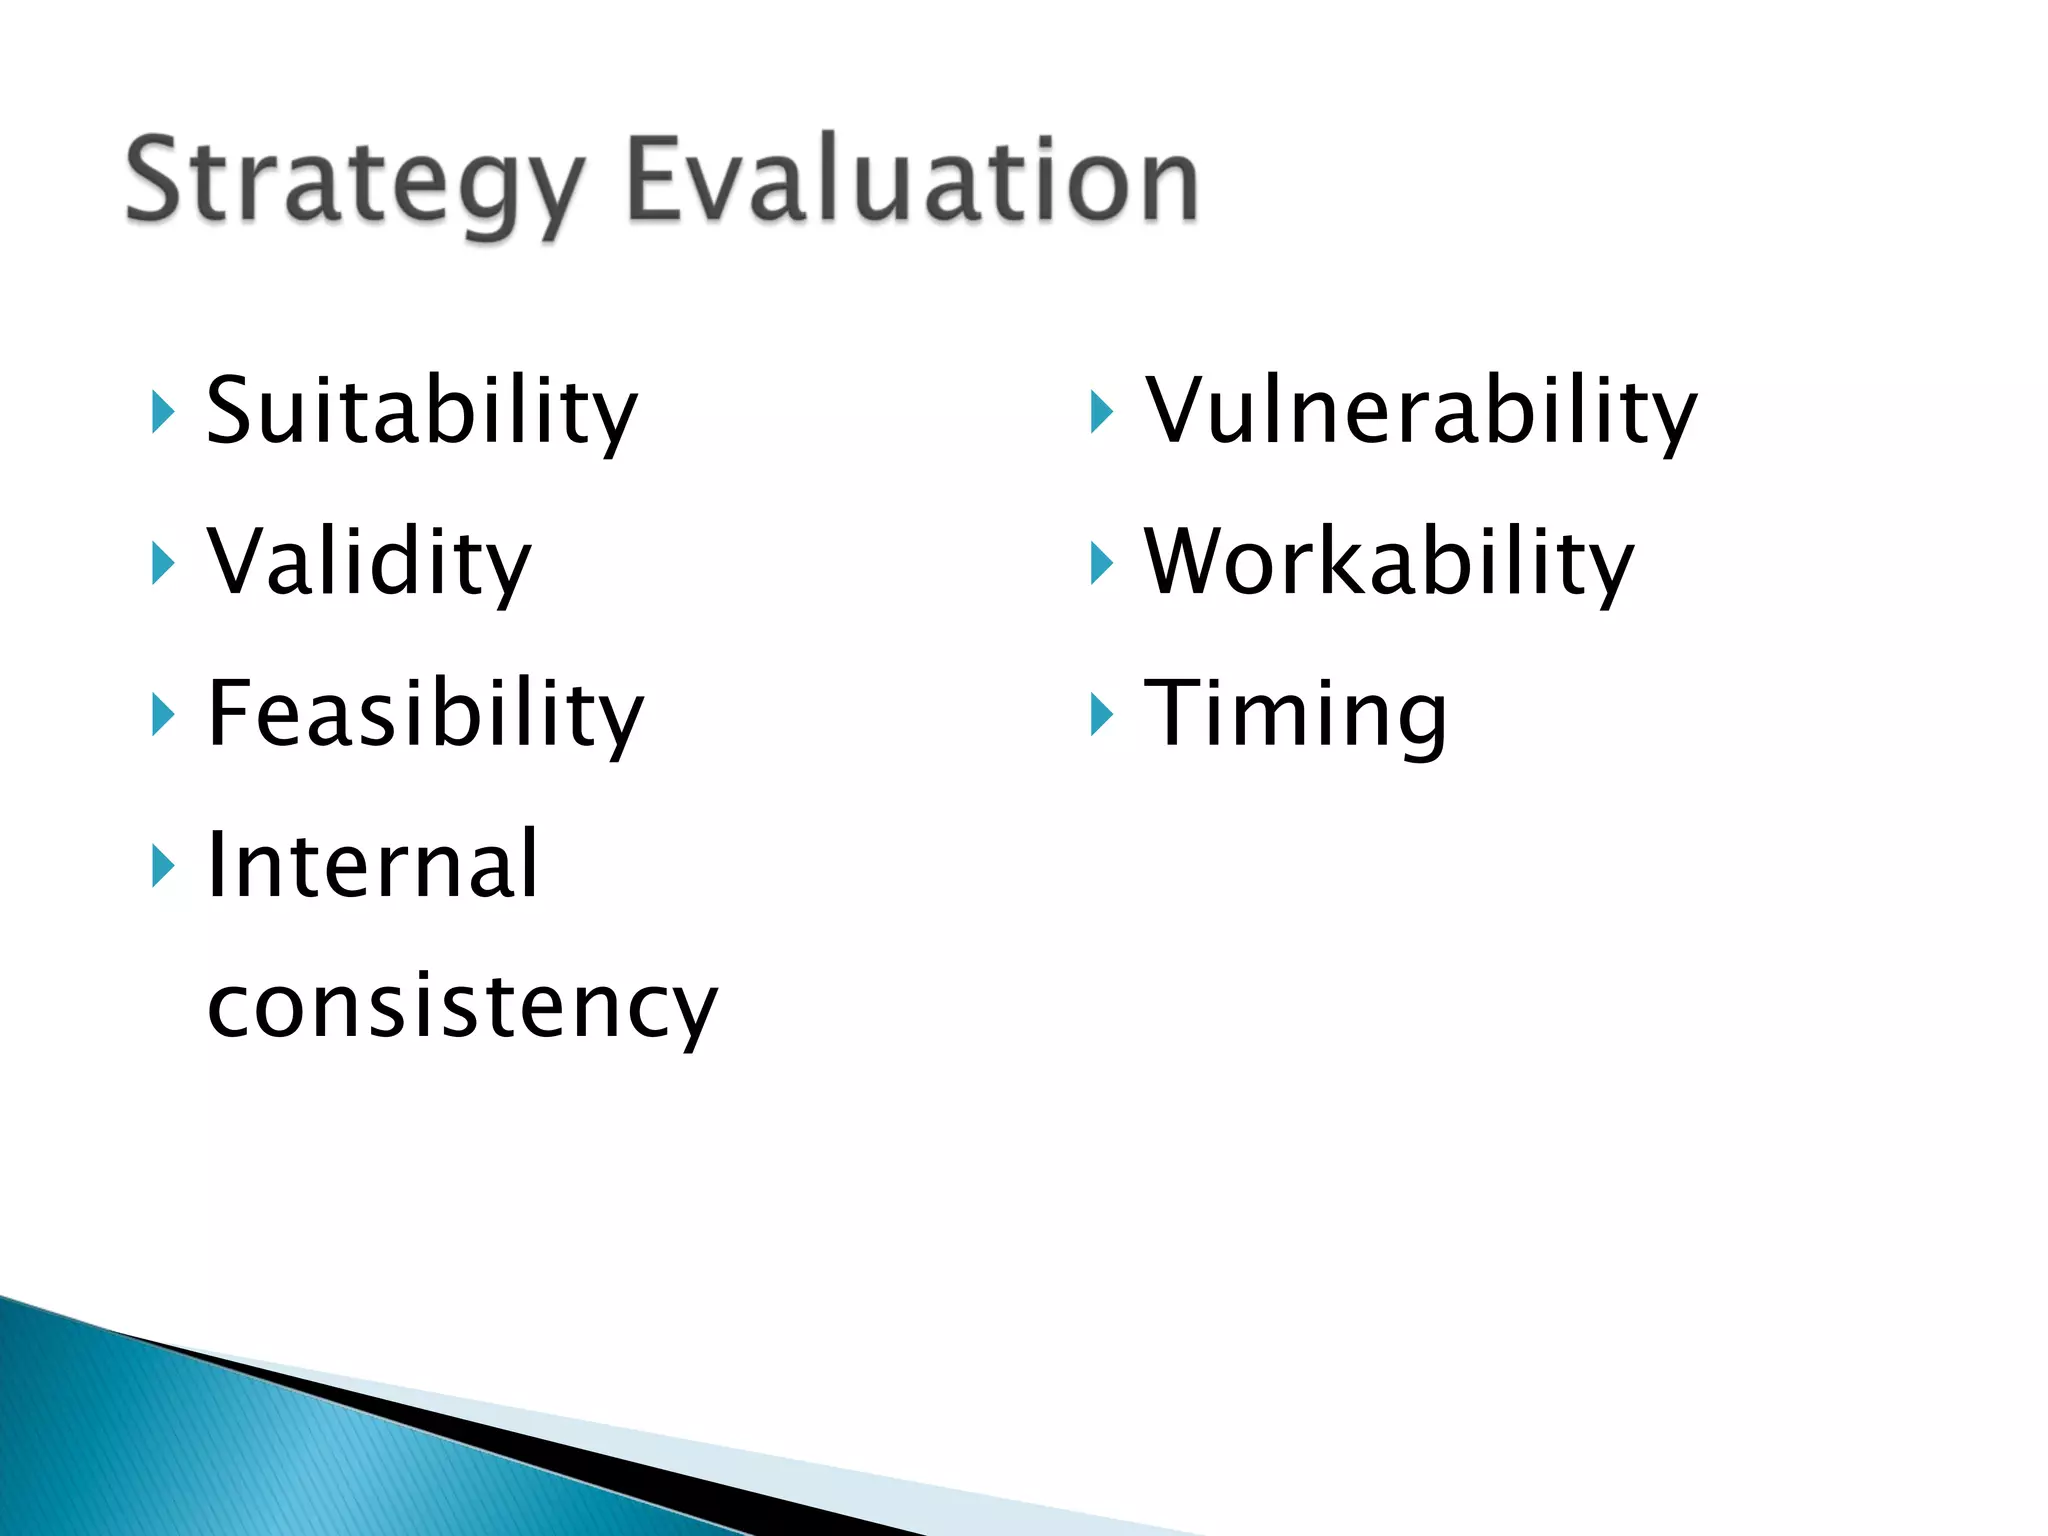
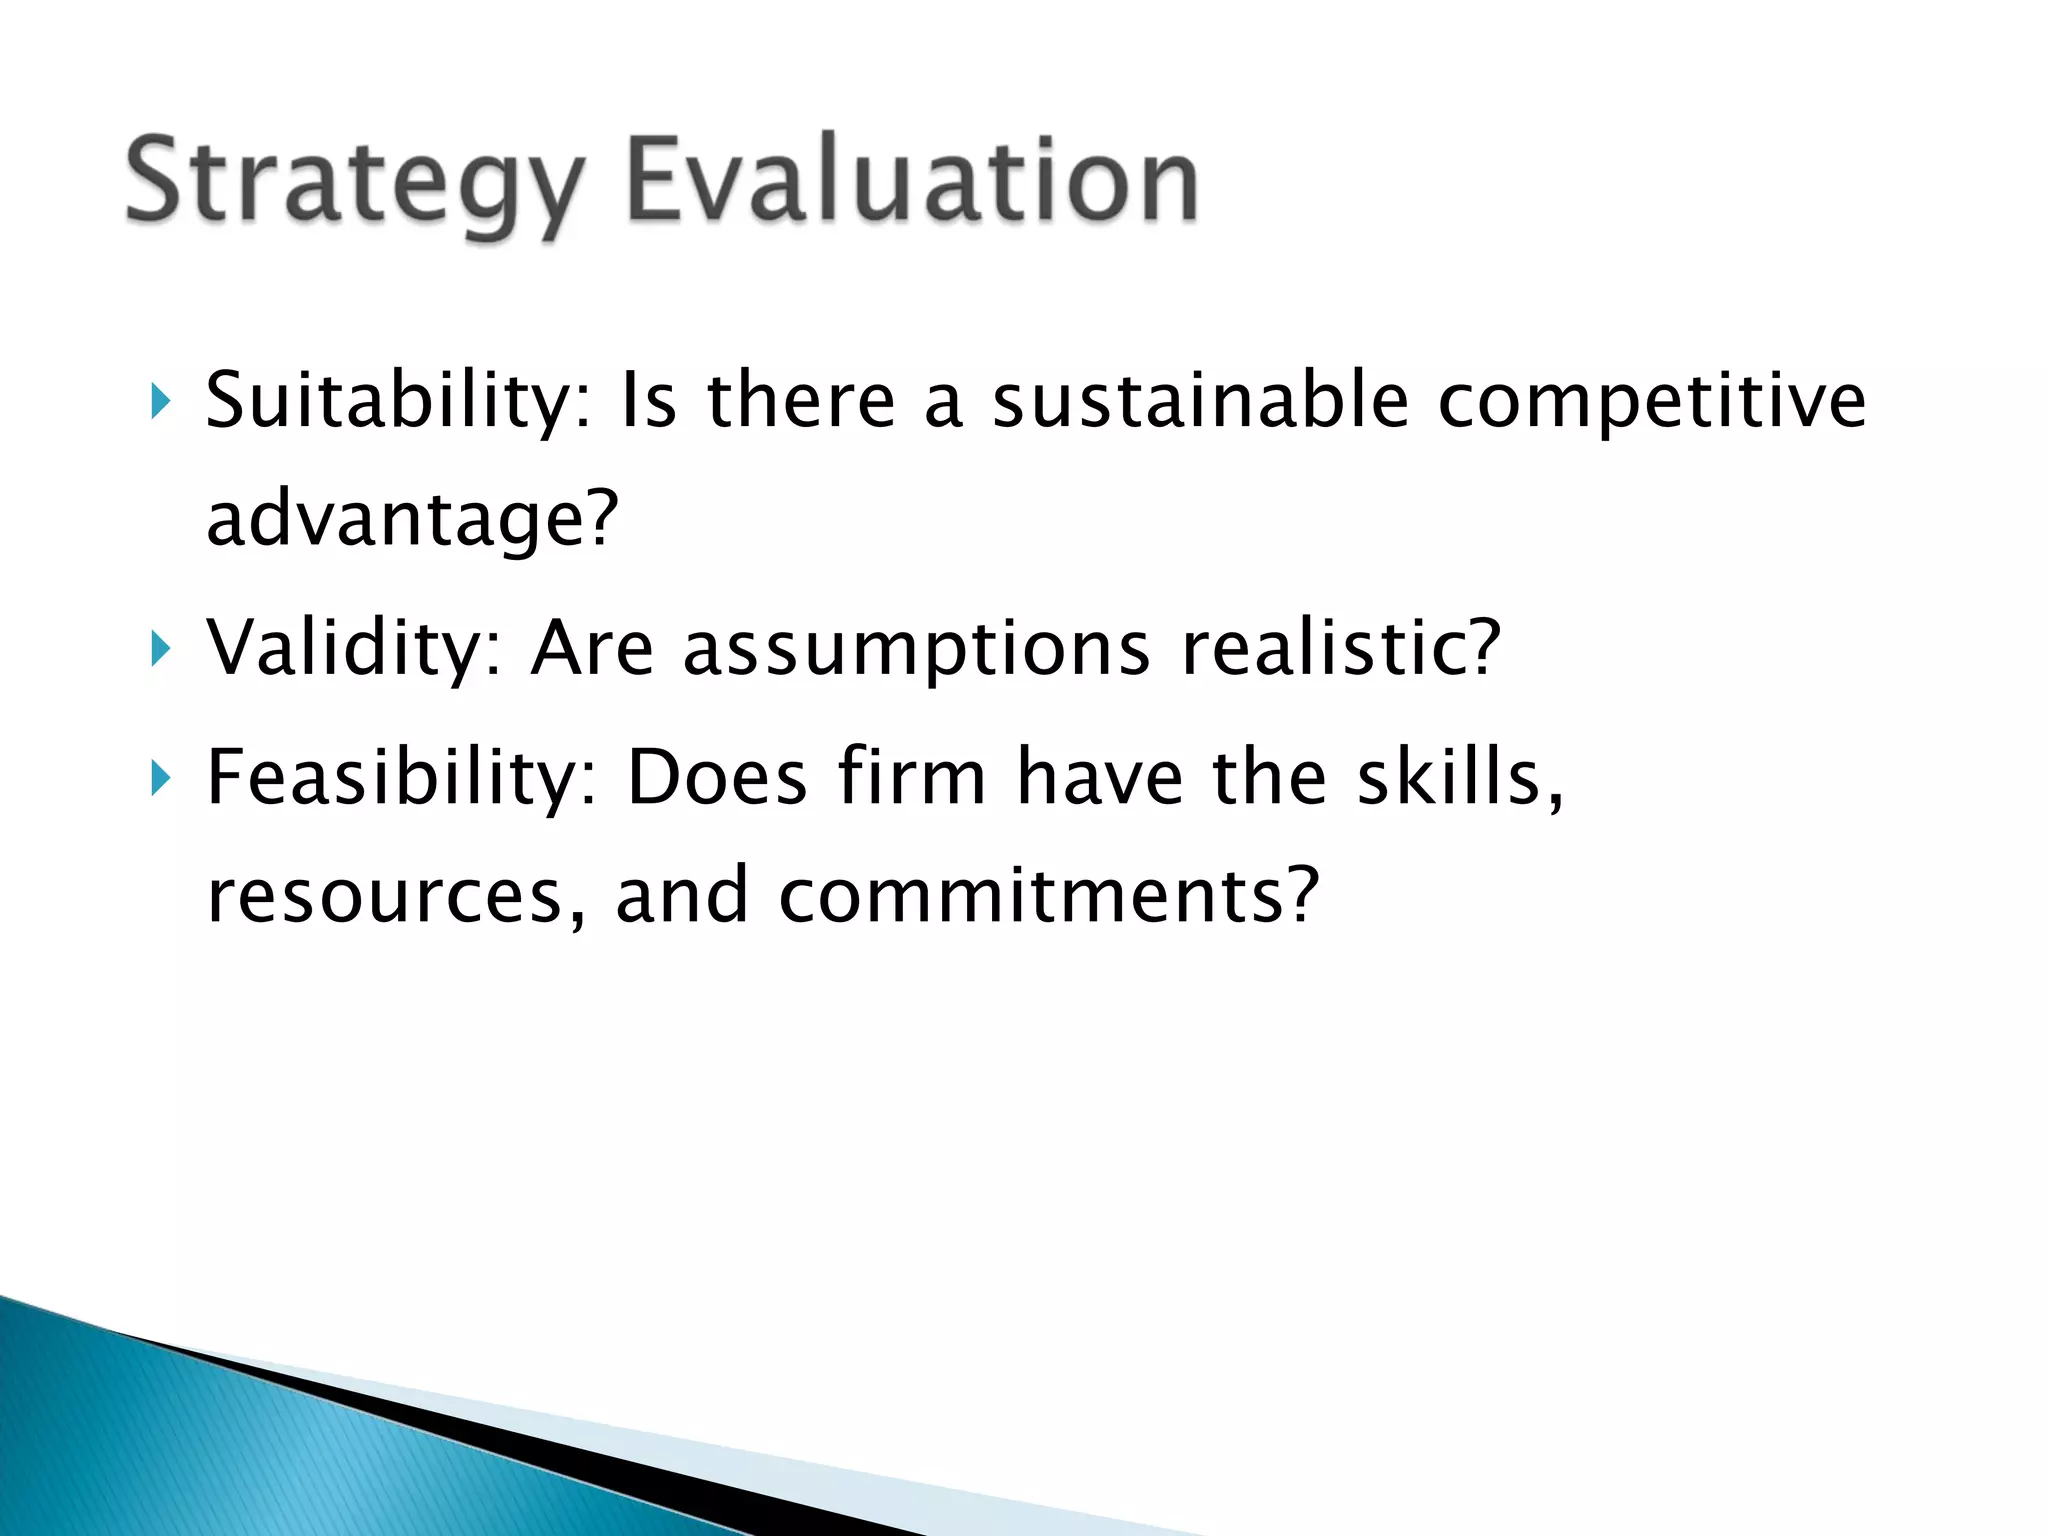
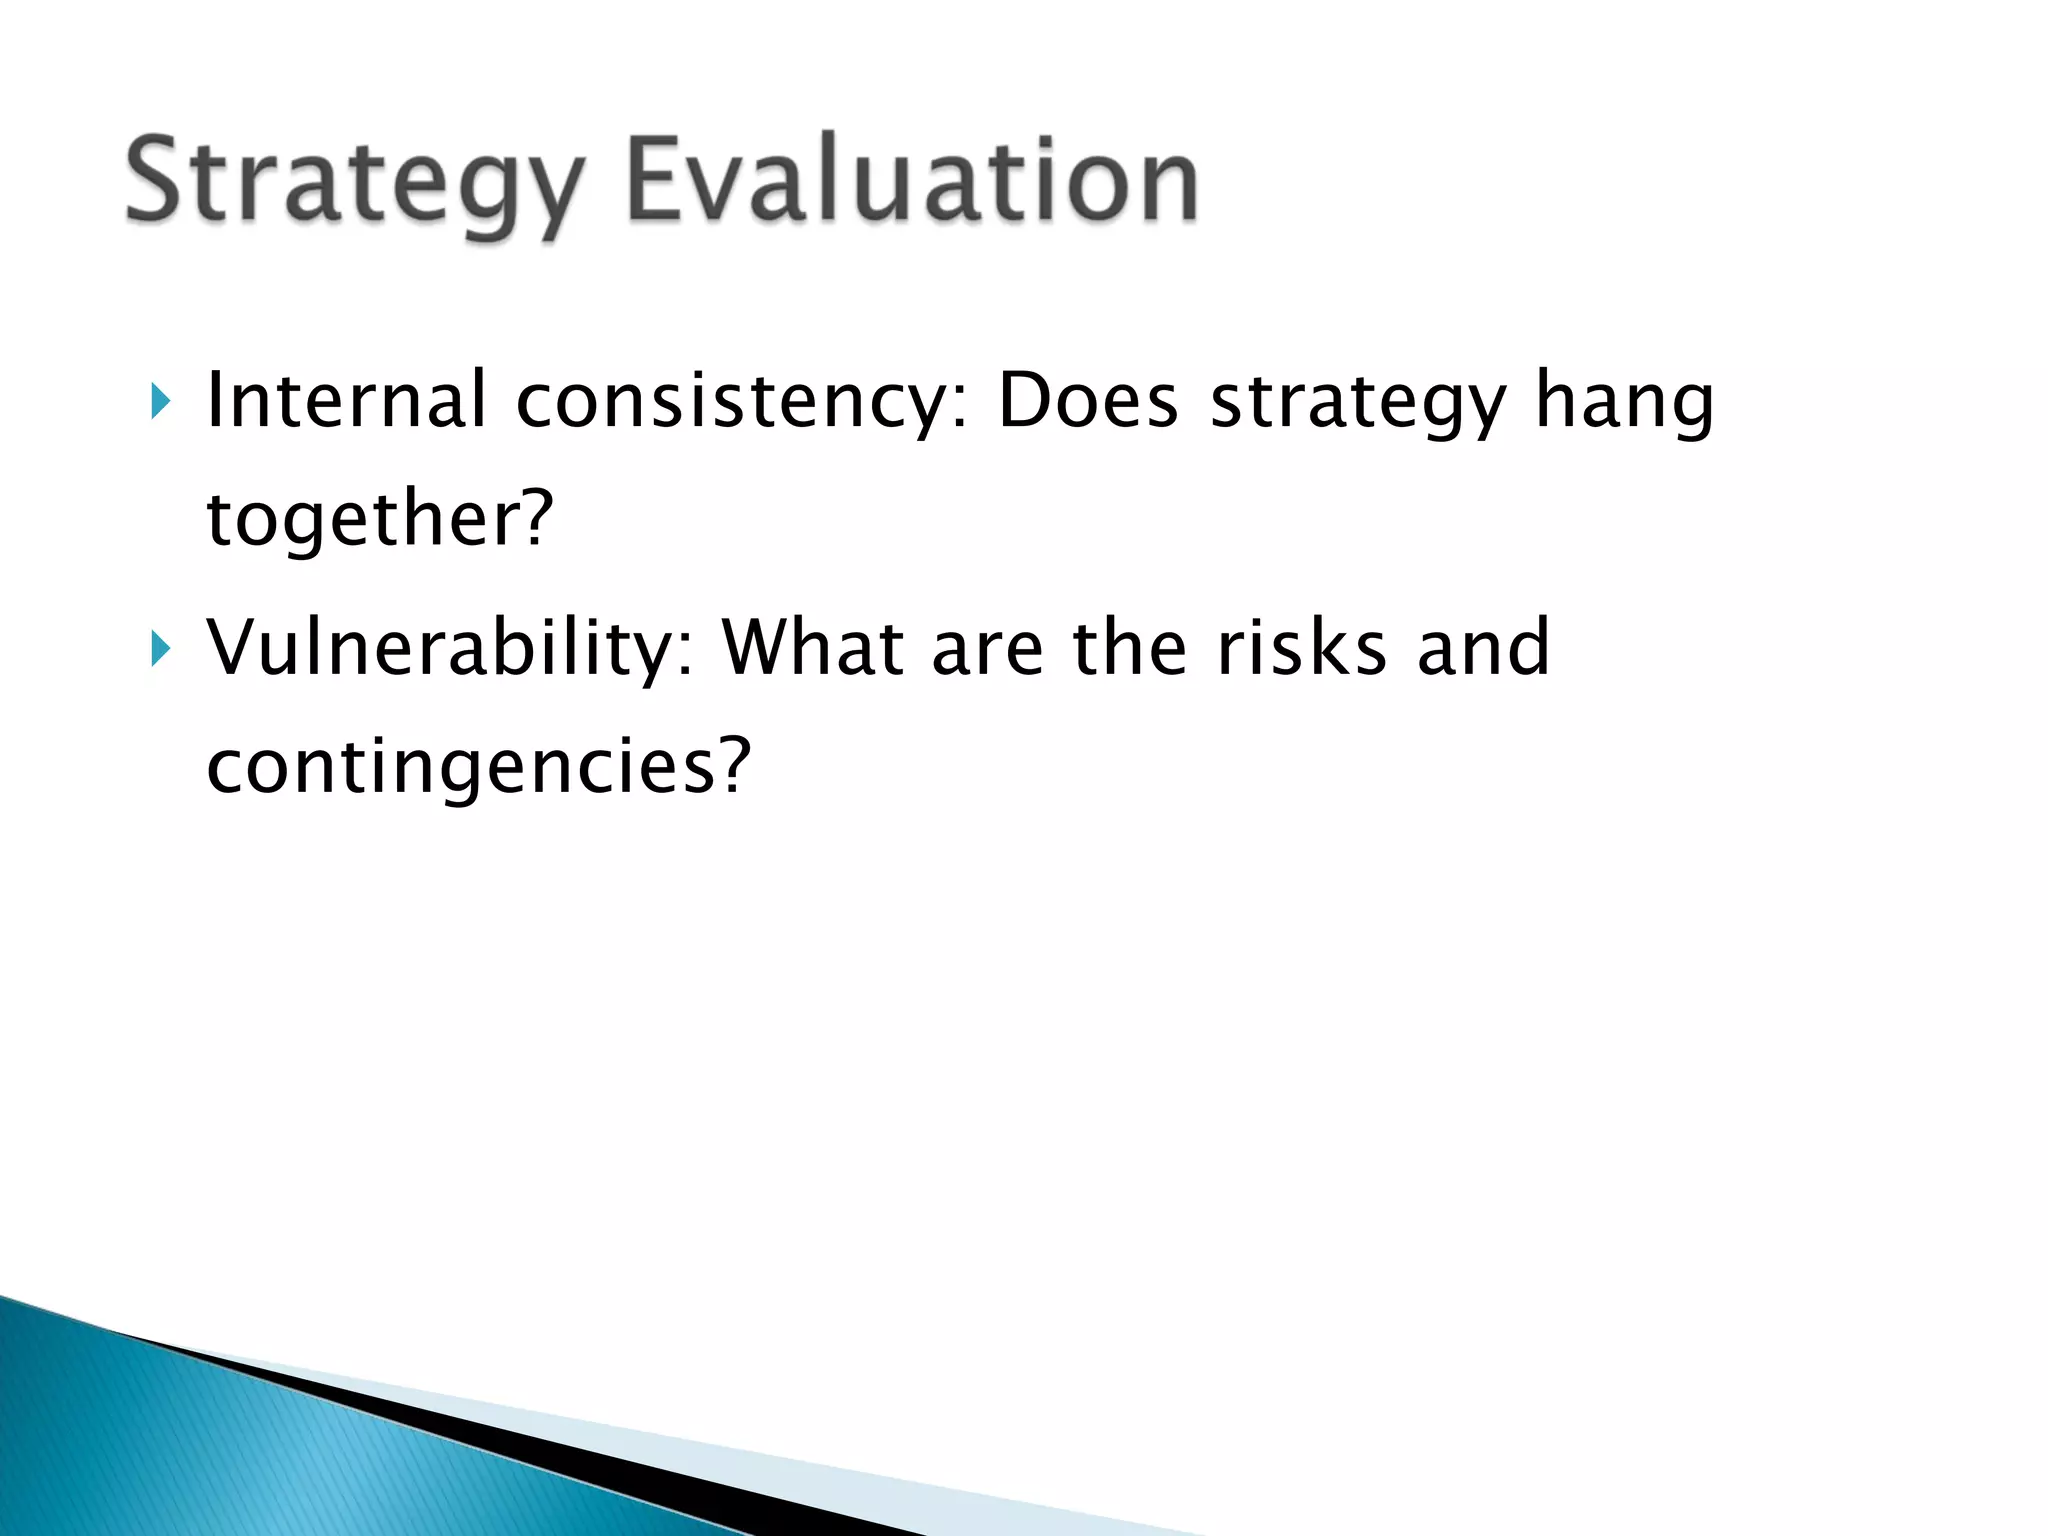
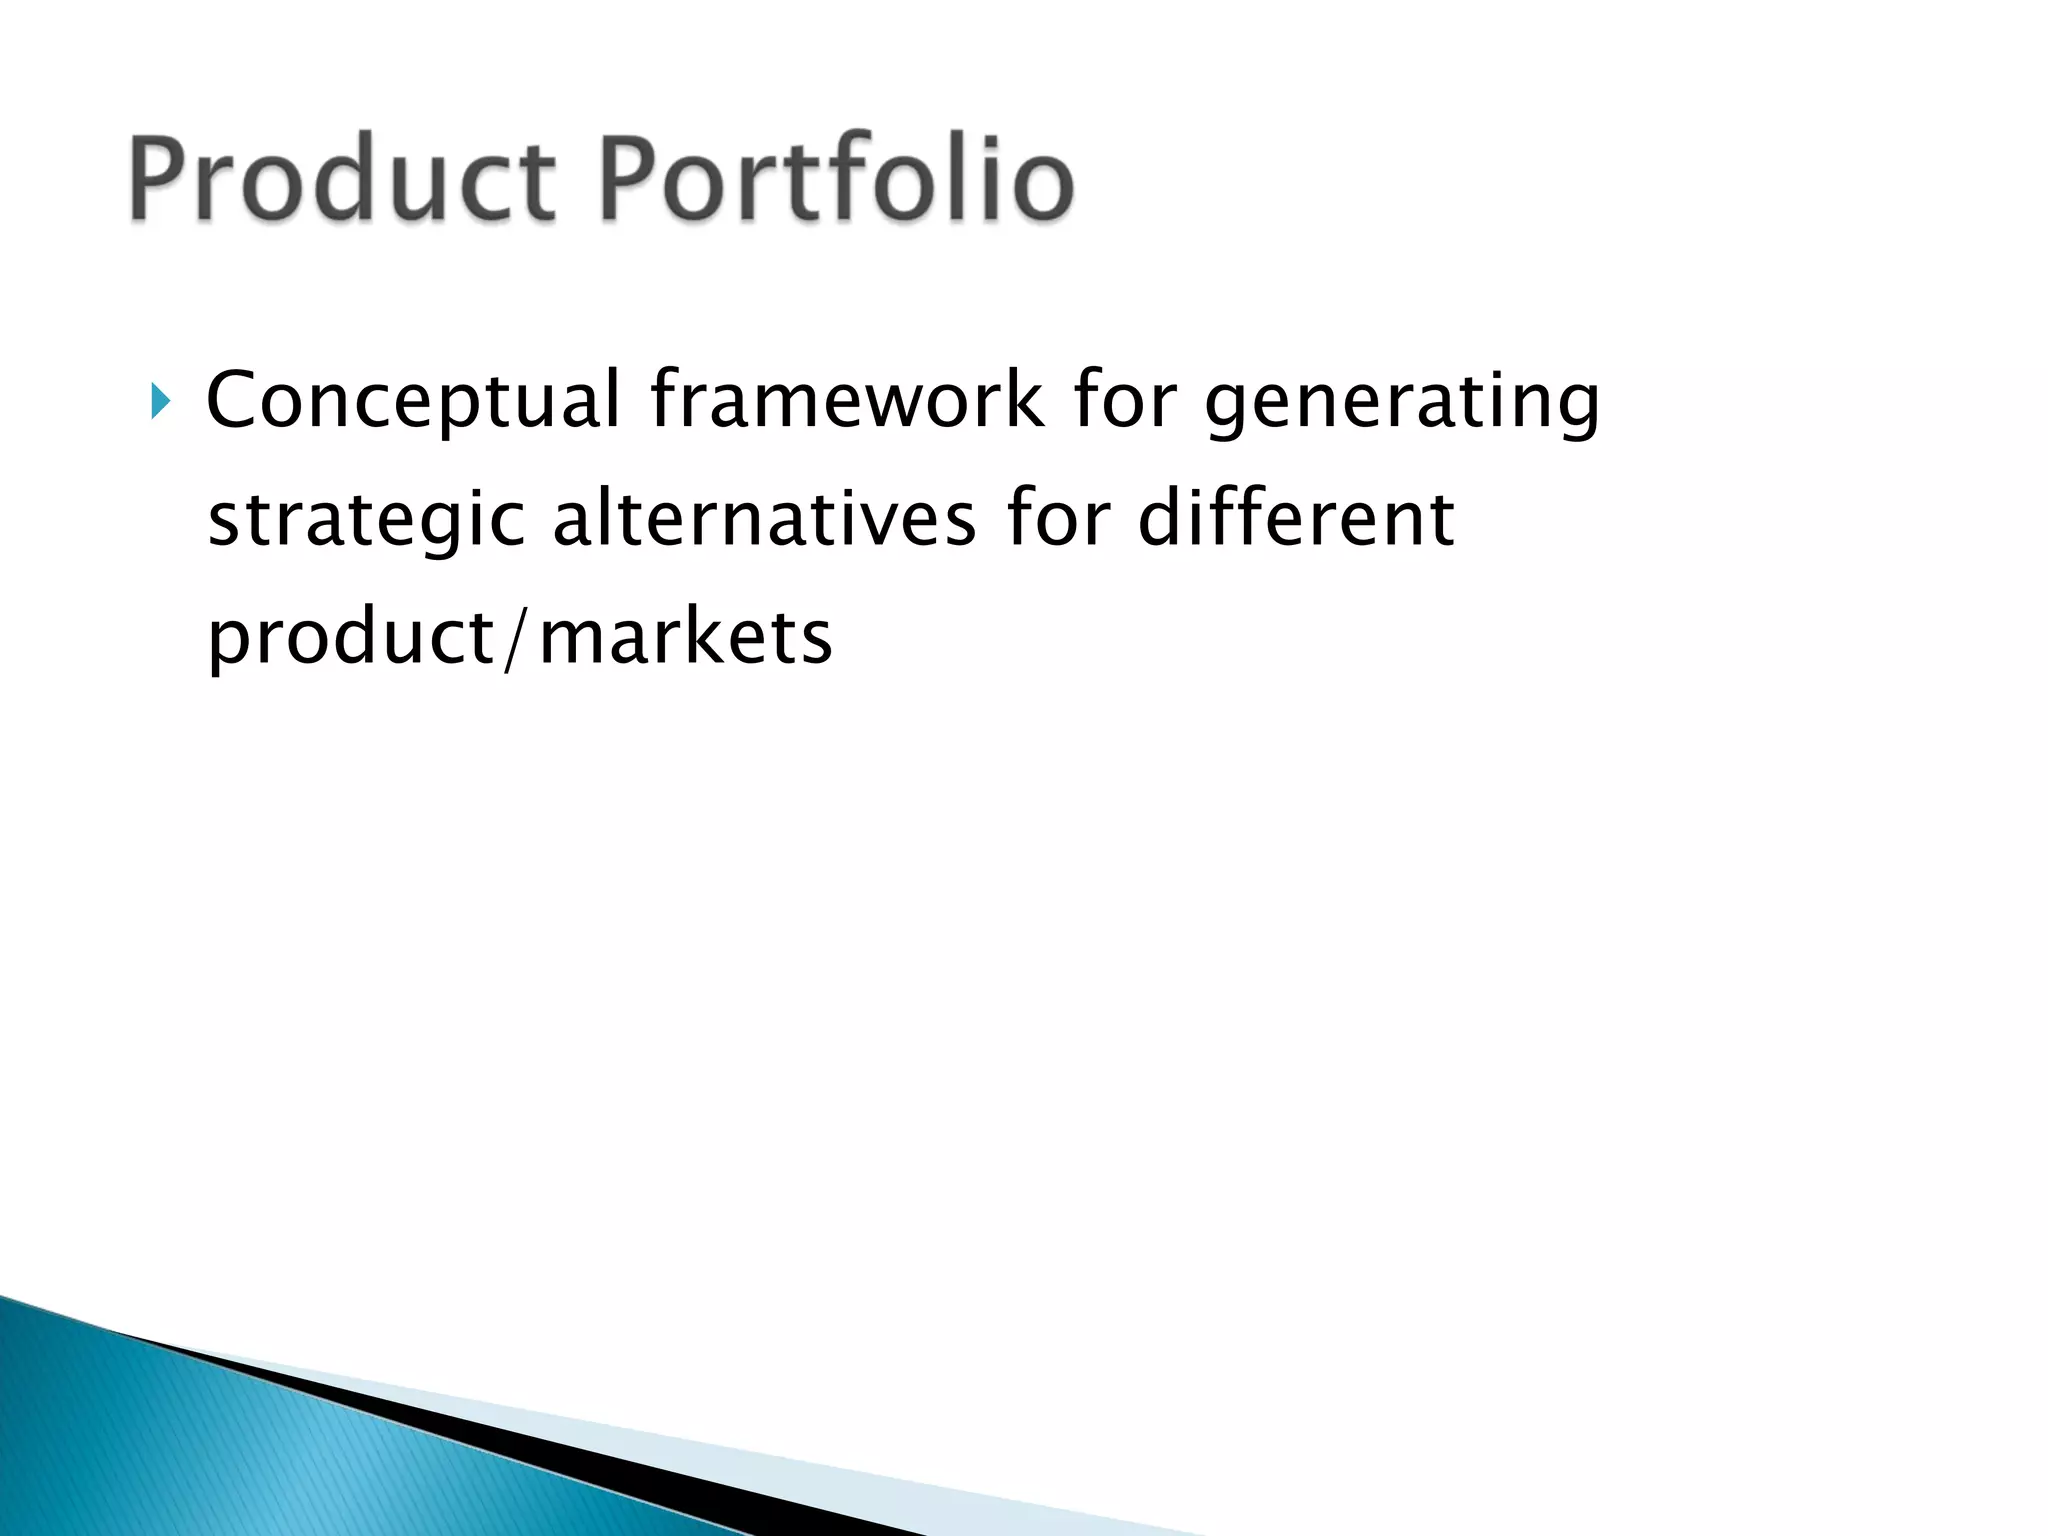
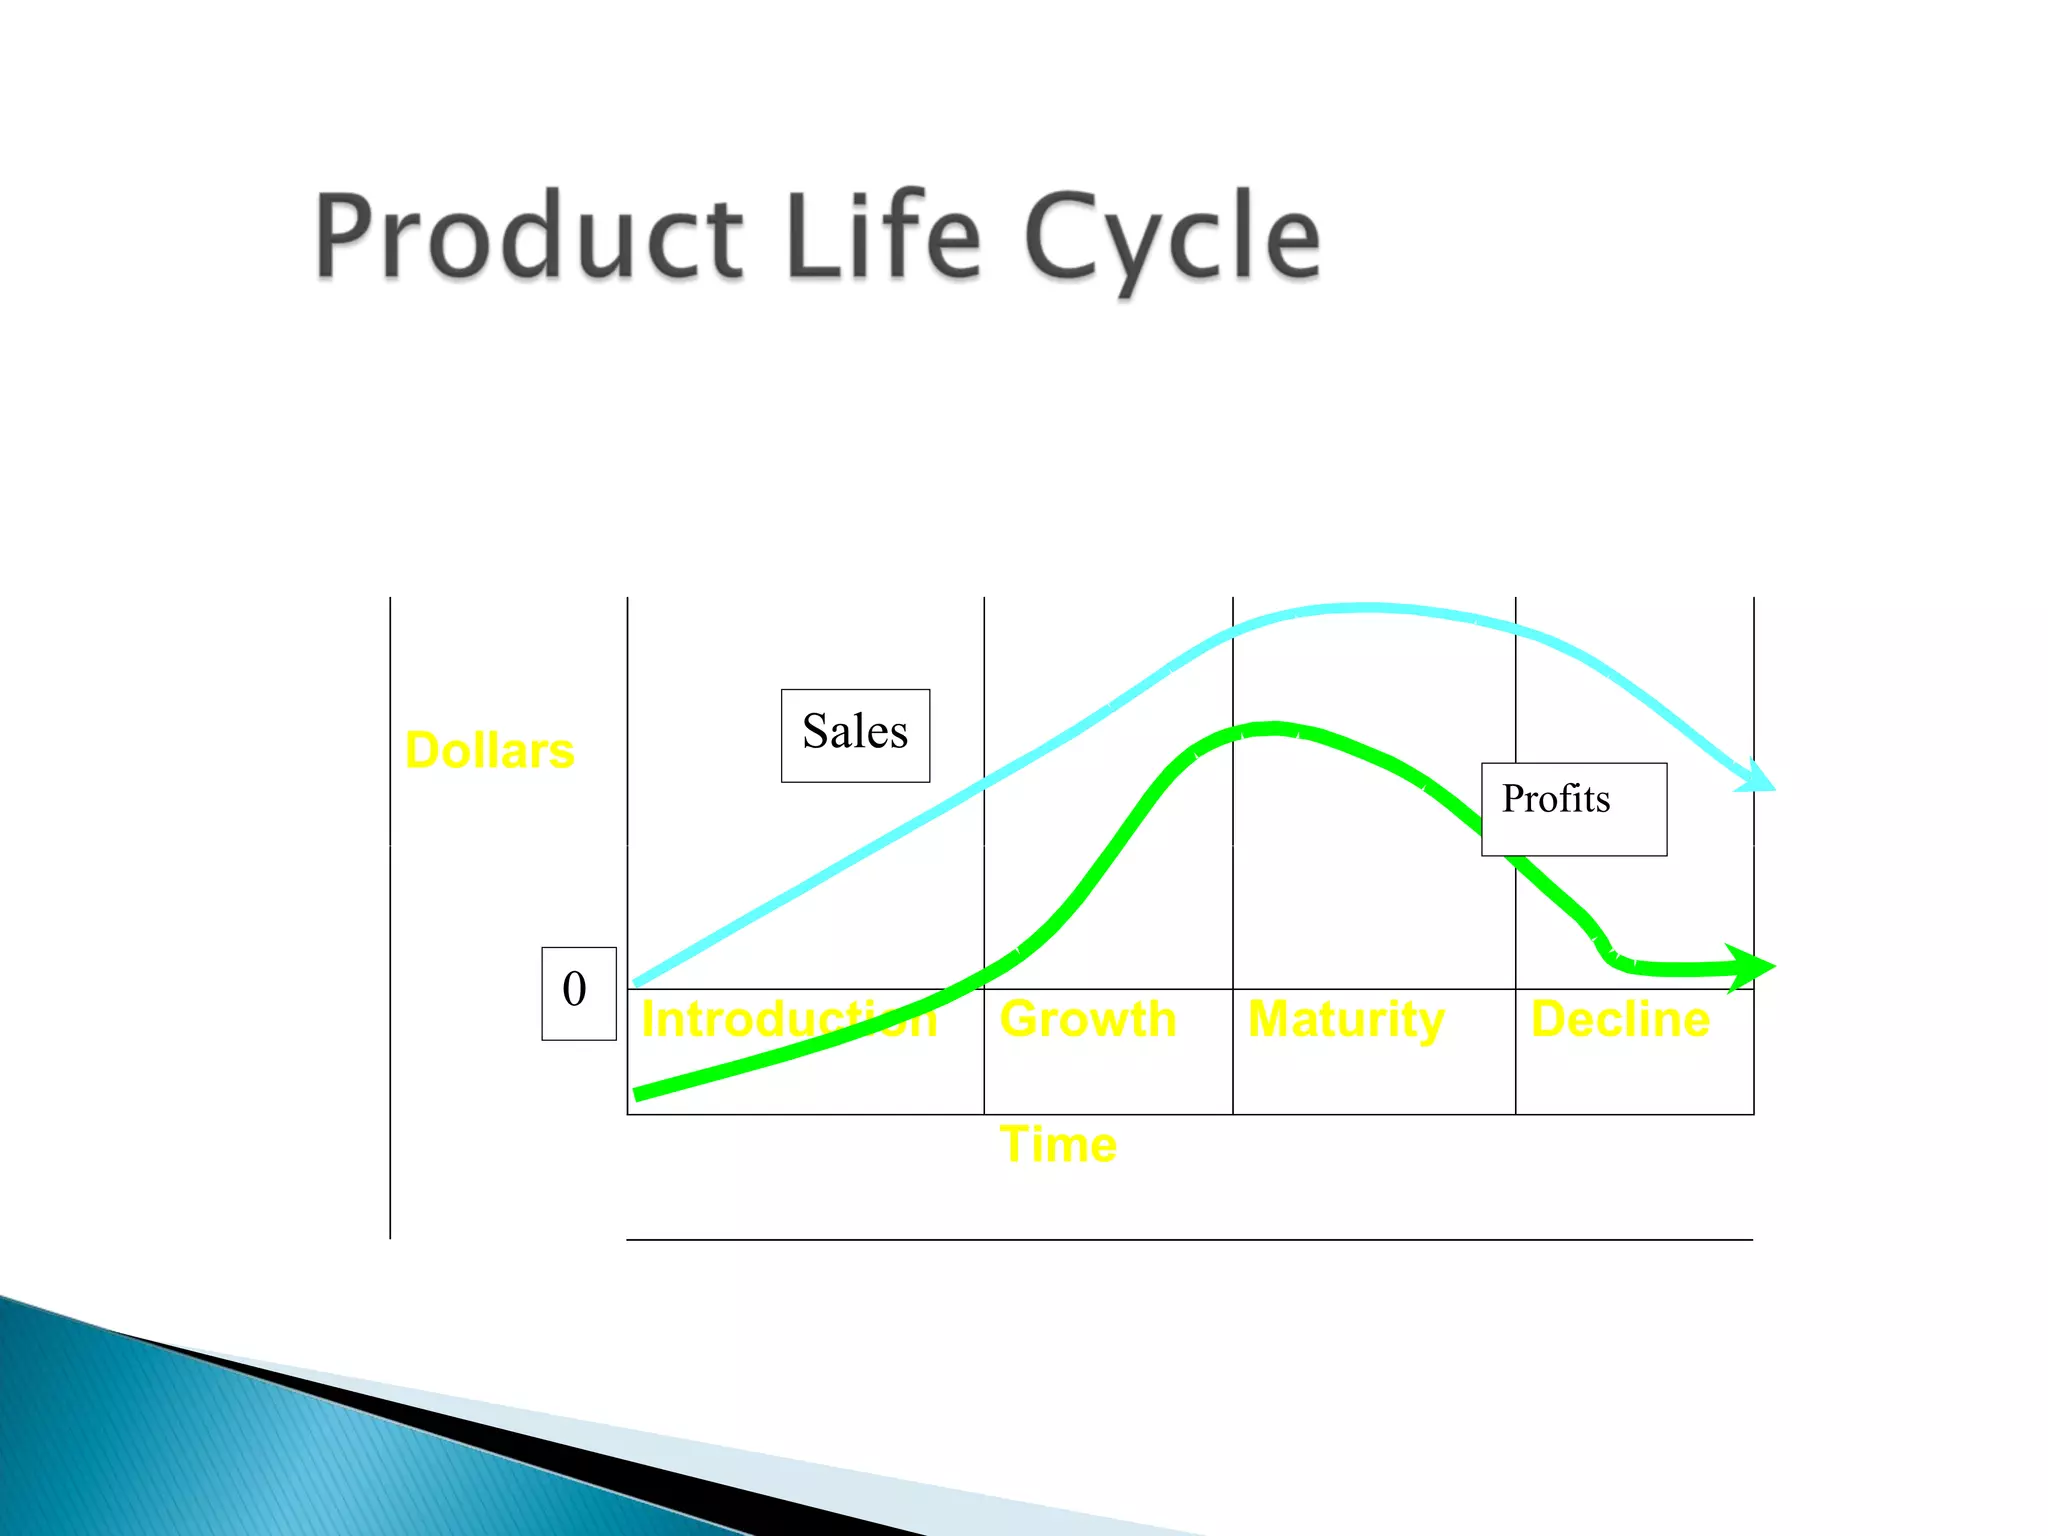
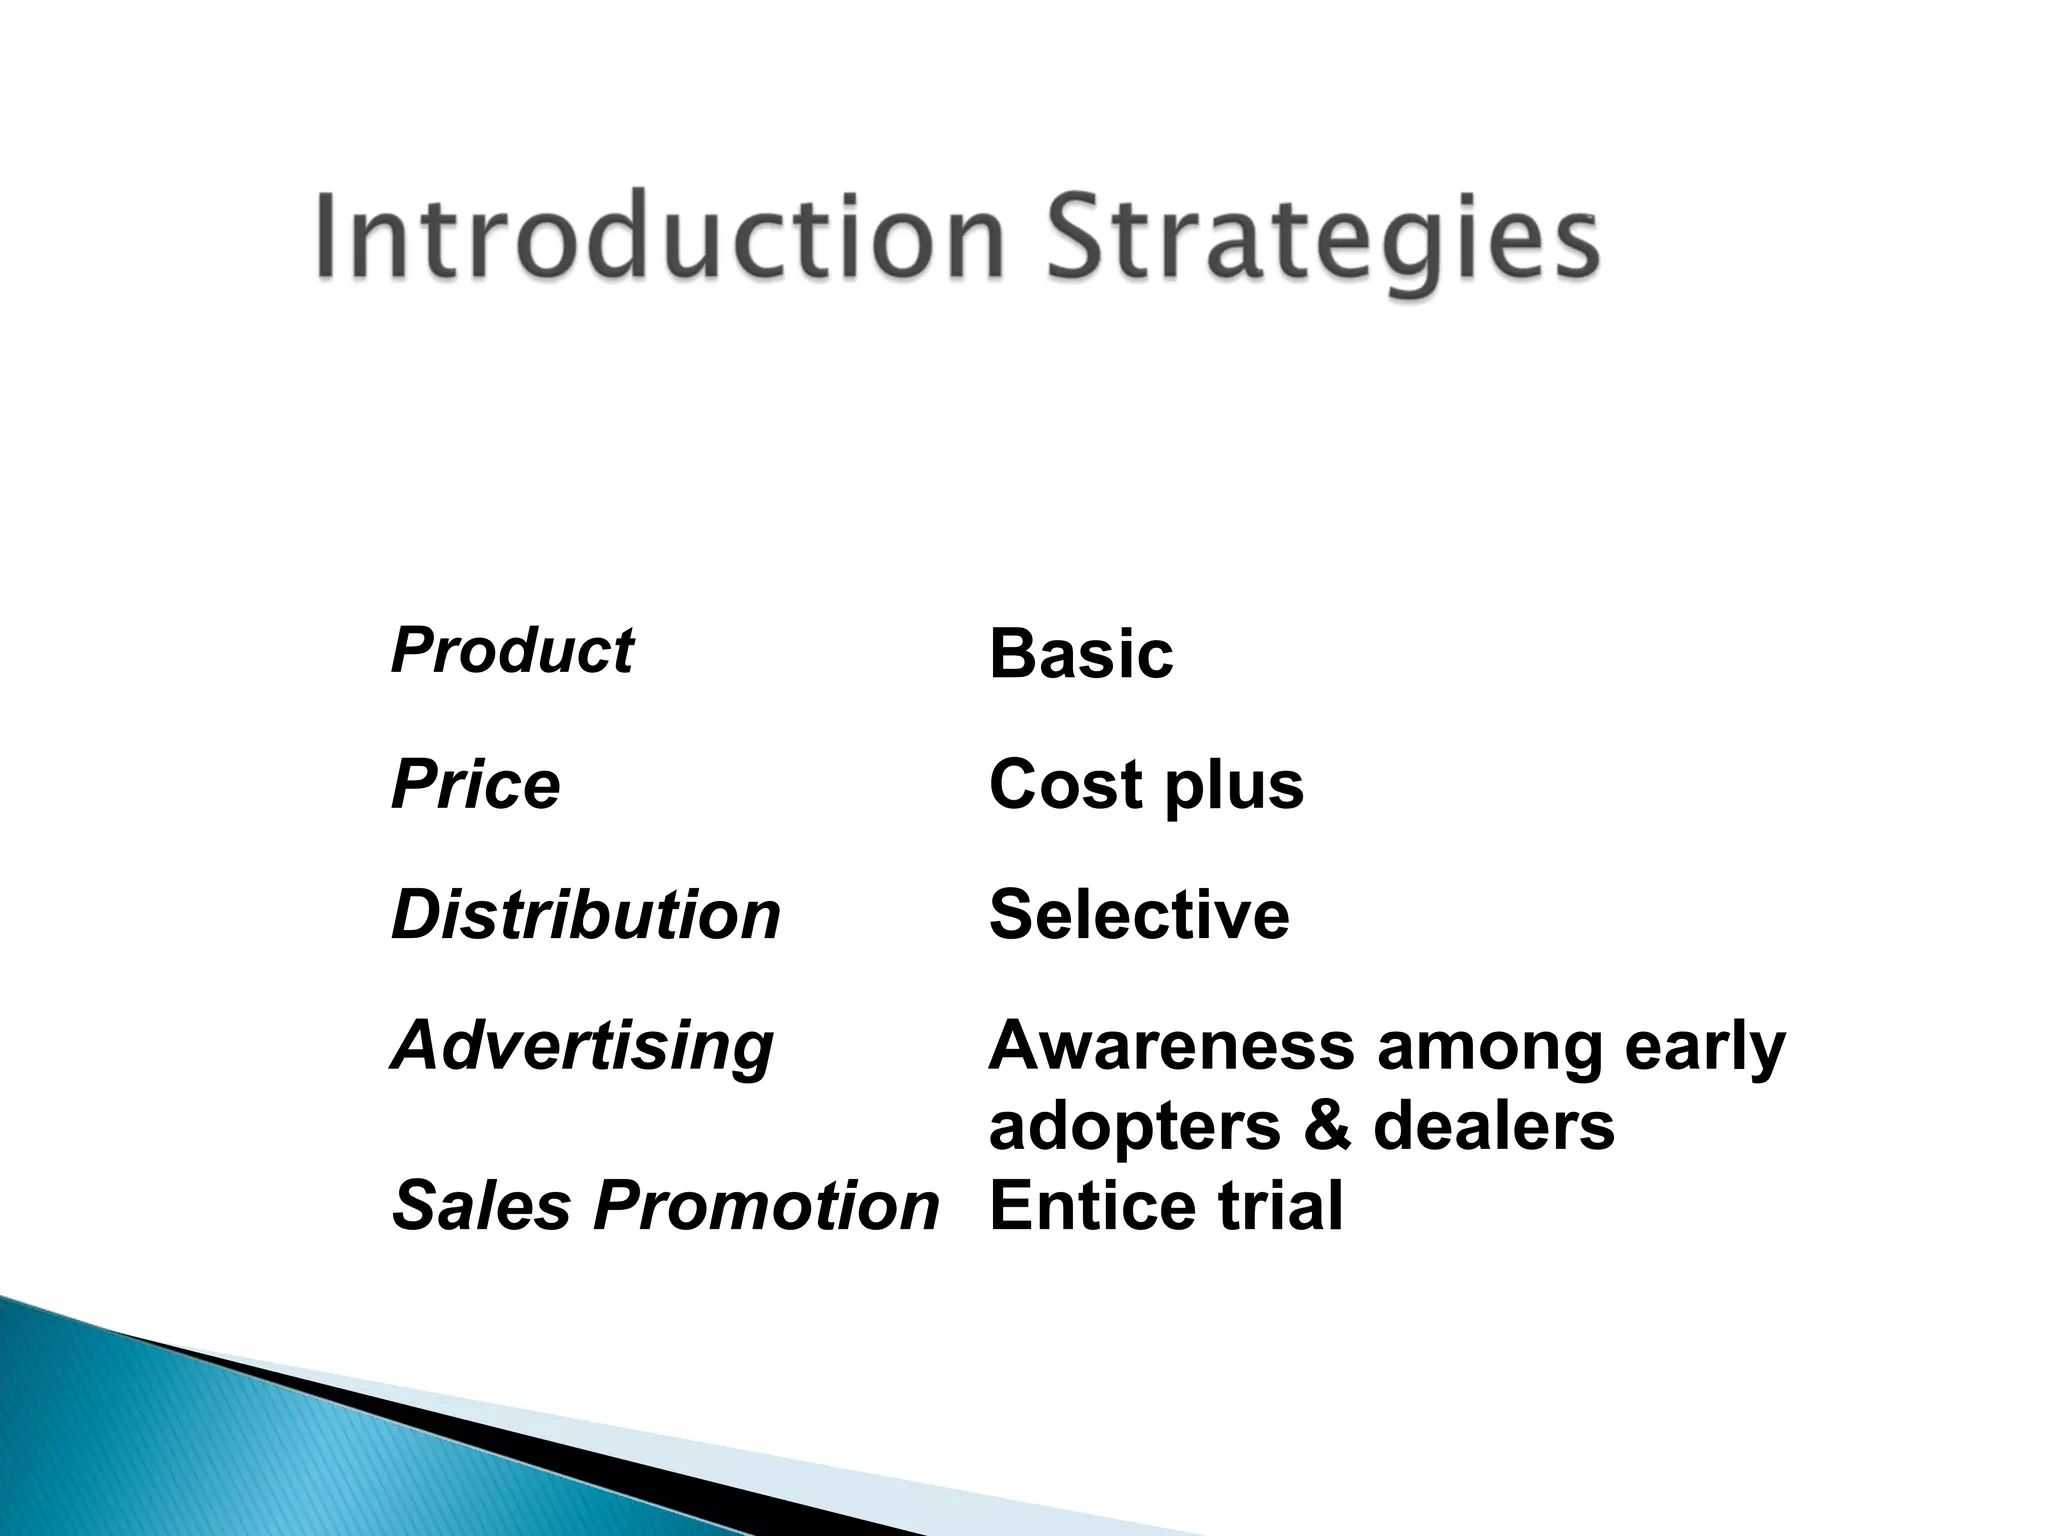
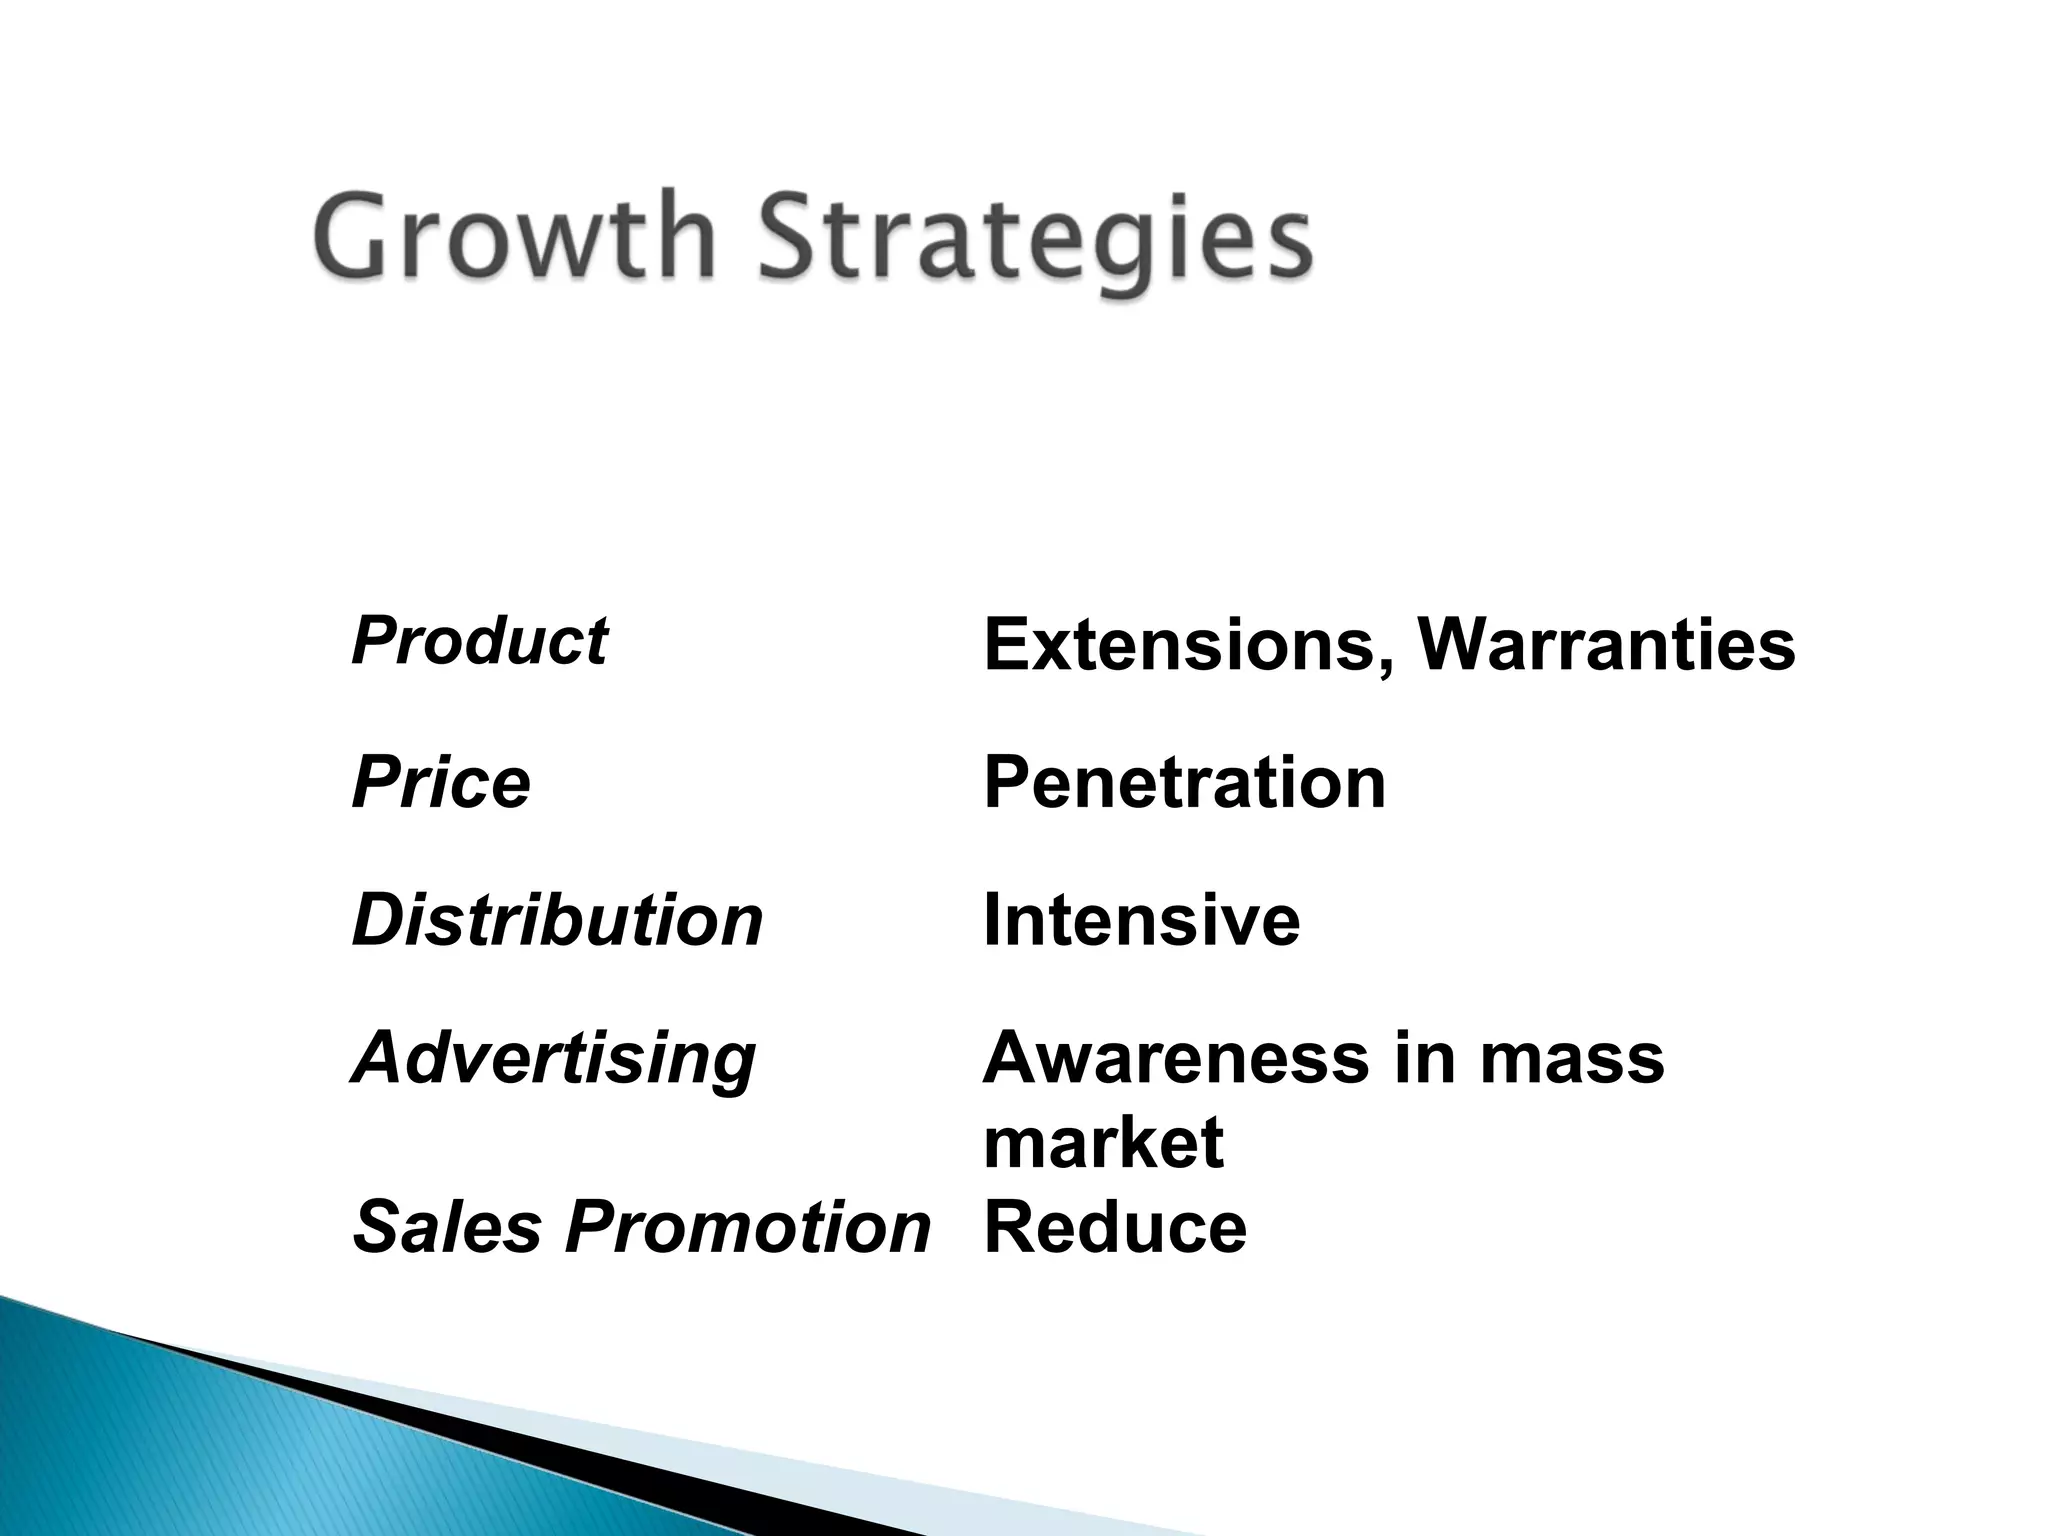
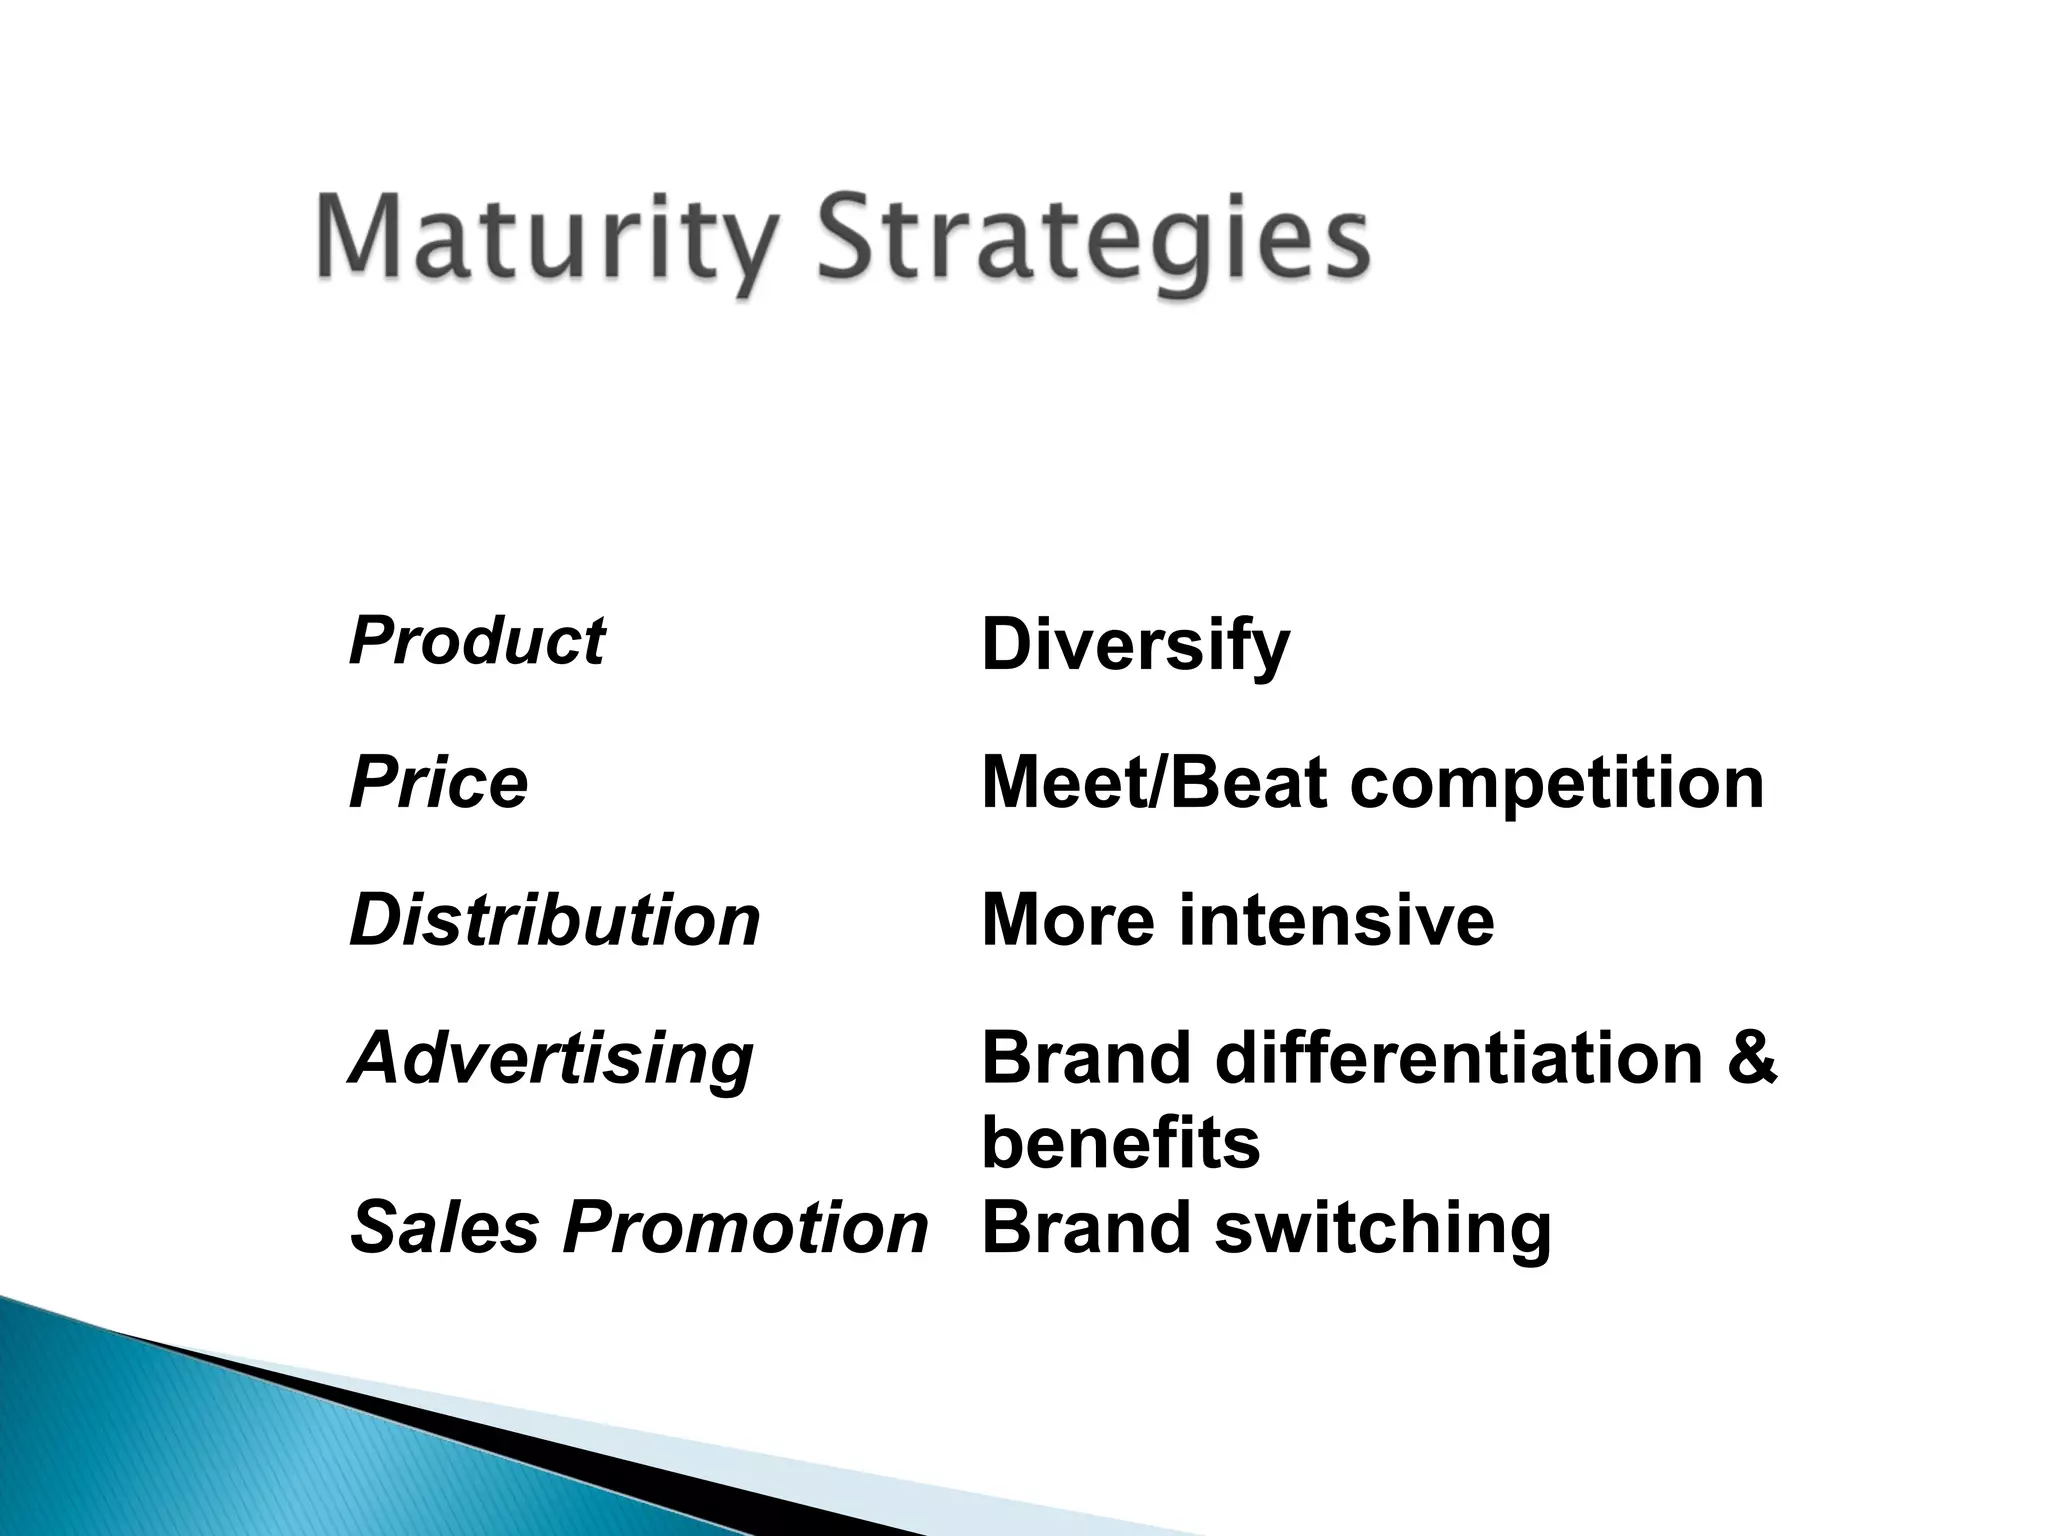
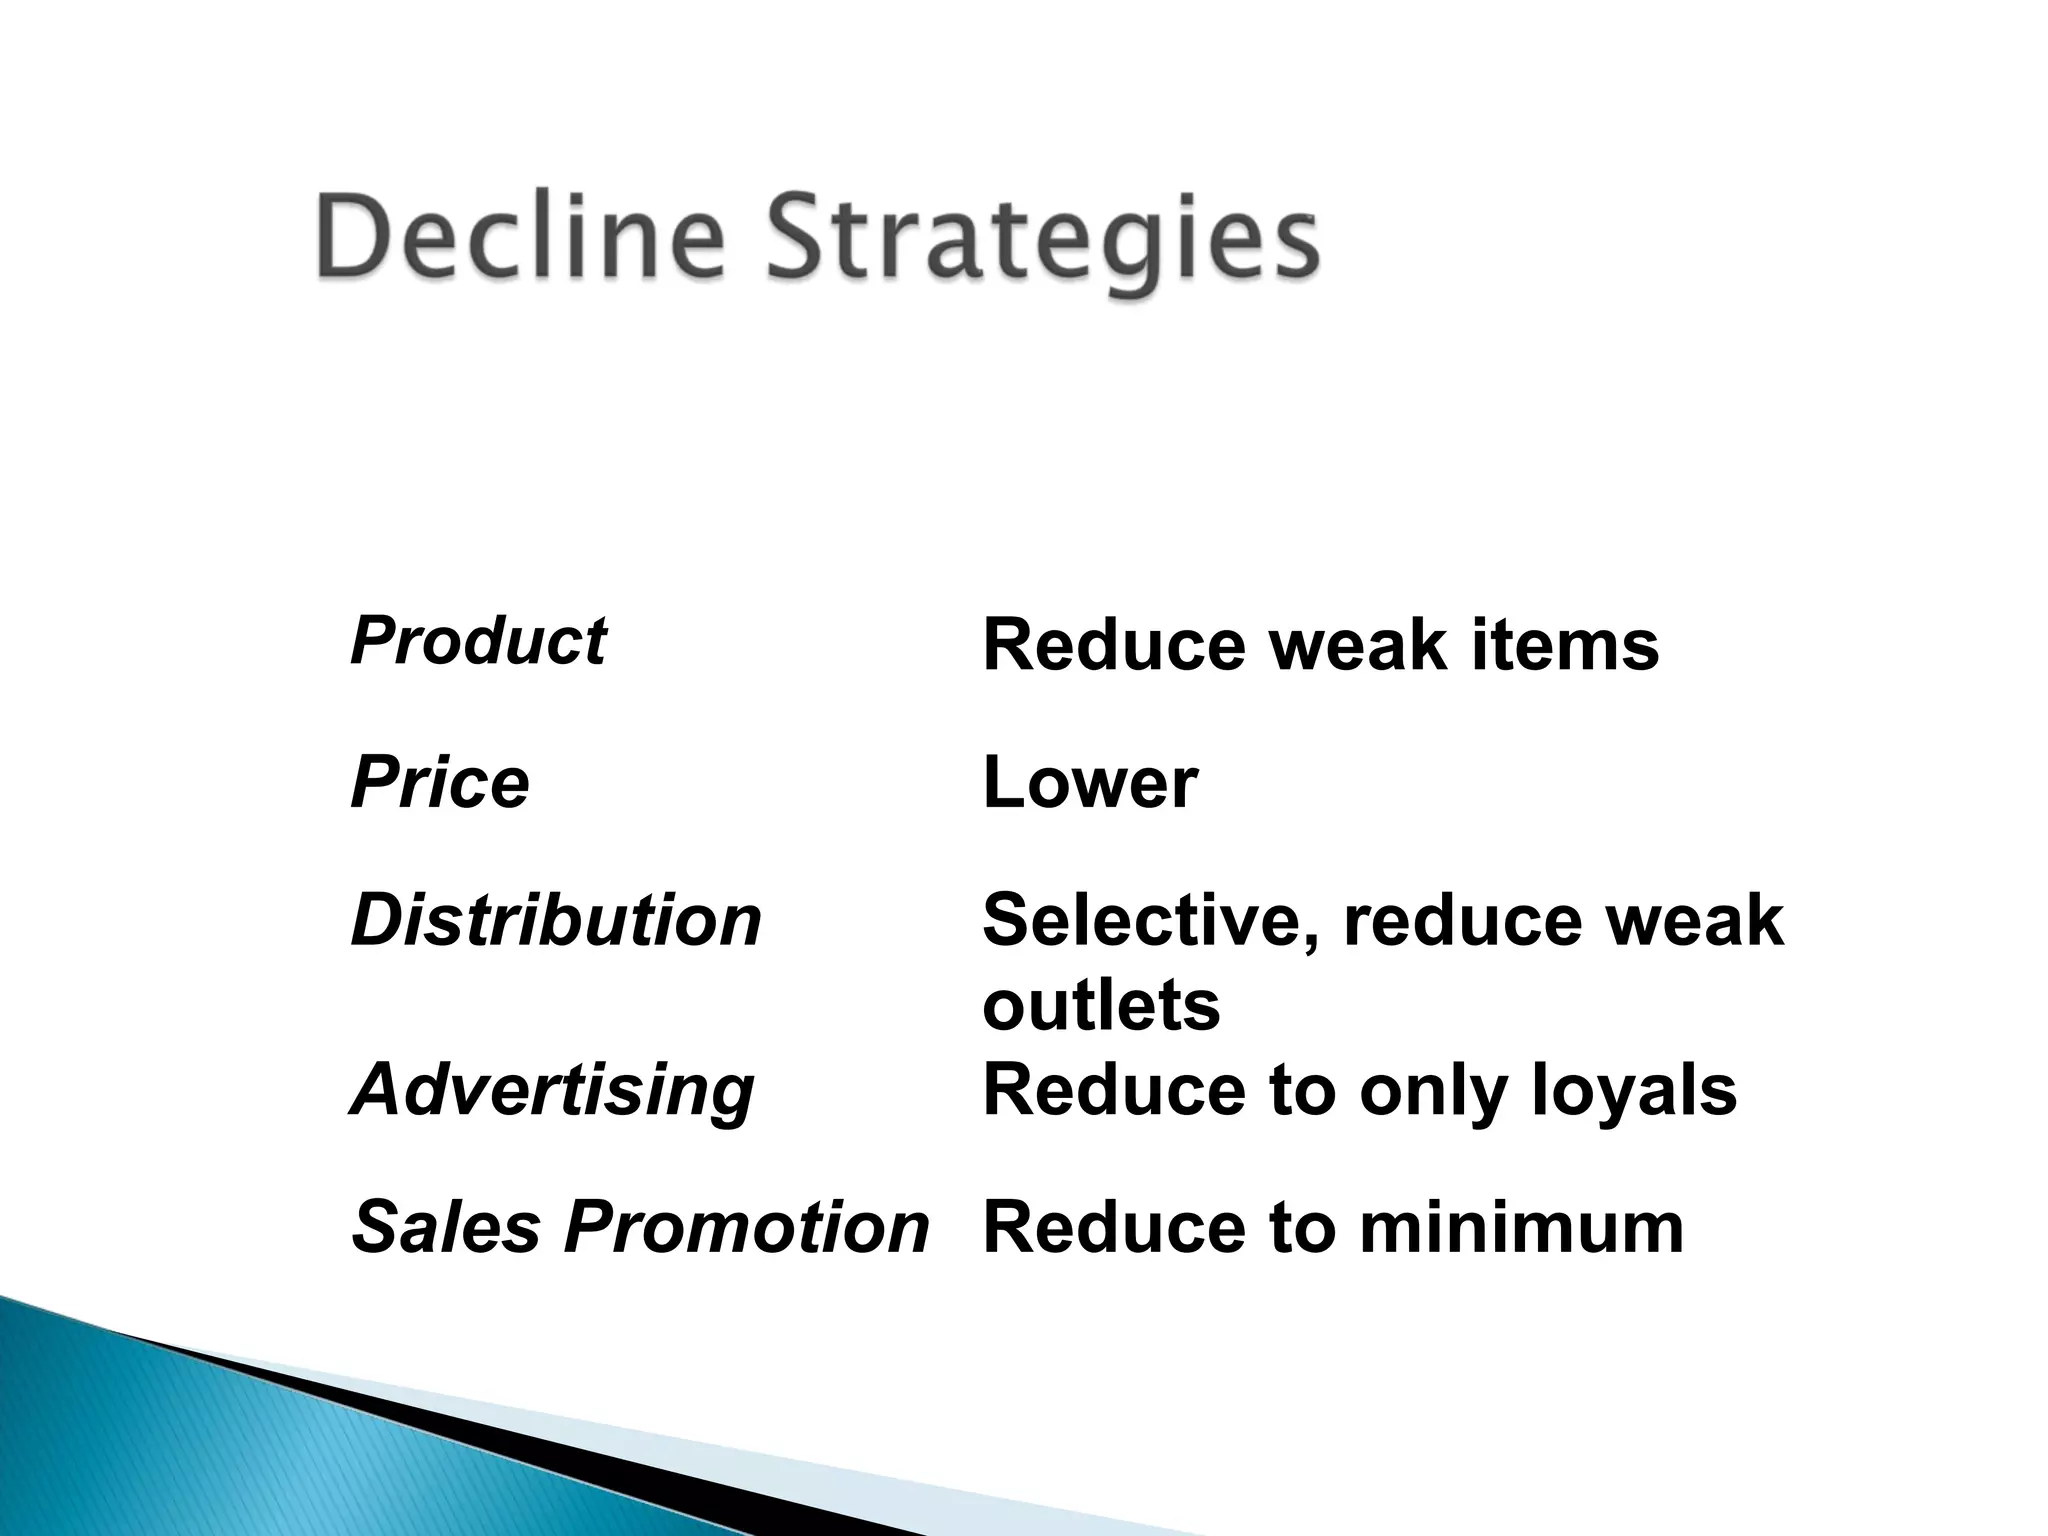
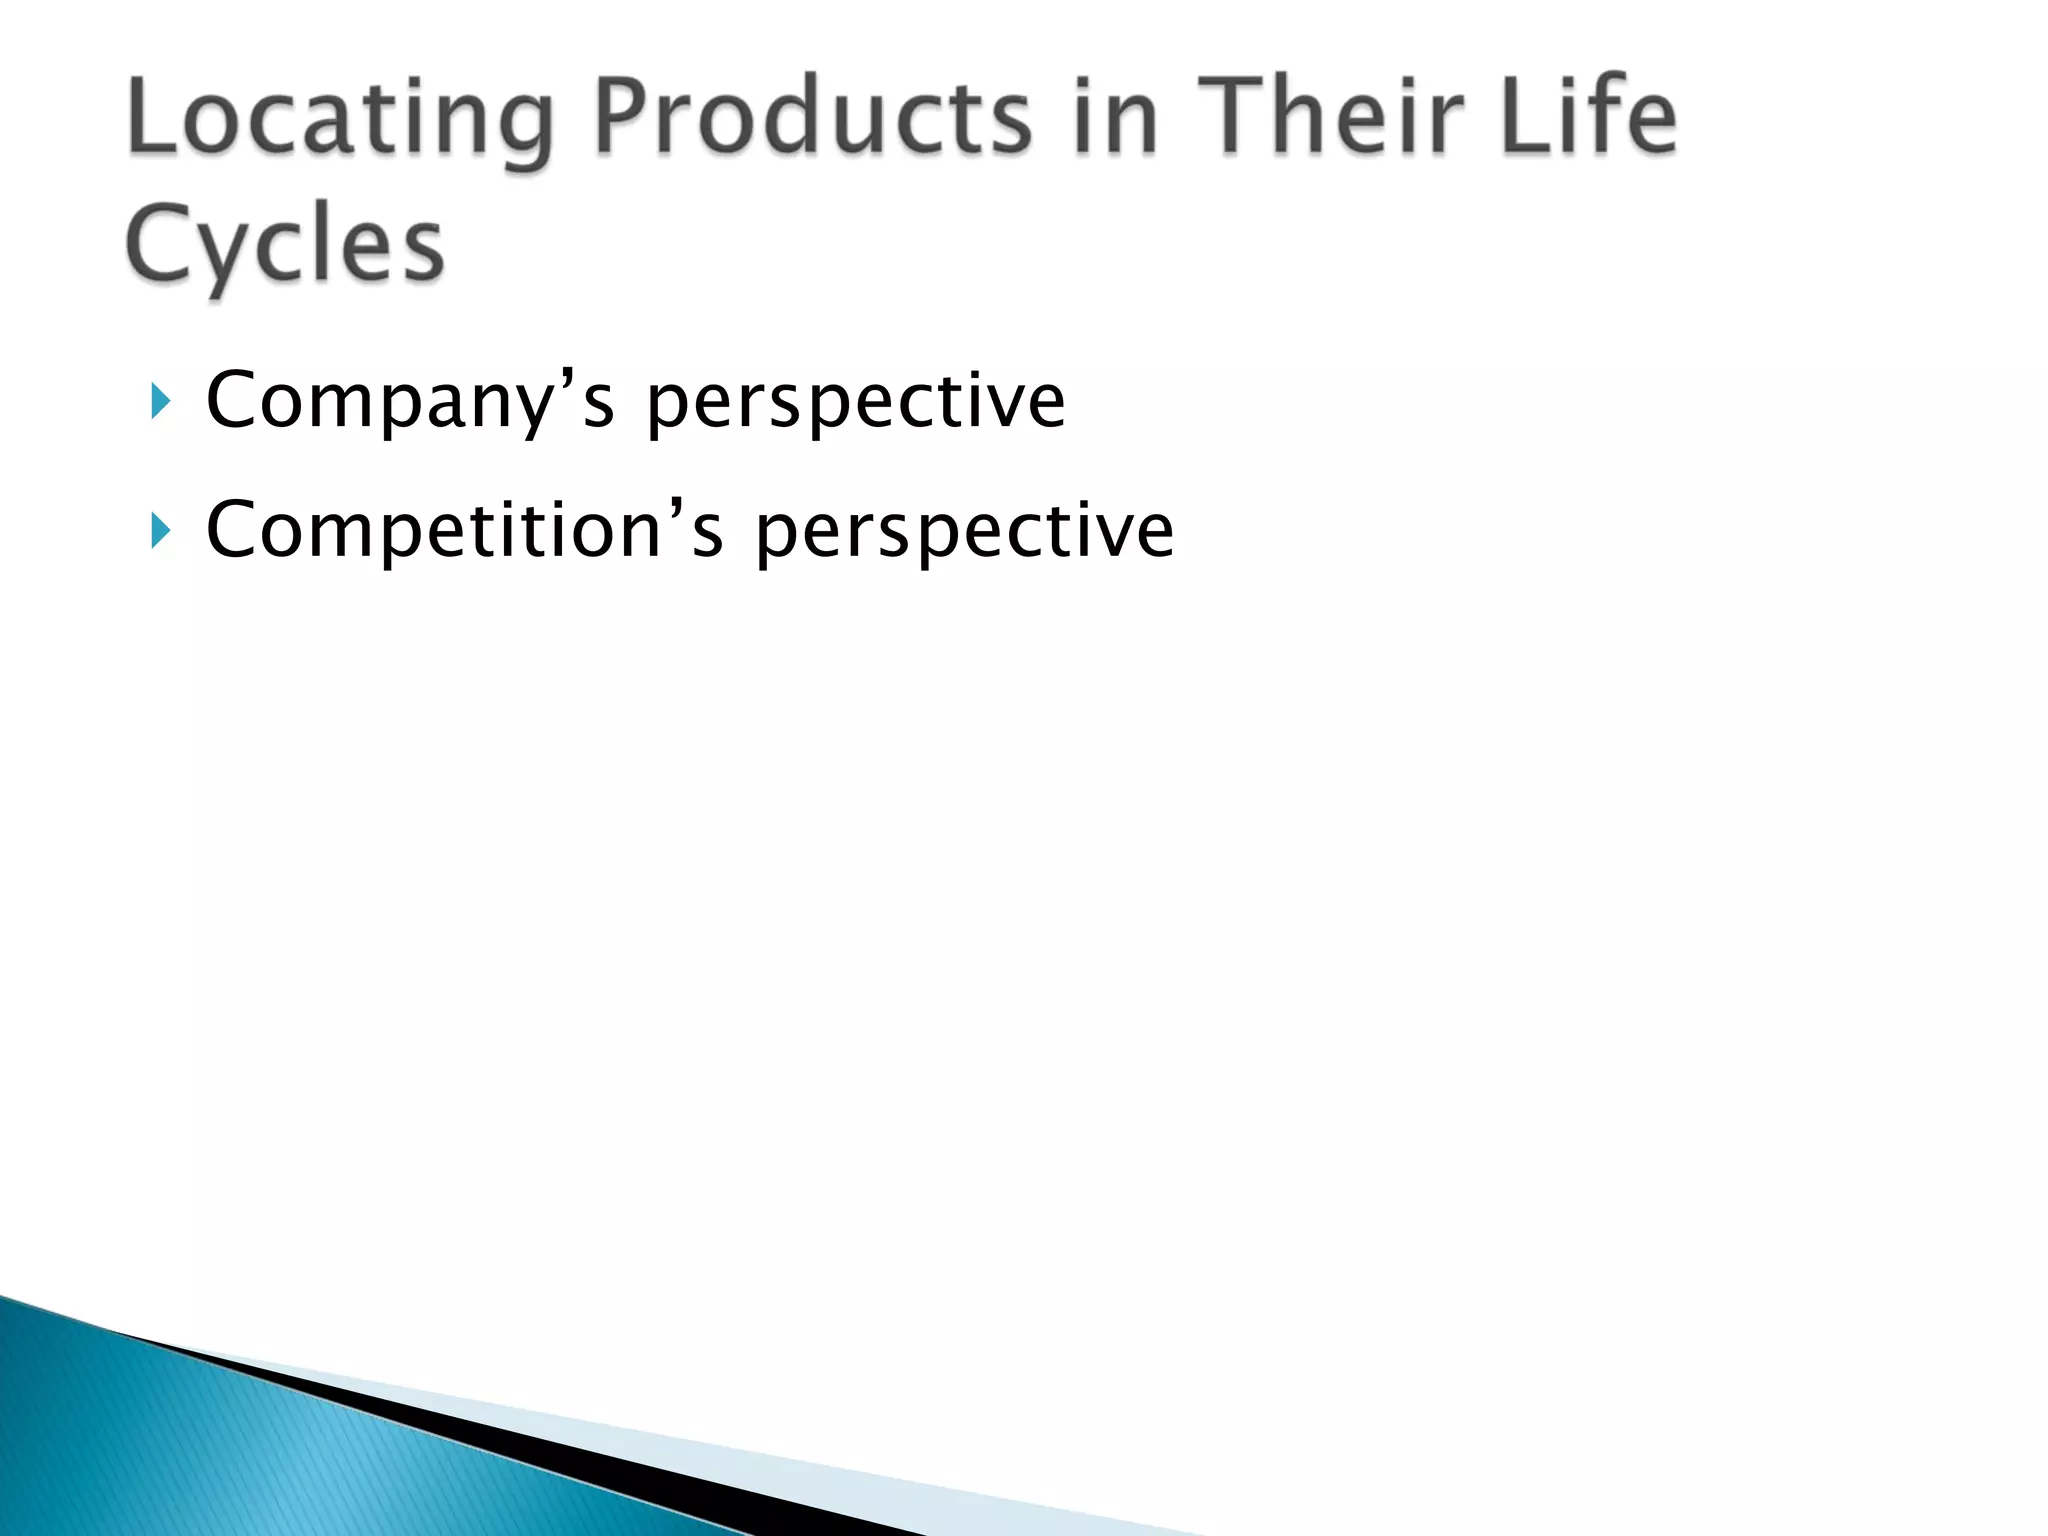
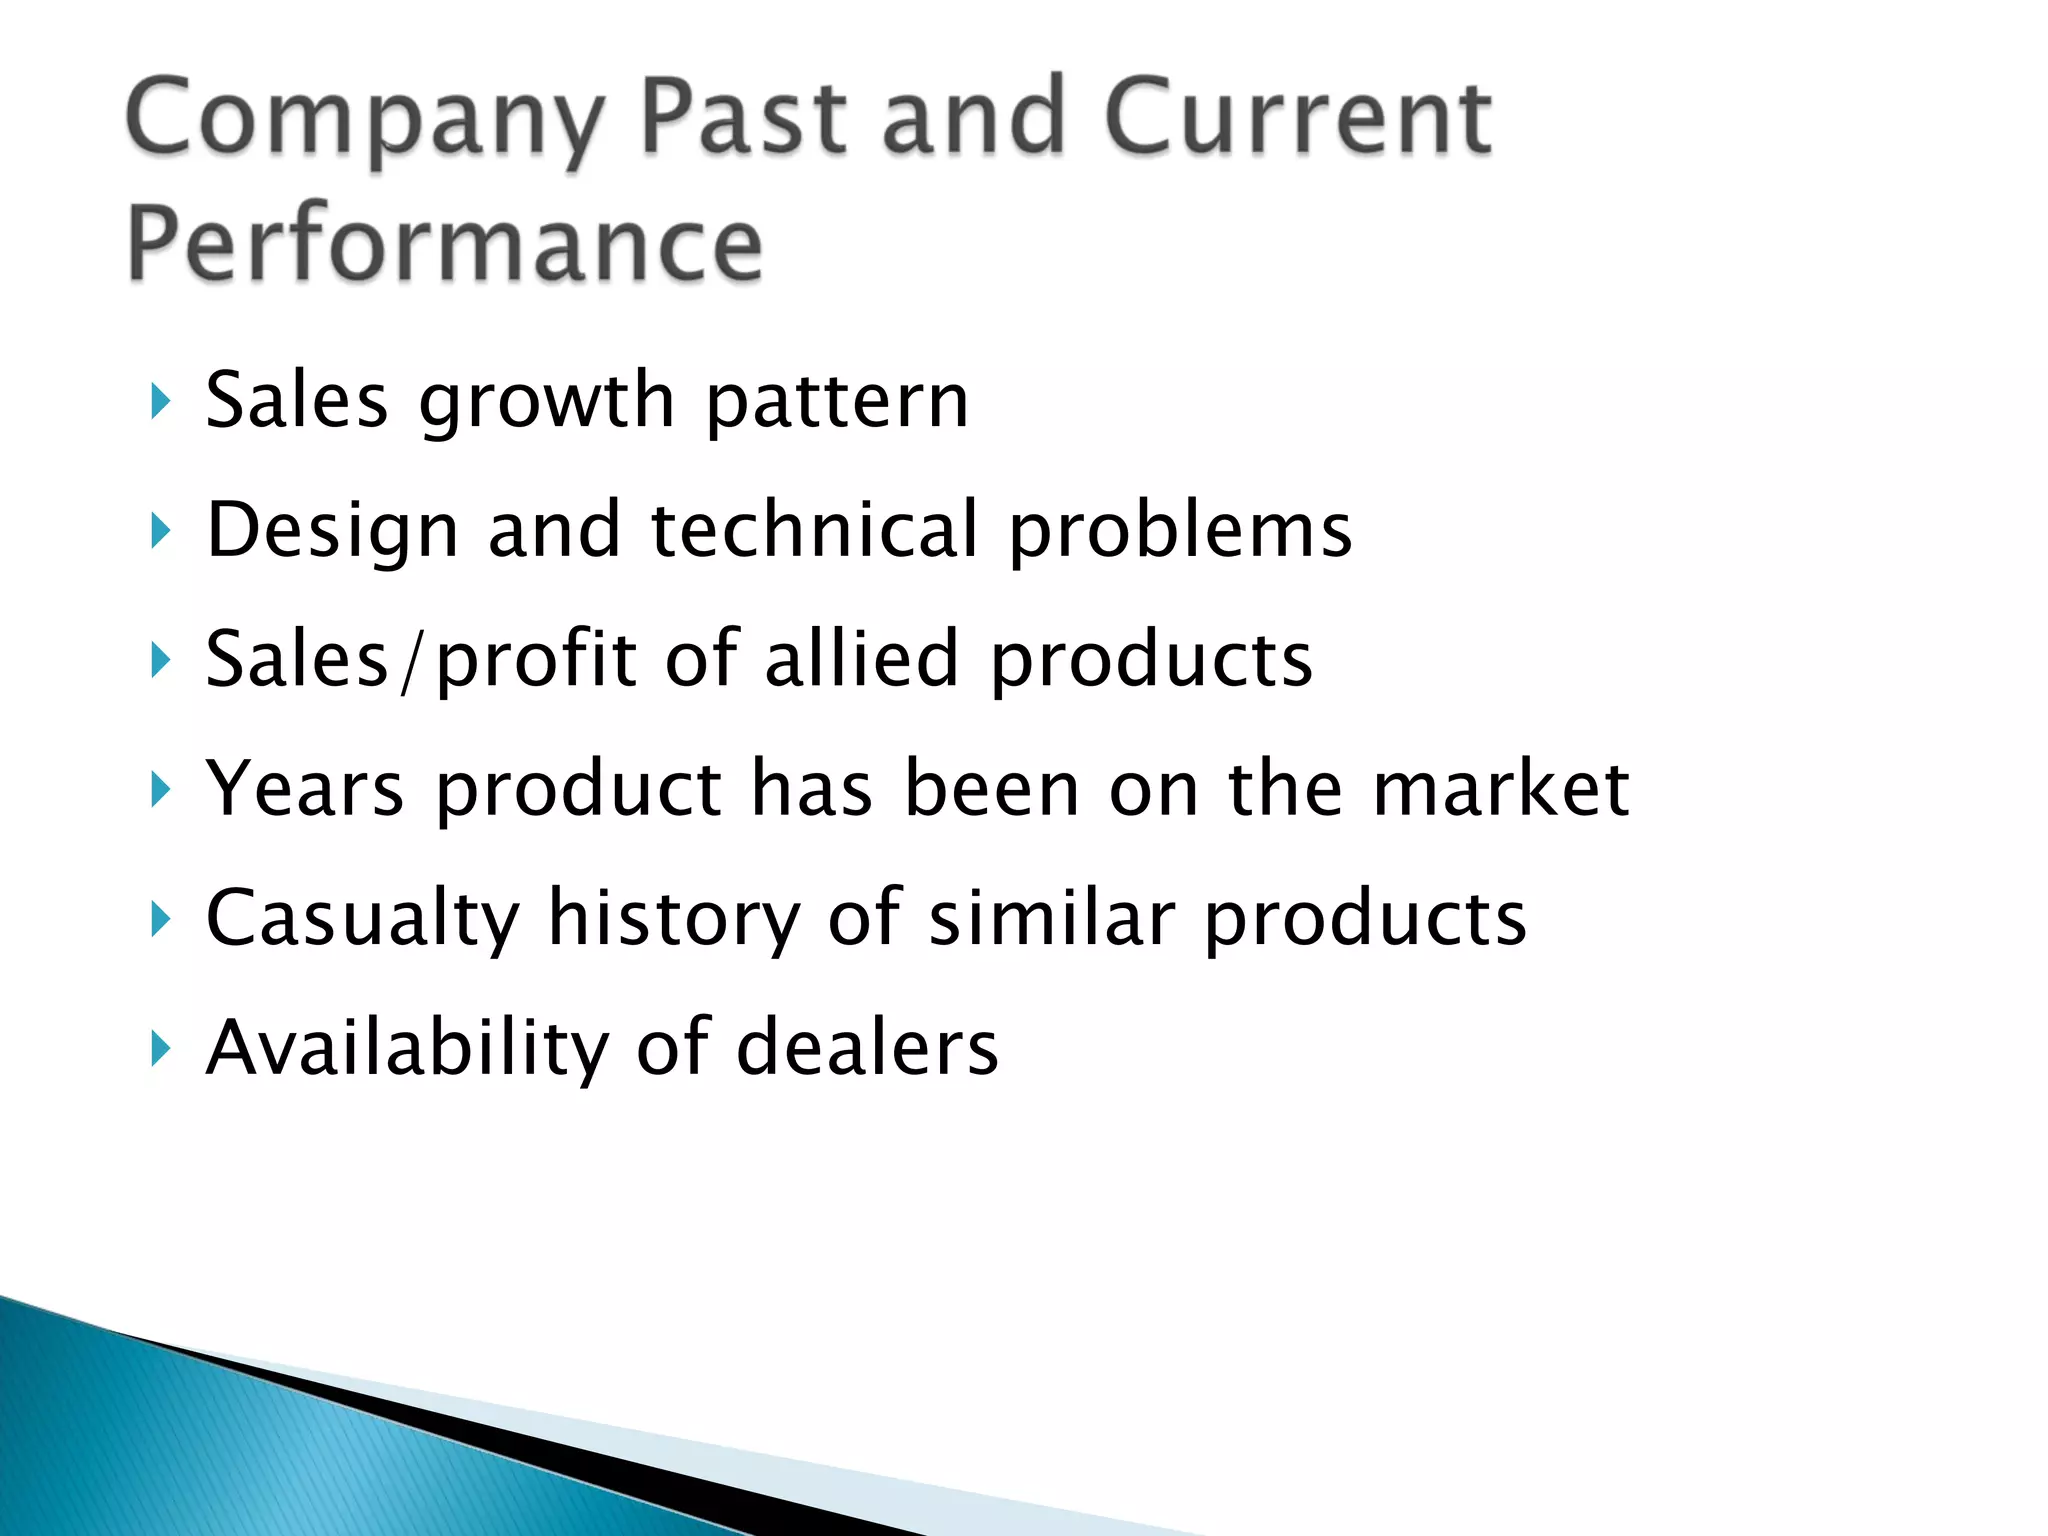
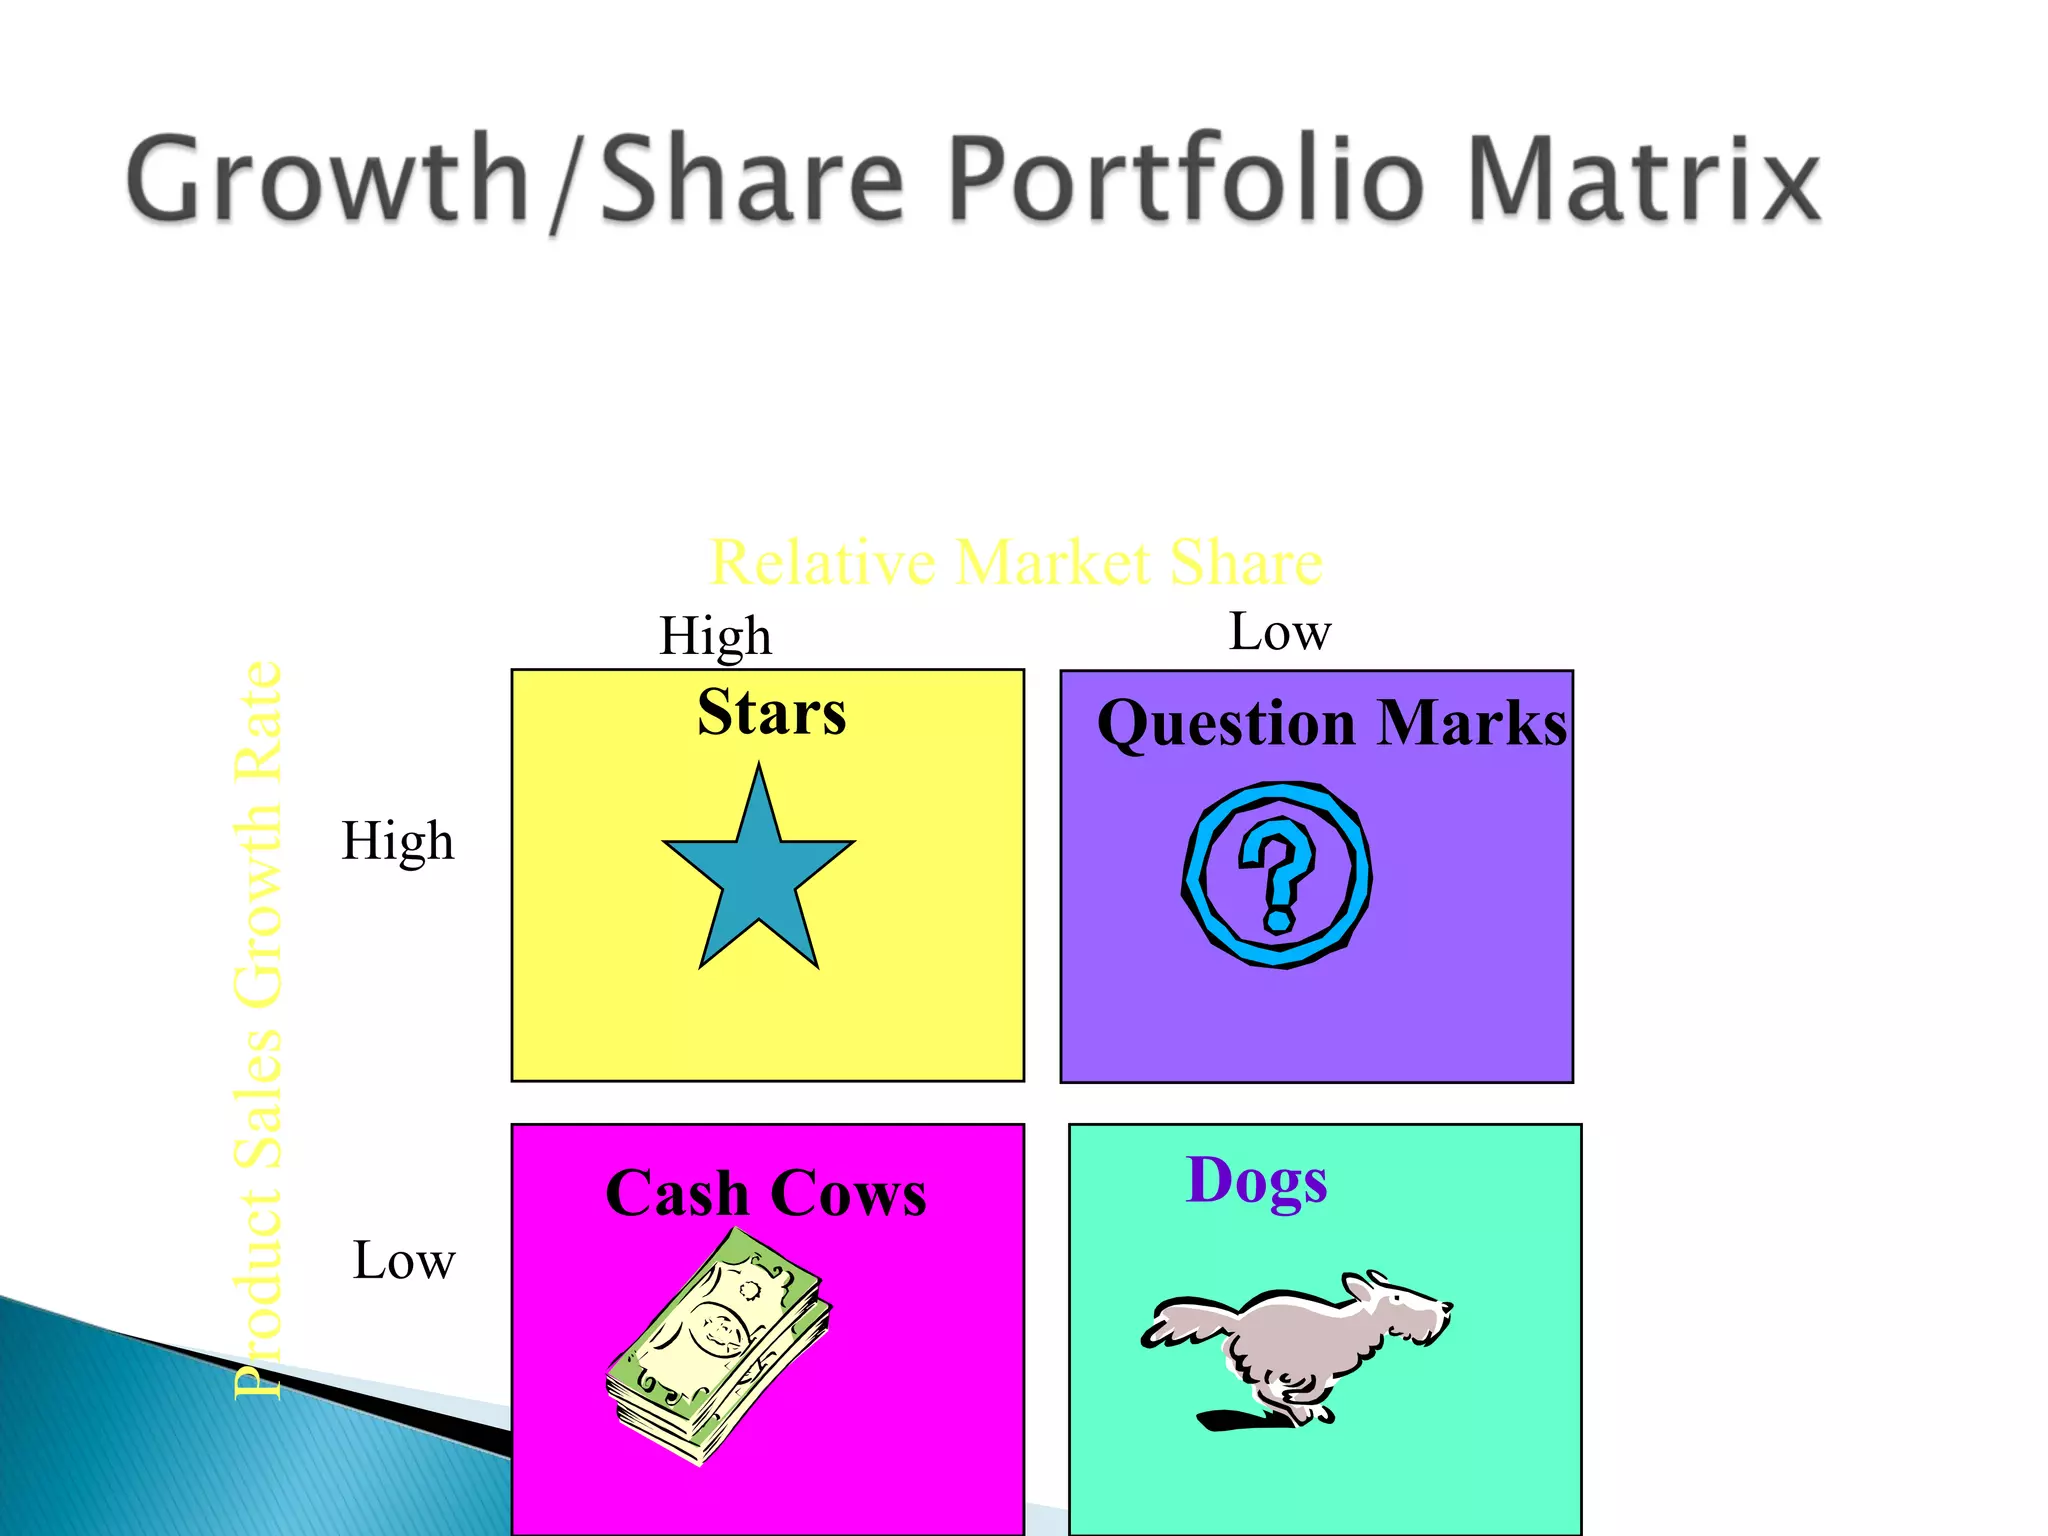
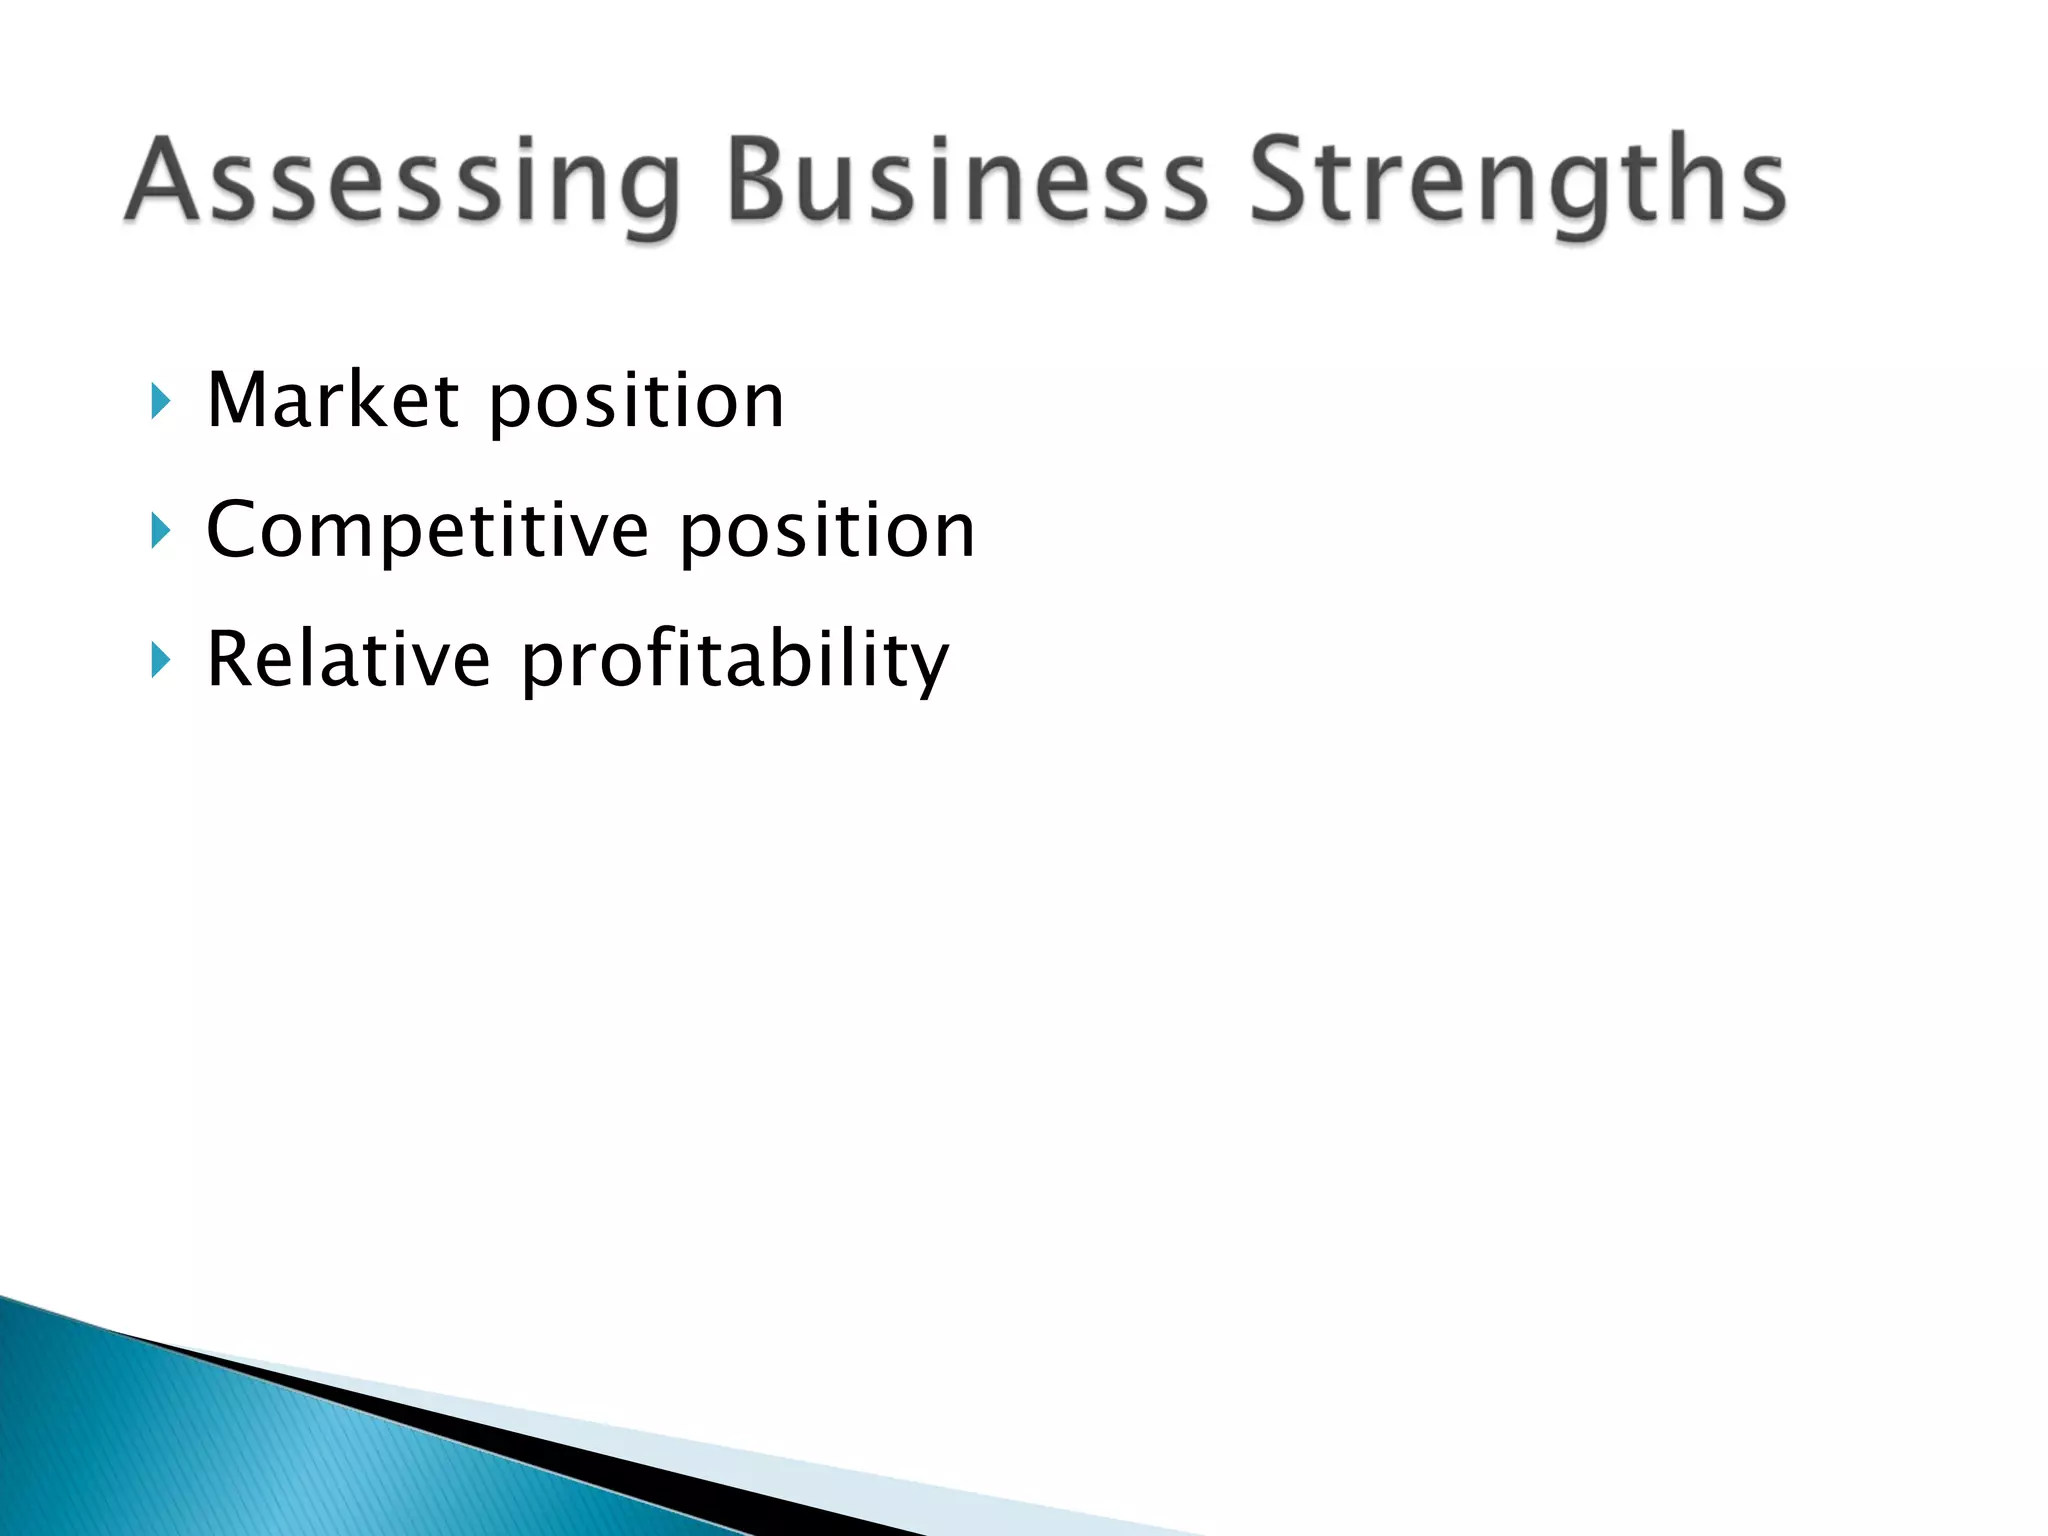
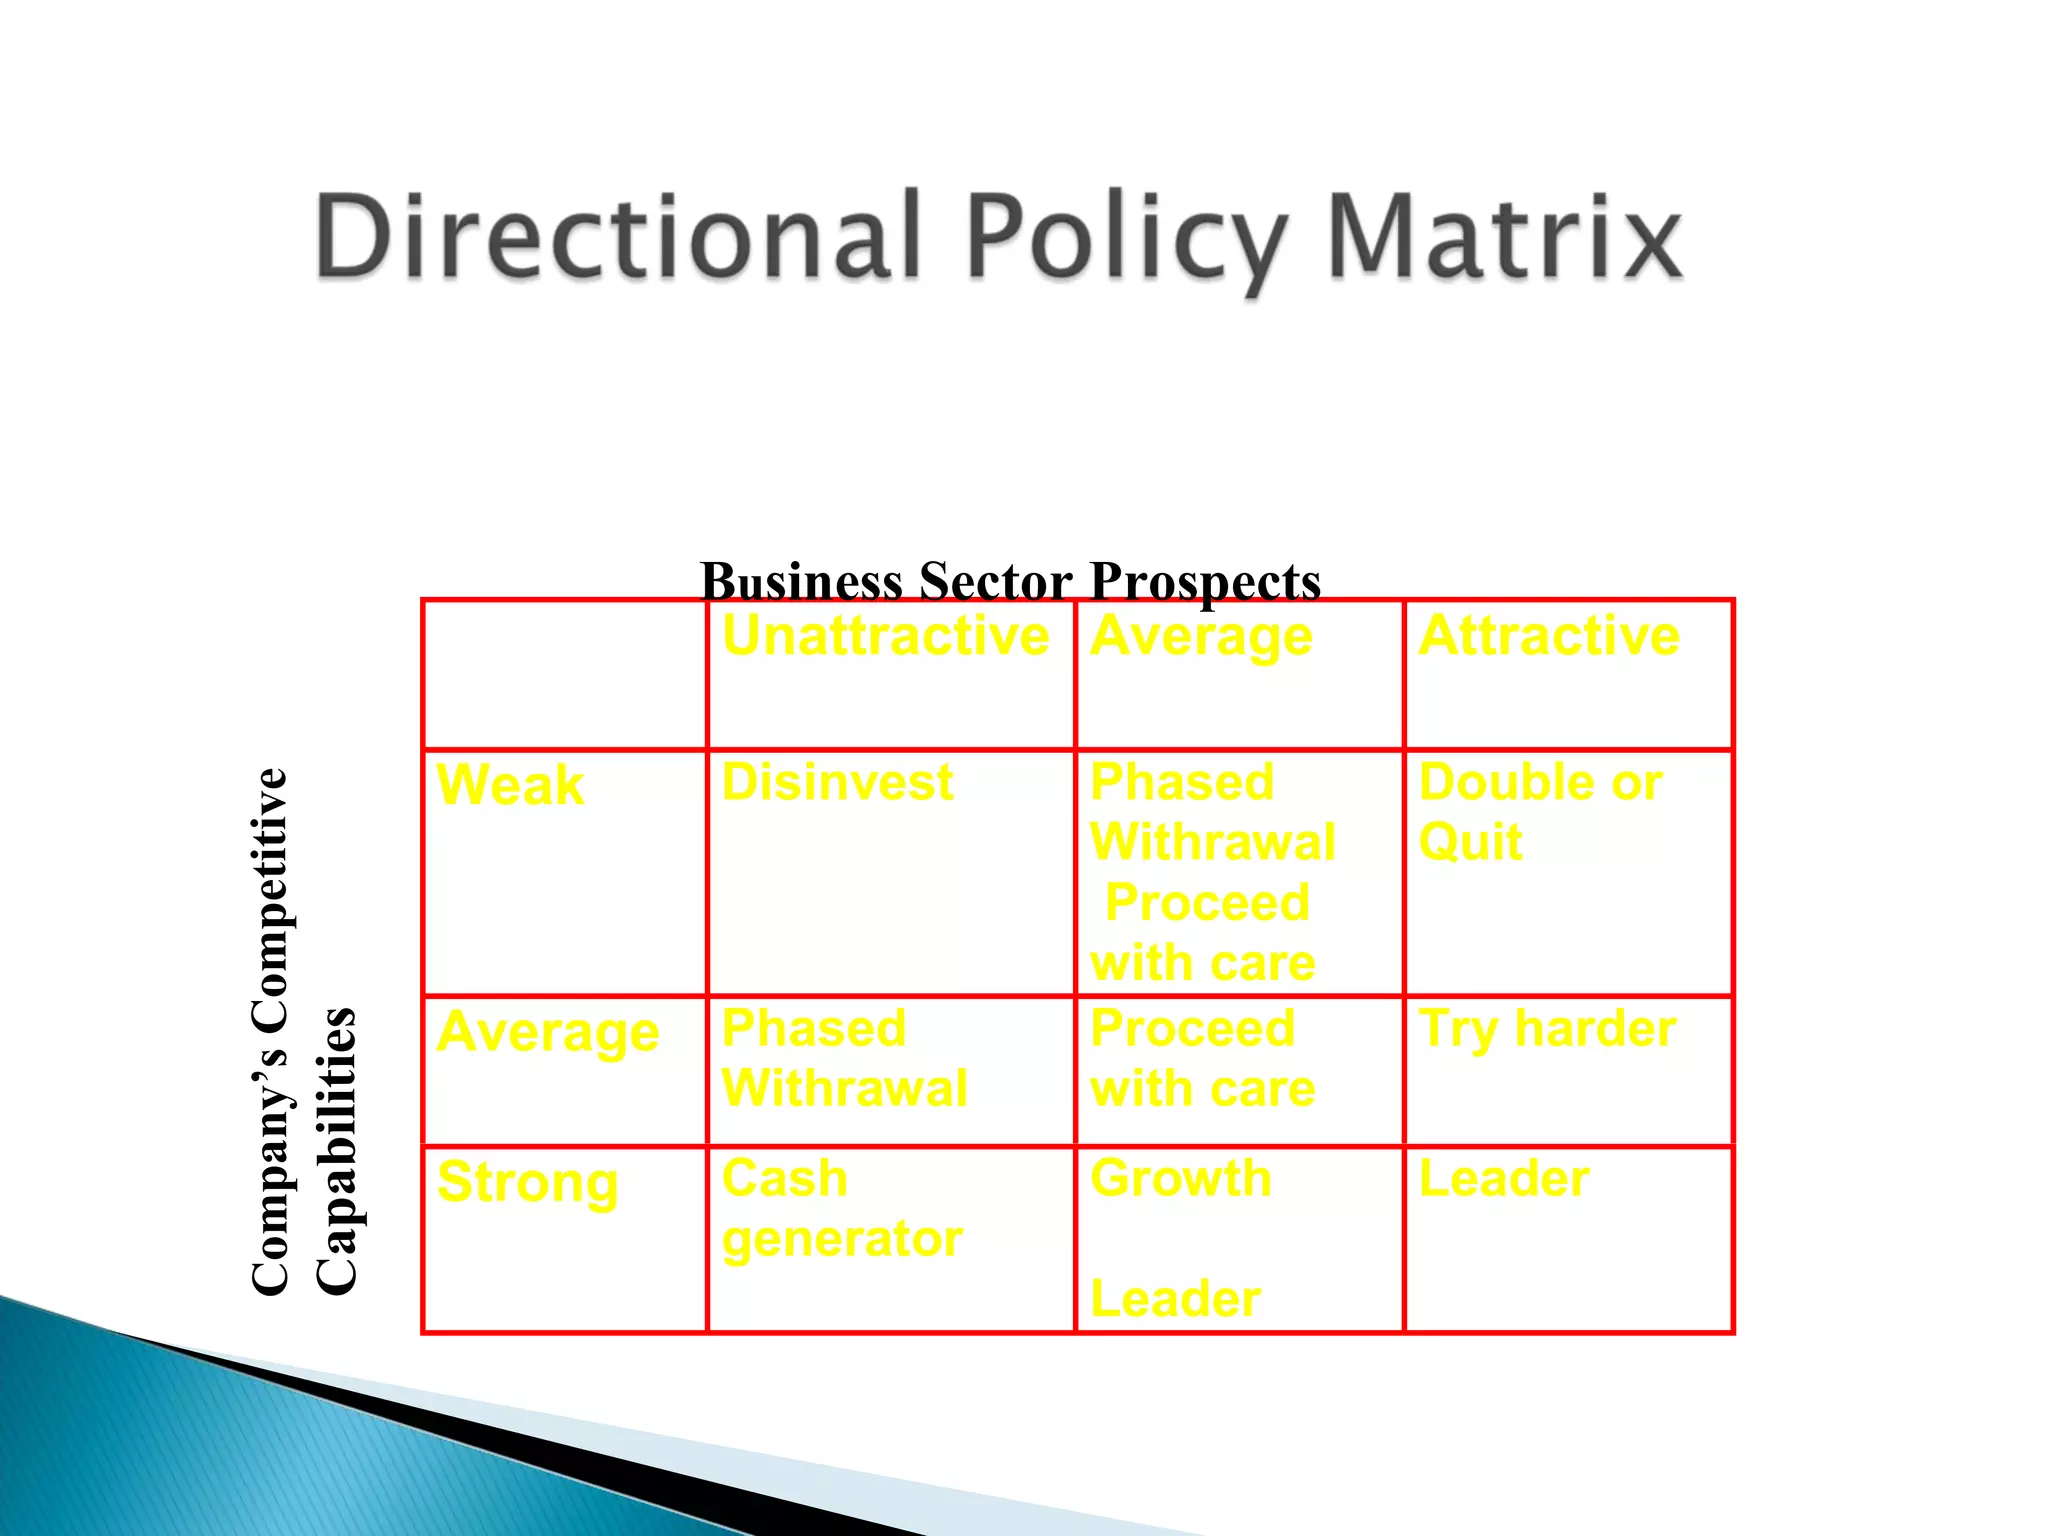
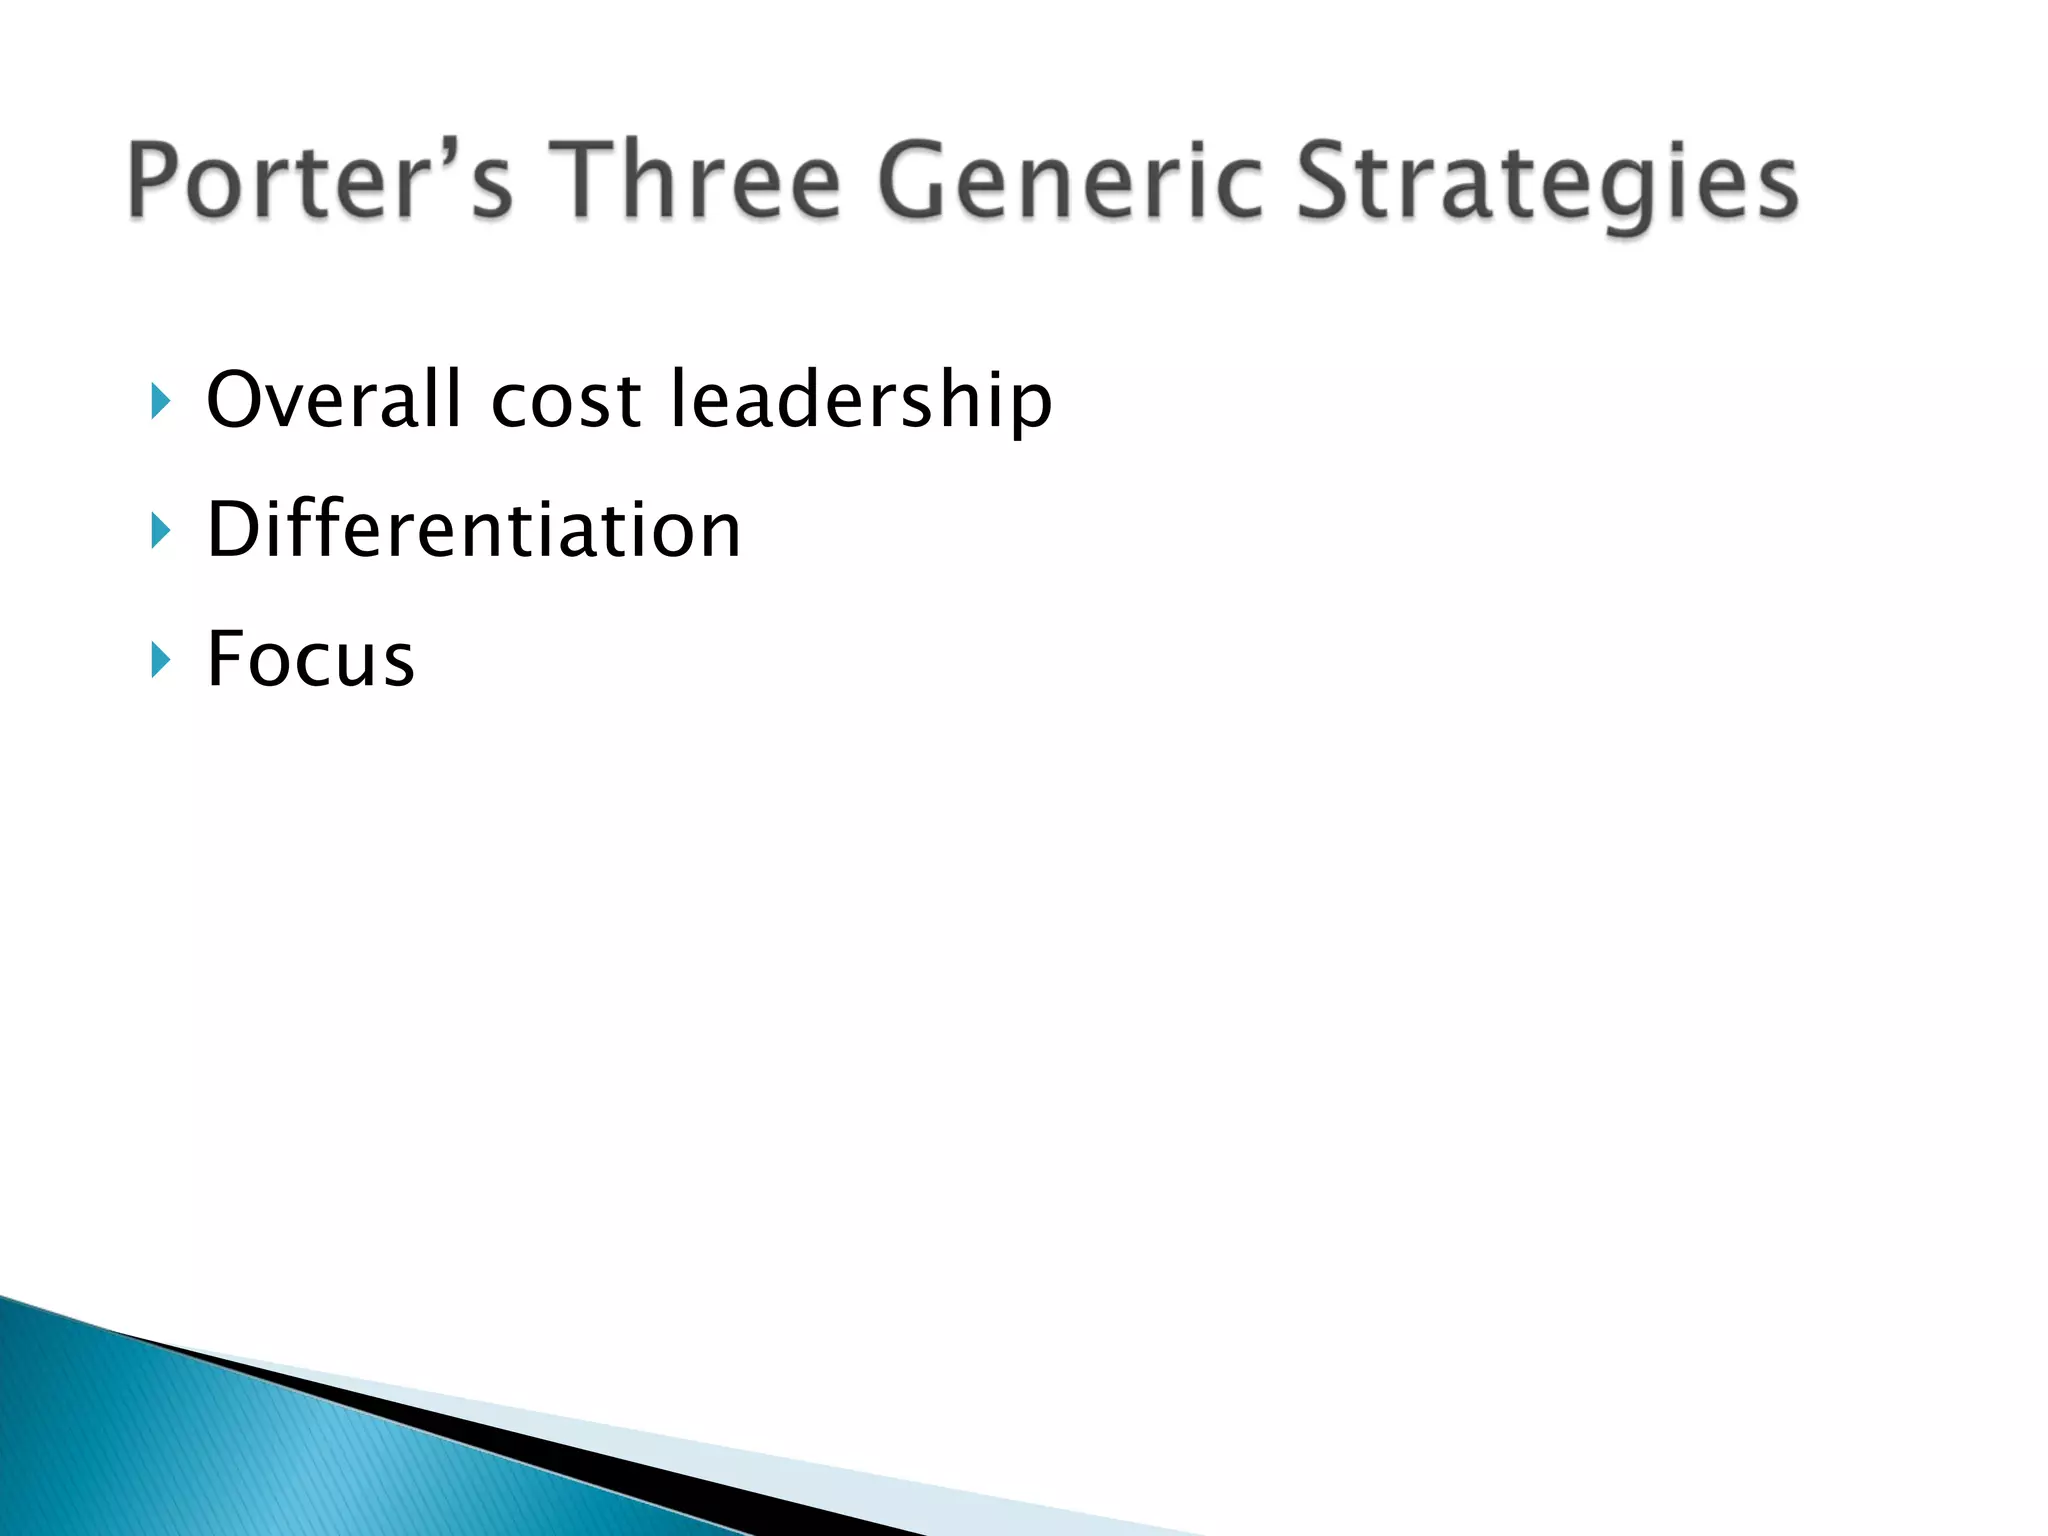
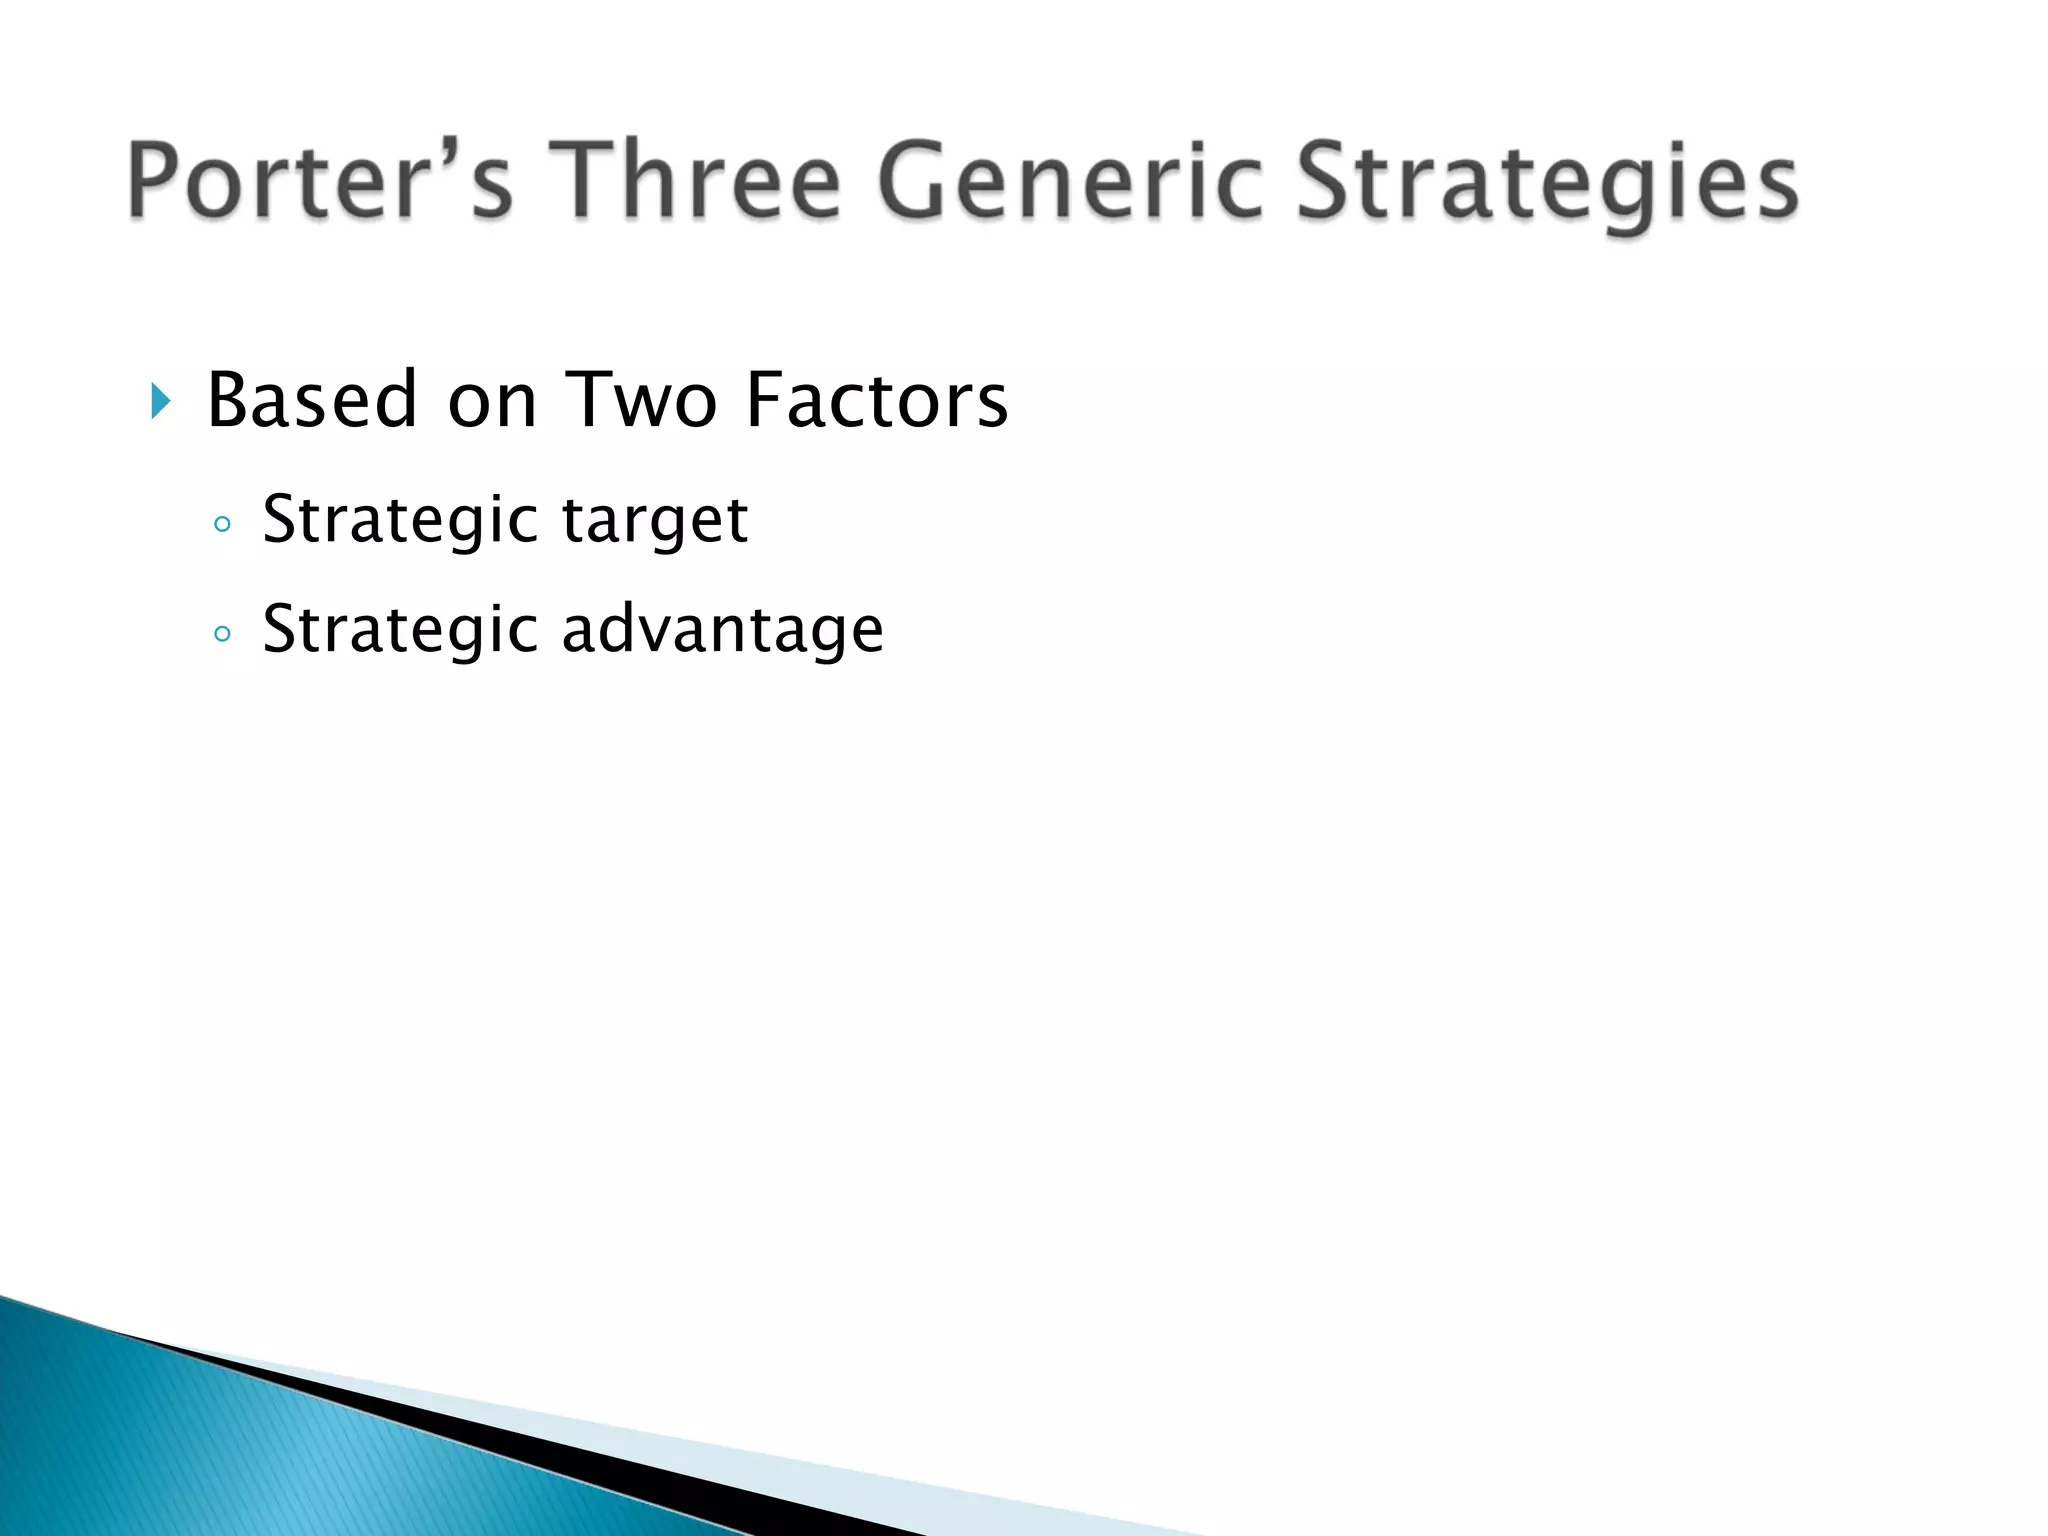
Product/Market Strategy SBU Strategy Strategy Evaluation Portfolio Analysis
1. Start with the present. Predict momentum of the business over the planning period. 2. Forecast environment. 3. Modify prediction of momentum in light of the forecast of the environment. 4. Stop if predicted performance satisfies objectives, otherwise continue procedure. 5. Measure strengths and weaknesses of firm.
6. Evaluate difference between yours and competitive marketing strategies. 7. Conceive more effective marketing strategies. 8. Evaluate risks, competitive response, potential payout of new marketing strategy. 9. Stop if new strategy appears satisfactory. 10. Otherwise broaden definition of present business and repeat steps 7, 8, 9. Look at other products that can be supplied to market.
11. Continue step 10 until:  knowledge of new area becomes thin cost of studying new area becomes too expensive prospects of finding a competitive opportunity become remote. 12. Lower the objectives, if necessary.
Examine key variables Refer to current status of product/market Define alternative strategies
Evaluate Profit payoff Investment costs Feasibility Risk Choose preferred strategy
Operational excellence Product leadership Customer Intimacy Combines one or more areas of the marketing mix. Supporting strategies may be used. Reflects the strengths of the firm. Formulated around the critical variables for each segment
Searching for new ways to compete Operational excellence Product leadership Customer Intimacy
Strategic Direction Distribution No-hassle service Systems Standard operating procedure Organization Central authority Finite empowerment Corporate Culture Predictable One-size-fits-all
Strategic Direction Ideas to Products Skillful marketing Systems Rewards innovation New product success Organization Ad hoc, Organic Flexible, Changes Corporate Culture Experimental Out of box thinking
Strategic Direction Provide solutions Improve customer’s business Systems Measures cost of service Customer loyalty Organization Empowerment Close to customer Corporate Culture Flexible Have it your way
Informed opportunism Direction and empowerment Friendly fact, congenial controls Different mirror Teamwork, trust, politics, power  Stability in motion Attitudes and attention Causes and commitment
Embryonic Growth Maturity Aging
Growth rate Industry potential Product line Number of Competitors
Market share stability Purchasing patterns Ease of entry (not due to capital considerations) Technology
Rapid sales growth Changing technology Fragmented and shifting Market shares High investments Not profitable Gaining position in developing market
Rapid growth in sales Customers, shares, technology gaining recognition Easy entry Capital borrowers Low to good earnings
Low volatility of market shares Competitors, technology, customers established Growth is relatively high High earnings Produce cash
Falling demand, limited growth Shrinking number of competitors Little product line variety Little investment
Dominant Strong Favorable Tenable Weak Nonviable
Controls strategy and/or behavior of competitors Has wide range of strategic options Is independent of competitors’ actions
Take independent stance or action Acting does not endanger long-term position Can maintain long-term position in face of competitors’ actions
Strengths that are exploitable Higher than average ability to improve position If in a niche, holds commanding position relatively secure from attack
Sufficient potential and strengths to warrant continuation in business Unlikely to improve position Marginally profitable In a niche, is profitable, but vulnerable
Unsatisfactory performance Strengths that may lead to improvement Has characteristics of stronger position, but suffers from past mistakes or current weaknesses Short-term--must change
Currently unsatisfactory performance Few strengths that may lead to improvement May take years to die
Competitive Position and Stages of Industry Maturity Grid suggests strategies associated with each position
Suitability Validity Feasibility Internal consistency Vulnerability Workability Timing
Suitability: Is there a sustainable competitive advantage? Validity: Are assumptions realistic? Feasibility: Does firm have the skills, resources, and commitments?
Internal consistency: Does strategy hang together? Vulnerability: What are the risks and contingencies?
Workability: Can we retain our flexibility? Timing: What is the appropriate time horizon?
 
Conceptual framework for generating strategic alternatives for different product/markets


Company’s perspective Competition’s perspective
Sales growth pattern Design and technical problems Sales/profit of allied products Years product has been on the market Casualty history of similar products Availability of dealers
Profit history Ease of entry Extent of initial investment Number of competitors Number of competitors left the industry Life cycle of the industry Critical factors for success
Stars Cash Cows Question Marks Dogs Product Sales Growth Rate Relative Market Share High Low Low High
Product Sales Growth Rate Relative Market Share High Low Low High Introduction Growth Maturity Decline


Stars Cash Cows Question Marks Dogs Product Sales Growth Rate Relative Market Share High Low Low High Success Sequence
Stars Cash Cows Question Marks Dogs Product Sales Growth Rate Relative Market Share High Low Low High Disaster Sequence
Stars Cash Cows Question Marks Dogs Product Sales Growth Rate Relative Market Share High Low Low High
Overinvesting in low-growth segments Underinvesting in high-growth segments Misjudging segment growth Not achieving market share Losing cost effectiveness Not uncovering emerging high-growth segments Unbalanced business mix
BUSINESS STRENGTH INDUSTRY ATTRACTIVENESS Harvest/ Divest Selectivity/ Earnings Invest/ Grow
Market Size Market growth Industry profit Cycles Inflation recovery International market importance
Market position Competitive position Relative profitability
B u siness Sector Prospects Company’s Competitive  Capabilities
Overall cost leadership Differentiation Focus
Based on Two Factors Strategic target Strategic advantage
Understand the industry Choose competitive niche in which to dominate Do not go toe-to-toe with any competitor

Strategy formulation

  • 1.
  • 2.
    Product/Market Strategy SBUStrategy Strategy Evaluation Portfolio Analysis
  • 3.
    1. Start withthe present. Predict momentum of the business over the planning period. 2. Forecast environment. 3. Modify prediction of momentum in light of the forecast of the environment. 4. Stop if predicted performance satisfies objectives, otherwise continue procedure. 5. Measure strengths and weaknesses of firm.
  • 4.
    6. Evaluate differencebetween yours and competitive marketing strategies. 7. Conceive more effective marketing strategies. 8. Evaluate risks, competitive response, potential payout of new marketing strategy. 9. Stop if new strategy appears satisfactory. 10. Otherwise broaden definition of present business and repeat steps 7, 8, 9. Look at other products that can be supplied to market.
  • 5.
    11. Continue step10 until: knowledge of new area becomes thin cost of studying new area becomes too expensive prospects of finding a competitive opportunity become remote. 12. Lower the objectives, if necessary.
  • 6.
    Examine key variablesRefer to current status of product/market Define alternative strategies
  • 7.
    Evaluate Profit payoffInvestment costs Feasibility Risk Choose preferred strategy
  • 8.
    Operational excellence Productleadership Customer Intimacy Combines one or more areas of the marketing mix. Supporting strategies may be used. Reflects the strengths of the firm. Formulated around the critical variables for each segment
  • 9.
    Searching for newways to compete Operational excellence Product leadership Customer Intimacy
  • 10.
    Strategic Direction DistributionNo-hassle service Systems Standard operating procedure Organization Central authority Finite empowerment Corporate Culture Predictable One-size-fits-all
  • 11.
    Strategic Direction Ideasto Products Skillful marketing Systems Rewards innovation New product success Organization Ad hoc, Organic Flexible, Changes Corporate Culture Experimental Out of box thinking
  • 12.
    Strategic Direction Providesolutions Improve customer’s business Systems Measures cost of service Customer loyalty Organization Empowerment Close to customer Corporate Culture Flexible Have it your way
  • 13.
    Informed opportunism Directionand empowerment Friendly fact, congenial controls Different mirror Teamwork, trust, politics, power Stability in motion Attitudes and attention Causes and commitment
  • 14.
  • 15.
    Growth rate Industrypotential Product line Number of Competitors
  • 16.
    Market share stabilityPurchasing patterns Ease of entry (not due to capital considerations) Technology
  • 17.
    Rapid sales growthChanging technology Fragmented and shifting Market shares High investments Not profitable Gaining position in developing market
  • 18.
    Rapid growth insales Customers, shares, technology gaining recognition Easy entry Capital borrowers Low to good earnings
  • 19.
    Low volatility ofmarket shares Competitors, technology, customers established Growth is relatively high High earnings Produce cash
  • 20.
    Falling demand, limitedgrowth Shrinking number of competitors Little product line variety Little investment
  • 21.
    Dominant Strong FavorableTenable Weak Nonviable
  • 22.
    Controls strategy and/orbehavior of competitors Has wide range of strategic options Is independent of competitors’ actions
  • 23.
    Take independent stanceor action Acting does not endanger long-term position Can maintain long-term position in face of competitors’ actions
  • 24.
    Strengths that areexploitable Higher than average ability to improve position If in a niche, holds commanding position relatively secure from attack
  • 25.
    Sufficient potential andstrengths to warrant continuation in business Unlikely to improve position Marginally profitable In a niche, is profitable, but vulnerable
  • 26.
    Unsatisfactory performance Strengthsthat may lead to improvement Has characteristics of stronger position, but suffers from past mistakes or current weaknesses Short-term--must change
  • 27.
    Currently unsatisfactory performanceFew strengths that may lead to improvement May take years to die
  • 28.
    Competitive Position andStages of Industry Maturity Grid suggests strategies associated with each position
  • 29.
    Suitability Validity FeasibilityInternal consistency Vulnerability Workability Timing
  • 30.
    Suitability: Is therea sustainable competitive advantage? Validity: Are assumptions realistic? Feasibility: Does firm have the skills, resources, and commitments?
  • 31.
    Internal consistency: Doesstrategy hang together? Vulnerability: What are the risks and contingencies?
  • 32.
    Workability: Can weretain our flexibility? Timing: What is the appropriate time horizon?
  • 33.
  • 34.
    Conceptual framework forgenerating strategic alternatives for different product/markets
  • 35.
  • 36.
  • 37.
  • 38.
  • 39.
  • 40.
  • 41.
    Sales growth patternDesign and technical problems Sales/profit of allied products Years product has been on the market Casualty history of similar products Availability of dealers
  • 42.
    Profit history Easeof entry Extent of initial investment Number of competitors Number of competitors left the industry Life cycle of the industry Critical factors for success
  • 43.
    Stars Cash CowsQuestion Marks Dogs Product Sales Growth Rate Relative Market Share High Low Low High
  • 44.
    Product Sales GrowthRate Relative Market Share High Low Low High Introduction Growth Maturity Decline
  • 45.
  • 46.
  • 47.
  • 48.
  • 49.
    Stars Cash CowsQuestion Marks Dogs Product Sales Growth Rate Relative Market Share High Low Low High Success Sequence
  • 50.
    Stars Cash CowsQuestion Marks Dogs Product Sales Growth Rate Relative Market Share High Low Low High Disaster Sequence
  • 51.
    Stars Cash CowsQuestion Marks Dogs Product Sales Growth Rate Relative Market Share High Low Low High
  • 52.
    Stars Cash CowsQuestion Marks Dogs Product Sales Growth Rate Relative Market Share High Low Low High
  • 53.
    Overinvesting in low-growthsegments Underinvesting in high-growth segments Misjudging segment growth Not achieving market share Losing cost effectiveness Not uncovering emerging high-growth segments Unbalanced business mix
  • 54.
    BUSINESS STRENGTH INDUSTRYATTRACTIVENESS Harvest/ Divest Selectivity/ Earnings Invest/ Grow
  • 55.
    Market Size Marketgrowth Industry profit Cycles Inflation recovery International market importance
  • 56.
    Market position Competitiveposition Relative profitability
  • 57.
    B u sinessSector Prospects Company’s Competitive Capabilities
  • 58.
    Overall cost leadershipDifferentiation Focus
  • 59.
    Based on TwoFactors Strategic target Strategic advantage
  • 60.
    Understand the industryChoose competitive niche in which to dominate Do not go toe-to-toe with any competitor