The study examines the correlation between Twitter sentiment analysis and Microsoft stock prices over a period from October 2 to 24, 2017, finding a strong positive correlation coefficient of 0.7815. Utilizing VADER for sentiment scoring, the research highlights the impact of public opinions expressed on Twitter as predictors for stock market movements. Future work aims to explore the influence of news polarity on stock prices and further refine sentiment analysis methodologies.
![Invention Journal of Research Technology in Engineering & Management (IJRTEM)
ISSN: 2455-3689
www.ijrtem.com Volume 2 Issue 1 ǁ January. 2018 ǁ PP 01-04
| Volume 2 | Issue 1 | www.ijrtem.com | 1 |
Stock market prediction using Twitter sentiment analysis
Ajla Kirlić1
, Zeynep Orhan2
, Aldin Hasovic3
, Merve Kevser-Gokgol4
1 (
American Univeristy in Bosnia and Herzegovina, Sarajevo, Bosnia and Herzegovina)
2 (
BHANSA-BiH air navigation service agency, Sarajevo, Bosnia and Herzegovina)
4,2(
International Burch University, Sarajevo, Bosnia and Herzegovina)
ABSTRACT : In a study, it was investigated relationship among stock market movement and Tweeter feed
content. We are expecting to see if there is connection among sentiment information extracted from the Tweets
using a Vader in predicting movements of stock prices. As a result it was obtained strong positive correlation with
a coefficient of correlation to be 0.7815.
KEYWORDS : correlation, financial market, polarity, sentiment analysis, tweets
I. INTRODUCTION
With development of social media, public opinion becomes abundant. Social media is excellent platform for
sharing emotions publicly about any subject and as platform has important effect on public opinion. In recent
years twitter as a social media become interesting for researchers. As real time information, connects users and
inform them about subjects that are interested in. Users need to follow others to receive constant information and
updates. It is a great source of data since users every day post more than 200 million tweets and maximum size of
tweet is 140 characters [1]. There are around 50 million users of tweets, and motives for using that social media
differ from user to user: some heir users use it to stay informed, connected to other users or to increase their
popularity and awareness. Since limited number of characters to be followed tweet needs to be easy to understand
and concise. Single tweet may not look valuable but aggregated tweets analyzed can provide appreciated insight
of sentiment and public opinion [2]. Stock market prediction was always challenging as a study, and previous
researches were based on historical market prices. Well known efficient market hypothesis (EMH) find that
prediction of market significantly depend on contemporary events, product releases and news [3] Since news and
contemporary events are unpredictable was proven that market prices follow an arbitrary walk pattern with more
than 50% precision [4]. According to behavioral economics people are not rational as customers and decisions are
significantly affected by emotions and other people opinion. Getting public sentiment by retrieving online
information from Tweeter can be very valuable on market trading. If aggregated tweets about certain companies
are used and correlated with economic indicators referring to financial market, it is expected to get interesting
information. In this paper we are hoping to collect tweets related to the Microsoft Company and stock prices for
the same period of time, then decide the polarity of tweets and check correlation for the tweets and stock prices.
II. RELATED WORK
In this field there are many high-quality papers, but well-known publication is from Bollen [5]. In the study Bollen
was doing correlation among Dow Jones Industrial index (DJIA) and sentiment derived from the Tweets.
Methodology used for prediction was Fuzzy neural networks. As outcome was found that there is strongly
correlation among DJI and sentiment of Tweets. Remarkable study was performed by Chen and Lazer [6] where
they were stemming strategies of investing. On the other hand researcher Zhang [7] found that there is no
correlation among some states of mood and DJIA and [8] found high predictability of Tweets related to finance,
IT to the prices on stock. Pearson correlation coefficient was used in a research of Brian et al. [9] where stock
increase was investigated with public sentiment. In a research of Wysocki [10] was obtained around 3000
messages related to the stock, and it was tried to find correlation between volume and quality of messages with
changes in stock prices. As outcome was found high correlation between volume of messages and next day trading
in a stock. It was proven increase in tenfold during the night like 15.7 percent and that leads to 0.6 percent increase
in next day stock prices [9]. Similar to Wysocki research, in a research of Antweiler et al. [11] were taken stock
connected messages from board and it was measured how effect on stock prices. In a research was obtained around
1.4 million stock related messages from around 50 companies and on them was applied sentiment analysis and
text classification with a goal to determine sentiment of each message. As a result was proven strong positive
correlation between messages and stock prices. Previous two studies were including analyzing board stock
messages and their effect on stock prices, but there are many studies which are including social media platforms
as a source of messages and information, like Tweeter, Facebook and other social media. Pak et al. in their study
[12] used Tweeter messages for sentiment analysis and they explained methodology of processing and collecting](https://image.slidesharecdn.com/ijrtema0210104-180221080124/75/Stock-market-prediction-using-Twitter-sentiment-analysis-1-2048.jpg)
![Stock market prediction using Tweeter…
| Volume 2 | Issue 1 | www.ijrtem.com | 2 |
tweets. In the research, training set was formed by using emoticons as a set for classification of sentiment, and
tweets were condensed manually. In a paper of Mittal et al. [13] was proven mechanism of predicting with
accuracy rate around 75 percent with a usage Fuzzy neural networks on DJIA and Tweets. It was created random
word questionnaire to help analyzing sentiment of tweets. Furthermore in a research [14] were collected only
tweets that are connected to the stock exchange concentrating on the top 100 stocks. Idea was to examine
correlation among sentiment of tweets and stock volume or price. It was decided to follow dollar nomenclature in
order to decrease noise in tweets. This way of nomenclature allowed to gather only tweets connected to stock
exchange market. As a result was obtained tweet correlation with prices on stock [14]. Study of Vu et al. [15]
inputted classifier of decision tree to sentiment of tweets, in order to determine movement of stock prices for four
NASDAQ companies where average accuracy was 76 percent divided as 77 percent on AAPL, 77 percent on
GOOG, 69 percent on MSFT, 85 percent on AMZN during the period of 60 days. On the other hand research of
[16] used Bayesian classifier to predict stock movement during the 55 days and looking for connection with tweet
sentiments. Srivastava and Rao [17] found relationship among financial market like stock prices and tweet
volume. Researchers proved that tweet mood has a great influence on financial market [17].
It was found substantial indication among stock return and tweets related to the certain companies [18] and it was
observed that change in stock return indicates increased numbers of posts. Interesting study was conducted by
[19] were market forecasting was made from quarterly earnings. For study was used large training set which
includes historical instability organized with n-gram topographies. Conclusions of the study indicated that with
large sets of data together with n-gram and word filtering it is noticed improvement of historical starting point.
Additionally it is noticed that POS adjective tag and handpicked word topographies improved historical starting
point. In previous papers is offered useful overview of sentiment analysis techniques and ability to connect them
with stock exchange market. As we can notice, outcomes of researches differ from twitter filtering, preprocessing
and accuracy of sentiment classifier.
III. METHODOLOGY AND RESULTS
Tweets were collected for over the period from October 2th
, 2017 to October 24th
, 2017 from Microsoft Company
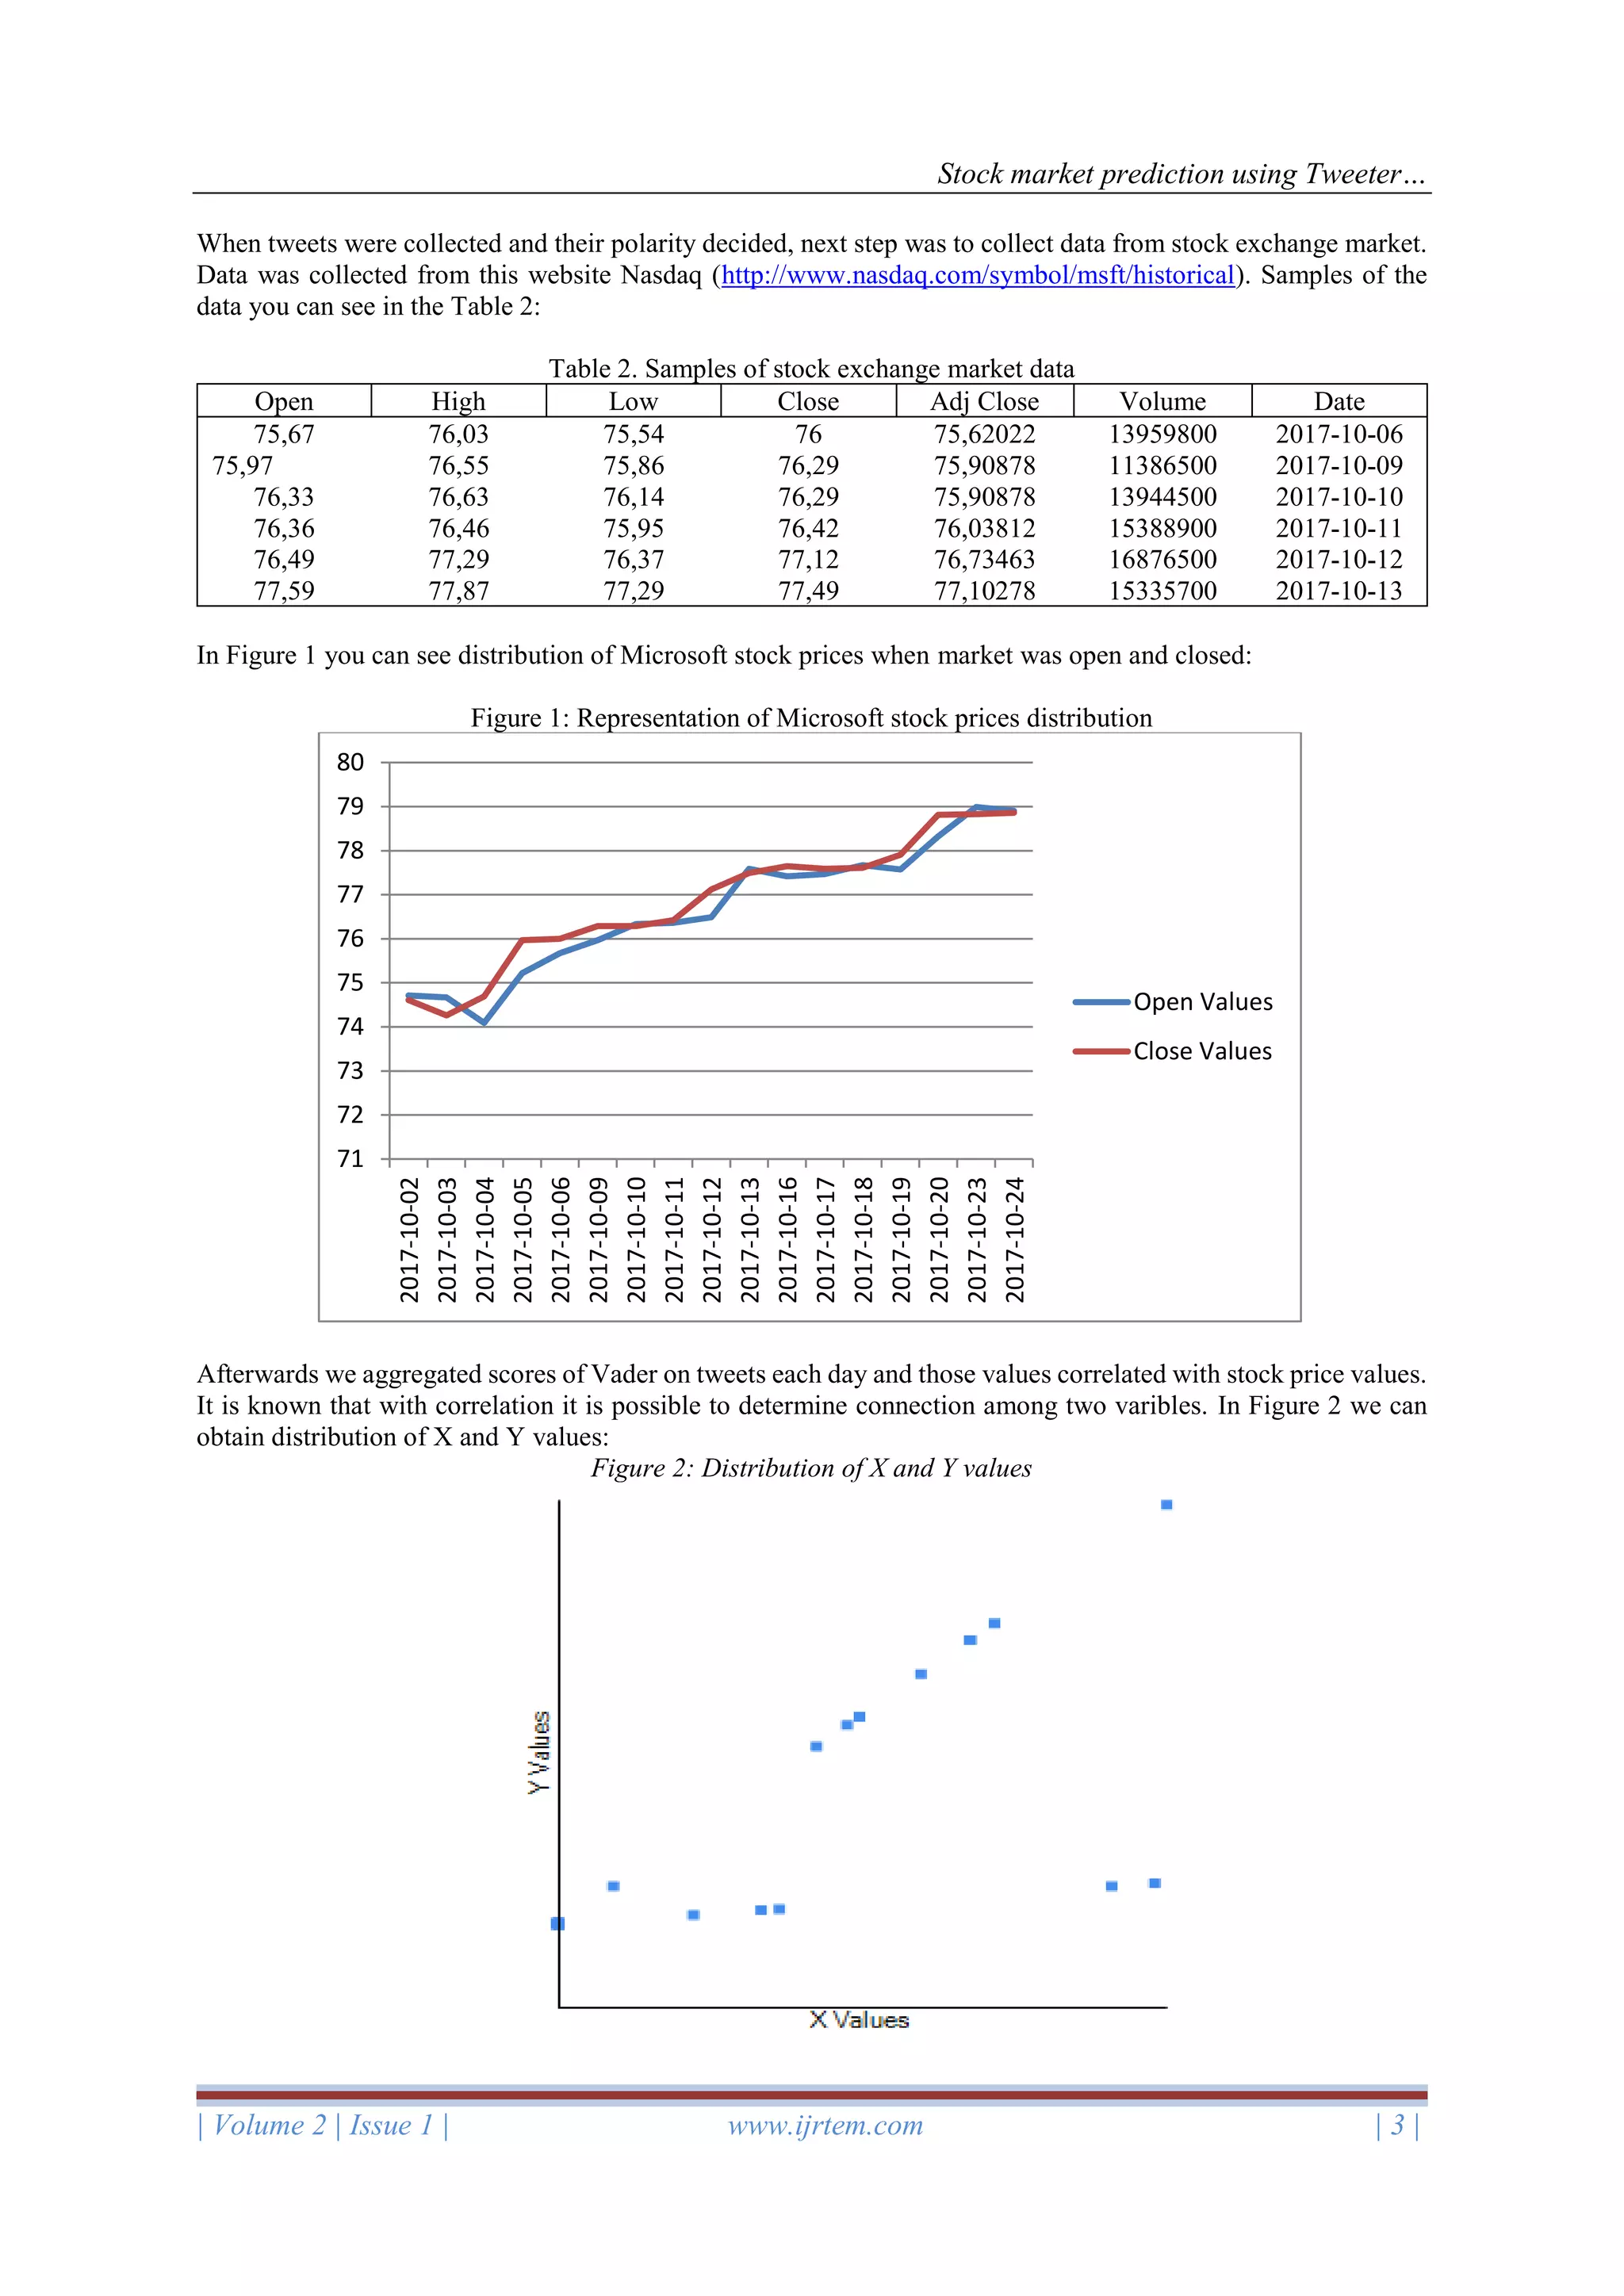
extracted from Twitter API. In total were collected 22525 tweets. Stock prices were collected for the same period
of time, but it is known that stock is closed for holidays and weekends, in order to deal with the missing stock
values, it was used methodology of Goel [13]. Mostly stock prices are having a shape of concave function. Let’s
say that stock value for a day is “a” and the next day is “b” value with missing values in between. Using calculation
like (a+b)/2 it is possible to approximate missing values that we have in a stock prices.First step is preprocessing
of Tweeter data. To decide polarity of tweets it is used Vader [20] and by polarity we mean decision weather tweet
is positive, negative or neutral. Tweets that have score smaller than 0 is decided to be negative, for the ones that
have score higher than 0 was decided to be negative and the ones that have score 0 have neural polarity. For the
In Table 1 is example of tweets related to Microsoft:
Table1. Samples of collected tweets and their Vader scores
Text of tweet Timestamp
Vader
Score
Polarity
And Microsoft shareholders will each receive equity in the purchaser
2017-10-13
20:30:39
0 neutral
The smartphone is eventually going to die, and Apple, Google,
Microsoft, and Facebook are racing to kill it
2017-10-13
20:30:36
-0,8625 negative
Empower your business. Find out how Microsoft solutions can help you
work at anytime, anywhere
2017-10-07
18:00:48
5,38338 positive
Think Microsoft’s Cloud based Office Solution is just about using Word
and Excel in the cloud
2017-10-09
07:30:59
0,68471 positive
I thought I knew of all the bugs in Microsoft Excel's CSV parsing, broken
by design, but this attack vector is mad
2017-10-10
11:03:22
-12,1404 negative
Microsoft AI for Earth - Using AI to advance sustainability
2017-10-11
14:32:58
0 neutral
Microsoft has been fussy about continuing to sign on for this kind of
thing. My big fear is that
2017-10-12
18:13:37
-0,4939 negative
Thank you #Microsoft, @RepKevinYoder, and @SenMikeLee
2017-10-08
06:01:53
0,97524 positive
The latest Microsoft Education&Onenote Daily!
2017-10-06
23:47:02
0 neutral](https://image.slidesharecdn.com/ijrtema0210104-180221080124/75/Stock-market-prediction-using-Twitter-sentiment-analysis-2-2048.jpg)
![Stock market prediction using Tweeter…
| Volume 2 | Issue 1 | www.ijrtem.com | 4 |
As a result it is obtained correlation coefficient to be r=0.7815, which means that there is strong positive
correlation among stock exchange prices and tweet’s polarity for the same period of time. Strong positive
correlation means that with an increase on one variable, other variable is increased too and vice versa. Additionally
was calculated coefficient of determination to be 0.6107.
IV. CONCLUSION AND FUTURE WORK
The study found strong positive correlation among sentiment of tweets related to the Microsoft Company and
Microsoft’s stock prices. Even though there are many research papers related to sentiment analysis and predicting
stock prices we have expectation that our research will make contribution in the field of research. Our study is
making impact to data detection in terms of comparative study of sentiment analysis, determination of polarity
and correlation to the stock prices. Although some limitations in our research like giving weights to the Vader
sentiment analysis is alleged that results were showing affection of Tweeter public opinion to the stock exchange
market and movements of the stock prices. As a future work we are expecting to examine how polarity of news
is having effect on stock price movements and to obtain what has more impact to the financial market, Tweets or
news related to financial field. Moreover it is believed that in future work if weight Vader scores differently that
we can observe and get the other insight of the research.
REFERENCES
[1] B. Jansen, M. Zhang, K. Sobel, and A. Chowdury Twitter power: Tweets as electronic word of mouth.
Journal of the American Society for Information Science and Technology 2009.
[2] E.F. Fama, The behavior of stock-market prices, The Journal of Business 1965 34105,
http://dx.doi.org/10.2307
[3] Qian, Bo, Rasheed, Khaled, Stock market prediction with multiple classifiers, Applied Intelligence
(February (1)) 2007
[4] S. Elson, D. Yeung, R. Parisa, S. . R. Bohandy, and A. Nader Using social media to gauge iranian public
opinion and mood after the 2009 election 2012
[5] Bollen, J., Mao, H., Zeng, X.: Twitter mood predicts the stock market Journal of Compu-tational Science,
2(1), 2011
[6] R. Chen and M. Lazer, Sentiment Analysis of Twitter Feeds for the Prediction of Stock Market Movement,
Cs 229, 2011
[7] L. Zhang, Sentiment Analysis on Twitter with Stock Price and Signifi- cant Keyword Correlation, 2013
[8] Bing, Li, Keith CC Chan, and Carol Ou. ”Public sentiment analysis in Twitter data for prediction of a
company’s stock price movements.” eBusiness Engineering (ICEBE), IEEE 11th International Conference
on. IEEE, 2014
[9] Dickinson, Brian, and Wei Hu. ”Sentiment analysis of investor opinions on twitter.” Social Networking
4.03 2015
[10] P. D. Wysocki Cheap talk on the web The determinants of postings on stock message boards, 1998
[11] W. Antweiler and M. Frank Do US stock markets typically overreact to corporate news stories Working
Paper, 2006
[12] A. Pak and P. Paroubek, Twitter as a Corpus for Sentiment Analysis and Opinion Mining, Lrec, 2010
[13] Mittal and a. Goel Stock Prediction Using Twitter Sentiment Analysis, 2012
[14] T. O. Sprenger, A. Tumasjan, P. G. Sandner, I. M. Welpe Tweets and trades: The information content of
stock microblogs European Financial Management, 2014
[15] Tien-Thanh Vu, Shu Chang, Quang Thuy Ha, and Nigel Collier An experiment in integrating sentiment
features for tech stock prediction in twitter 2012
[16] Yuexin Mao, Wei Wei, Bing Wang Twitter volume spikes: analysis and application in stock trading. In
Proceedings of the 7th Workshop on Social Network Mining and Analysis, 2013
[17] T. Rao and S. Srivastava, Analyzing stock market movements using twitter sentiment analysis”, In
Proceedings of the International Conference on Advances in Social Networks Analysis and Mining), IEEE
Computer Society, 2012
[18] G. Ranco, D. Aleksovski, G. Caldarelli, M. Grčar, and I. Mozetič, The effects of Twitter sentiment on stock
price returns, 2015
[19] Naveed Ahmad , Aram Zinzalian Predicting Stock Volatility from Quarterly Earnings Calls and Transcript
Summaries using Text Regression, Final Report , 2010
[20] Ajla Kirlic, Zeynep Orhan, Measuring human and Vader performance on sentiment analysis, IJRTEM,
2017](https://image.slidesharecdn.com/ijrtema0210104-180221080124/75/Stock-market-prediction-using-Twitter-sentiment-analysis-4-2048.jpg)