Stock market prediction is a typical task to forecast the upcoming stock values. It is very difficult to forecast because of unbalanced nature of stocks. In this work, an attempt is made for prediction of stock market trend. This research aims to combine multiple existing techniques into a much more robust prediction model which can handle various scenarios in which investment can be beneficial. By combing both techniques, this prediction model can provide more accurate and flexible recommendations. However instead of using those traditional methods, we approached the problems using machine learning techniques. We tried to revolutionize the way people address data processing problems in stock market by predicting the behavior of the stocks. In fact, if we can predict how the stock will behave in the short term future we can queue up our transactions earlier and be faster than everyone else. In theory, this allows us to maximize our profit without having the need to be physically located close to the data sources. We examined three main models. Firstly we used a complete prediction using a moving average. Secondly we used a LSTM model and finally a model called ARIMA model. The only motive is to increase the accuracy of predictive the stock market price. Each of those models was applied on real stock market data and checked whether it could return profit. Subham Kumar Gupta | Dr. Bhuvana J | Dr. M N Nachappa "Stock Market Prediction using Machine Learning" Published in International Journal of Trend in Scientific Research and Development (ijtsrd), ISSN: 2456-6470, Volume-6 | Issue-3 , April 2022, URL: https://www.ijtsrd.com/papers/ijtsrd49868.pdf Paper URL: https://www.ijtsrd.com/computer-science/other/49868/stock-market-prediction-using-machine-learning/subham-kumar-gupta
STOCK MARKET PREDICTION USING MACHINE LEARNING METHODSIAEME Publication
Stock price forecasting is a popular and important topic in financial and academic
studies. Share market is an volatile place for predicting since there are no significant
rules to estimate or predict the price of a share in the share market. Many methods
like technical analysis, fundamental analysis, time series analysis and statistical
analysis etc. are used to predict the price in tie share market but none of these
methods are proved as a consistently acceptable prediction tool. In this paper, we
implemented a Random Forest approach to predict stock market prices. Random
Forests are very effectively implemented in forecasting stock prices, returns, and stock
modeling. We outline the design of the Random Forest with its salient features and
customizable parameters. We focus on a certain group of parameters with a relatively
significant impact on the share price of a company. With the help of sentiment
analysis, we found the polarity score of the new article and that helped in forecasting
accurate result. Although share market can never be predicted with hundred per-cent
accuracy due to its vague domain, this paper aims at proving the efficiency of Random
forest for forecasting the stock prices
Stock Price Trend Forecasting using Supervised LearningSharvil Katariya
The aim of the project is to examine a number of different forecasting techniques to predict future stock returns based on past returns and numerical user-generated content to construct a portfolio of multiple stocks in order to diversify the risk. We do this by applying supervised learning methods for stock price forecasting by interpreting the seemingly chaotic market data.
In Stock Market Prediction, the aim is to predict the future value of the financial stocks of a company. The recent trend in stock market prediction technologies is the use of machine learning which makes predictions based on the values of current stock market indices by training on their previous values. Machine learning itself employs different models to make prediction easier and authentic.
The aim of the project is to determine the forecasting techniques to determine future stock prices of IT stocks using time series analysis & determining the maximum risk involved using Monte Carlo techniques
Classification of quantitative trading strategies webinar pptQuantInsti
There exist thousands of academic research papers written on trading strategies. Learn what these academics found out and how we can use their knowledge in the trading world.
The webinar covers:
- Overview of research in a field of quantitative trading
- Taxonomy of quantitative trading strategies
- Where to look for unique alpha
- Examples of lesser-known trading strategies
- Common issues in quant research
Learn more about our EPAT™ course here: https://www.quantinsti.com/epat/
Most Useful links
Join EPAT – Executive Programme in Algorithmic Trading: https://goo.gl/3Oyf2B
Visit us at: https://www.quantinsti.com/
Like us on Facebook: https://www.facebook.com/quantinsti/
Follow us on Twitter: https://twitter.com/QuantInsti
Access the webinar recording here: http://ow.ly/1YwO30dz5FD
Know more about EPAT™ by QuantInsti™ at http://www.quantinsti.com/epat/
Forecasted stock prices of Google using historical stock price data and sentiment scores using Sentiment Analyzer in Python from New York Times headlines, implemented different Time Series Models – ARIMA, Exponential Smoothing, Holtwinters, also used Sentiment Score regression models, Fb Prophet, also implemented Deep Learning Models
Stock Technical analysis is a free technical analysis and stock screener website devoted to teaching and utilizing the fine art of stock technical analysis to optimize your stock trades
Time Series Forecasting Project Presentation.Anupama Kate
Hello Folks, Anupama here, Presenting on behalf of my team for our internship project - Forecasting Gold Prices. for that, we use python and machine learning algorithms and models.
with Exploratory data analysis, modelling, model building, model evaluation, deployment, and publishing applications.
#machinelearning #datascience #forecasting #predection #timeseries #python #project
Time series forecasting with machine learningDr Wei Liu
An introduction of developing and application time series forecast models with both traditional time series methods and machine learning techniques. Case study for a challenging very short-term electrical price forecasting project was presented.
The Stock Market is known for its volatile and unstable nature. A particular stock could be thriving in one
period and declining in the next. Stock traders make money from buying equity when they are at their
lowest and selling when they are at their highest. The logical question would be: "What Causes Stock
Prices To Change?". At the most fundamental level, the answer to this would be the demand and supply.
In reality, there are many theories as to why stock prices fluctuate, but there is no generic theory that
explains all, simply because not all stocks are identical, and one theory that may apply for today, may not
necessarily apply for tomorrow. This paper covers various approaches taken to attempt to predict the
stock market without extensive prior knowledge or experience in the subject area, highlighting the
advantages and limitations of the different techniques such as regression and classification. We formulate
both short term and long term predictions. Through experimentation we achieve 81% accuracy for future
trend direction using classification, 0.0117 RMSE for next day price and 0.0613 RMSE for next day
change in price using regression techniques. The results obtained in this paper are achieved using only
historic prices and technical indicators. Various methods, tools and evaluation techniques will be
assessed throughout the course of this paper, the result of this contributes as to which techniques will be
selected and enhanced in the final artefact of a stock prediction model. Further work will be conducted
utilising deep learning techniques to approach the problem. This paper will serve as a preliminary guide
to researchers wishing to expose themselves to this area.
Artificial Intelligence Based Stock Market Prediction Model using Technical I...ijtsrd
The stock market is highly volatile and complex in nature. However, notion of stock price predictability is typical, many researchers suggest that the Buy and Sell prices are predictable and investor can make above average profits using efficient Technical Analysis TA .Most of the earlier prediction models predict individual stocks and the results are mostly influenced by company’s reputation, news, sentiments and other fundamental issues while stock indices are less affected by these issues. In this work, an effort is made to predict the Buy and Sell decisions of stocks, trends of stock by utilizing Stock Technical Indicators STIs As a part of prediction model the Long Short Term Memory LSTM , Support Virtual Machine SVM Artificial intelligence algorithms will be used with Stock Technical Indicators STIs. The project will be carried on National Stock Exchange NSE Stocks of India. Mr. Ketan Ashok Bagade | Yogini Bagade "Artificial Intelligence Based Stock Market Prediction Model using Technical Indicators" Published in International Journal of Trend in Scientific Research and Development (ijtsrd), ISSN: 2456-6470, Volume-7 | Issue-2 , April 2023, URL: https://www.ijtsrd.com.com/papers/ijtsrd53854.pdf Paper URL: https://www.ijtsrd.com.com/management/other/53854/artificial-intelligence-based-stock-market-prediction-model-using-technical-indicators/mr-ketan-ashok-bagade
The usage of Neural network s has determined a variegated area of packages in the present world. This has caused the
improvement of various fashions for economic markets and funding. This paper represents the idea the way to predict share
market fee the use of artificial Neural community with a given enter parameters of share marketplace. The proportion
marketplace is dynamic in nature approach to expect percentage fee could be very complex method by using trendy prediction
or computation method. Its predominant motive is that there is no linear relationship between market parameters and target last
price. Since there is no linear relationship between input patterns and corresponding output patterns, so use of neural network is
a desire of hobby for share market prediction.
The International Journal of Engineering and Science (IJES)theijes
The International Journal of Engineering & Science is aimed at providing a platform for researchers, engineers, scientists, or educators to publish their original research results, to exchange new ideas, to disseminate information in innovative designs, engineering experiences and technological skills. It is also the Journal's objective to promote engineering and technology education. All papers submitted to the Journal will be blind peer-reviewed. Only original articles will be published.
OPENING RANGE BREAKOUT STOCK TRADING ALGORITHMIC MODELIJCI JOURNAL
Stock Trading Algorithmic Model is an important research problem that is dealt with knowledge in
fundamental and technical analysis, combined with the knowledge expertise in programming and computer
science. There have been numerous attempts in predicting stock trends, we aim to predict it with least
amount of computation and to decrease the space complexity. The goal of this paper is to create a hybrid
recommendation system that will inform the trader about the future of a stock trend in order to improve the
profitability of a short term investment. We make use of technical analysis tools to incorporate this
recommendation into our system. In order to understand the results, we implemented a prototype in R
programming language.
STOCK TREND PREDICTION USING NEWS SENTIMENT ANALYSISijcsit
Efficient Market Hypothesis is the popular theory about stock prediction. With its failure much research
has been carried in the area of prediction of stocks. This project is about taking non quantifiable data such
as financial news articles about a company and predicting its future stock trend with news sentiment
classification. Assuming that news articles have impact on stock market, this is an attempt to study
relationship between news and stock trend. To show this, we created three different classification models
which depict polarity of news articles being positive or negative. Observations show that RF and SVM
perform well in all types of testing. Naïve Bayes gives good result but not compared to the other two.
Experiments are conducted to evaluate various aspects of the proposed model and encouraging results are
obtained in all of the experiments. The accuracy of the prediction model is more than 80% and in
comparison with news random labelling with 50% of accuracy; the model has increased the accuracy by
30%.
Applications of Artificial Neural Network in Forecasting of Stock Market Indexpaperpublications3
Abstract: Prediction in any field is a challenging and unnerving process. Stock market is a promising financial investment that can generate great wealth. However, under the impact of Globalization Stock Market Prediction (SMP) accuracy has become more challenging and rewarding for the researchers and participants in the stock market. Artificial Neural Networks (ANN) have been found to be an efficient tool in modeling stock prices and quite a large number of studies have been done on it. ANN modeling of stock prices of selected stocks under NSE is attempted to predict the next day’s price. The network developed consists of one input layer, hidden layer and output layer with four, nine and one nodes respectively. The input being the closing price of the previous four days and output being the price for the next day. In the first section the adaptability of neural networks in stock market prediction is discussed, in the second section we discuss the traditional methods that were being used earlier for stock market prediction, in the third section we discuss the justification for using neural networks and how it is better over traditional methods, in the fourth section we discuss the basics of neural networks, section five gives an overview of data and methodology being used, in section six we have discussed the various forecasting errors methods to calculate the error, in section seven we have presented our results. The aim of this paper is to provide an overview of the application of artificial neural network in stock market prediction.
‘Six Sigma Technique’ A Journey Through its Implementationijtsrd
The manufacturing industries all over the world are facing tough challenges for growth, development and sustainability in today’s competitive environment. They have to achieve apex position by adapting with the global competitive environment by delivering goods and services at low cost, prime quality and better price to increase wealth and consumer satisfaction. Cost Management ensures profit, growth and sustainability of the business with implementation of Continuous Improvement Technique like Six Sigma. This leads to optimize Business performance. The method drives for customer satisfaction, low variation, reduction in waste and cycle time resulting into a competitive advantage over other industries which did not implement it. The main objective of this paper ‘Six Sigma Technique A Journey Through Its Implementation’ is to conceptualize the effectiveness of Six Sigma Technique through the journey of its implementation. Aditi Sunilkumar Ghosalkar "‘Six Sigma Technique’: A Journey Through its Implementation" Published in International Journal of Trend in Scientific Research and Development (ijtsrd), ISSN: 2456-6470, Volume-8 | Issue-1 , February 2024, URL: https://www.ijtsrd.com/papers/ijtsrd64546.pdf Paper Url: https://www.ijtsrd.com/other-scientific-research-area/other/64546/‘six-sigma-technique’-a-journey-through-its-implementation/aditi-sunilkumar-ghosalkar
Edge Computing in Space Enhancing Data Processing and Communication for Space...ijtsrd
Edge computing, a paradigm that involves processing data closer to its source, has gained significant attention for its potential to revolutionize data processing and communication in space missions. With the increasing complexity and data volume generated by modern space missions, traditional centralized computing approaches face challenges related to latency, bandwidth, and security. Edge computing in space, involving on board processing and analysis of data, offers promising solutions to these challenges. This paper explores the concept of edge computing in space, its benefits, applications, and future prospects in enhancing space missions. Manish Verma "Edge Computing in Space: Enhancing Data Processing and Communication for Space Missions" Published in International Journal of Trend in Scientific Research and Development (ijtsrd), ISSN: 2456-6470, Volume-8 | Issue-1 , February 2024, URL: https://www.ijtsrd.com/papers/ijtsrd64541.pdf Paper Url: https://www.ijtsrd.com/computer-science/artificial-intelligence/64541/edge-computing-in-space-enhancing-data-processing-and-communication-for-space-missions/manish-verma
Dynamics of Communal Politics in 21st Century India Challenges and Prospectsijtsrd
Communal politics in India has evolved through centuries, weaving a complex tapestry shaped by historical legacies, colonial influences, and contemporary socio political transformations. This research comprehensively examines the dynamics of communal politics in 21st century India, emphasizing its historical roots, socio political dynamics, economic implications, challenges, and prospects for mitigation. The historical perspective unravels the intricate interplay of religious identities and power dynamics from ancient civilizations to the impact of colonial rule, providing insights into the evolution of communalism. The socio political dynamics section delves into the contemporary manifestations, exploring the roles of identity politics, socio economic disparities, and globalization. The economic implications section highlights how communal politics intersects with economic issues, perpetuating disparities and influencing resource allocation. Challenges posed by communal politics are scrutinized, revealing multifaceted issues ranging from social fragmentation to threats against democratic values. The prospects for mitigation present a multifaceted approach, incorporating policy interventions, community engagement, and educational initiatives. The paper conducts a comparative analysis with international examples, identifying common patterns such as identity politics and economic disparities. It also examines unique challenges, emphasizing Indias diverse religious landscape, historical legacy, and secular framework. Lessons for effective strategies are drawn from international experiences, offering insights into inclusive policies, interfaith dialogue, media regulation, and global cooperation. By scrutinizing historical epochs, contemporary dynamics, economic implications, and international comparisons, this research provides a comprehensive understanding of communal politics in India. The proposed strategies for mitigation underscore the importance of a holistic approach to foster social harmony, inclusivity, and democratic values. Rose Hossain "Dynamics of Communal Politics in 21st Century India: Challenges and Prospects" Published in International Journal of Trend in Scientific Research and Development (ijtsrd), ISSN: 2456-6470, Volume-8 | Issue-1 , February 2024, URL: https://www.ijtsrd.com/papers/ijtsrd64528.pdf Paper Url: https://www.ijtsrd.com/humanities-and-the-arts/history/64528/dynamics-of-communal-politics-in-21st-century-india-challenges-and-prospects/rose-hossain
Assess Perspective and Knowledge of Healthcare Providers Towards Elehealth in...ijtsrd
Background and Objective Telehealth has become a well known tool for the delivery of health care in Saudi Arabia, and the perspective and knowledge of healthcare providers are influential in the implementation, adoption and advancement of the method. This systematic review was conducted to examine the current literature base regarding telehealth and the related healthcare professional perspective and knowledge in the Kingdom of Saudi Arabia. Materials and Methods This systematic review was conducted by searching 7 databases including, MEDLINE, CINHAL, Web of Science, Scopus, PubMed, PsycINFO, and ProQuest Central. Studies on healthcare practitioners telehealth knowledge and perspectives published in English in Saudi Arabia from 2000 to 2023 were included. Boland directed this comprehensive review. The researchers examined each connected study using the AXIS tool, which evaluates cross sectional systematic reviews. Narrative synthesis was used to summarise and convey the data. Results Out of 1840 search results, 10 studies were included. Positive outlook and limited knowledge among providers were seen across trials. Healthcare professionals like telehealth for its ability to improve quality, access, and delivery, save time and money, and be successful. Age, gender, occupation, and work experience also affect health workers knowledge. In Saudi Arabia, healthcare professionals face inadequate expert assistance, patient privacy, internet connection concerns, lack of training courses, lack of telehealth understanding, and high costs while performing telemedicine. Conclusions Healthcare practitioners telehealth perceptions and knowledge were examined in this systematic study. Its collection of concerned experts different personal attitudes and expertise would help enhance telehealths implementation in Saudi Arabia, develop its healthcare delivery alternative, and eliminate frequent problems. Badriah Mousa I Mulayhi | Dr. Jomin George | Judy Jenkins "Assess Perspective and Knowledge of Healthcare Providers Towards Elehealth in Saudi Arabia: A Systematic Review" Published in International Journal of Trend in Scientific Research and Development (ijtsrd), ISSN: 2456-6470, Volume-8 | Issue-1 , February 2024, URL: https://www.ijtsrd.com/papers/ijtsrd64535.pdf Paper Url: https://www.ijtsrd.com/medicine/other/64535/assess-perspective-and-knowledge-of-healthcare-providers-towards-elehealth-in-saudi-arabia-a-systematic-review/badriah-mousa-i-mulayhi
The Impact of Digital Media on the Decentralization of Power and the Erosion ...ijtsrd
The impact of digital media on the distribution of power and the weakening of traditional gatekeepers has gained considerable attention in recent years. The adoption of digital technologies and the internet has resulted in declining influence and power for traditional gatekeepers such as publishing houses and news organizations. Simultaneously, digital media has facilitated the emergence of new voices and players in the media industry. Digital medias impact on power decentralization and gatekeeper erosion is visible in several ways. One significant aspect is the democratization of information, which enables anyone with an internet connection to publish and share content globally, leading to citizen journalism and bypassing traditional gatekeepers. Another aspect is the disruption of conventional media industry business models, as traditional organizations struggle to adjust to the decrease in advertising revenue and the rise of digital platforms. Alternative business models, such as subscription models and crowdfunding, have become more prevalent, leading to the emergence of new players. Overall, the impact of digital media on the distribution of power and the weakening of traditional gatekeepers has brought about significant changes in the media landscape and the way information is shared. Further research is required to fully comprehend the implications of these changes and their impact on society. Dr. Kusum Lata "The Impact of Digital Media on the Decentralization of Power and the Erosion of Traditional Gatekeepers" Published in International Journal of Trend in Scientific Research and Development (ijtsrd), ISSN: 2456-6470, Volume-8 | Issue-1 , February 2024, URL: https://www.ijtsrd.com/papers/ijtsrd64544.pdf Paper Url: https://www.ijtsrd.com/humanities-and-the-arts/political-science/64544/the-impact-of-digital-media-on-the-decentralization-of-power-and-the-erosion-of-traditional-gatekeepers/dr-kusum-lata
Online Voices, Offline Impact Ambedkars Ideals and Socio Political Inclusion ...ijtsrd
This research investigates the nexus between online discussions on Dr. B.R. Ambedkars ideals and their impact on social inclusion among college students in Gurugram, Haryana. Surveying 240 students from 12 government colleges, findings indicate that 65 actively engage in online discussions, with 80 demonstrating moderate to high awareness of Ambedkars ideals. Statistically significant correlations reveal that higher online engagement correlates with increased awareness p 0.05 and perceived social inclusion. Variations across colleges and a notable effect of college type on perceived social inclusion highlight the influence of contextual factors. Furthermore, the intersectional analysis underscores nuanced differences based on gender, caste, and socio economic status. Dr. Kusum Lata "Online Voices, Offline Impact: Ambedkar's Ideals and Socio-Political Inclusion - A Study of Gurugram District" Published in International Journal of Trend in Scientific Research and Development (ijtsrd), ISSN: 2456-6470, Volume-8 | Issue-1 , February 2024, URL: https://www.ijtsrd.com/papers/ijtsrd64543.pdf Paper Url: https://www.ijtsrd.com/humanities-and-the-arts/political-science/64543/online-voices-offline-impact-ambedkars-ideals-and-sociopolitical-inclusion--a-study-of-gurugram-district/dr-kusum-lata
Problems and Challenges of Agro Entreprenurship A Studyijtsrd
Noting calls for contextualizing Agro entrepreneurs problems and challenges of the agro entrepreneurs and for greater attention to the Role of entrepreneurs in agro entrepreneurship research, we conduct a systematic literature review of extent research in agriculture entrepreneurship to overcome the study objectives of complications of agro entrepreneurs through various factors, Development of agriculture products is a key factor for the overall economic growth of agro entrepreneurs Agro Entrepreneurs produces firsthand large scale employment, utilizes the labor and natural resources, This research outlines the problems of Weather and Soil Erosions, Market price fluctuation, stimulates labor cost problems, reduces concentration of Price volatility, Dependency on Intermediaries, induces Limited Bargaining Power, and Storage and Transportation Costs. This paper mainly devoted to highlight Problems and challenges faced for the sustainable of Agro Entrepreneurs in India. Vinay Prasad B "Problems and Challenges of Agro Entreprenurship - A Study" Published in International Journal of Trend in Scientific Research and Development (ijtsrd), ISSN: 2456-6470, Volume-8 | Issue-1 , February 2024, URL: https://www.ijtsrd.com/papers/ijtsrd64540.pdf Paper Url: https://www.ijtsrd.com/other-scientific-research-area/other/64540/problems-and-challenges-of-agro-entreprenurship--a-study/vinay-prasad-b
Comparative Analysis of Total Corporate Disclosure of Selected IT Companies o...ijtsrd
Disclosure is a process through which a business enterprise communicates with external parties. A corporate disclosure is communication of financial and non financial information of the activities of a business enterprise to the interested entities. Corporate disclosure is done through publishing annual reports. So corporate disclosure through annual reports plays a vital role in the life of all the companies and provides valuable information to investors. The basic objectives of corporate disclosure is to give a true and fair view of companies to the parties related either directly or indirectly like owner, government, creditors, shareholders etc. in the companies act, provisions have been made about mandatory and voluntary disclosure. The IT sector in India is rapidly growing, the trend to invest in the IT sector is rising and employment opportunities in IT sectors are also increasing. Therefore the IT sector is expected to have fair, full and adequate disclosure of all information. Unfair and incomplete disclosure may adversely affect the entire economy. A research study on disclosure practices of IT companies could play an important role in this regard. Hence, the present research study has been done to study and review comparative analysis of total corporate disclosure of selected IT companies of India and to put forward overall findings and suggestions with a view to increase disclosure score of these companies. The researcher hopes that the present research study will be helpful to all selected Companies for improving level of corporate disclosure through annual reports as well as the government, creditors, investors, all business organizations and upcoming researcher for comparative analyses of level of corporate disclosure with special reference to selected IT companies. Dr. Vaibhavi D. Thaker "Comparative Analysis of Total Corporate Disclosure of Selected IT Companies of India" Published in International Journal of Trend in Scientific Research and Development (ijtsrd), ISSN: 2456-6470, Volume-8 | Issue-1 , February 2024, URL: https://www.ijtsrd.com/papers/ijtsrd64539.pdf Paper Url: https://www.ijtsrd.com/other-scientific-research-area/other/64539/comparative-analysis-of-total-corporate-disclosure-of-selected-it-companies-of-india/dr-vaibhavi-d-thaker
The Impact of Educational Background and Professional Training on Human Right...ijtsrd
This study investigated the impact of educational background and professional training on human rights awareness among secondary school teachers in the Marathwada region of Maharashtra, India. The key findings reveal that higher levels of education, particularly a master’s degree, and fields of study related to education, humanities, or social sciences are associated with greater human rights awareness among teachers. Additionally, both pre service teacher training and in service professional development programs focused on human rights education significantly enhance teacher’s knowledge, skills, and competencies in promoting human rights principles in their classrooms. Baig Ameer Bee Mirza Abdul Aziz | Dr. Syed Azaz Ali Amjad Ali "The Impact of Educational Background and Professional Training on Human Rights Awareness among Secondary School Teachers" Published in International Journal of Trend in Scientific Research and Development (ijtsrd), ISSN: 2456-6470, Volume-8 | Issue-1 , February 2024, URL: https://www.ijtsrd.com/papers/ijtsrd64529.pdf Paper Url: https://www.ijtsrd.com/humanities-and-the-arts/education/64529/the-impact-of-educational-background-and-professional-training-on-human-rights-awareness-among-secondary-school-teachers/baig-ameer-bee-mirza-abdul-aziz
A Study on the Effective Teaching Learning Process in English Curriculum at t...ijtsrd
“One Language sets you in a corridor for life. Two languages open every door along the way” Frank Smith English as a foreign language or as a second language has been ruling in India since the period of Lord Macaulay. But the question is how much we teach or learn English properly in our culture. Is there any scope to use English as a language rather than a subject How much we learn or teach English without any interference of mother language specially in the classroom teaching learning scenario in West Bengal By considering all these issues the researcher has attempted in this article to focus on the effective teaching learning process comparing to other traditional strategies in the field of English curriculum at the secondary level to investigate whether they fulfill the present teaching learning requirements or not by examining the validity of the present curriculum of English. The purpose of this study is to focus on the effectiveness of the systematic, scientific, sequential and logical transaction of the course between the teachers and the learners in the perspective of the 5Es programme that is engage, explore, explain, extend and evaluate. Sanchali Mondal | Santinath Sarkar "A Study on the Effective Teaching Learning Process in English Curriculum at the Secondary Level of West Bengal" Published in International Journal of Trend in Scientific Research and Development (ijtsrd), ISSN: 2456-6470, Volume-8 | Issue-1 , February 2024, URL: https://www.ijtsrd.com/papers/ijtsrd62412.pdf Paper Url: https://www.ijtsrd.com/humanities-and-the-arts/education/62412/a-study-on-the-effective-teaching-learning-process-in-english-curriculum-at-the-secondary-level-of-west-bengal/sanchali-mondal
The Role of Mentoring and Its Influence on the Effectiveness of the Teaching ...ijtsrd
This paper reports on a study which was conducted to investigate the role of mentoring and its influence on the effectiveness of the teaching of Physics in secondary schools in the South West Region of Cameroon. The study adopted the convergent parallel mixed methods design, focusing on respondents in secondary schools in the South West Region of Cameroon. Both quantitative and qualitative data were collected, analysed separately, and the results were compared to see if the findings confirm or disconfirm each other. The quantitative analysis found that majority of the respondents 72 of Physics teachers affirmed that they had more experienced colleagues as mentors to help build their confidence, improve their teaching, and help them improve their effectiveness and efficiency in guiding learners’ achievements. Only 28 of the respondents disagreed with these statements. With majority respondents 72 agreeing with the statements, it implies that in most secondary schools, experienced Physics teachers act as mentors to build teachers’ confidence in teaching and improving students’ learning. The interview qualitative data analysis summarized how secondary school Principals use meetings with mentors and mentees to promote mentorship in the school milieu. This has helped strengthen teachers’ classroom practices in secondary schools in the South West Region of Cameroon. With the results confirming each other, the study recommends that mentoring should focus on helping teachers employ social interactions and instructional practices feedback and clarity in teaching that have direct measurable impact on students’ learning achievements. Andrew Ngeim Sumba | Frederick Ebot Ashu | Peter Agborbechem Tambi "The Role of Mentoring and Its Influence on the Effectiveness of the Teaching of Physics in Secondary Schools in the South West Region of Cameroon" Published in International Journal of Trend in Scientific Research and Development (ijtsrd), ISSN: 2456-6470, Volume-8 | Issue-1 , February 2024, URL: https://www.ijtsrd.com/papers/ijtsrd64524.pdf Paper Url: https://www.ijtsrd.com/management/management-development/64524/the-role-of-mentoring-and-its-influence-on-the-effectiveness-of-the-teaching-of-physics-in-secondary-schools-in-the-south-west-region-of-cameroon/andrew-ngeim-sumba
Design Simulation and Hardware Construction of an Arduino Microcontroller Bas...ijtsrd
This study primarily focuses on the design of a high side buck converter using an Arduino microcontroller. The converter is specifically intended for use in DC DC applications, particularly in standalone solar PV systems where the PV output voltage exceeds the load or battery voltage. To evaluate the performance of the converter, simulation experiments are conducted using Proteus Software. These simulations provide insights into the input and output voltages, currents, powers, and efficiency under different state of charge SoC conditions of a 12V,70Ah rechargeable lead acid battery. Additionally, the hardware design of the converter is implemented, and practical data is collected through operation, monitoring, and recording. By comparing the simulation results with the practical results, the efficiency and performance of the designed converter are assessed. The findings indicate that while the buck converter is suitable for practical use in standalone PV systems, its efficiency is compromised due to a lower output current. Chan Myae Aung | Dr. Ei Mon "Design Simulation and Hardware Construction of an Arduino-Microcontroller Based DC-DC High-Side Buck Converter for Standalone PV System" Published in International Journal of Trend in Scientific Research and Development (ijtsrd), ISSN: 2456-6470, Volume-8 | Issue-1 , February 2024, URL: https://www.ijtsrd.com/papers/ijtsrd64518.pdf Paper Url: https://www.ijtsrd.com/engineering/mechanical-engineering/64518/design-simulation-and-hardware-construction-of-an-arduinomicrocontroller-based-dcdc-highside-buck-converter-for-standalone-pv-system/chan-myae-aung
Sustainable Energy by Paul A. Adekunte | Matthew N. O. Sadiku | Janet O. Sadikuijtsrd
Energy becomes sustainable if it meets the needs of the present without compromising the ability of future generations to meet their own needs. Some of the definitions of sustainable energy include the considerations of environmental aspects such as greenhouse gas emissions, social, and economic aspects such as energy poverty. Generally far more sustainable than fossil fuel are renewable energy sources such as wind, hydroelectric power, solar, and geothermal energy sources. Worthy of note is that some renewable energy projects, like the clearing of forests to produce biofuels, can cause severe environmental damage. The sustainability of nuclear power which is a low carbon source is highly debated because of concerns about radioactive waste, nuclear proliferation, and accidents. The switching from coal to natural gas has environmental benefits, including a lower climate impact, but could lead to delay in switching to more sustainable options. “Carbon capture and storage” can be built into power plants to remove the carbon dioxide CO2 emissions, but this technology is expensive and has rarely been implemented. Leading non renewable energy sources around the world is fossil fuels, coal, petroleum, and natural gas. Nuclear energy is usually considered another non renewable energy source, although nuclear energy itself is a renewable energy source, but the material used in nuclear power plants is not. The paper addresses the issue of sustainable energy, its attendant benefits to the future generation, and humanity in general. Paul A. Adekunte | Matthew N. O. Sadiku | Janet O. Sadiku "Sustainable Energy" Published in International Journal of Trend in Scientific Research and Development (ijtsrd), ISSN: 2456-6470, Volume-8 | Issue-1 , February 2024, URL: https://www.ijtsrd.com/papers/ijtsrd64534.pdf Paper Url: https://www.ijtsrd.com/engineering/electrical-engineering/64534/sustainable-energy/paul-a-adekunte
Concepts for Sudan Survey Act Implementations Executive Regulations and Stand...ijtsrd
This paper aims to outline the executive regulations, survey standards, and specifications required for the implementation of the Sudan Survey Act, and for regulating and organizing all surveying work activities in Sudan. The act has been discussed for more than 5 years. The Land Survey Act was initiated by the Sudan Survey Authority and all official legislations were headed by the Sudan Ministry of Justice till it was issued in 2022. The paper presents conceptual guidelines to be used for the Survey Act implementation and to regulate the survey work practice, standardizing the field surveys, processing, quality control, procedures, and the processes related to survey work carried out by the stakeholders and relevant authorities in Sudan. The conceptual guidelines are meant to improve the quality and harmonization of geospatial data and to aid decision making processes as well as geospatial information systems. The established comprehensive executive regulations will govern and regulate the implementation of the Sudan Survey Geomatics Act in all surveying and mapping practices undertaken by the Sudan Survey Authority SSA and state local survey departments for public or private sector organizations. The targeted standards and specifications include the reference frame, projection, coordinate systems, and the guidelines and specifications that must be followed in the field of survey work, processes, and mapping products. In the last few decades, there has been a growing awareness of the importance of geomatics activities and measurements on the Earths surface in space and time, together with observing and mapping the changes. In such cases, data must be captured promptly, standardized, and obtained with more accuracy and specified in much detail. The paper will also highlight the current situation in Sudan, the degree to which survey standards are used, the problems encountered, and the errors that arise from not using the standards and survey specifications. Kamal A. A. Sami "Concepts for Sudan Survey Act Implementations - Executive Regulations and Standards" Published in International Journal of Trend in Scientific Research and Development (ijtsrd), ISSN: 2456-6470, Volume-8 | Issue-1 , February 2024, URL: https://www.ijtsrd.com/papers/ijtsrd63484.pdf Paper Url: https://www.ijtsrd.com/engineering/civil-engineering/63484/concepts-for-sudan-survey-act-implementations--executive-regulations-and-standards/kamal-a-a-sami
Towards the Implementation of the Sudan Interpolated Geoid Model Khartoum Sta...ijtsrd
The discussions between ellipsoid and geoid have invoked many researchers during the recent decades, especially during the GNSS technology era, which had witnessed a great deal of development but still geoid undulation requires more investigations. To figure out a solution for Sudans local geoid, this research has tried to intake the possibility of determining the geoid model by following two approaches, gravimetric and geometrical geoid model determination, by making use of GNSS leveling benchmarks at Khartoum state. The Benchmarks are well distributed in the study area, in which, the horizontal coordinates and the height above the ellipsoid have been observed by GNSS while orthometric heights were carried out using precise leveling. The Global Geopotential Model GGM represented in EGM2008 has been exploited to figure out the geoid undulation at the benchmarks in the study area. This is followed by a fitting process, that has been done to suit the geoid undulation data which has been computed using GNSS leveling data and geoid undulation inspired by the EGM2008. Two geoid surfaces were created after the fitting process to ensure that they are identical and both of them could be counted for getting the same geoid undulation with an acceptable accuracy. In this respect, statistical operation played an important role in ensuring the consistency and integrity of the model by applying cross validation techniques splitting the data into training and testing datasets for building the geoid model and testing its eligibility. The geometrical solution for geoid undulation computation has been utilized by applying straightforward equations that facilitate the calculation of the geoid undulation directly through applying statistical techniques for the GNSS leveling data of the study area to get the common equation parameters values that could be utilized to calculate geoid undulation of any position in the study area within the claimed accuracy. Both systems were checked and proved eligible to be used within the study area with acceptable accuracy which may contribute to solving the geoid undulation problem in the Khartoum area, and be further generalized to determine the geoid model over the entire country, and this could be considered in the future, for regional and continental geoid model. Ahmed M. A. Mohammed. | Kamal A. A. Sami "Towards the Implementation of the Sudan Interpolated Geoid Model (Khartoum State Case Study)" Published in International Journal of Trend in Scientific Research and Development (ijtsrd), ISSN: 2456-6470, Volume-8 | Issue-1 , February 2024, URL: https://www.ijtsrd.com/papers/ijtsrd63483.pdf Paper Url: https://www.ijtsrd.com/engineering/civil-engineering/63483/towards-the-implementation-of-the-sudan-interpolated-geoid-model-khartoum-state-case-study/ahmed-m-a-mohammed
Activating Geospatial Information for Sudans Sustainable Investment Mapijtsrd
Sudan is witnessing an acceleration in the processes of development and transformation in the performance of government institutions to raise the productivity and investment efficiency of the government sector. The development plans and investment opportunities have focused on achieving national goals in various sectors. This paper aims to illuminate the path to the future and provide geospatial data and information to develop the investment climate and environment for all sized businesses, and to bridge the development gap between the Sudan states. The Sudan Survey Authority SSA is the main advisor to the Sudan Government in conducting surveying, mappings, designing, and developing systems related to geospatial data and information. In recent years, SSA made a strategic partnership with the Ministry of Investment to activate Geospatial Information for Sudans Sustainable Investment and in particular, for the preparation and implementation of the Sudan investment map, based on the directives and objectives of the Ministry of Investment MI in Sudan. This paper comes within the framework of activating the efforts of the Ministry of Investment to develop technical investment services by applying techniques adopted by the Ministry and its strategic partners for advancing investment processes in the country. Kamal A. A. Sami "Activating Geospatial Information for Sudan's Sustainable Investment Map" Published in International Journal of Trend in Scientific Research and Development (ijtsrd), ISSN: 2456-6470, Volume-8 | Issue-1 , February 2024, URL: https://www.ijtsrd.com/papers/ijtsrd63482.pdf Paper Url: https://www.ijtsrd.com/engineering/information-technology/63482/activating-geospatial-information-for-sudans-sustainable-investment-map/kamal-a-a-sami
Educational Unity Embracing Diversity for a Stronger Societyijtsrd
In a rapidly changing global landscape, the importance of education as a unifying force cannot be overstated. This paper explores the crucial role of educational unity in fostering a stronger and more inclusive society through the embrace of diversity. By examining the benefits of diverse learning environments, the paper aims to highlight the positive impact on societal strength. The discussion encompasses various dimensions, from curriculum design to classroom dynamics, and emphasizes the need for educational institutions to become catalysts for unity in diversity. It highlights the need for a paradigm shift in educational policies, curricula, and pedagogical approaches to ensure that they are reflective of the diverse fabric of society. This paper also addresses the challenges associated with implementing inclusive educational practices and offers practical strategies for overcoming barriers. It advocates for collaborative efforts between educational institutions, policymakers, and communities to create a supportive ecosystem that promotes diversity and unity. Mr. Amit Adhikari | Madhumita Teli | Gopal Adhikari "Educational Unity: Embracing Diversity for a Stronger Society" Published in International Journal of Trend in Scientific Research and Development (ijtsrd), ISSN: 2456-6470, Volume-8 | Issue-1 , February 2024, URL: https://www.ijtsrd.com/papers/ijtsrd64525.pdf Paper Url: https://www.ijtsrd.com/humanities-and-the-arts/education/64525/educational-unity-embracing-diversity-for-a-stronger-society/mr-amit-adhikari
Integration of Indian Indigenous Knowledge System in Management Prospects and...ijtsrd
The diversity of indigenous knowledge systems in India is vast and can vary significantly between different communities and regions. Preserving and respecting these knowledge systems is crucial for maintaining cultural heritage, promoting sustainable practices, and fostering cross cultural understanding. In this paper, an overview of the prospects and challenges associated with incorporating Indian indigenous knowledge into management is explored. It is found that IIKS helps in management in many areas like sustainable development, tourism, food security, natural resource management, cultural preservation and innovation, etc. However, IIKS integration with management faces some challenges in the form of a lack of documentation, cultural sensitivity, language barriers legal framework, etc. Savita Lathwal "Integration of Indian Indigenous Knowledge System in Management: Prospects and Challenges" Published in International Journal of Trend in Scientific Research and Development (ijtsrd), ISSN: 2456-6470, Volume-8 | Issue-1 , February 2024, URL: https://www.ijtsrd.com/papers/ijtsrd63500.pdf Paper Url: https://www.ijtsrd.com/management/accounting-and-finance/63500/integration-of-indian-indigenous-knowledge-system-in-management-prospects-and-challenges/savita-lathwal
DeepMask Transforming Face Mask Identification for Better Pandemic Control in...ijtsrd
The COVID 19 pandemic has highlighted the crucial need of preventive measures, with widespread use of face masks being a key method for slowing the viruss spread. This research investigates face mask identification using deep learning as a technological solution to be reducing the risk of coronavirus transmission. The proposed method uses state of the art convolutional neural networks CNNs and transfer learning to automatically recognize persons who are not wearing masks in a variety of circumstances. We discuss how this strategy improves public health and safety by providing an efficient manner of enforcing mask wearing standards. The report also discusses the obstacles, ethical concerns, and prospective applications of face mask detection systems in the ongoing fight against the pandemic. Dilip Kumar Sharma | Aaditya Yadav "DeepMask: Transforming Face Mask Identification for Better Pandemic Control in the COVID-19 Era" Published in International Journal of Trend in Scientific Research and Development (ijtsrd), ISSN: 2456-6470, Volume-8 | Issue-1 , February 2024, URL: https://www.ijtsrd.com/papers/ijtsrd64522.pdf Paper Url: https://www.ijtsrd.com/engineering/electronics-and-communication-engineering/64522/deepmask-transforming-face-mask-identification-for-better-pandemic-control-in-the-covid19-era/dilip-kumar-sharma
Streamlining Data Collection eCRF Design and Machine Learningijtsrd
Efficient and accurate data collection is paramount in clinical trials, and the design of Electronic Case Report Forms eCRFs plays a pivotal role in streamlining this process. This paper explores the integration of machine learning techniques in the design and implementation of eCRFs to enhance data collection efficiency. We delve into the synergies between eCRF design principles and machine learning algorithms, aiming to optimize data quality, reduce errors, and expedite the overall data collection process. The application of machine learning in eCRF design brings forth innovative approaches to data validation, anomaly detection, and real time adaptability. This paper discusses the benefits, challenges, and future prospects of leveraging machine learning in eCRF design for streamlined and advanced data collection in clinical trials. Dhanalakshmi D | Vijaya Lakshmi Kannareddy "Streamlining Data Collection: eCRF Design and Machine Learning" Published in International Journal of Trend in Scientific Research and Development (ijtsrd), ISSN: 2456-6470, Volume-8 | Issue-1 , February 2024, URL: https://www.ijtsrd.com/papers/ijtsrd63515.pdf Paper Url: https://www.ijtsrd.com/biological-science/biotechnology/63515/streamlining-data-collection-ecrf-design-and-machine-learning/dhanalakshmi-d
A Strategic Approach: GenAI in EducationPeter Windle
Artificial Intelligence (AI) technologies such as Generative AI, Image Generators and Large Language Models have had a dramatic impact on teaching, learning and assessment over the past 18 months. The most immediate threat AI posed was to Academic Integrity with Higher Education Institutes (HEIs) focusing their efforts on combating the use of GenAI in assessment. Guidelines were developed for staff and students, policies put in place too. Innovative educators have forged paths in the use of Generative AI for teaching, learning and assessments leading to pockets of transformation springing up across HEIs, often with little or no top-down guidance, support or direction.
This Gasta posits a strategic approach to integrating AI into HEIs to prepare staff, students and the curriculum for an evolving world and workplace. We will highlight the advantages of working with these technologies beyond the realm of teaching, learning and assessment by considering prompt engineering skills, industry impact, curriculum changes, and the need for staff upskilling. In contrast, not engaging strategically with Generative AI poses risks, including falling behind peers, missed opportunities and failing to ensure our graduates remain employable. The rapid evolution of AI technologies necessitates a proactive and strategic approach if we are to remain relevant.
Introduction to AI for Nonprofits with Tapp NetworkTechSoup
Dive into the world of AI! Experts Jon Hill and Tareq Monaur will guide you through AI's role in enhancing nonprofit websites and basic marketing strategies, making it easy to understand and apply.
Model Attribute Check Company Auto PropertyCeline George
In Odoo, the multi-company feature allows you to manage multiple companies within a single Odoo database instance. Each company can have its own configurations while still sharing common resources such as products, customers, and suppliers.
Exploiting Artificial Intelligence for Empowering Researchers and Faculty, In...Dr. Vinod Kumar Kanvaria
Exploiting Artificial Intelligence for Empowering Researchers and Faculty,
International FDP on Fundamentals of Research in Social Sciences
at Integral University, Lucknow, 06.06.2024
By Dr. Vinod Kumar Kanvaria
A review of the growth of the Israel Genealogy Research Association Database Collection for the last 12 months. Our collection is now passed the 3 million mark and still growing. See which archives have contributed the most. See the different types of records we have, and which years have had records added. You can also see what we have for the future.
2024.06.01 Introducing a competency framework for languag learning materials ...Sandy Millin
http://sandymillin.wordpress.com/iateflwebinar2024
Published classroom materials form the basis of syllabuses, drive teacher professional development, and have a potentially huge influence on learners, teachers and education systems. All teachers also create their own materials, whether a few sentences on a blackboard, a highly-structured fully-realised online course, or anything in between. Despite this, the knowledge and skills needed to create effective language learning materials are rarely part of teacher training, and are mostly learnt by trial and error.
Knowledge and skills frameworks, generally called competency frameworks, for ELT teachers, trainers and managers have existed for a few years now. However, until I created one for my MA dissertation, there wasn’t one drawing together what we need to know and do to be able to effectively produce language learning materials.
This webinar will introduce you to my framework, highlighting the key competencies I identified from my research. It will also show how anybody involved in language teaching (any language, not just English!), teacher training, managing schools or developing language learning materials can benefit from using the framework.
Francesca Gottschalk - How can education support child empowerment.pptxEduSkills OECD
Francesca Gottschalk from the OECD’s Centre for Educational Research and Innovation presents at the Ask an Expert Webinar: How can education support child empowerment?
Normal Labour/ Stages of Labour/ Mechanism of LabourWasim Ak
Normal labor is also termed spontaneous labor, defined as the natural physiological process through which the fetus, placenta, and membranes are expelled from the uterus through the birth canal at term (37 to 42 weeks
Biological screening of herbal drugs: Introduction and Need for
Phyto-Pharmacological Screening, New Strategies for evaluating
Natural Products, In vitro evaluation techniques for Antioxidants, Antimicrobial and Anticancer drugs. In vivo evaluation techniques
for Anti-inflammatory, Antiulcer, Anticancer, Wound healing, Antidiabetic, Hepatoprotective, Cardio protective, Diuretics and
Antifertility, Toxicity studies as per OECD guidelines
2. International Journal of Trend in Scientific Research and Development @ www.ijtsrd.com eISSN: 2456-6470
@ IJTSRD | Unique Paper ID – IJTSRD49868 | Volume – 6 | Issue – 3 | Mar-Apr 2022 Page 2047
space is so complicated that finding that function is
an impossible thing to do. The real challenge is to try
and approximate that function using neural-networks
in a way that we can profit by applying it in the stock
market. The focus of this thesis is to try to
approximate the stock market as good as possible and
try to maximize our profit.
2. Literature Review
The stock returns is an area of study wherein many
research scholars have shown immense interest for
past several years. A brief review of literature will
help in understanding the relevance of the content
analysis in the area of stock returns. The first set of
articles includes studies that primarily focus on stock
market prediction using Moving Average, ARIMA
MODEL and LSTM. The researches in social
sciences or in the field of economics depend in one
way or the other on careful reading of written
materials and the research work done by many
research scholars on similar subjects. Considering this
fact, the importance of content analysis becomes very
significant.
The objective of this paper is to construct a model to
predict stock worth movement mistreatment the
Moving Average, ARIMA MODEL and LSTM to
predict National securities market (NSE). It used
domain specific approach to predict the stocks from
every domain and brought some stock with most
capitalization. Topics and connected opinion of
shareholders are mechanically extracted from the
writings in an exceedingly message board by utilizing
our projected strategy aboard uninflected clusters of
comparable type of stocks from others mistreatment
clump algorithms.
The various areas to which the technique of content
analysis can be applied are based on the user’s skill
and ingenuity in framing valid category formats as
discussed in the research. Stock price prediction is a
challenging task owing to the complexity patterns
behind time series. Autoregressive integrated moving
average (ARIMA) model, Moving Average and
Long-Short Term Memory (LSTM) model are
popular linear and nonlinear models for time series
forecasting respectively. The integration of two
models can effectively capture the linear and
nonlinear patterns hidden in a time series and improve
forecast accuracy. In this paper, a new hybrid
ARIMA-BPNN model containing technical indicators
is proposed to forecast four individual stocks
consisting of both main board market and growth
enterprise market in software and information
services.
Barelson (1952) defined content analysis as a
technique of research that is systematic representation
of the matter of communication. According to Stone
(1964), the content analysis is a methodology or
procedure which can be used to access particular
information based on the past references. The
definition of content analysis requires that the
inference be derived from the counts of frequency to
place a number of standard methods on the borderline
of acceptability (Leites & Poo, 1942).
Enke and Thawornwong (2005) use a machine
learning information gain technique to evaluate the
predictive relationships for numerous financial and
economic variables. By computing the information
gain for each model variable, a ranking of the
variables is obtained. A threshold is determined to
select only the strongest relevant variables to be
retained in the forecasting models.
2.1. SCOPE OF THE STUDY
Data forecasting is really convenient topic of research
from last few decades and may remain active topic in
upcoming years also. Stock price prediction also used
data forecasting is basically is one of favorite topic
among researchers. A lot of research is already done
in this field like Stock price prediction can be using
neural, fuzzy, machine learning, R programming and
so on. Here we want to predict future stock price
using the some predictive services. This will provide
help to get more accurate results for predicting stock
price prediction. In future we can analyze this stock
market historical data in some other way to find more
accurate results. We can deal with the not only
finding of future stock price prediction but also tried
to reduce mismatch value i.e. difference between
actual price and predicted price. Threshold value can
be reduced to move toward more accurate value.
3. International Journal of Trend in Scientific Research and Development @ www.ijtsrd.com eISSN: 2456-6470
@ IJTSRD | Unique Paper ID – IJTSRD49868 | Volume – 6 | Issue – 3 | Mar-Apr 2022 Page 2048
3. Prediction Techniques
Fig 1: Prediction Techniques
3.1. MOVING AVERAGE
Fig 2: Moving Average
‘Average’ is easily one of the most common things we use in our day-to-day lives. For instance, calculating the
average marks to determine overall performance, or finding the average temperature of the past few days to get
an idea about today’s temperature – these all are routine tasks we do on a regular basis. So this is a good starting
point to use on our dataset for making predictions.
3.2. ARIMA MODEL
Auto-Regressive Integrated Moving Average is a model which is used in statistics and econometrics to measure
events that happen over a period of time. It’s a class of statistical models for analyzing and forecasting time
series data. The model understands past data and predicts future data in the series. It’s used when a metric is
recorded in regular intervals, from fractions of a second to daily, weekly or monthly periods.
AR – Auto-regression: It predicts future values based on past values.
I - integrated: The use of differencing of raw observations in order to make the time series stationary
MA - Moving Average: It is the dependency between an observed value and a residual error from a moving
average model applied to previous observations.
In forecasting stock prices, the model reflects the differences between the values in a series rather than
measuring the actual values.
ADVANTAGES:
∑ ARIMA model has a fixed structure and is specifically built for time series (sequential) data.
∑ ARIMA works better for relatively short series when the number of observations is not sufficient to
apply more flexible methods.
DISADVANTAGES:
∑ ARIMA models can only be highly accurate and reliable under the appropriate conditions and data
availability.
∑ The ARIMA model tends to be unstable, both with respect to changes in observations and changes in
model specification.
4. International Journal of Trend in Scientific Research and Development @ www.ijtsrd.com eISSN: 2456-6470
@ IJTSRD | Unique Paper ID – IJTSRD49868 | Volume – 6 | Issue – 3 | Mar-Apr 2022 Page 2049
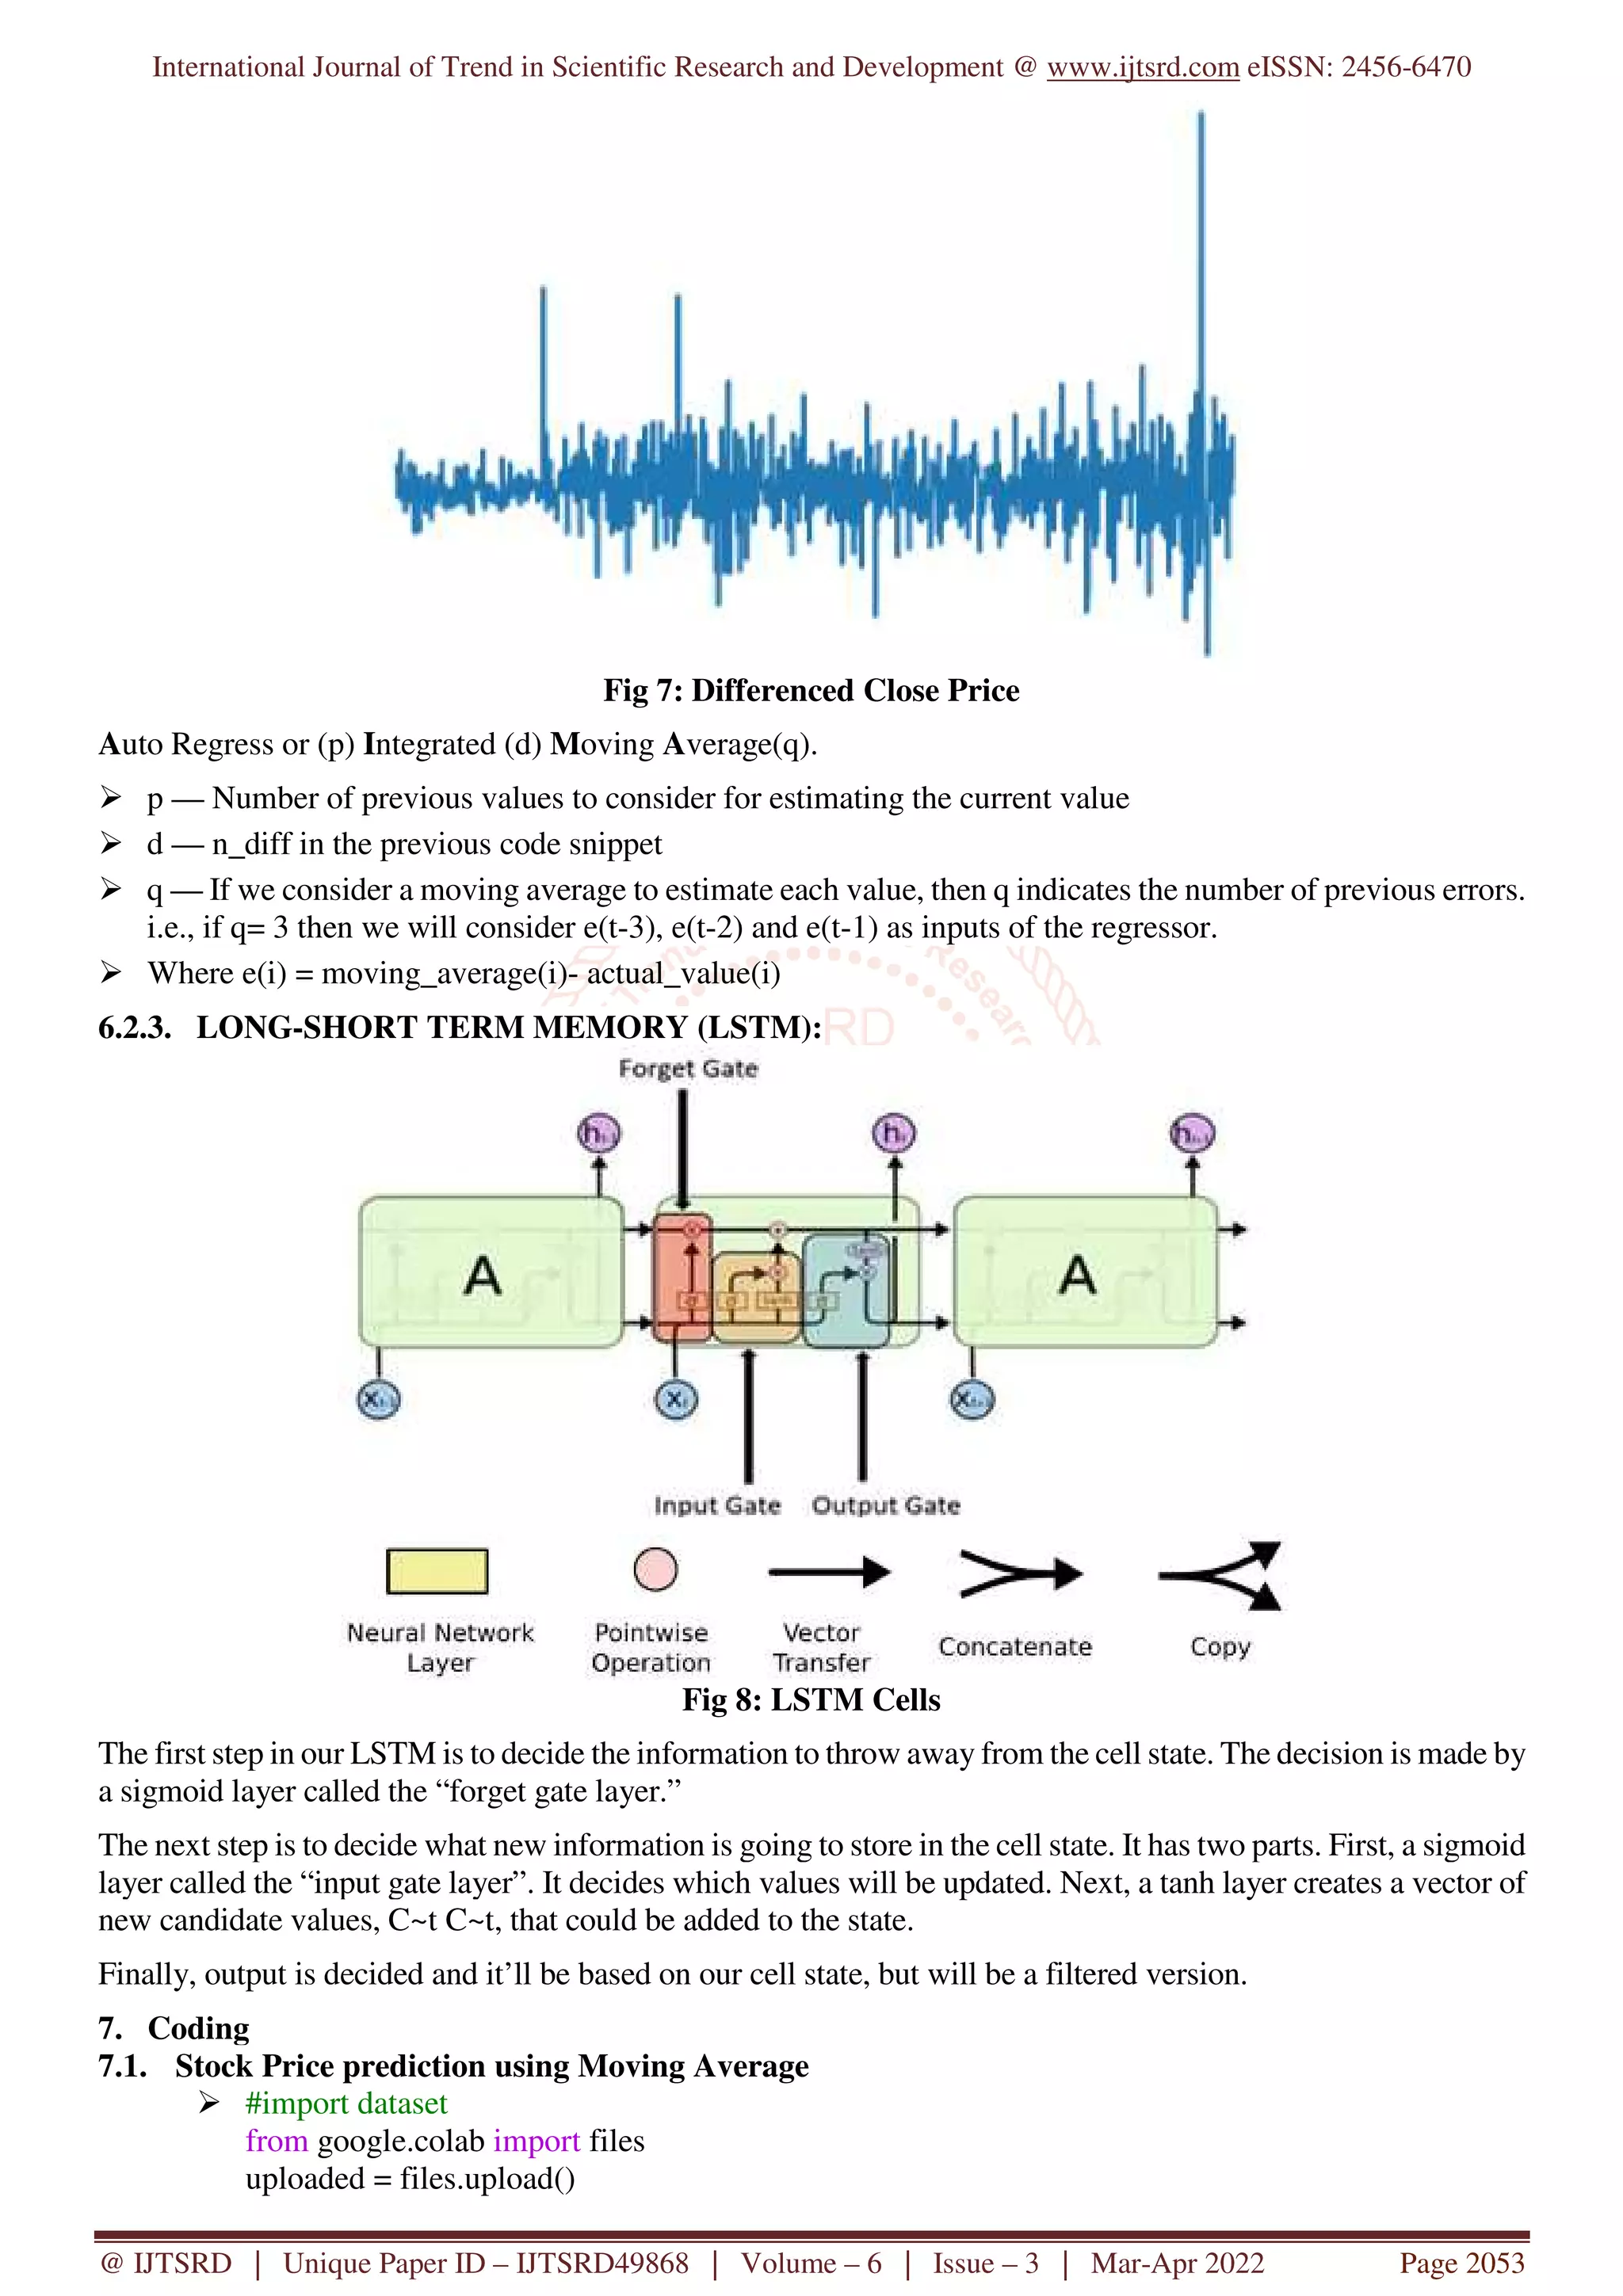
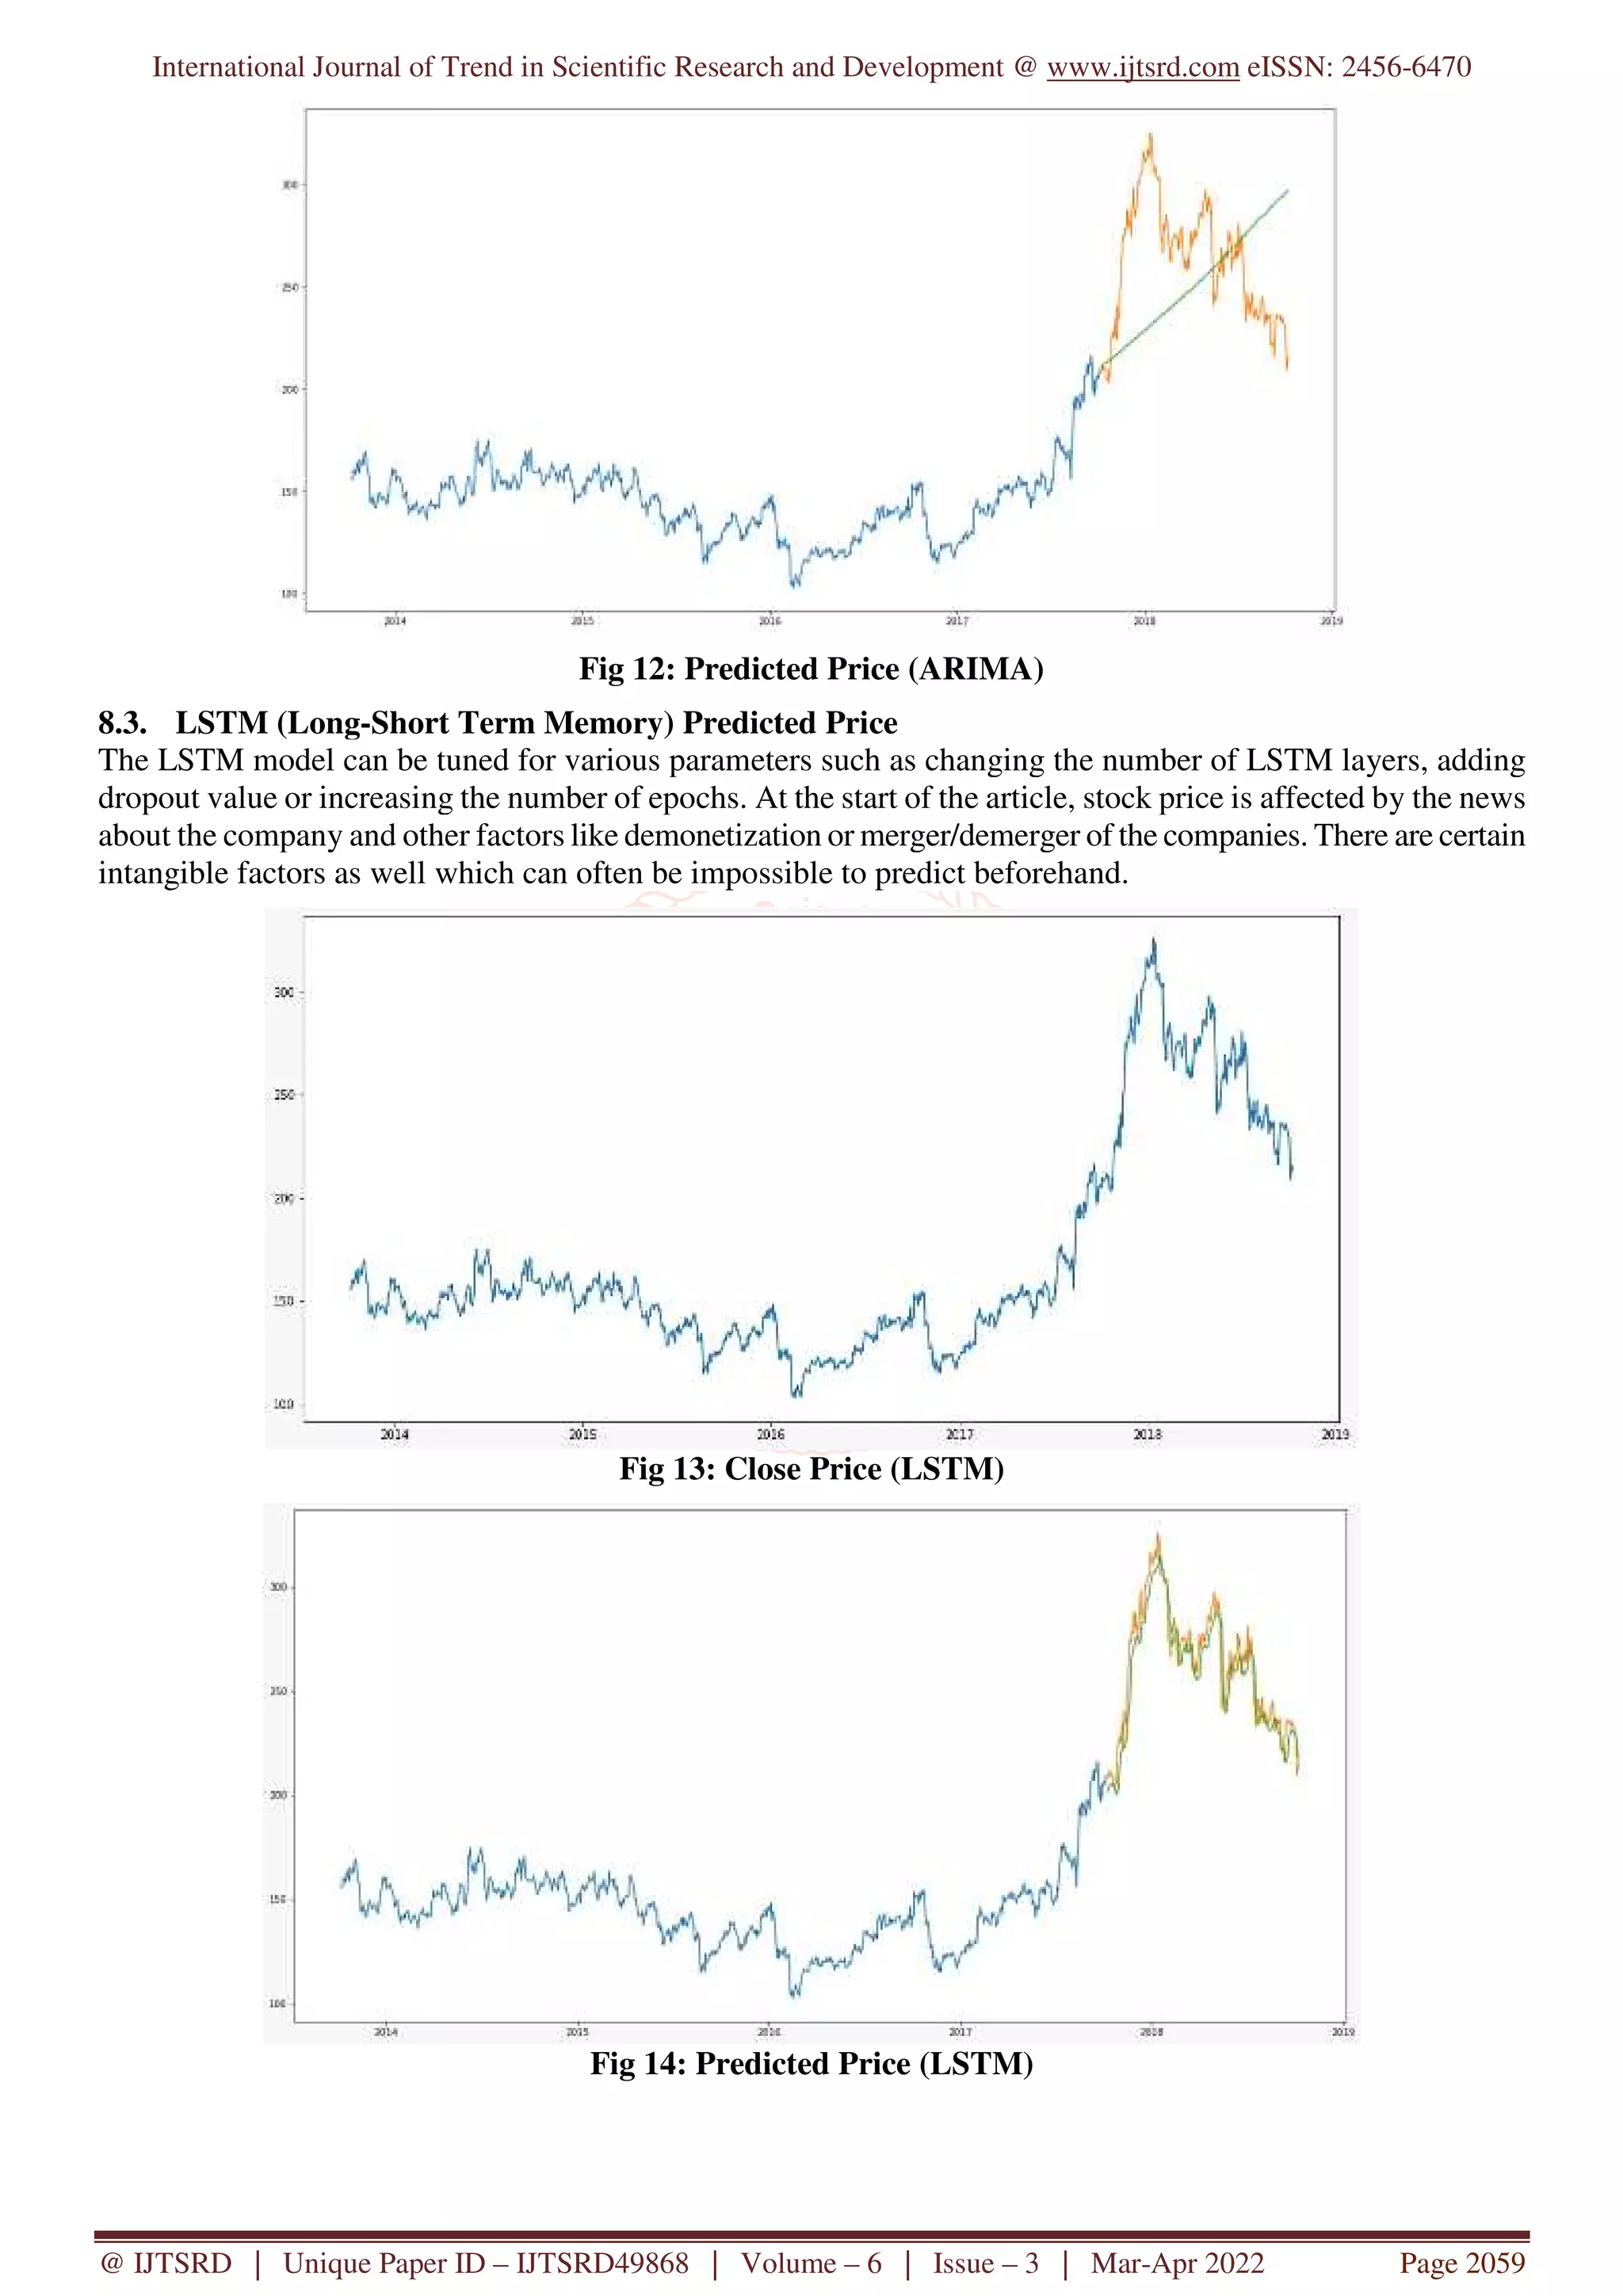
3.3. LSTM – Long Short – Term Memory
Long Short-Term Memory (LSTM) networks are a type of recurrent neural network capable of learning order
dependence in sequence prediction problems as they can store past information. This is important as the previous
price of a stock is crucial in predicting its future price. LSTM neural networks are capable of solving numerous
tasks that are not solvable by previous learning algorithms like RNNs. Long Short-Term Memory (LSTM)
networks are a modified version of recurrent neural networks, which makes it easier to remember past data in
memory. LSTM is well-suited to classify, process, and predict time series given time lags of unknown duration.
A common LSTM unit is composed of a cell, an input gate, an output gate and a forget gate.
Fig 3: LSTM
ADVANTAGES:
∑ LSTM cells have a memory that can store previous time step information and use it to train the dataset. It
has the ability to bridge very long time lags.
∑ LSTM doesn’t have the vanishing gradient problem which a traditional RNN has.
DISADVANTAGES:
∑ They require a lot of resources and time to get trained and become ready for real-world applications
What is GCP based on?
What is GCP? GCP is a public cloud vendor — like competitors Amazon Web Services (AWS) and Microsoft
Azure. With GCP and other cloud vendors, customers are able to access computer resources housed in Google's
data centers around the world for free or on a pay-per-use basis.
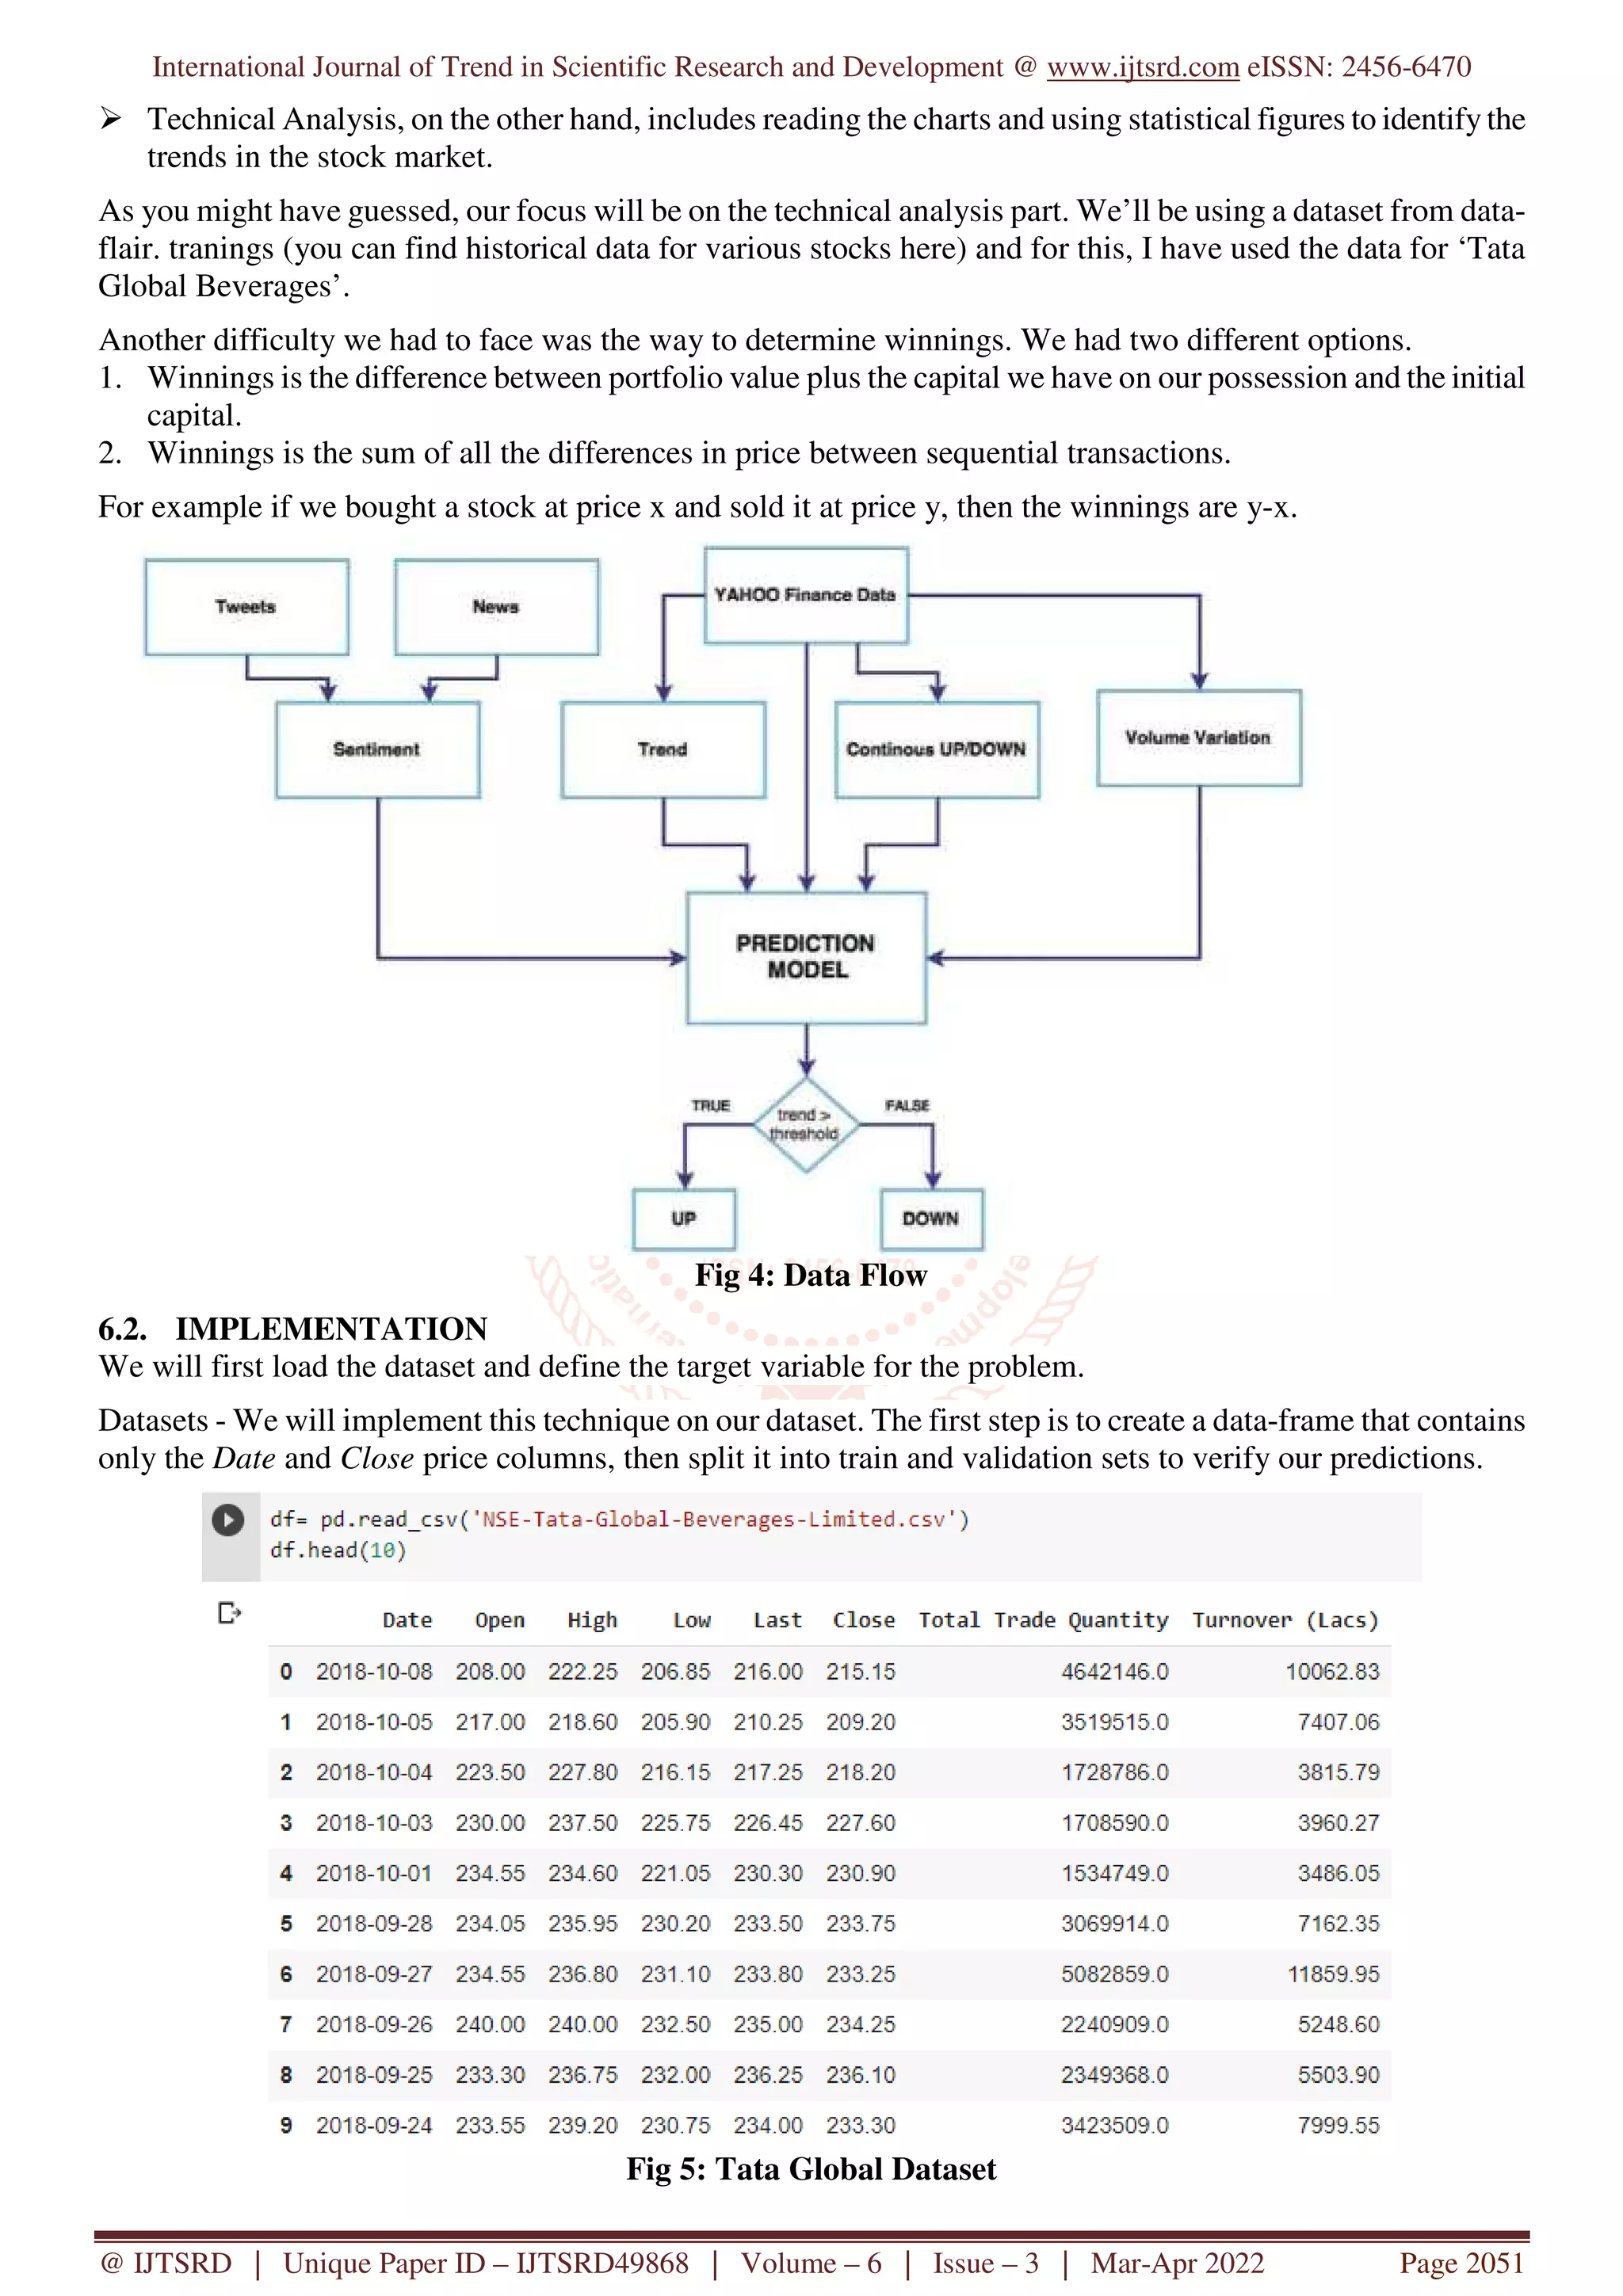
4. Financial Definition
4.1. Stock Market
Stock prediction is using historical price, related market information and so on to forecast exact price or price
trend of the stock in the near future. According to the time granularity of price information, stock trading can be
divided into low-latency trading based on daily basis and high-frequency trading, which market exchanges in a
matter of hours, minutes, even seconds. High-frequency trading analysis is more common in hedge funds,
investment banks, and large institutional investors. It masters the trading signals before prices' ups and downs
through analyzing great amount of trading data [20]. In this thesis, only low-latency trading is taking into
consideration, which is more common in academia. Its core concept is to increase the accuracy of stock
prediction based on the related market information
The Indian stock market mainly studies stocks traded at National Stock Exchange (NSE) and Bombay Stock
Exchange (BSE). NSE or National Stock Exchange is located in Mumbai, and it is India’s leading stock
exchange market. It first came into existence in 1992 and brought with it an electronic exchange system in India,
5. International Journal of Trend in Scientific Research and Development @ www.ijtsrd.com eISSN: 2456-6470
@ IJTSRD | Unique Paper ID – IJTSRD49868 | Volume – 6 | Issue – 3 | Mar-Apr 2022 Page 2050
which led to the removal of the paper based system. In 1875, BSE or Bombay Stock Exchange was established,
and it was formerly known as 'The native share and stock brokers association’. However, after 1957,
Government of India recognized this stock exchange as the premier stock exchange of India, under the Securities
Contract Regulation Act, 1956.
The BSE's Sensex comprises of 30 companies, while NSE's Nifty comprises of 50 companies.
Both the stock exchanges, National Stock Exchange and Bombay Stock Exchange, are an important part of
Indian Capital Market. Every day, hundreds of thousands of brokers and investors trade on these stock
exchanges. And both are established in Mumbai, Maharashtra, and SEBI (Securities and Exchange Board of
India) recognized.
4.2. Stock Trend Definition
In this thesis, I will mainly focus on predicting ups and downs of stock. Stocks leave some important trading
data after each trading day, such as open price, close price, adjusted close price, highest price, lowest price,
volume, etc. Among all, adjusted close price usually represents the stock price of that trading day. In the trading
period, there will be a series of adjusted close prices. Let us denote it as:
p1, p2, p3,..., pT .
Here, pt is the close price on t trading day, T is total trading days in this period. Stock price of a certain trading
day will rise or drop comparing to previous trading day, thus, here I used the change of closing price of two
consecutive trading days as the judgment. Let us denote trading situation as:
yt = 8 ><>: 1 if pt > pt1, 0 if pt pt1.
If it is 1, it means the price goes up on the second trading day. Otherwise, if it is 0, it means the price goes down
or remains the same.
5. Objective of the Study
Objectives of the study are defined as follow:
The main objective of this study is to predict the future stock price by analyzing the past historical data that
we were going to collect from the National Stock Exchange.
Predicting the Stock market cost in such a way that it will provide most accurate results.
Stock market price forecasting should be done in such a way that predicted price should minimize the
threshold value (difference between actual value and predicted value also known as mispricing) and close
enough to the actual value.
Process of analyzing the historical data should be simple and easy to understand. For this feature
identification can done intelligently to provide most accurate results.
To increase the efficiency of the data analysis technique by using some cloud based tools.
To analyze the performance and comparing proposed algorithm with the existing algorithms in terms of
predicted price accuracy, close price predicted and accurate close price etc.
6. Methodology
6.1. PROBLEM STATEMENTS
Stock market is so complicated and many things can affect the change in a price. Not only financial factors can
influence the price of a stock. Things like news or the general mood can affect the price in many ways positive
or negative. If it was possible to model the stock market with a function it would be a complex function that
lives in high-dimensional, maybe infinite dimensional, space.
Imagine what would happen if someone knew a away to calculate that function. That someone would be able to
profit by taking advantage of it. However the nature of the space is so complicated that finding that function is
an impossible thing to do. The real challenge is to try and approximate that function using neural-networks in a
way that we can profit by applying it in the stock market. The focus of this thesis is to try to approximate the
stock market as good as possible and try to maximize our profit.
We’ll dive into the implementation part of this article soon, but first it’s important to establish what we’re
aiming to solve. Broadly, stock market analysis is divided into two parts – Fundamental Analysis and Technical
Analysis.
Fundamental Analysis involves analyzing the company’s future profitability on the basis of its current
business environment and financial performance.
6. International Journal of Trend in Scientific Research and Development @ www.ijtsrd.com eISSN: 2456-6470
@ IJTSRD | Unique Paper ID – IJTSRD49868 | Volume – 6 | Issue – 3 | Mar-Apr 2022 Page 2051
Technical Analysis, on the other hand, includes reading the charts and using statistical figures to identify the
trends in the stock market.
As you might have guessed, our focus will be on the technical analysis part. We’ll be using a dataset from data-
flair. tranings (you can find historical data for various stocks here) and for this, I have used the data for ‘Tata
Global Beverages’.
Another difficulty we had to face was the way to determine winnings. We had two different options.
1. Winnings is the difference between portfolio value plus the capital we have on our possession and the initial
capital.
2. Winnings is the sum of all the differences in price between sequential transactions.
For example if we bought a stock at price x and sold it at price y, then the winnings are y-x.
Fig 4: Data Flow
6.2. IMPLEMENTATION
We will first load the dataset and define the target variable for the problem.
Datasets - We will implement this technique on our dataset. The first step is to create a data-frame that contains
only the Date and Close price columns, then split it into train and validation sets to verify our predictions.
Fig 5: Tata Global Dataset
7. International Journal of Trend in Scientific Research and Development @ www.ijtsrd.com eISSN: 2456-6470
@ IJTSRD | Unique Paper ID – IJTSRD49868 | Volume – 6 | Issue – 3 | Mar-Apr 2022 Page 2052
There are multiple variables in the dataset – date, open, high, low, last, close, total_trade_quantity, and turnover.
The columns Open and Close represent the starting and final price at which the stock is traded on a particular
day.
High, Low and Last represent the maximum, minimum, and last price of the share for the day.
Total Trade Quantity is the number of shares bought or sold in the day and Turnover (Lacs) is the turnover
of the particular company on a given date.
Another important thing to note is that the market is closed on weekends and public holidays. Notice the above
table again, some date values are missing – 2/10/2018, 6/10/2018, 7/10/2018. Of these dates, 2nd is a national
holiday while 6th and 7th fall on a weekend. The profit or loss calculation is usually determined by the closing
price of a stock for the day; hence we will consider the closing price as the target variable.
6.2.1. MOVING AVERAGE:
In stock market analysis, a 50 or 200-day moving average is most commonly used to see trends in the stock
market and indicate where stocks are headed. The MA is used in trading as a simple technical analysis tool that
helps determine price data by customizing average price. There are many advantages in using a moving average
in trading that can be tailored to any time frame. Depending on what information you want to find out, there are
different types of moving averages to use.
The MA is the calculated average of any subset of numbers, using a technique to get an overall idea of the trends
in a data set. Once you understand the MA formula, you can start to calculate any subsets to get your MA. It can
be calculated for any period of time, making it extremely useful to forecast both long and short-term trends.
Fig 6: Moving Average (SMA 20)
The SMA formula is calculated by taking the average closing price of a security over any period desired. To
calculate a moving average formula, the total closing price is divided by the number of periods.
For example, if the last five closing prices are:
28.93+28.48 +28.44+28.91+28.48 = 143.24
The five-day SMA is: 142.24/5= 28.65.
6.2.2. ARIMA MODEL:
We can de-trend the model by differencing each value from a value in the past and modeling these differences.
Later, adding the value from the past to arrive at the actual value. We can choose to difference each value from a
value at t-1 or t-2 or t-3 … Upon experimentation I found t-2 to give good results. By good results I mean the
stationarity of the resulting time series was better. Again, to know what is stationarity and how to measure it
please go through the link in the prerequisite section.
8. International Journal of Trend in Scientific Research and Development @ www.ijtsrd.com eISSN: 2456-6470
@ IJTSRD | Unique Paper ID – IJTSRD49868 | Volume – 6 | Issue – 3 | Mar-Apr 2022 Page 2053
Fig 7: Differenced Close Price
Auto Regress or (p) Integrated (d) Moving Average(q).
p — Number of previous values to consider for estimating the current value
d — n_diff in the previous code snippet
q — If we consider a moving average to estimate each value, then q indicates the number of previous errors.
i.e., if q= 3 then we will consider e(t-3), e(t-2) and e(t-1) as inputs of the regressor.
Where e(i) = moving_average(i)- actual_value(i)
6.2.3. LONG-SHORT TERM MEMORY (LSTM):
Fig 8: LSTM Cells
The first step in our LSTM is to decide the information to throw away from the cell state. The decision is made by
a sigmoid layer called the “forget gate layer.”
The next step is to decide what new information is going to store in the cell state. It has two parts. First, a sigmoid
layer called the “input gate layer”. It decides which values will be updated. Next, a tanh layer creates a vector of
new candidate values, C~t C~t, that could be added to the state.
Finally, output is decided and it’ll be based on our cell state, but will be a filtered version.
7. Coding
7.1. Stock Price prediction using Moving Average
#import dataset
from google.colab import files
uploaded = files.upload()
9. International Journal of Trend in Scientific Research and Development @ www.ijtsrd.com eISSN: 2456-6470
@ IJTSRD | Unique Paper ID – IJTSRD49868 | Volume – 6 | Issue – 3 | Mar-Apr 2022 Page 2054
#import packages
import pandas as pd
import numpy as np
#to plot within notebook
import matplotlib.pyplot as plt
%matplotlib inline
#setting figure size
from matplotlib.pylab import rcParams
rcParams['figure.figsize'] = 20,10
#for normalizing data
from sklearn.preprocessing import MinMaxScaler
scaler = MinMaxScaler(feature_range=(0, 1))
#read the file
df = pd.read_csv('NSE-Tata-Global-Beverages-Limited.csv')
#print the head
df.head()
#setting index as date
df['Date'] = pd.to_datetime(df.Date,format='%Y-%m-%d')
df.index = df['Date']
#plot
plt.figure(figsize=(16,8))
plt.plot(df['Close'], label='Close Price history')
# importing libraries
import pandas as pd
import numpy as np
# reading the data
df = pd.read_csv('NSE-Tata-Global-Beverages-Limited.csv')
# looking at the first five rows of the data
print(df.head())
print('n Shape of the data:')
print(df.shape)
# setting the index as date
df['Date'] = pd.to_datetime(df.Date,format='%Y-%m-%d')
df.index = df['Date']
#creating dataframe with date and the target variable
data = df.sort_index(ascending=True, axis=0)
new_data = pd.DataFrame(index=range(0,len(df)),columns=['Date', 'Close'])
for i in range(0,len(data)):
new_data['Date'][i] = data['Date'][i]
new_data['Close'][i] = data['Close'][i]
# NOTE: While splitting the data into train and validation set, we cannot use random splitting since t
hat will destroy the time component. So here we have set the last year’s data into validation and the 4
years’ data before that into train set.
# splitting into train and validation
train = new_data[:987]
valid = new_data[987:]
# shapes of training set
print('n Shape of training set:')
print(train.shape)
10. International Journal of Trend in Scientific Research and Development @ www.ijtsrd.com eISSN: 2456-6470
@ IJTSRD | Unique Paper ID – IJTSRD49868 | Volume – 6 | Issue – 3 | Mar-Apr 2022 Page 2055
# shapes of validation set
print('n Shape of validation set:')
print(valid.shape)
# In the next step, we will create predictions for the validation set and check the RMSE using the act
ual values.
# making predictions
preds = []
for i in range(0,valid.shape[0]):
a = train['Close'][len(train)-248+i:].sum() + sum(preds)
b = a/248
preds.append(b)
# checking the results (RMSE value)
rms=np.sqrt(np.mean(np.power((np.array(valid['Close'])-preds),2)))
print('n RMSE value on validation set:')
print(rms)
#plot the graph
valid['Predictions'] = 0
valid['Predictions'] = preds
plt.plot(train['Close'])
plt.plot(valid[['Close', 'Predictions']])
7.2. Stock Price prediction using LSTM :
#import dataset
from google.colab import files
uploaded = files.upload()
#import packages
import pandas as pd
import numpy as np
#to plot within notebook
import matplotlib.pyplot as plt
%matplotlib inline
#setting figure size
from matplotlib.pylab import rcParams
rcParams['figure.figsize'] = 20,10
#for normalizing data
from sklearn.preprocessing import MinMaxScaler
scaler = MinMaxScaler(feature_range=(0, 1))
#read the file
df = pd.read_csv('NSE-Tata-Global-Beverages-Limited.csv')
#print the head
df.head()
#setting index as date
df['Date'] = pd.to_datetime(df.Date,format='%Y-%m-%d')
df.index = df['Date']
#plot
plt.figure(figsize=(16,8))
plt.plot(df['Close'], label='Close Price history')
#importing required libraries
from sklearn.preprocessing import MinMaxScaler
from keras.models import Sequential
from keras.layers import Dense, Dropout, LSTM
11. International Journal of Trend in Scientific Research and Development @ www.ijtsrd.com eISSN: 2456-6470
@ IJTSRD | Unique Paper ID – IJTSRD49868 | Volume – 6 | Issue – 3 | Mar-Apr 2022 Page 2056
#creating dataframe
data = df.sort_index(ascending=True, axis=0)
new_data = pd.DataFrame(index=range(0,len(df)),columns=['Date', 'Close'])
for i in range(0,len(data)):
new_data['Date'][i] = data['Date'][i]
new_data['Close'][i] = data['Close'][i]
#setting index
new_data.index = new_data.Date
new_data.drop('Date', axis=1, inplace=True)
#creating train and test sets
dataset = new_data.values
train = dataset[0:987,:]
valid = dataset[987:,:]
#converting dataset into x_train and y_train
scaler = MinMaxScaler(feature_range=(0, 1))
scaled_data = scaler.fit_transform(dataset)
x_train, y_train = [], []
for i in range(60,len(train)):
x_train.append(scaled_data[i-60:i,0])
y_train.append(scaled_data[i,0])
x_train, y_train = np.array(x_train), np.array(y_train)
x_train = np.reshape(x_train, (x_train.shape[0],x_train.shape[1],1))
# create and fit the LSTM network
model = Sequential()
model.add(LSTM(units=50, return_sequences=True, input_shape=(x_train.shape[1],1)))
model.add(LSTM(units=50))
model.add(Dense(1))
model.compile(loss='mean_squared_error', optimizer='adam')
model.fit(x_train, y_train, epochs=1, batch_size=1, verbose=2)
#predicting 246 values, using past 60 from the train data
inputs = new_data[len(new_data) - len(valid) - 60:].values
inputs = inputs.reshape(-1,1)
inputs = scaler.transform(inputs)
X_test = []
for i in range(60,inputs.shape[0]):
X_test.append(inputs[i-60:i,0])
X_test = np.array(X_test)
X_test = np.reshape(X_test, (X_test.shape[0],X_test.shape[1],1))
closing_price = model.predict(X_test)
closing_price = scaler.inverse_transform(closing_price)
#calculating RMS value
rms=np.sqrt(np.mean(np.power((valid-closing_price),2)))
rms
#for plotting
train = new_data[:987]
valid = new_data[987:]
valid['Predictions'] = closing_price
plt.plot(train['Close'])
plt.plot(valid[['Close','Predictions']])
12. International Journal of Trend in Scientific Research and Development @ www.ijtsrd.com eISSN: 2456-6470
@ IJTSRD | Unique Paper ID – IJTSRD49868 | Volume – 6 | Issue – 3 | Mar-Apr 2022 Page 2057
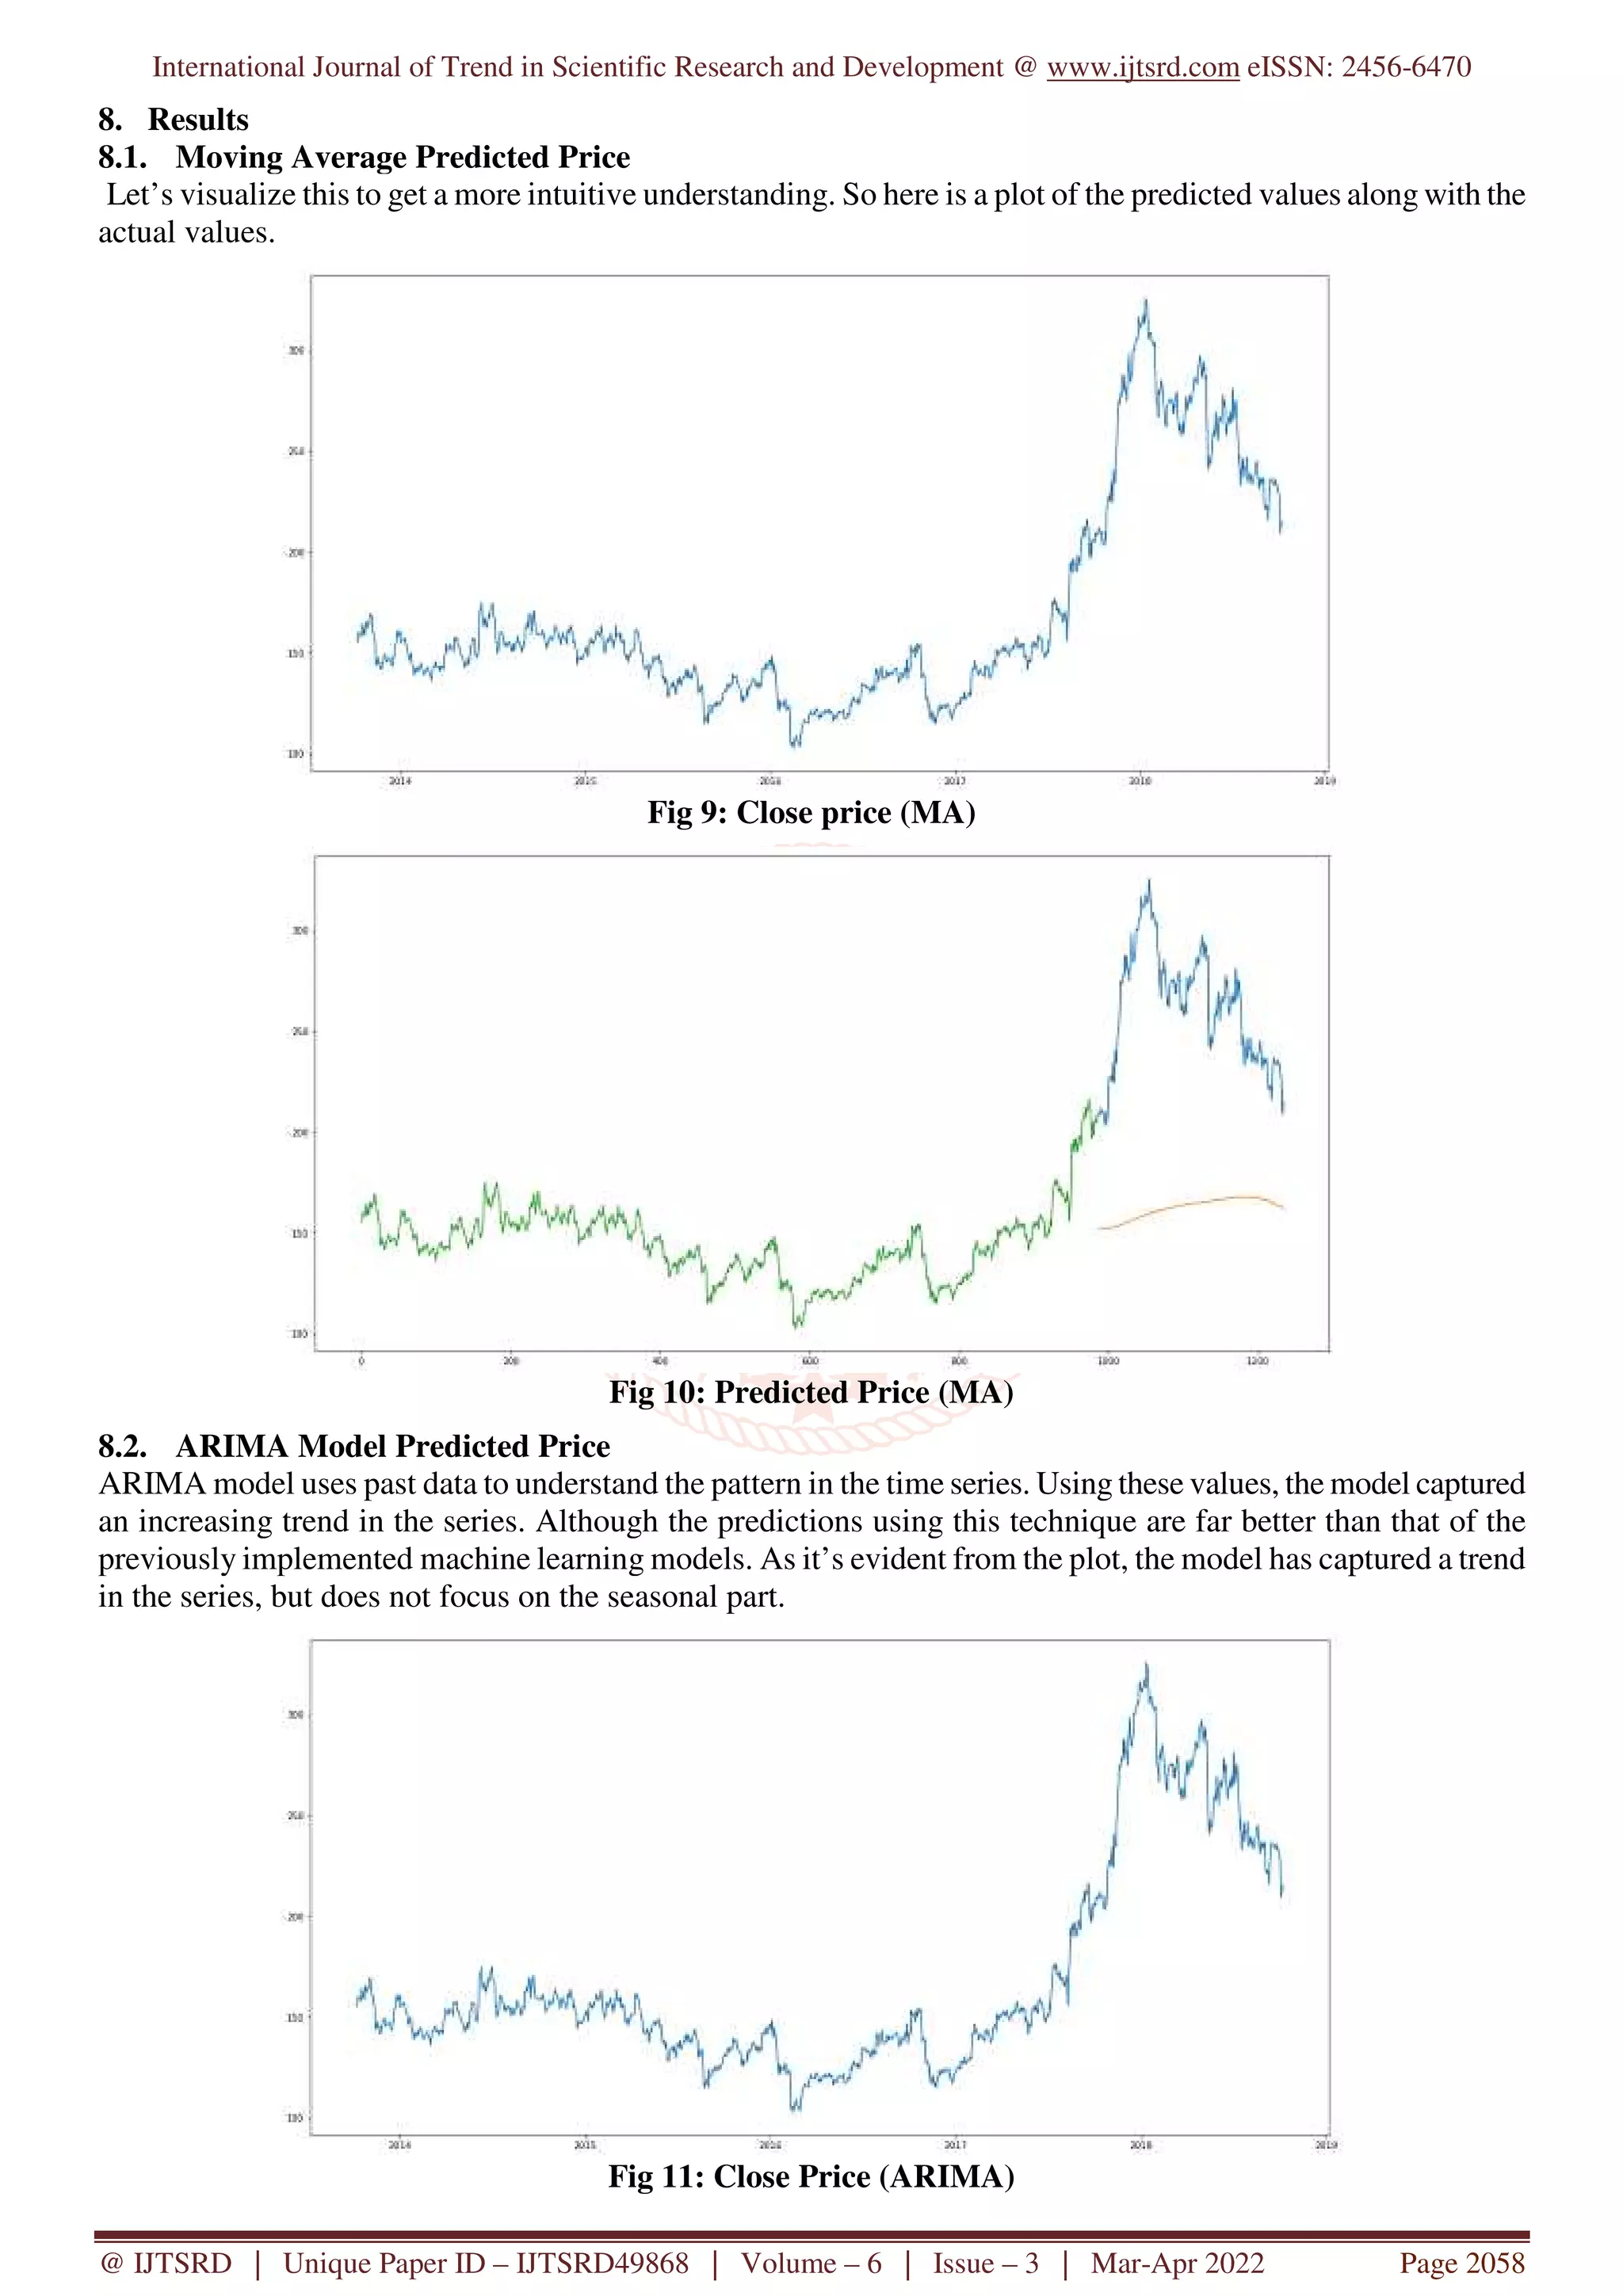
7.3. Stock Price prediction using ARIMA Model:
#import dataset
from google.colab import files
uploaded = files.upload()
#import packages
import pandas as pd
import numpy as np
#to plot within notebook
import matplotlib.pyplot as plt
%matplotlib inline
#setting figure size
from matplotlib.pylab import rcParams
rcParams['figure.figsize'] = 20,10
#for normalizing data
from sklearn.preprocessing import MinMaxScaler
scaler = MinMaxScaler(feature_range=(0, 1))
#read the file
df = pd.read_csv('NSE-Tata-Global-Beverages-Limited.csv')
#print the head
df.head()
#setting index as date
df['Date'] = pd.to_datetime(df.Date,format='%Y-%m-%d')
df.index = df['Date']
#plot
plt.figure(figsize=(16,8))
plt.plot(df['Close'], label='Close Price history')
#installing new lib files
pip install pyramid
pip install pmdarima
#import package and setting the training
from pmdarima import auto_arima
data = df.sort_index(ascending=True, axis=0)
train = data[:987]
valid = data[987:]
training = train['Close']
validation = valid['Close']
model = auto_arima(training, start_p=1, start_q=1,max_p=3, max_q=3, m=12,start_P=0, seasonal=T
rue,d=1, D=1, trace=True,error_action='ignore',suppress_warnings=True)
model.fit(training)
forecast = model.predict(n_periods=248)
forecast = pd.DataFrame(forecast,index = valid.index,columns=['Prediction'])
#calculating RMS value
rms=np.sqrt(np.mean(np.power((np.array(valid['Close'])-np.array(forecast['Prediction'])),2)))
rms
#plot the graph
plt.plot(train['Close'])
plt.plot(valid['Close'])
plt.plot(forecast['Prediction'])
13. International Journal of Trend in Scientific Research and Development @ www.ijtsrd.com eISSN: 2456-6470
@ IJTSRD | Unique Paper ID – IJTSRD49868 | Volume – 6 | Issue – 3 | Mar-Apr 2022 Page 2058
8. Results
8.1. Moving Average Predicted Price
Let’s visualize this to get a more intuitive understanding. So here is a plot of the predicted values along with the
actual values.
Fig 9: Close price (MA)
Fig 10: Predicted Price (MA)
8.2. ARIMA Model Predicted Price
ARIMA model uses past data to understand the pattern in the time series. Using these values, the model captured
an increasing trend in the series. Although the predictions using this technique are far better than that of the
previously implemented machine learning models. As it’s evident from the plot, the model has captured a trend
in the series, but does not focus on the seasonal part.
Fig 11: Close Price (ARIMA)
14. International Journal of Trend in Scientific Research and Development @ www.ijtsrd.com eISSN: 2456-6470
@ IJTSRD | Unique Paper ID – IJTSRD49868 | Volume – 6 | Issue – 3 | Mar-Apr 2022 Page 2059
Fig 12: Predicted Price (ARIMA)
8.3. LSTM (Long-Short Term Memory) Predicted Price
The LSTM model can be tuned for various parameters such as changing the number of LSTM layers, adding
dropout value or increasing the number of epochs. At the start of the article, stock price is affected by the news
about the company and other factors like demonetization or merger/demerger of the companies. There are certain
intangible factors as well which can often be impossible to predict beforehand.
Fig 13: Close Price (LSTM)
Fig 14: Predicted Price (LSTM)
15. International Journal of Trend in Scientific Research and Development @ www.ijtsrd.com eISSN: 2456-6470
@ IJTSRD | Unique Paper ID – IJTSRD49868 | Volume – 6 | Issue – 3 | Mar-Apr 2022 Page 2060
8.4. Comparative Analysis of Machine Learning Techniques:
S.
No.
Techniques Advantages Disadvantages
Parameter
Used
1
Moving
Average
The SMA is the most
straightforward calculation, the
average price over a chosen time
period.
The SMA’s weakness is that it
is slower to respond to rapid
price changes that often occur
at market reversal points.
Close
Price of
stocks.
2
ARIMA
MODEL
ARIMA works better for relatively
short series when the number of
observations is not sufficient to
apply more flexible methods.
It is suitable for short-term
prediction only.
Open,
High,
Close,
Low prices
and
moving
average.
3
LSTM(Long-
Short Term
Memory)
LSTM cells have a memory that can
store previous time step information
and use it to train the dataset. It has
the ability to bridge very long time
lags.
They require a lot of resources
and time to get trained and
become ready for real-world
applications.
Open,
High,
Close,
Low
prices.
8.5. RMSE : Root-Mean-Square Error
RMSE is defined as the square root of the average squared distance between the actual score and the predicted
RMSE is used to evaluate the Machine Learning models. So here,
Moving average – 104.51415465984348
ARIMA model – 44.954584993246954
LSTM – 9.707045241044804
9. Conclusion
This work summarizes necessary techniques in
machine learning that square measure relevant to
stock prediction. This model may be improved upon
by process refined fuzzy rules. By coaching data’s
scale and timeframe may result in higher prediction.
Technical indicators square measure accustomed
construct the relation between stock exchange index
and their variables. Implementing victimization
Moving Average slow so as to perform computations
compared to alternative techniques, whereas ARIMA
model is good for short-run prediction. Every
technique has its own benefits and downsides.
Differing types of techniques are accustomed predict
the stock exchange and to forecast the longer term
stock values up to some extent. Combining Moving
Average, ARIMA Model and LSTM Model might
end in high accuracy.
9.1. General Comment
We were able to come with a way to successfully
predict the stock market and in combination with a
good trading strategy we were able to profit from
stock trading using historical data. The reason we
used historical data and not real time data for testing
was time efficiency but also the ability to compare
models and trading strategies using the same testing
data.
How would the model behave with real-time data?
We treated our historical data as real time data. We
can use the same methods and be able to predict the
stock price in real time. We can achieve this by
collecting the transactions in real time and converting
them into 5-min intervals and just passing them
forward to our network, point by point. One of the
goals of this thesis was that we should be able to
utilize the stock market on real time and all the
simulations were done in way that would make it easy
to transition from historical to real time data.
As an investment it can be characterized as really
profitable. However the neural network cannot
predict sudden changes in the price that happen
during the time that the stock market is closed. An
example is when a company or their direct
competitors announce their term results. Those kinds
of events can skyrocket the stock price or make it lose
considerable value.
16. International Journal of Trend in Scientific Research and Development @ www.ijtsrd.com eISSN: 2456-6470
@ IJTSRD | Unique Paper ID – IJTSRD49868 | Volume – 6 | Issue – 3 | Mar-Apr 2022 Page 2061
9.2. Limitations
The main limitation we had during this thesis was the
time constraints due to the lack of available data. We
had to wait at least three months to run experiments
as we had to collect our own data. Also trying to train
a neural network takes quite long. If we were lucky a
neural network would converge in a couple of hours
but sometimes could take up to 15 hours. Especially
in the Reinforcement Learning (RL) models training
would take quite a few days. The whole process it
was a trial and error in order to come up with the
optimal hyper parameters and we had to train numeral
different networks just to be able to select them.
Stock market cannot be accurately predicted. The
future, like any complex problem, has far too many
variables to be predicted. The stock market is a place
where buyers and sellers converge. When there are
more buyers than sellers, the price increases
9.3. Future Work
We have to test the existing methods with more data
as the keep coming. We want to ensure that the
results we got it is not just a random event that
happened as result of the time period. We have to test
with even more data as time passes and make sure
that our model can generalize. Another thing we can
do is check how our model works with stocks outside
the OMSX30 index. We can try train and evaluate out
model with stocks that belong to smaller companies
that do not have as many transactions as the big ones.
In that case we will be able to see if we can expand
our work to other stocks and maybe even other stock
markets as well.
The concept behind this idea is that we will have few
neural networks trained in different time intervals.
For example, we can have the prediction of the stock
price in 5-min, 10-min and 30-min intervals. Using
this information we can decide when is the best time
to place our action. If we know how the stock will
move within the next thirty minutes we will be able to
increase our profit even more. The more information,
we have the more profit we can achieve.
REFERENCES
[1] Prashant S. Chavan,”Parameters for Stock
Market Prediction” IJCTA, MAR 2013.
[2] Mayank Kumar B Patel, Sunil R Yalamalle
“Stock price prediction using Artificial Neural
Network “IJIRSET, June 2014.
[3] Mrityunjay Sharma “Survey on Stock Market
Prediction and Performance Analysis”
IJARCET, January 2014.
[4] Gholap Rahul Mansing “Indian stock market
prediction using neural network technique”
IJARCET, March 2014.
[5] Shom Prasad Das, Sudarsan Padhy “Support
Vector Machines for Prediction of Futures
Prices in Indian Stock Market” IJCA, March
2014.
[6] Author: Yusuf Perwej, Asif Perwej Research
paper: Prediction of the Bombay Stock
Exchange (BSE) Market Returns Using
Artificial Neural Network and Genetic
Algorithm Journal: Scientific Research
[7] Author: K. Senthamarai Kannan, P. Sailapathi
Sekar, M. Mohamed Sathik and P. Arumugam
Research paper: Financial Stock Market
Forecast using Data Mining Techniques
Journal: International Multi-Conference of
Engineers and Computer Scientists 2010 Vol I,
IMECS 2010, March 17-19, 2010, Hong Kong.
ISSN:2078-0966
[8] Author: Zahid Iqbal, R. Ilyas, W. Shahzad, Z.
Mahmood and J Anjum Research paper:
Efficient Machine Learning Techniques for
Stock Market Prediction Journal: Int. Journal of
Engineering Research and Applications, ISSN:
2248-9622, Vol. 3, Issue 6, Nov-Dec 2013,
pp.855-867.
[9] Author: Marc-André Mittermaye Research
paper: Forecasting Intraday Stock Price Trends
with Text Mining Techniques Journal: Hawaii
International Conference on System Sciences –
2004.
[10] Hellstrom, T. and Holmstrom, K. 1998,
'Predicting the Stock Market', Technical Report
Series Ima-TOM-1997-07.
[11] M. Usmani, S. H. Adil, K. Raza and S. S. A.
Ali, "Stock market prediction using machine
learning techniques," 2016 3rd International
Conference on Computer and Information
Sciences (ICCOINS), Kuala Lumpur, 2016, pp.
322-327.