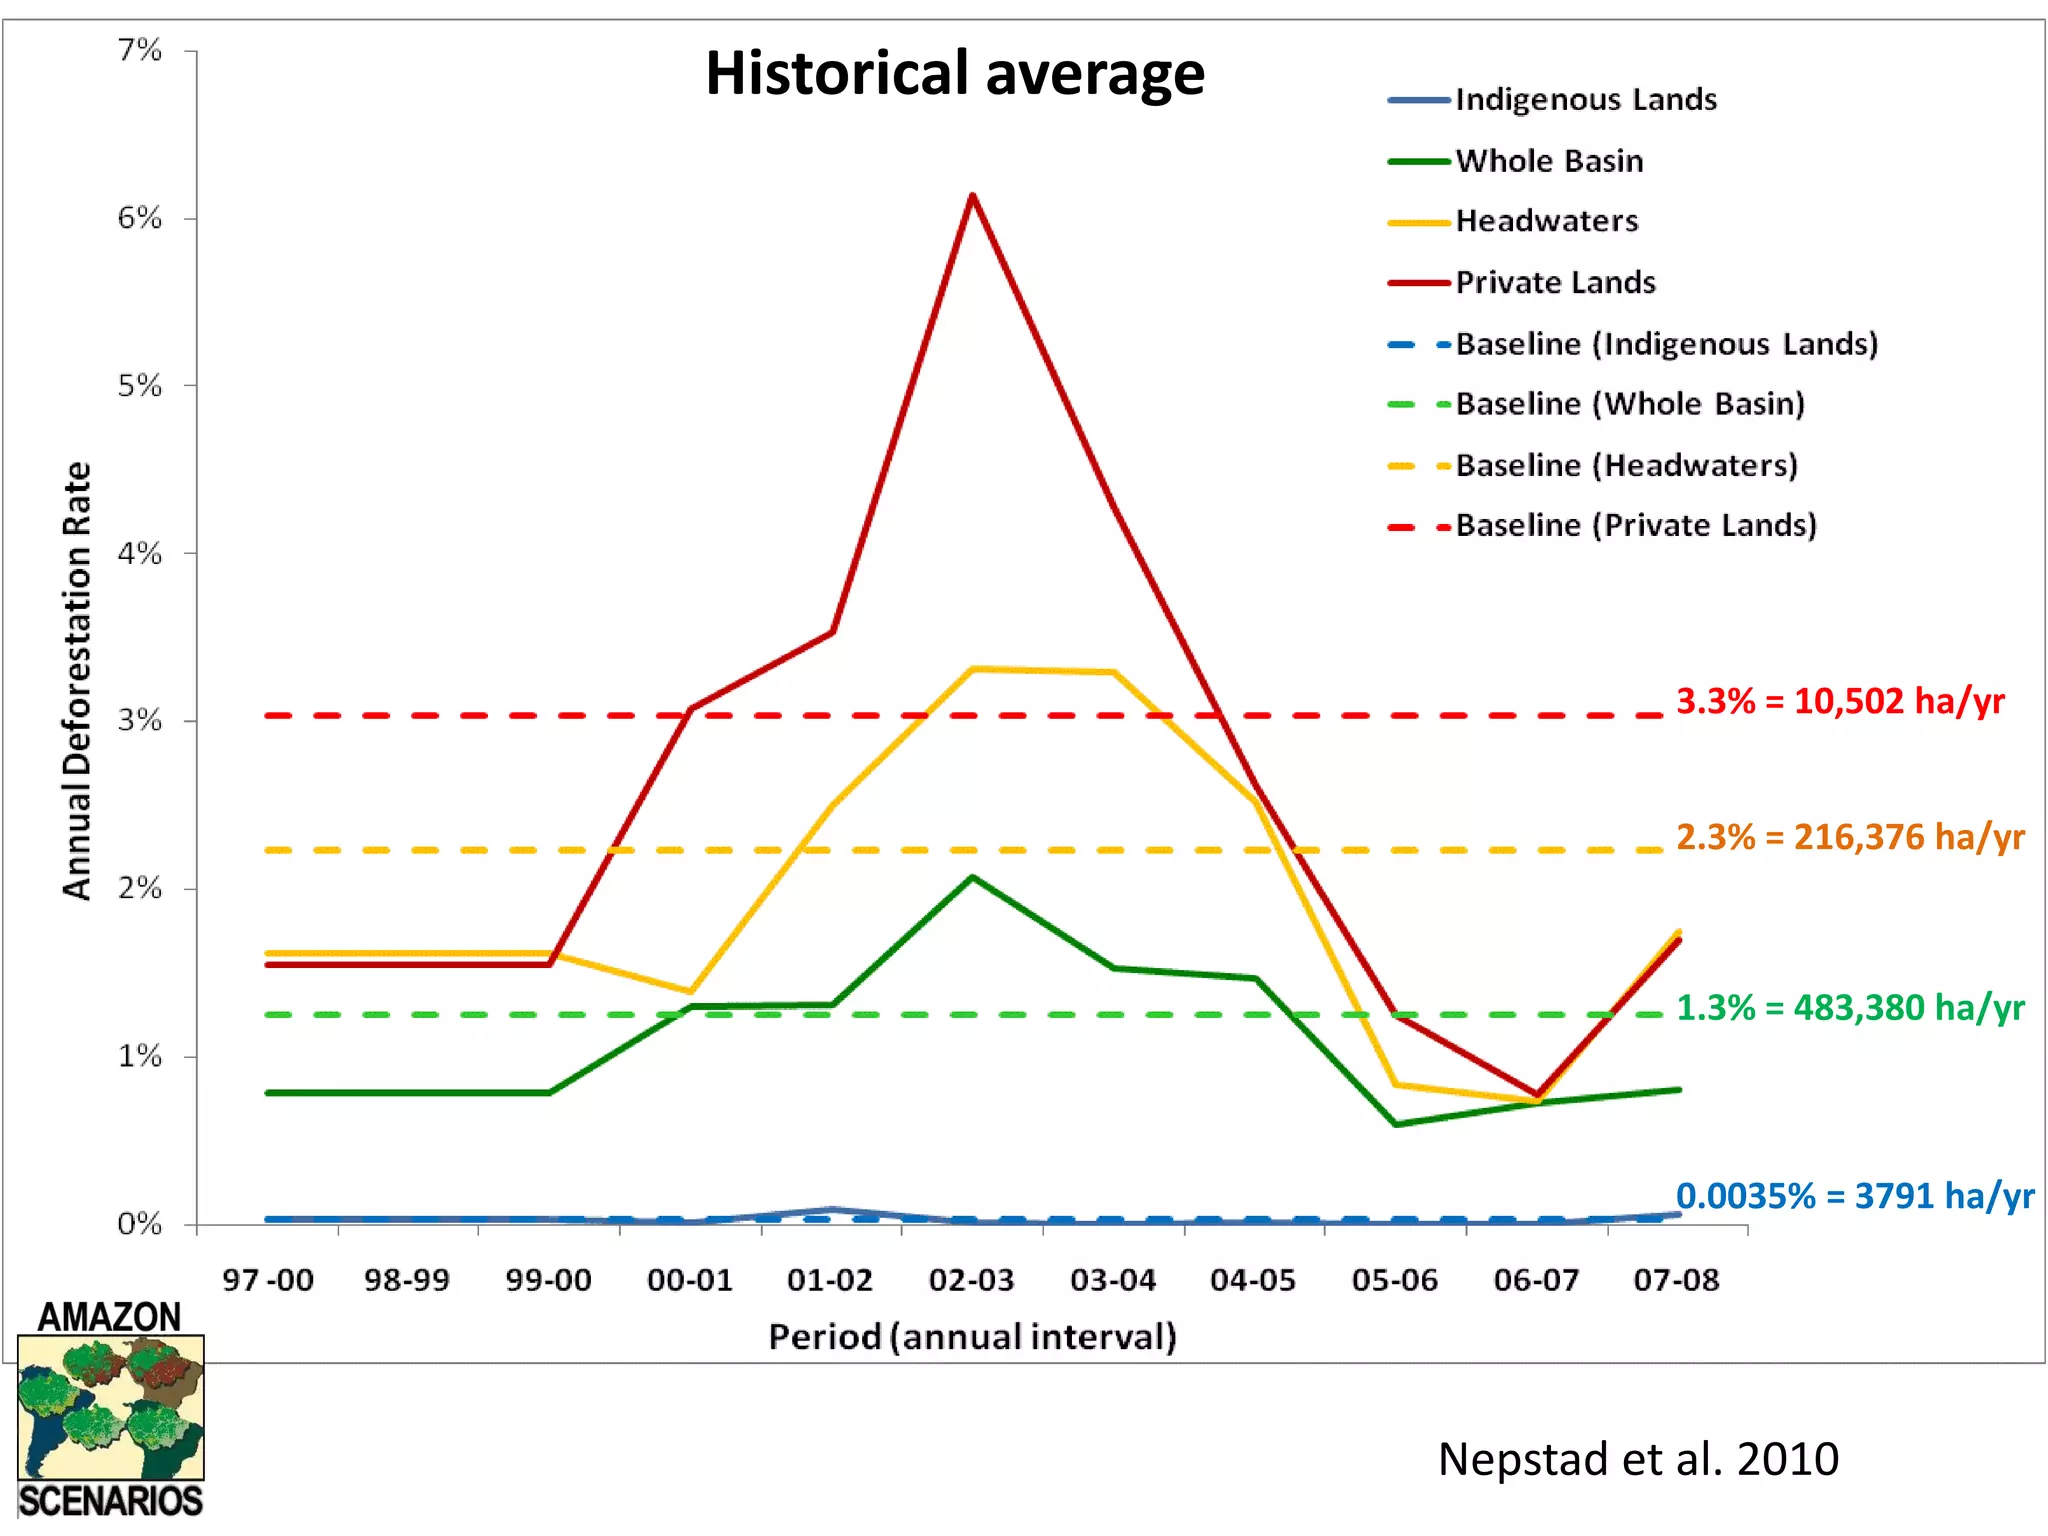
1) The document describes a modeling system called Amazon Scenarios that is used to simulate baseline deforestation rates and potential emissions reductions from REDD+ projects in the Brazilian Amazon.
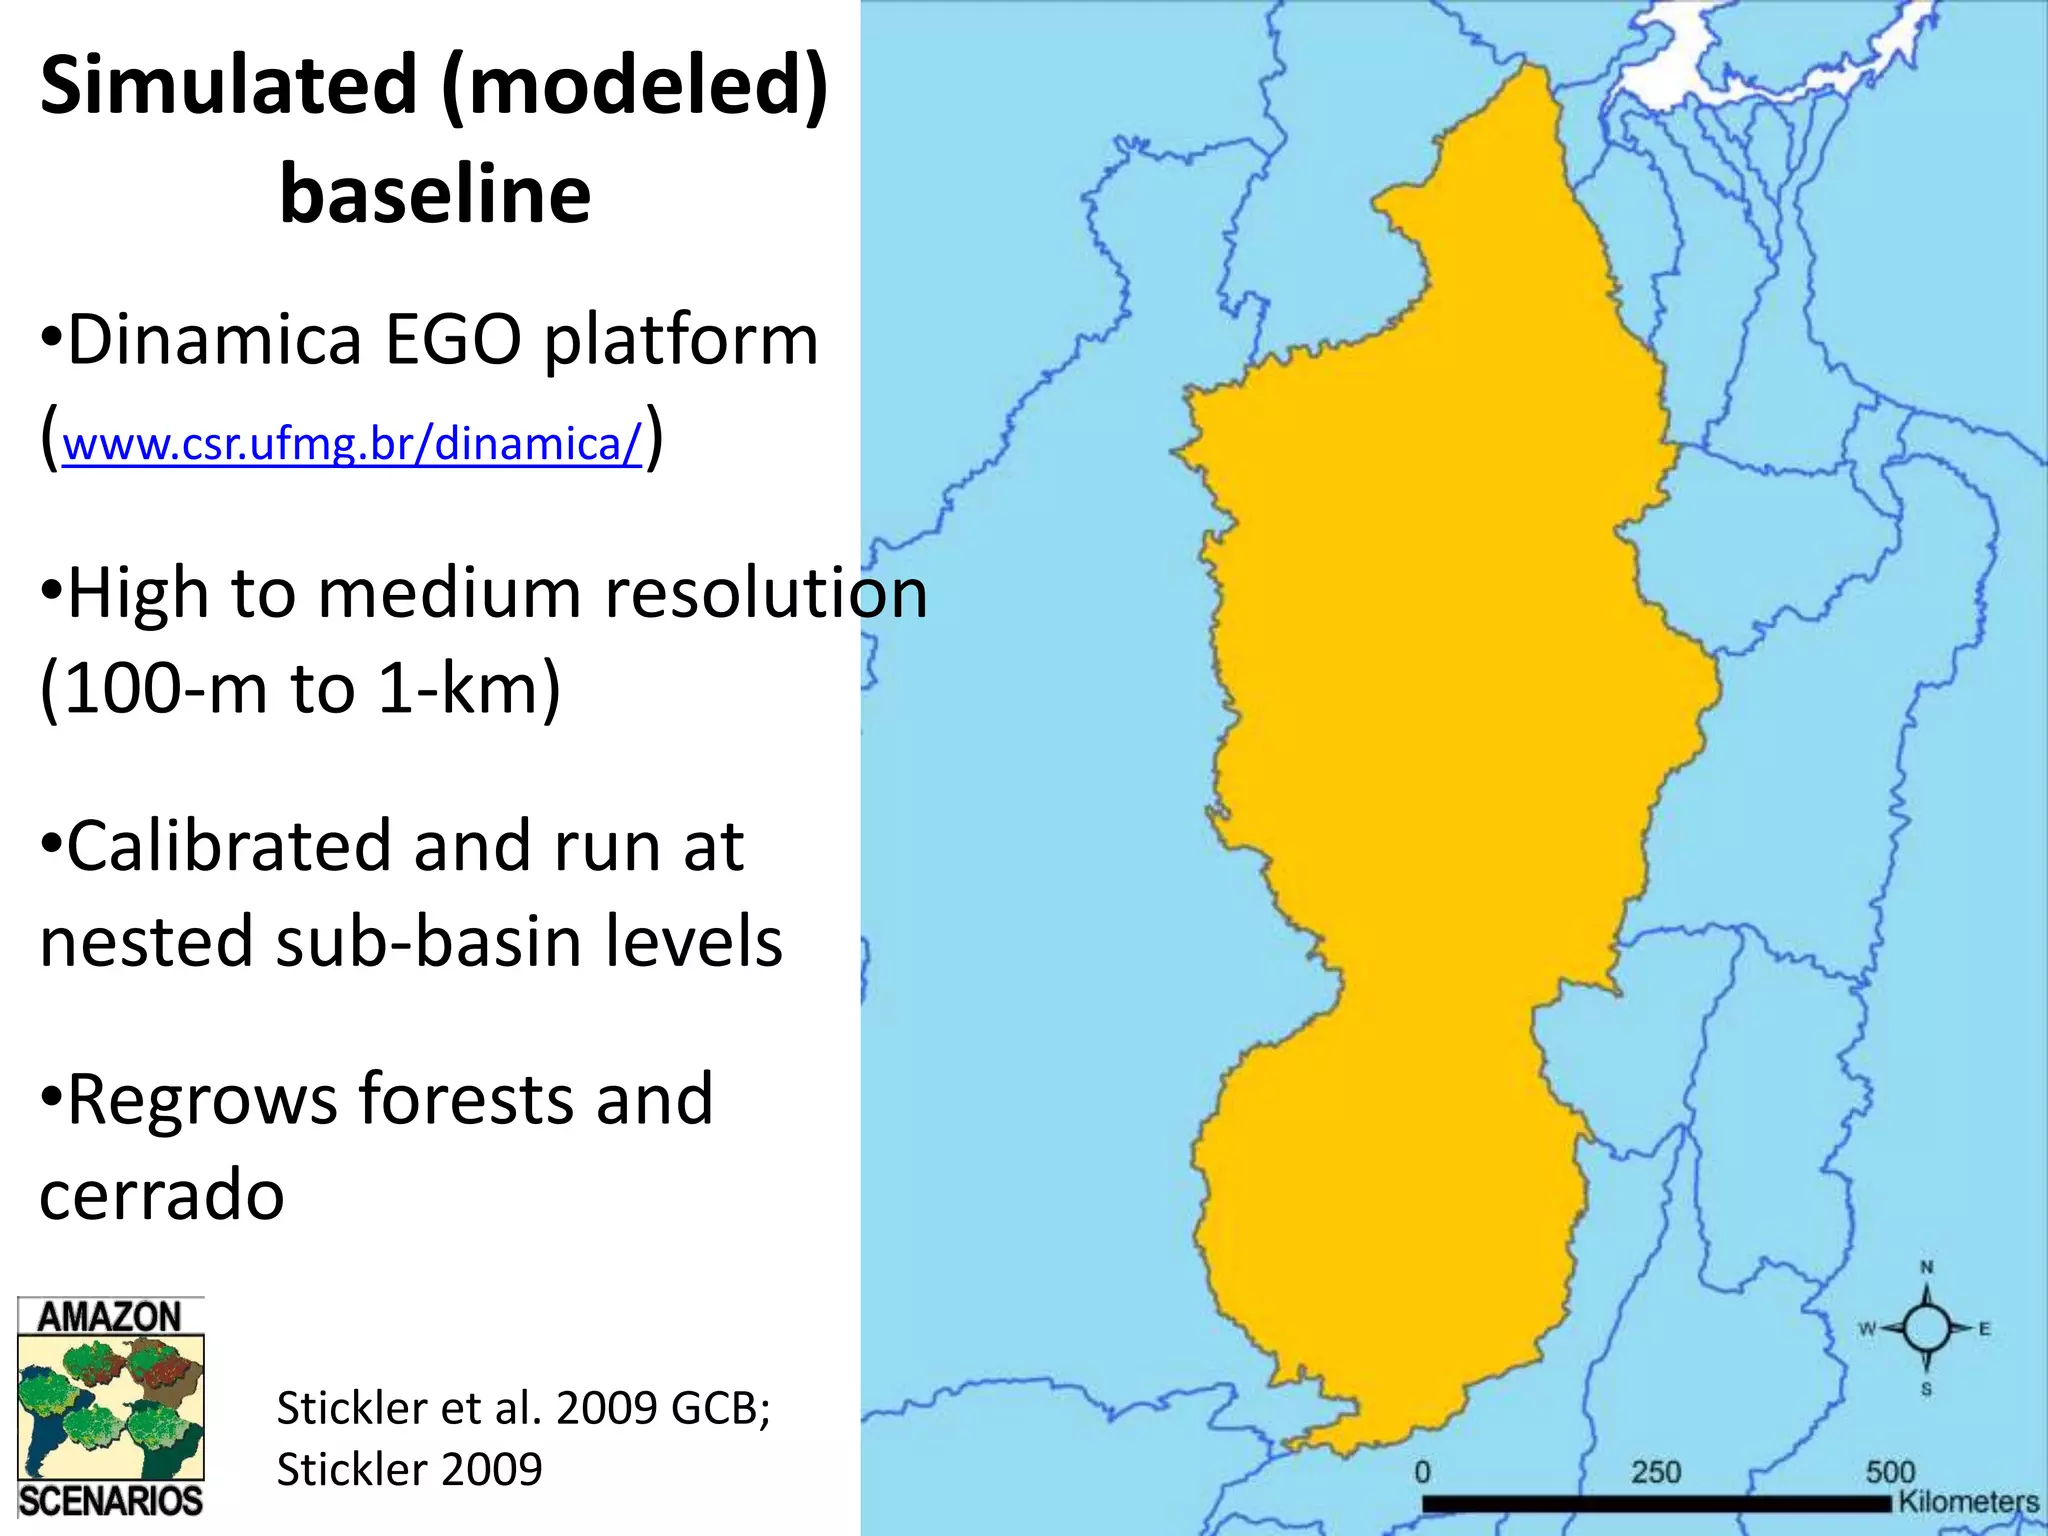
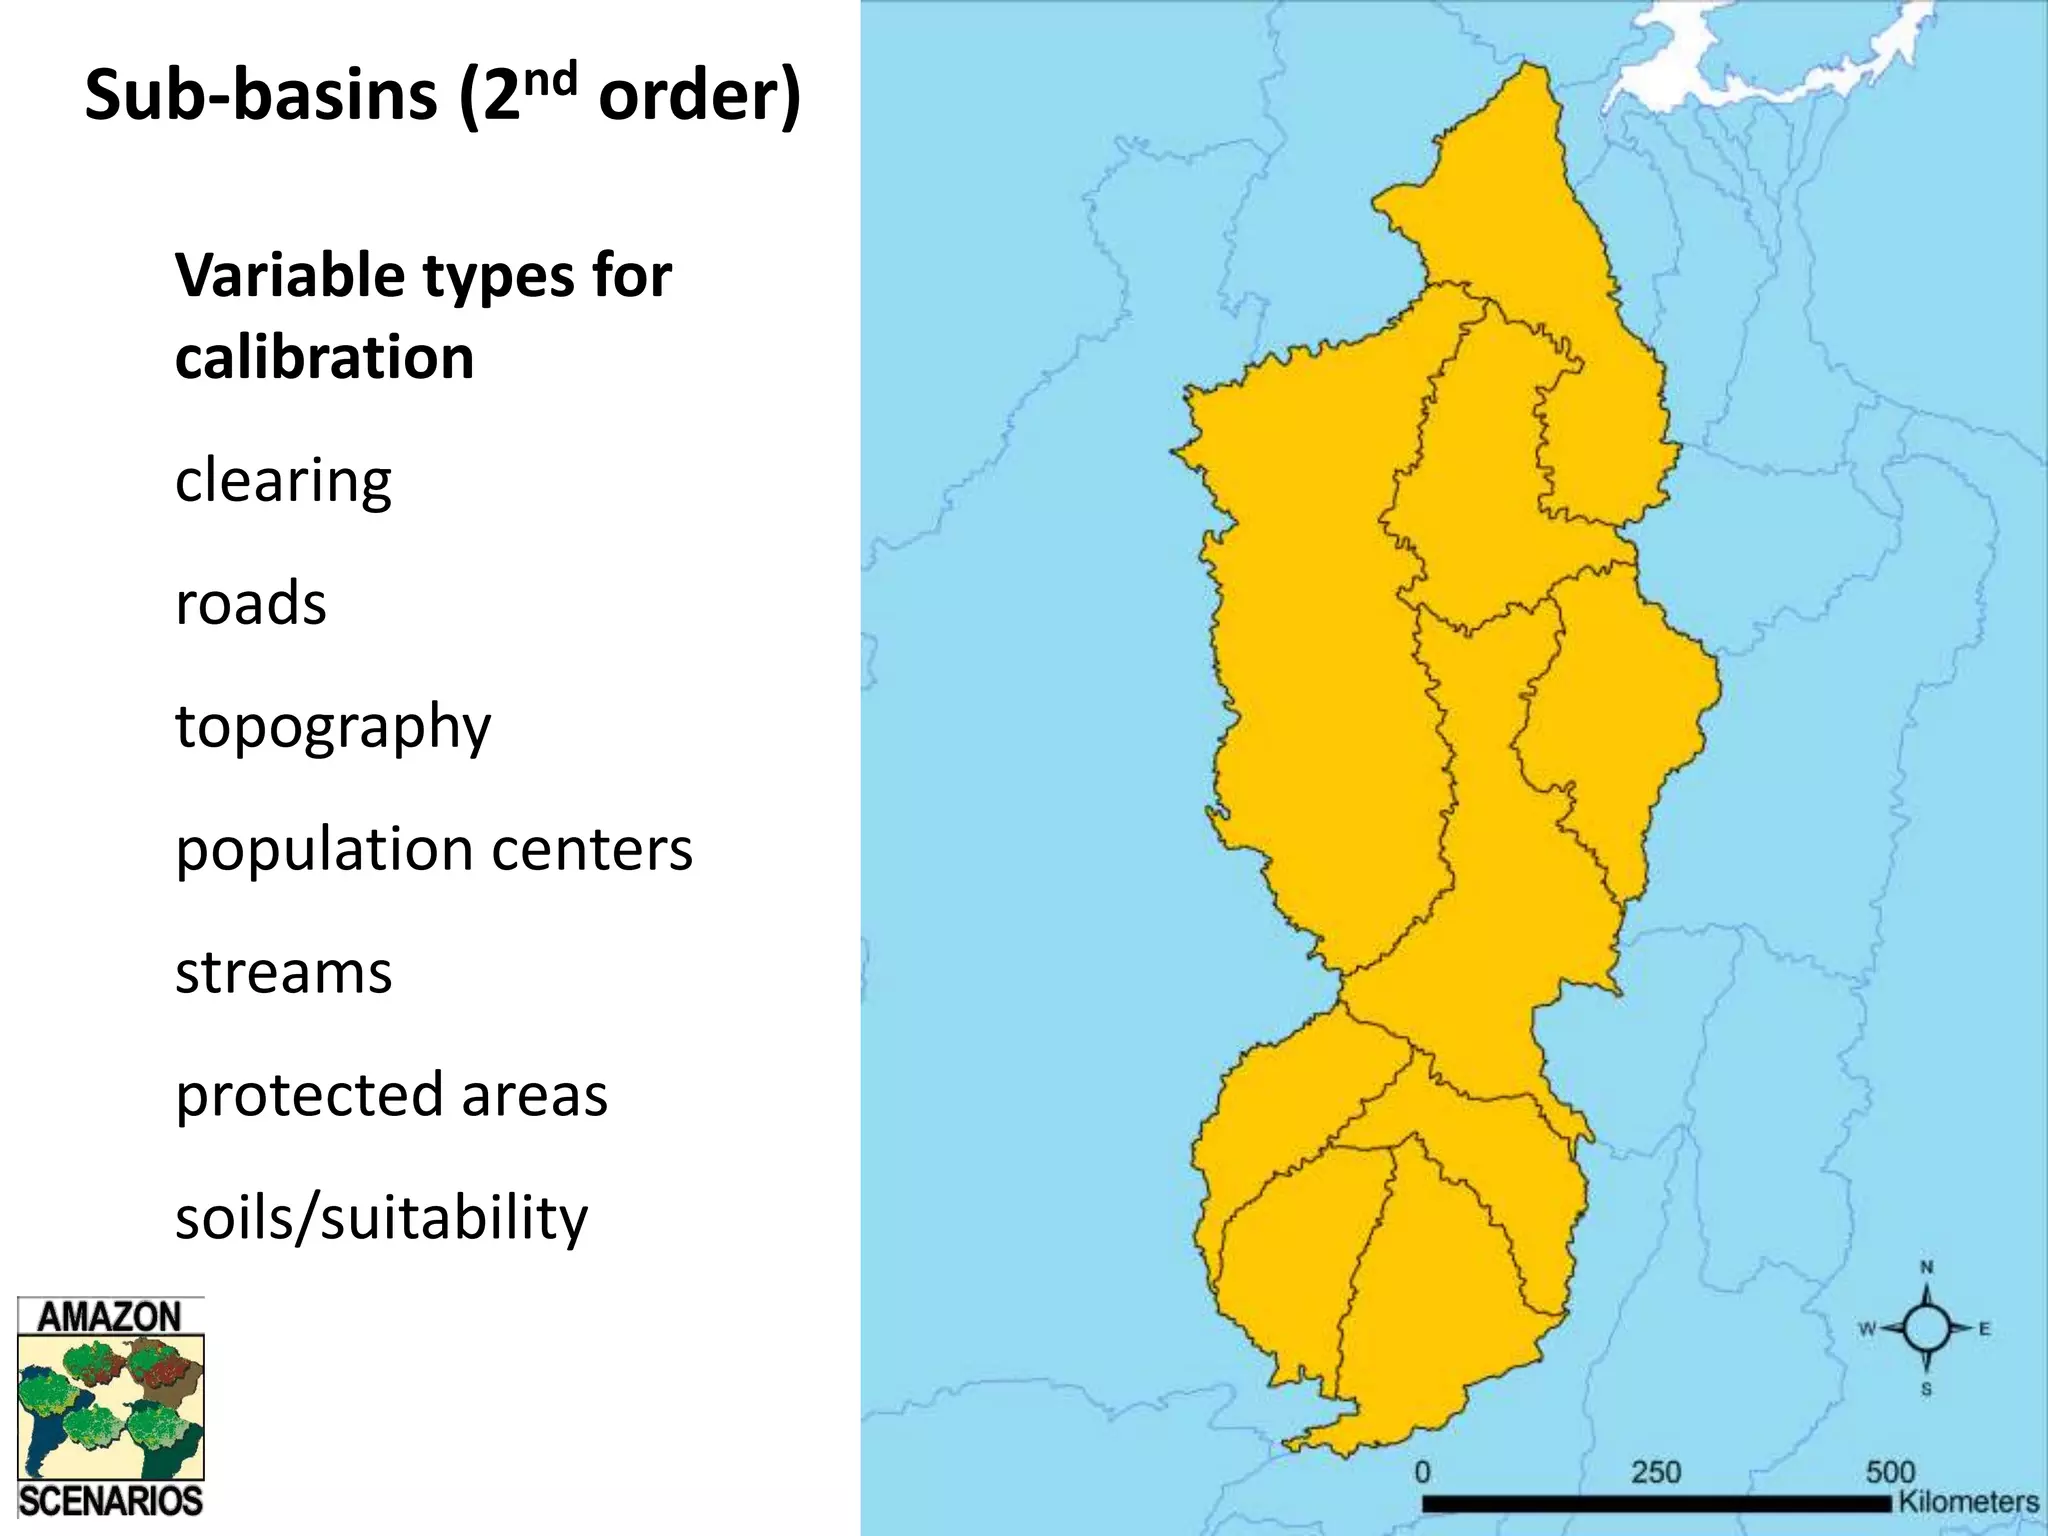
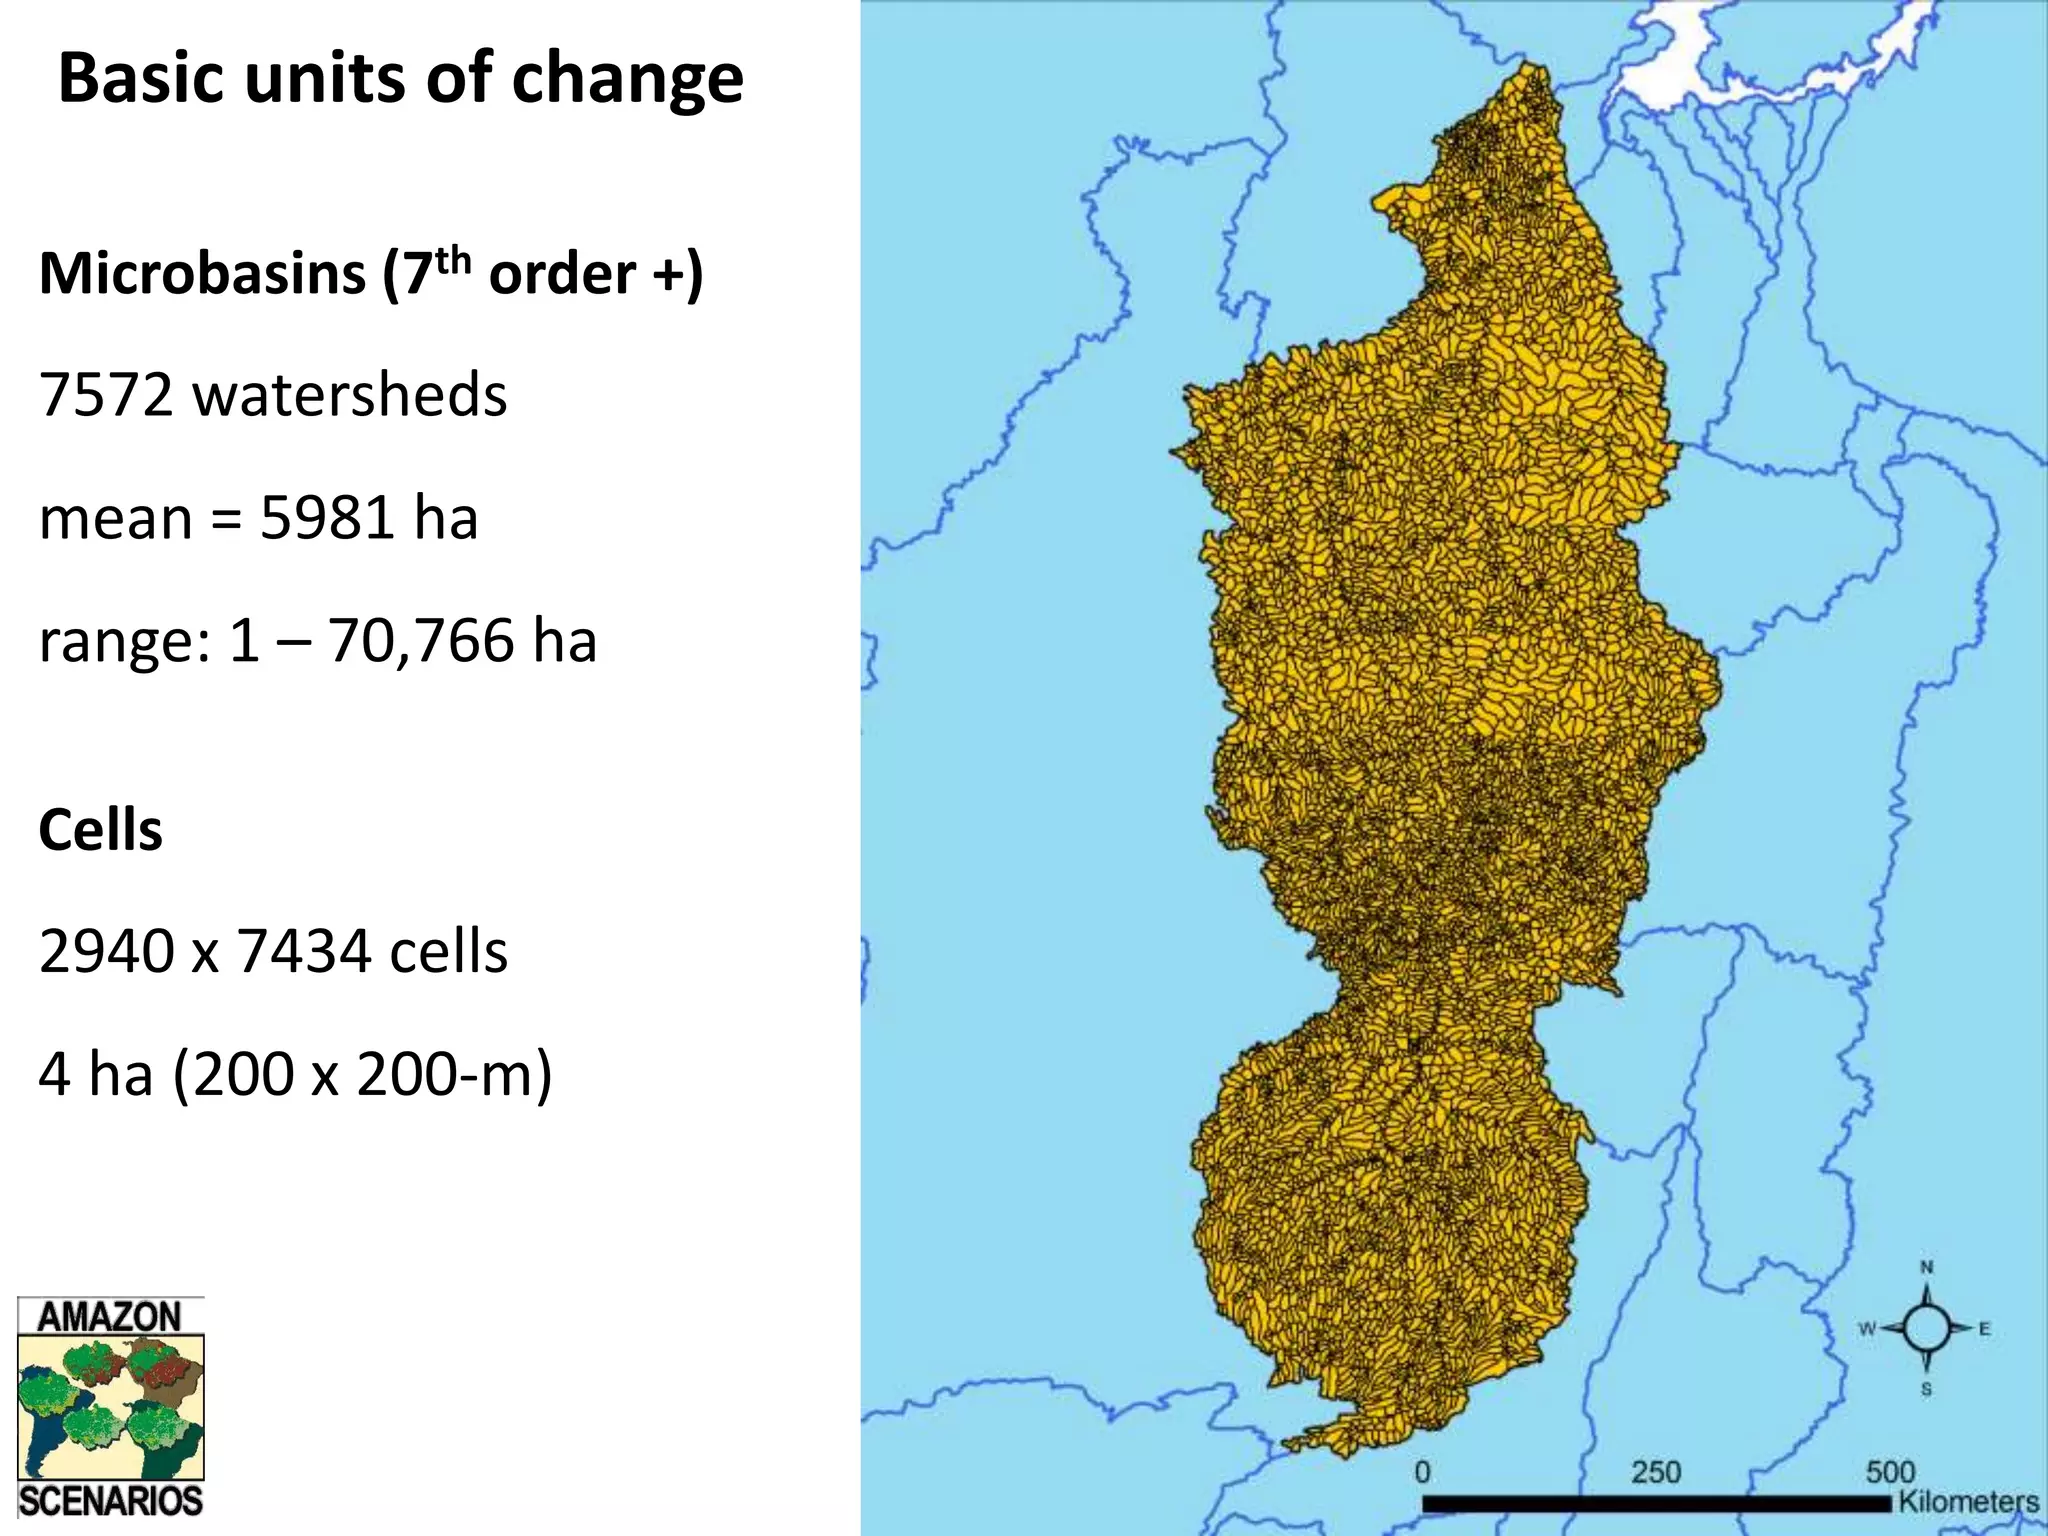
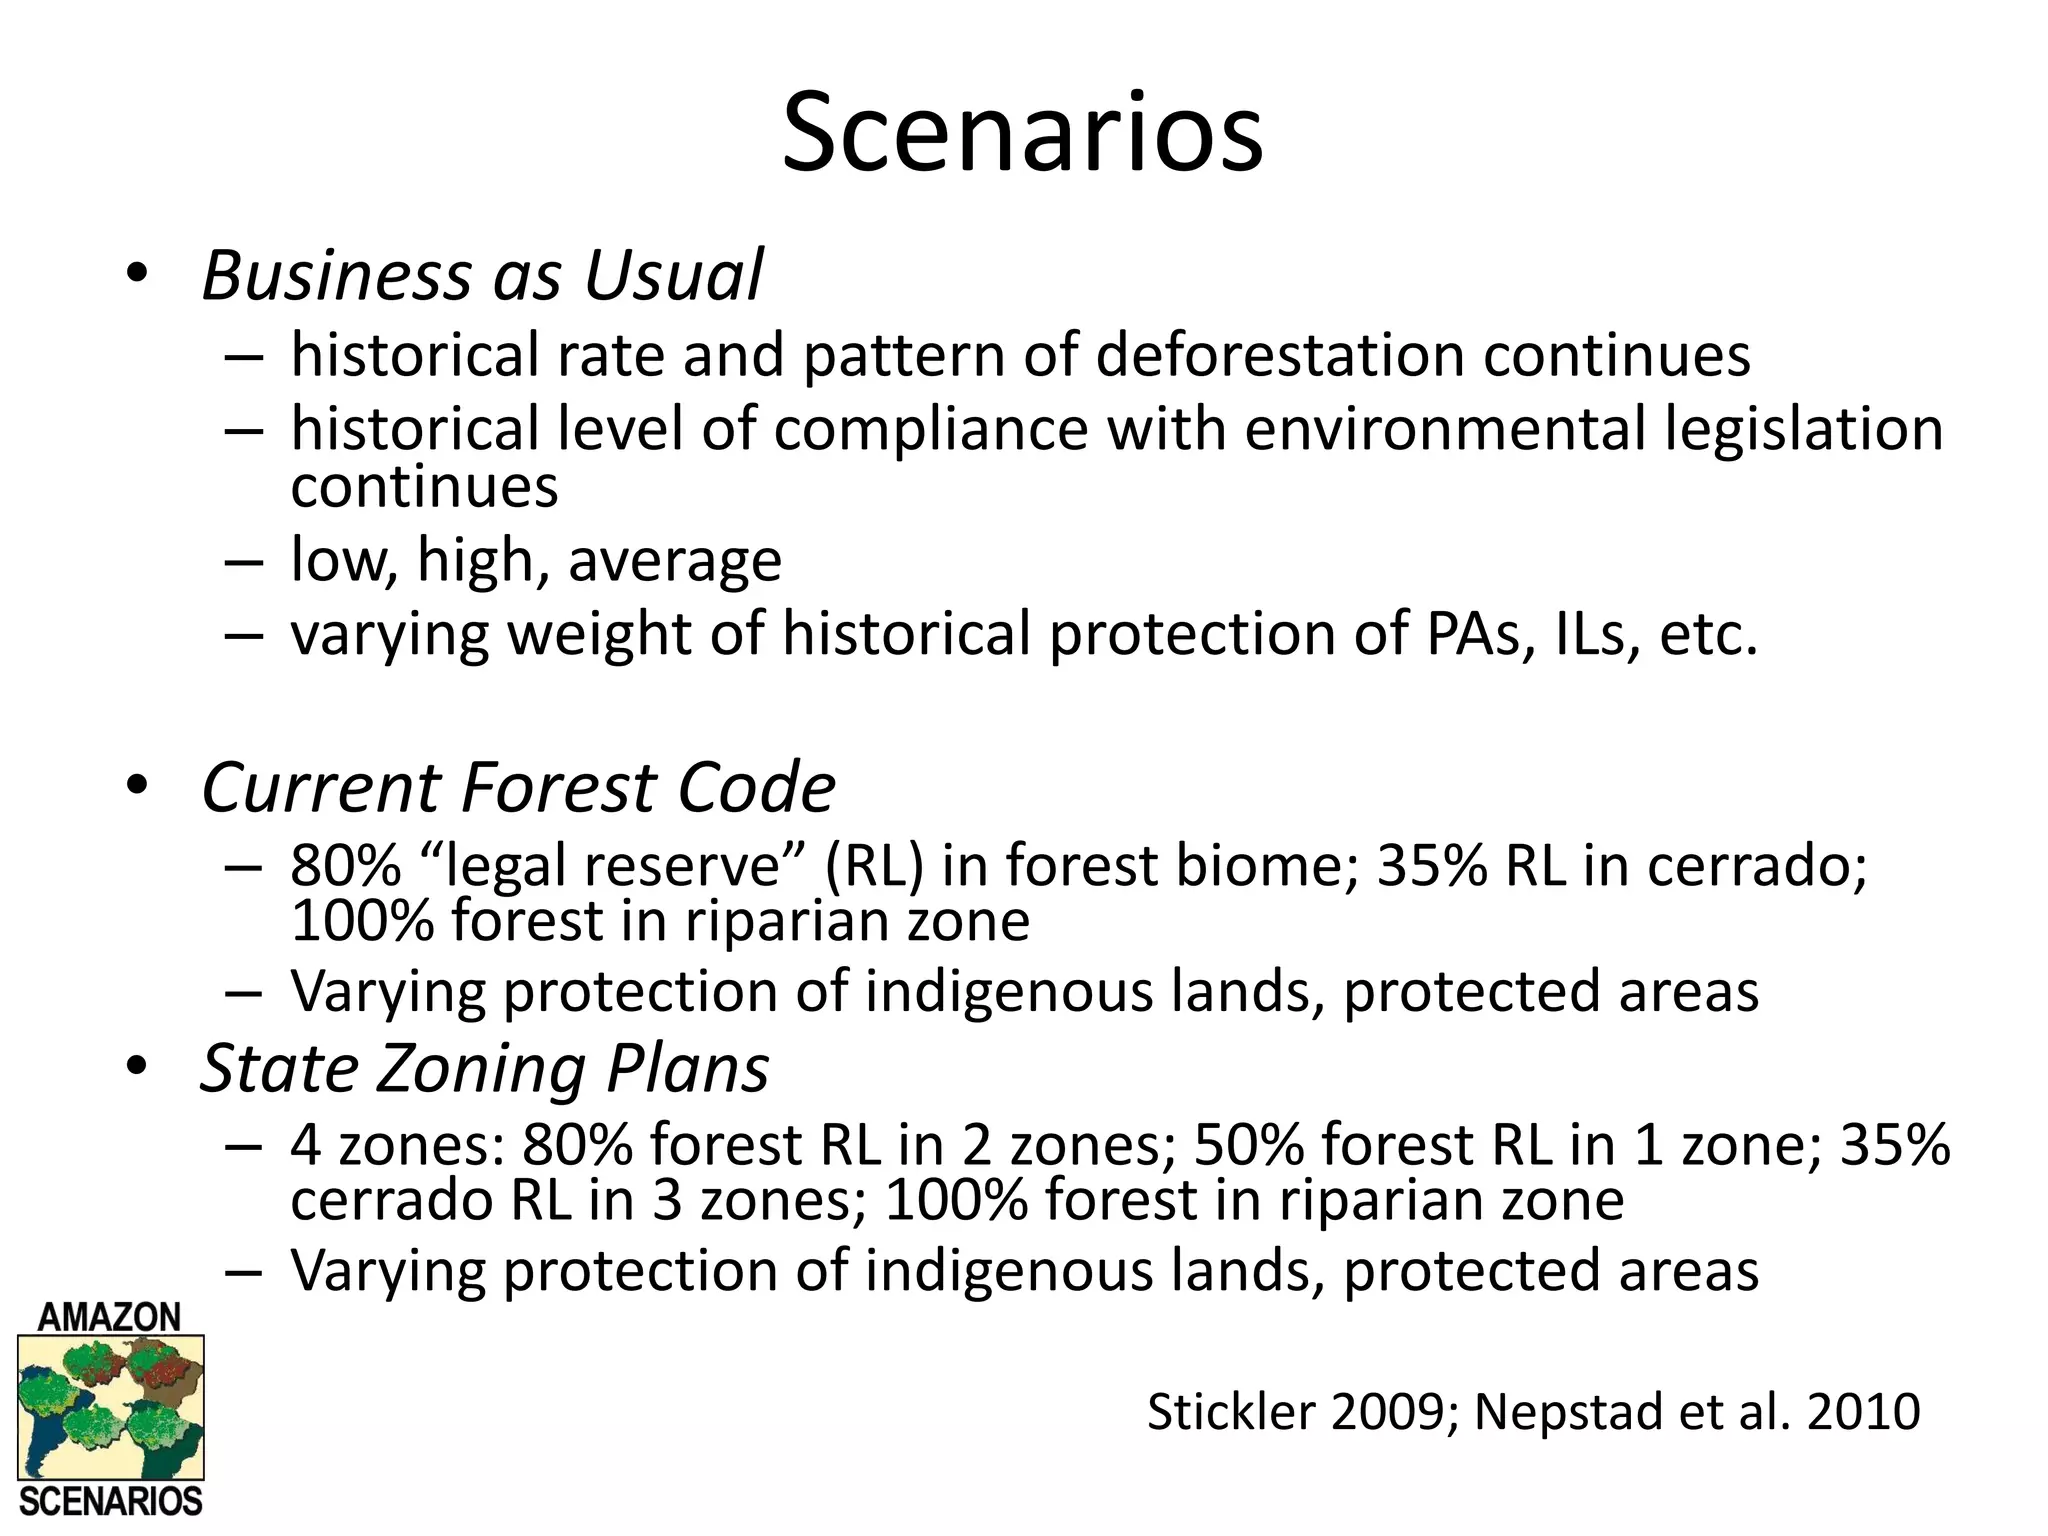
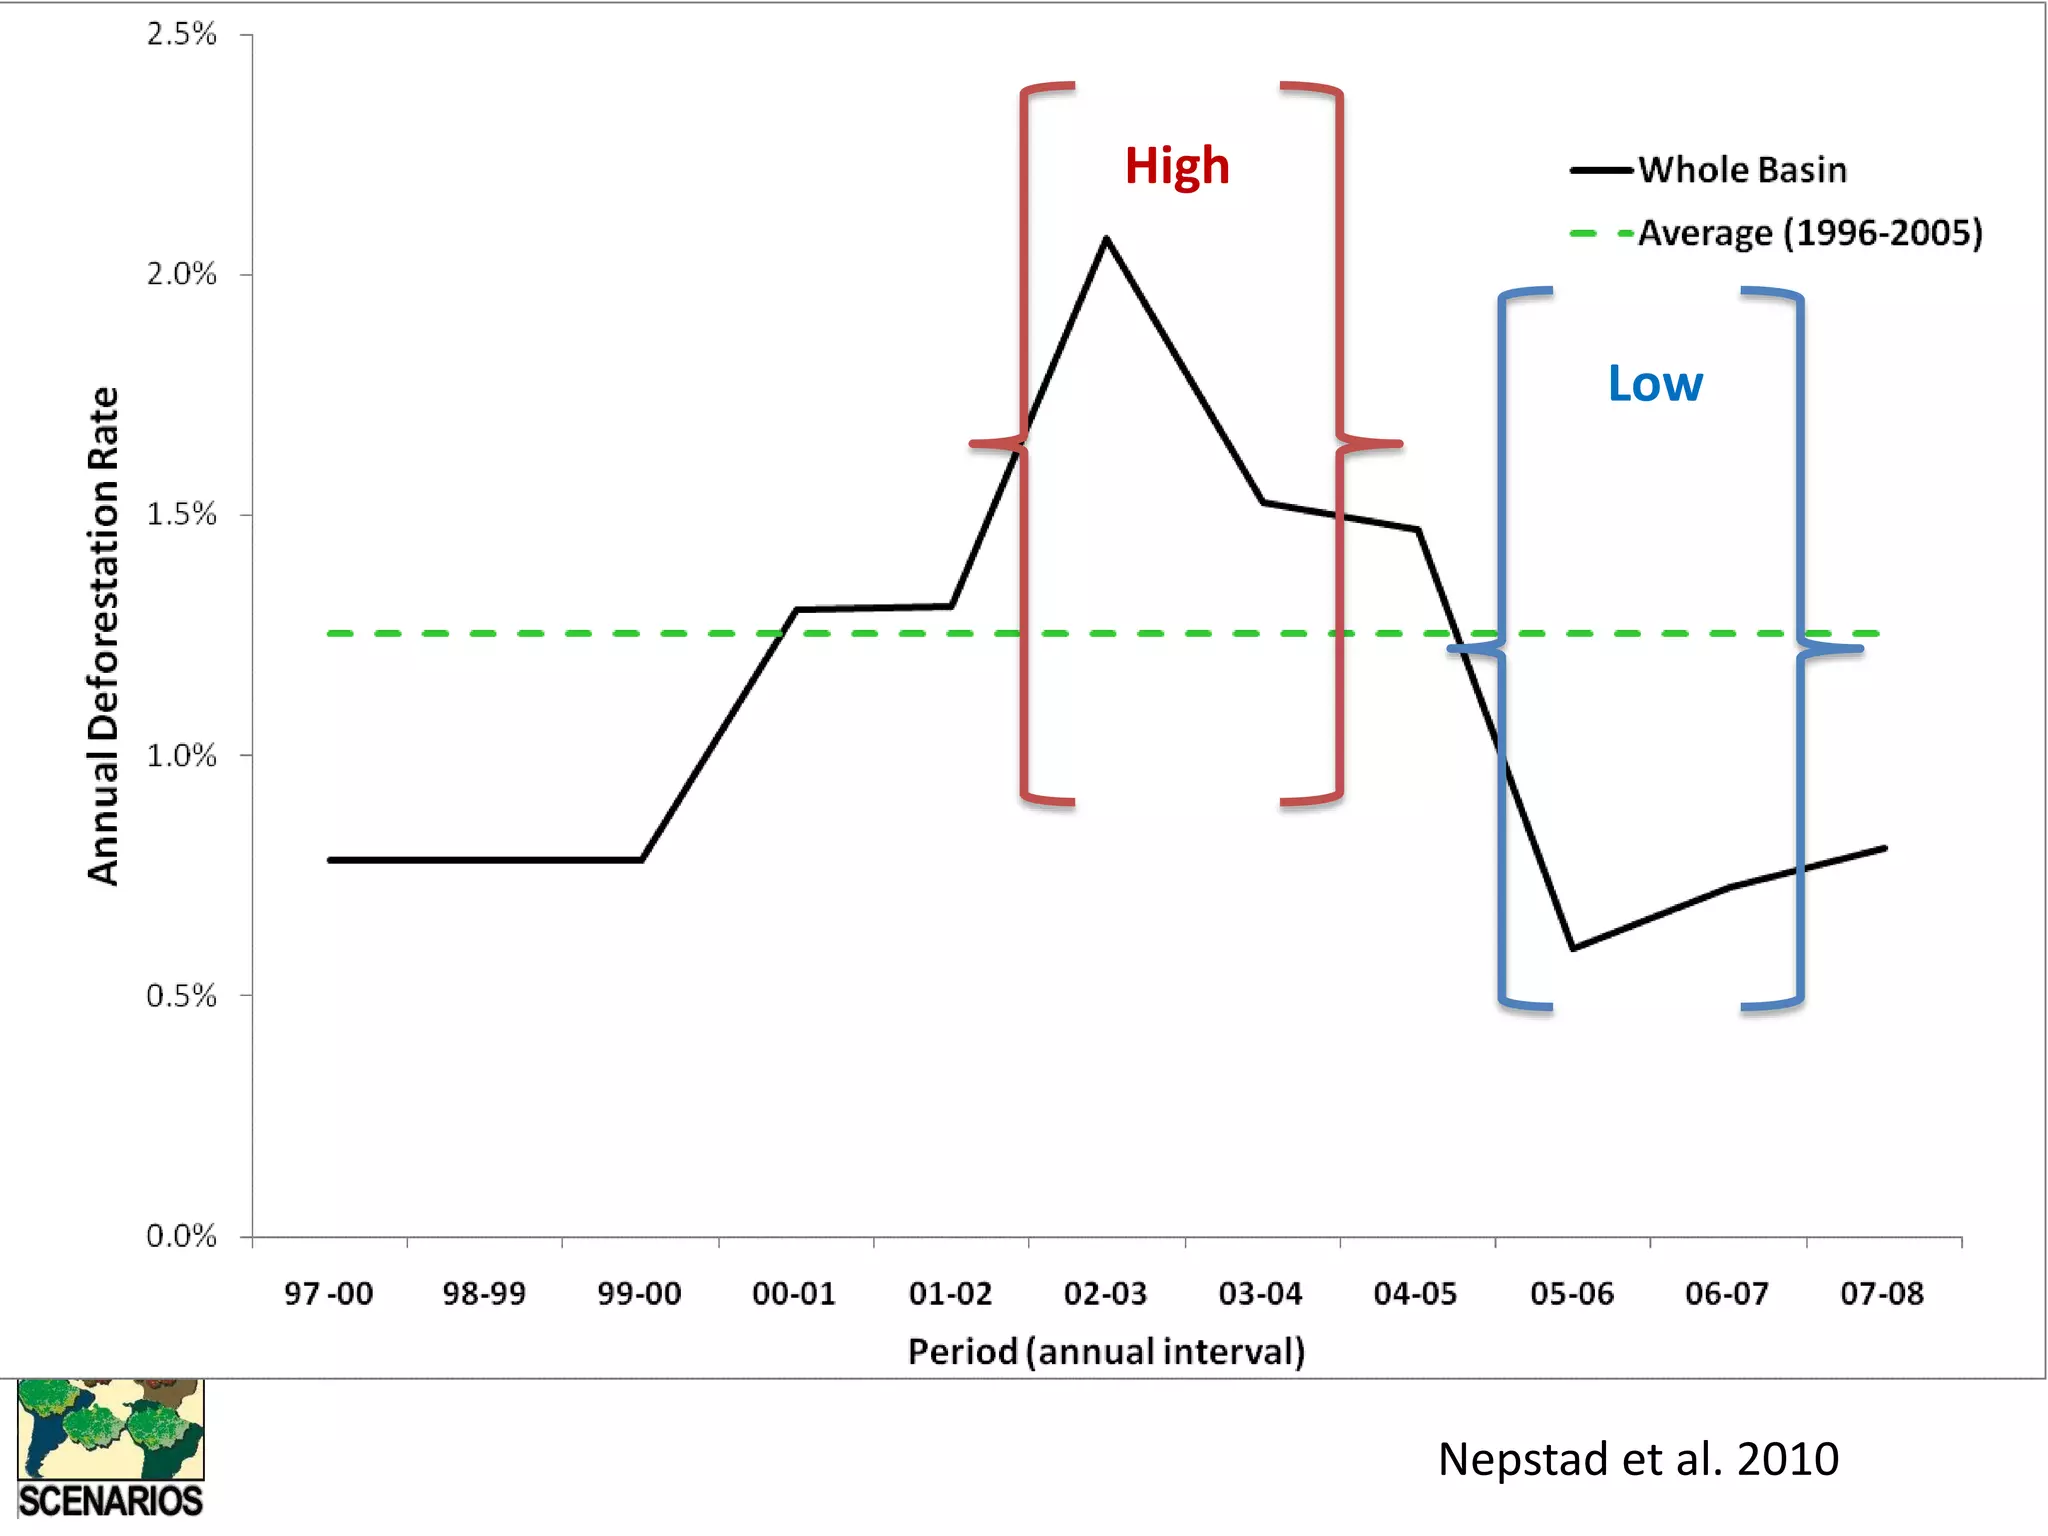
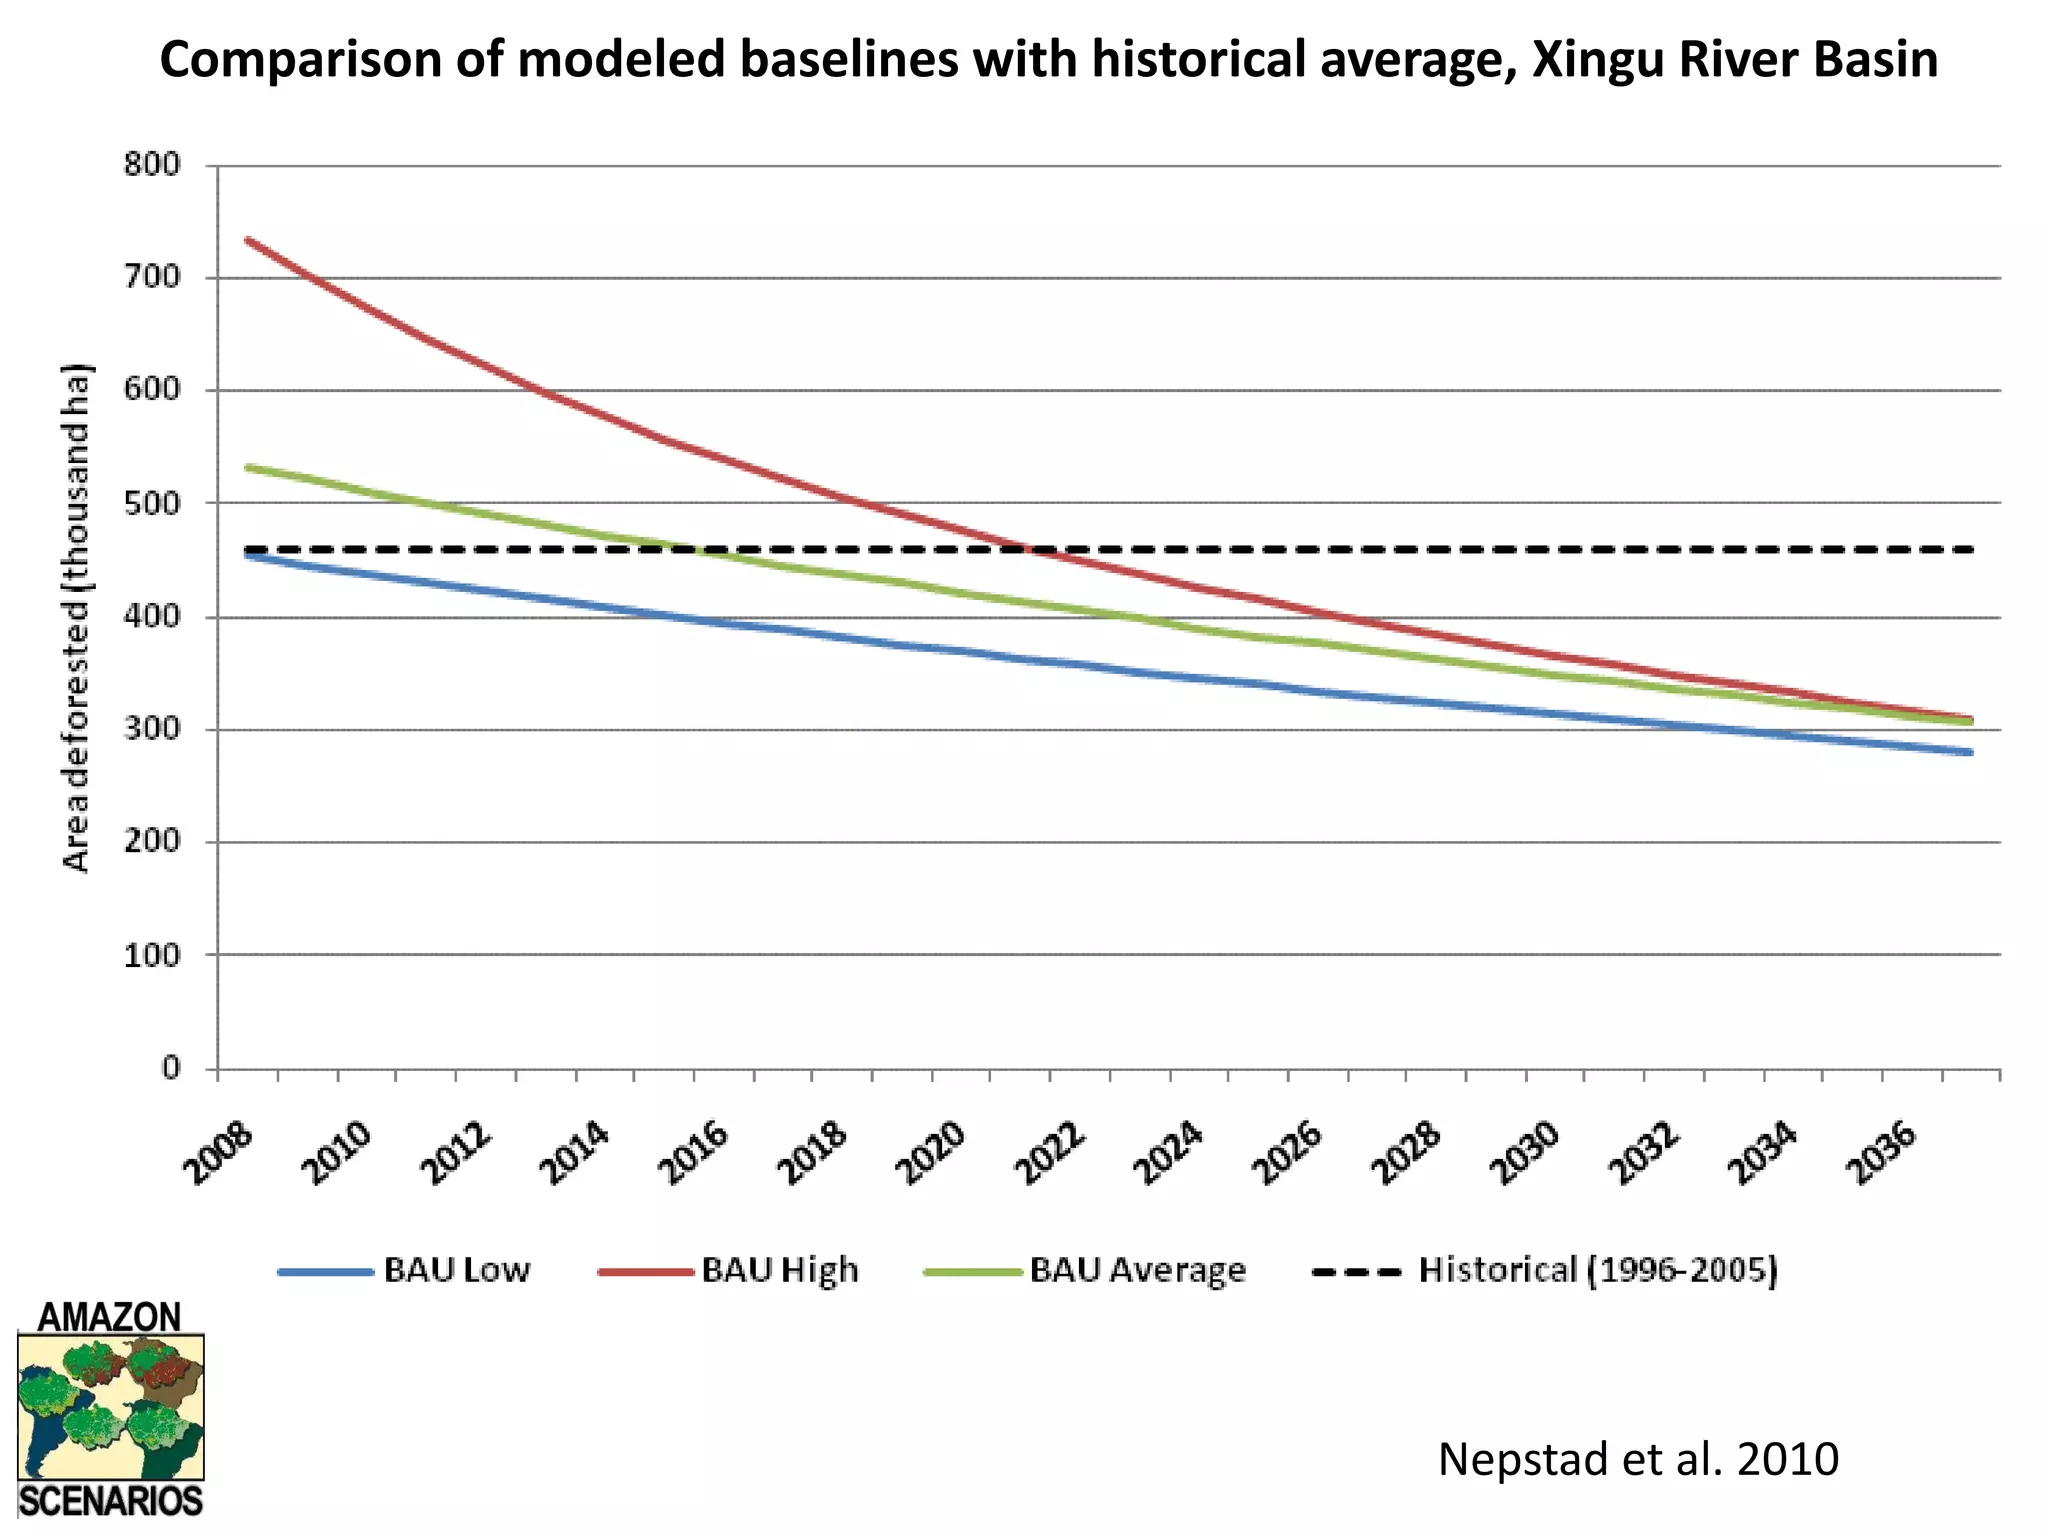
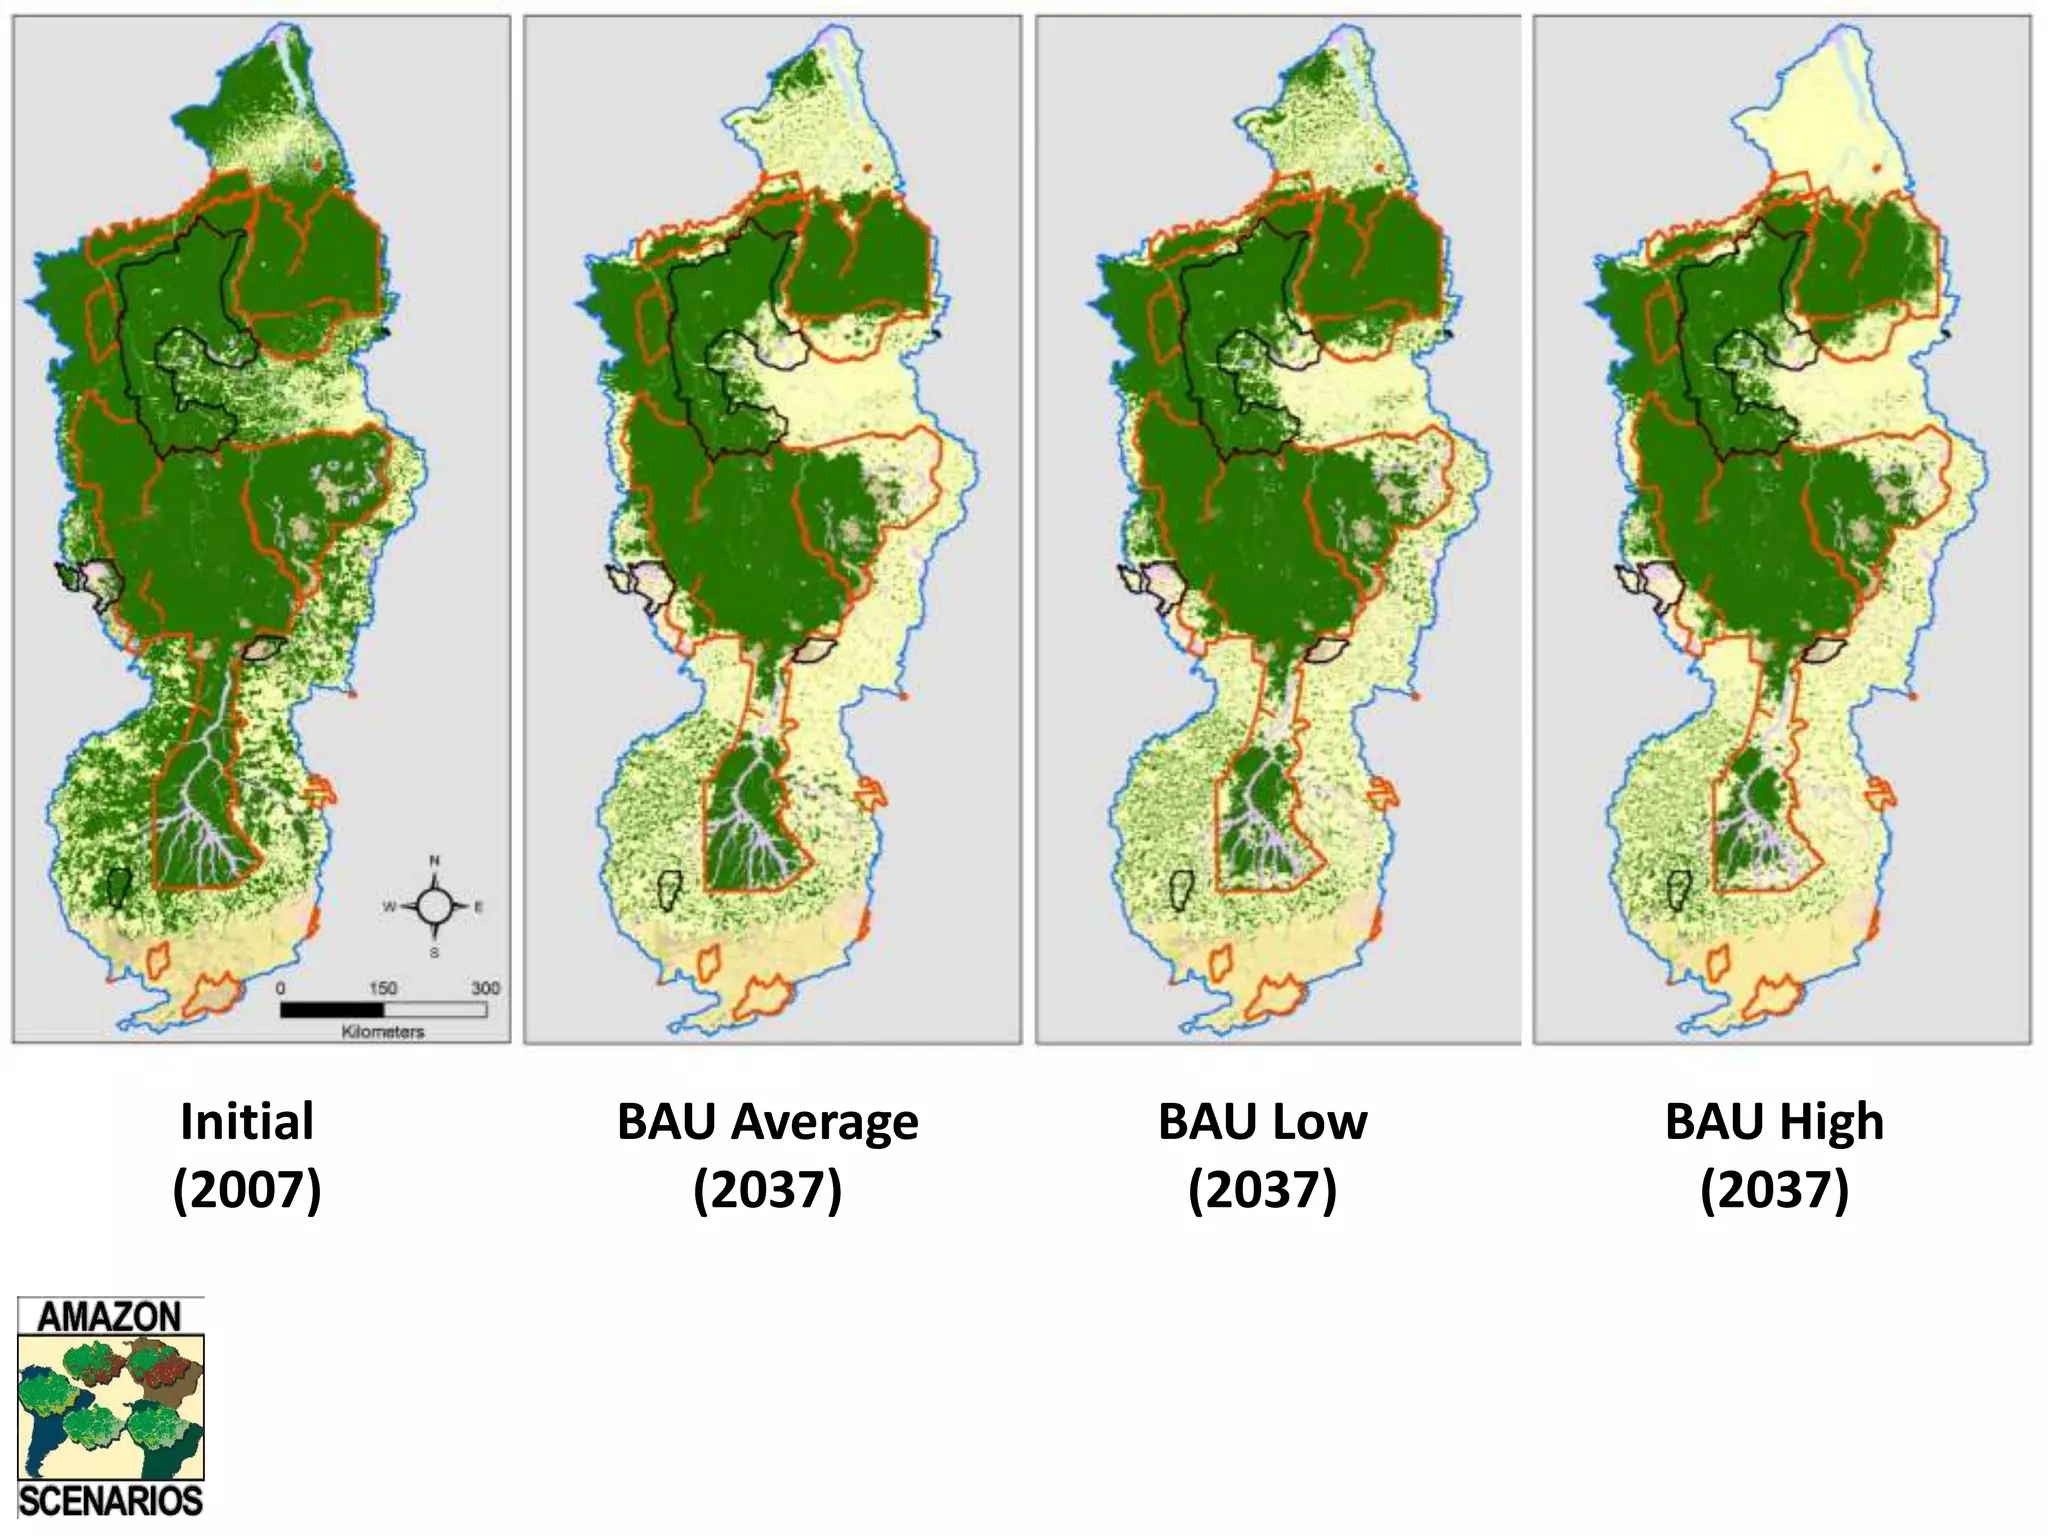
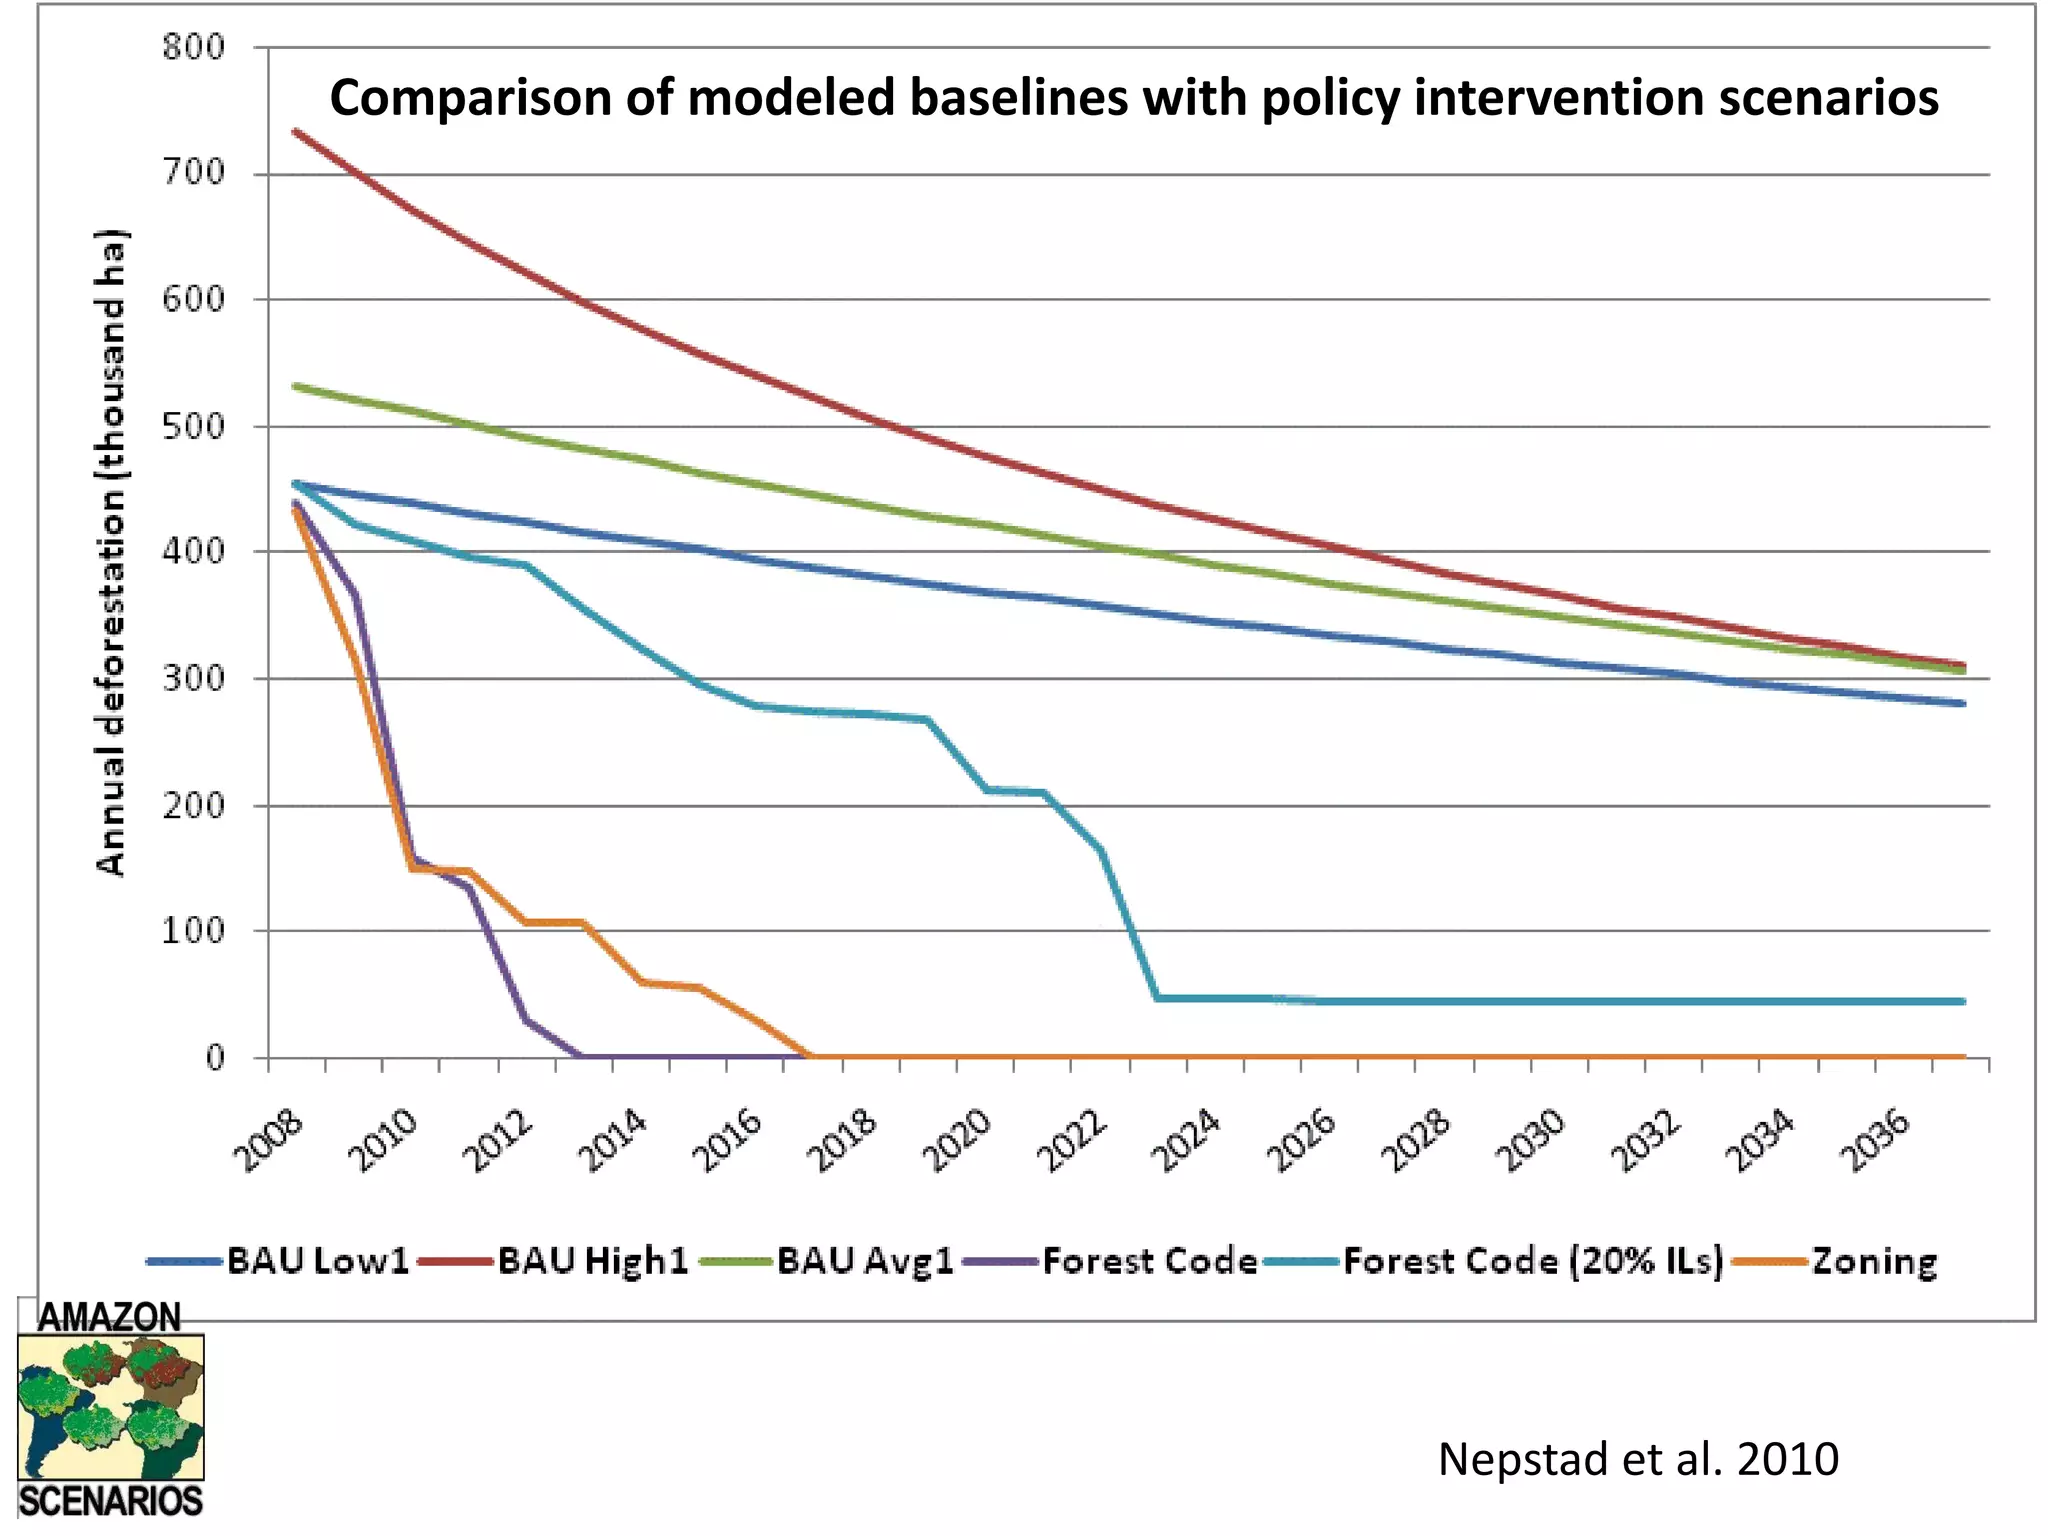
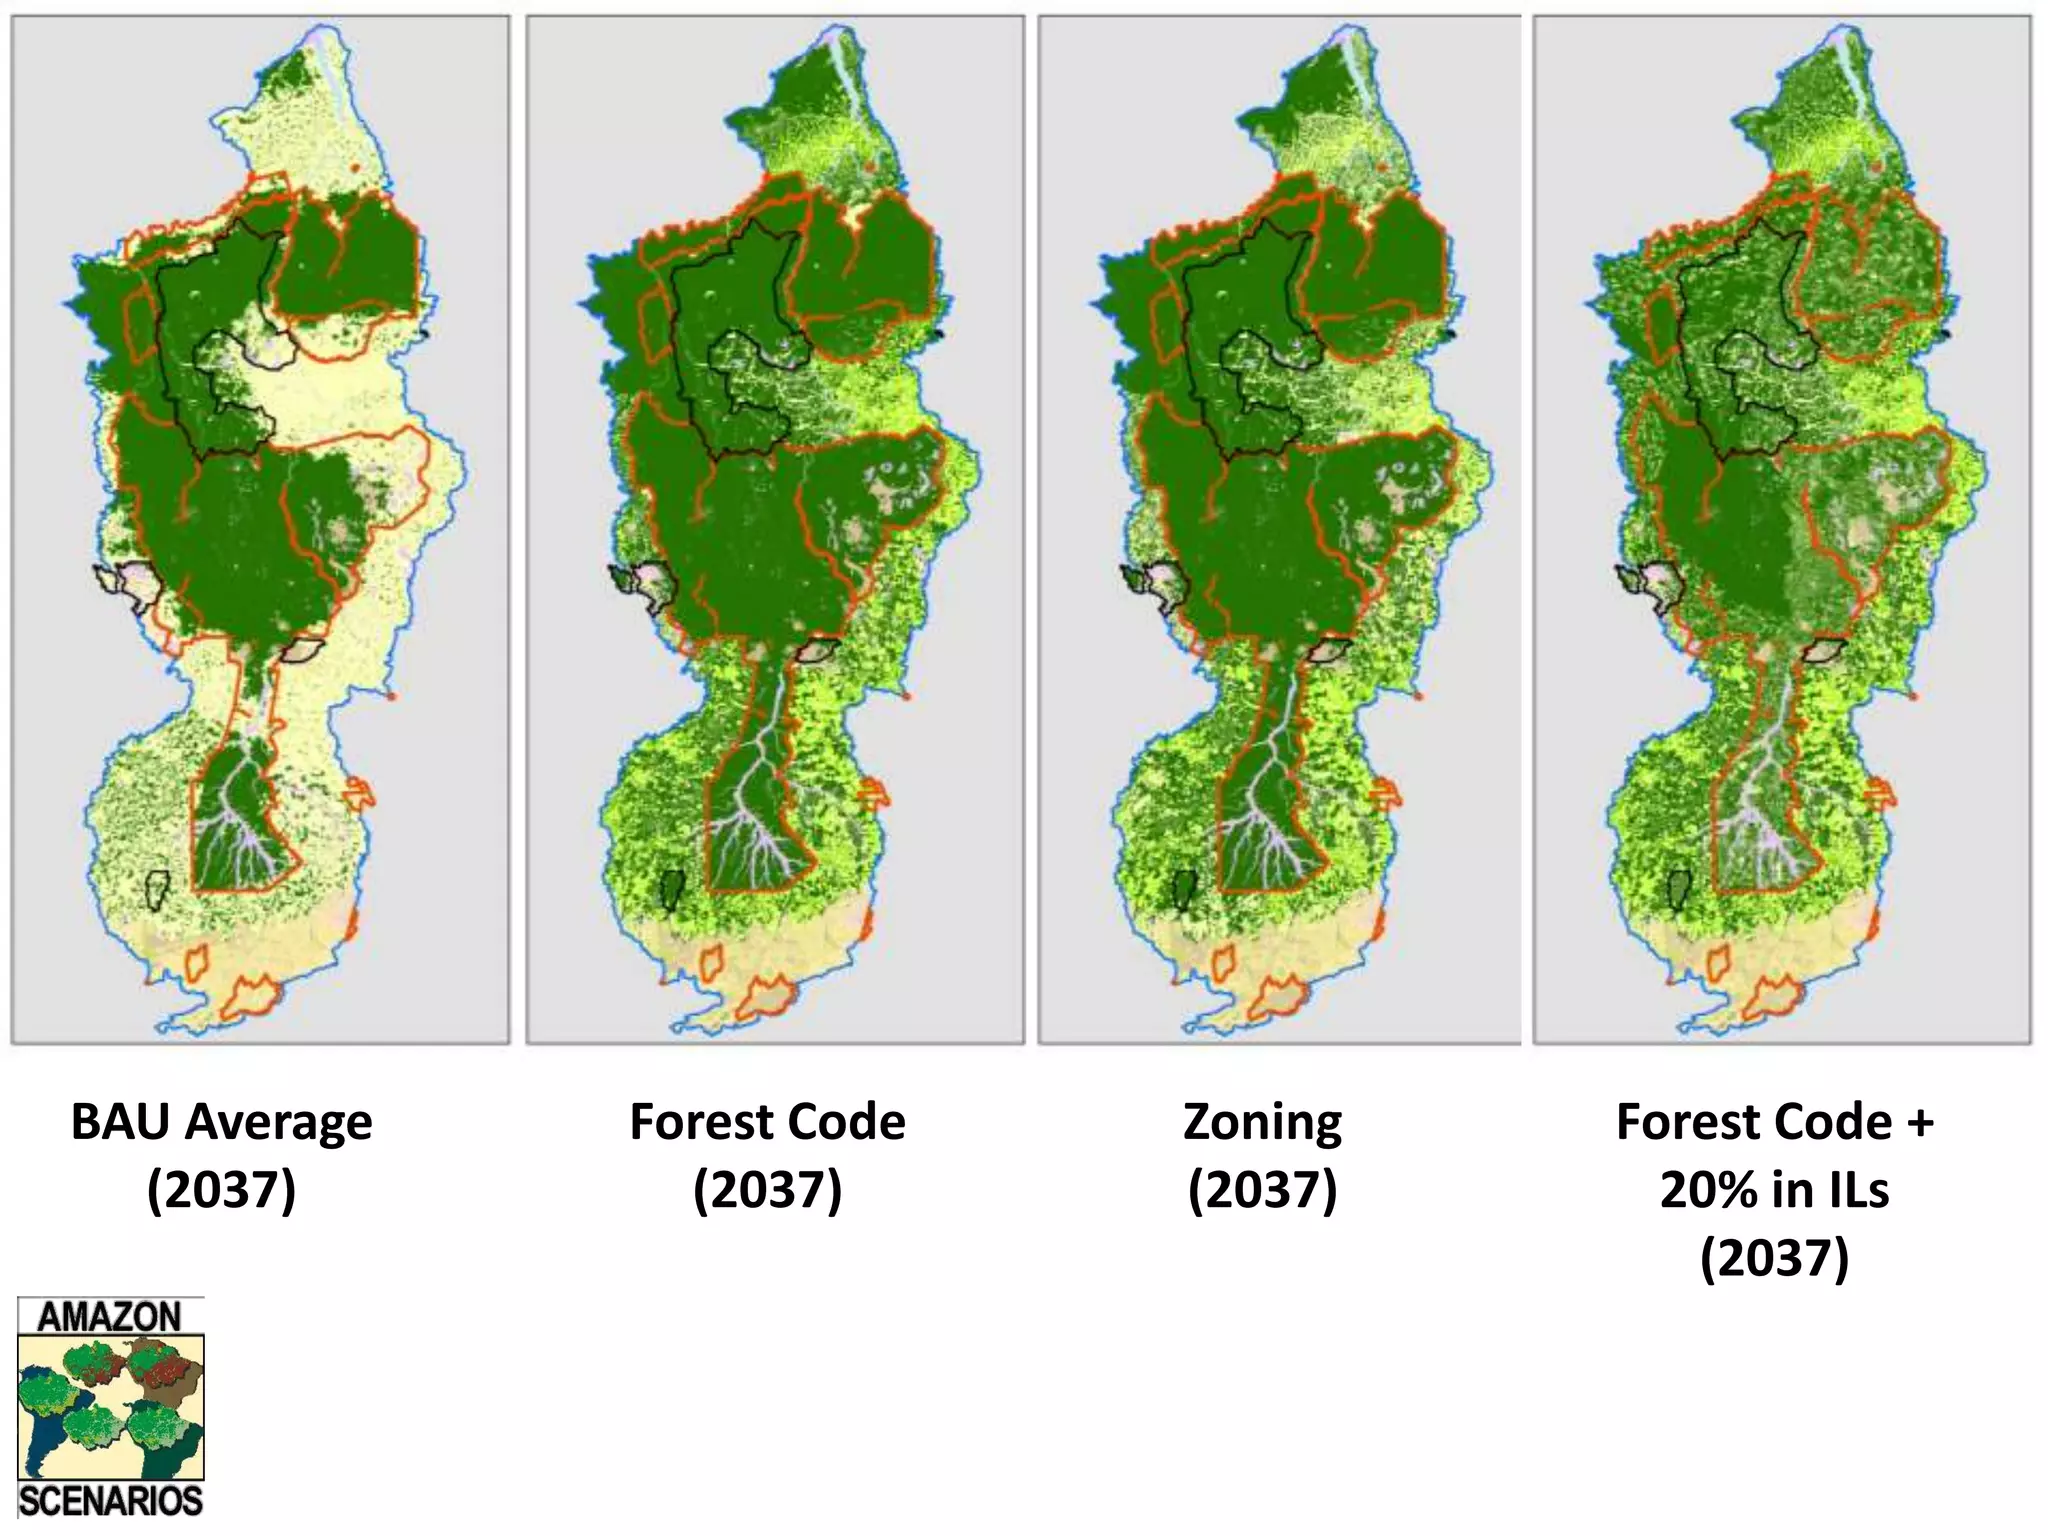
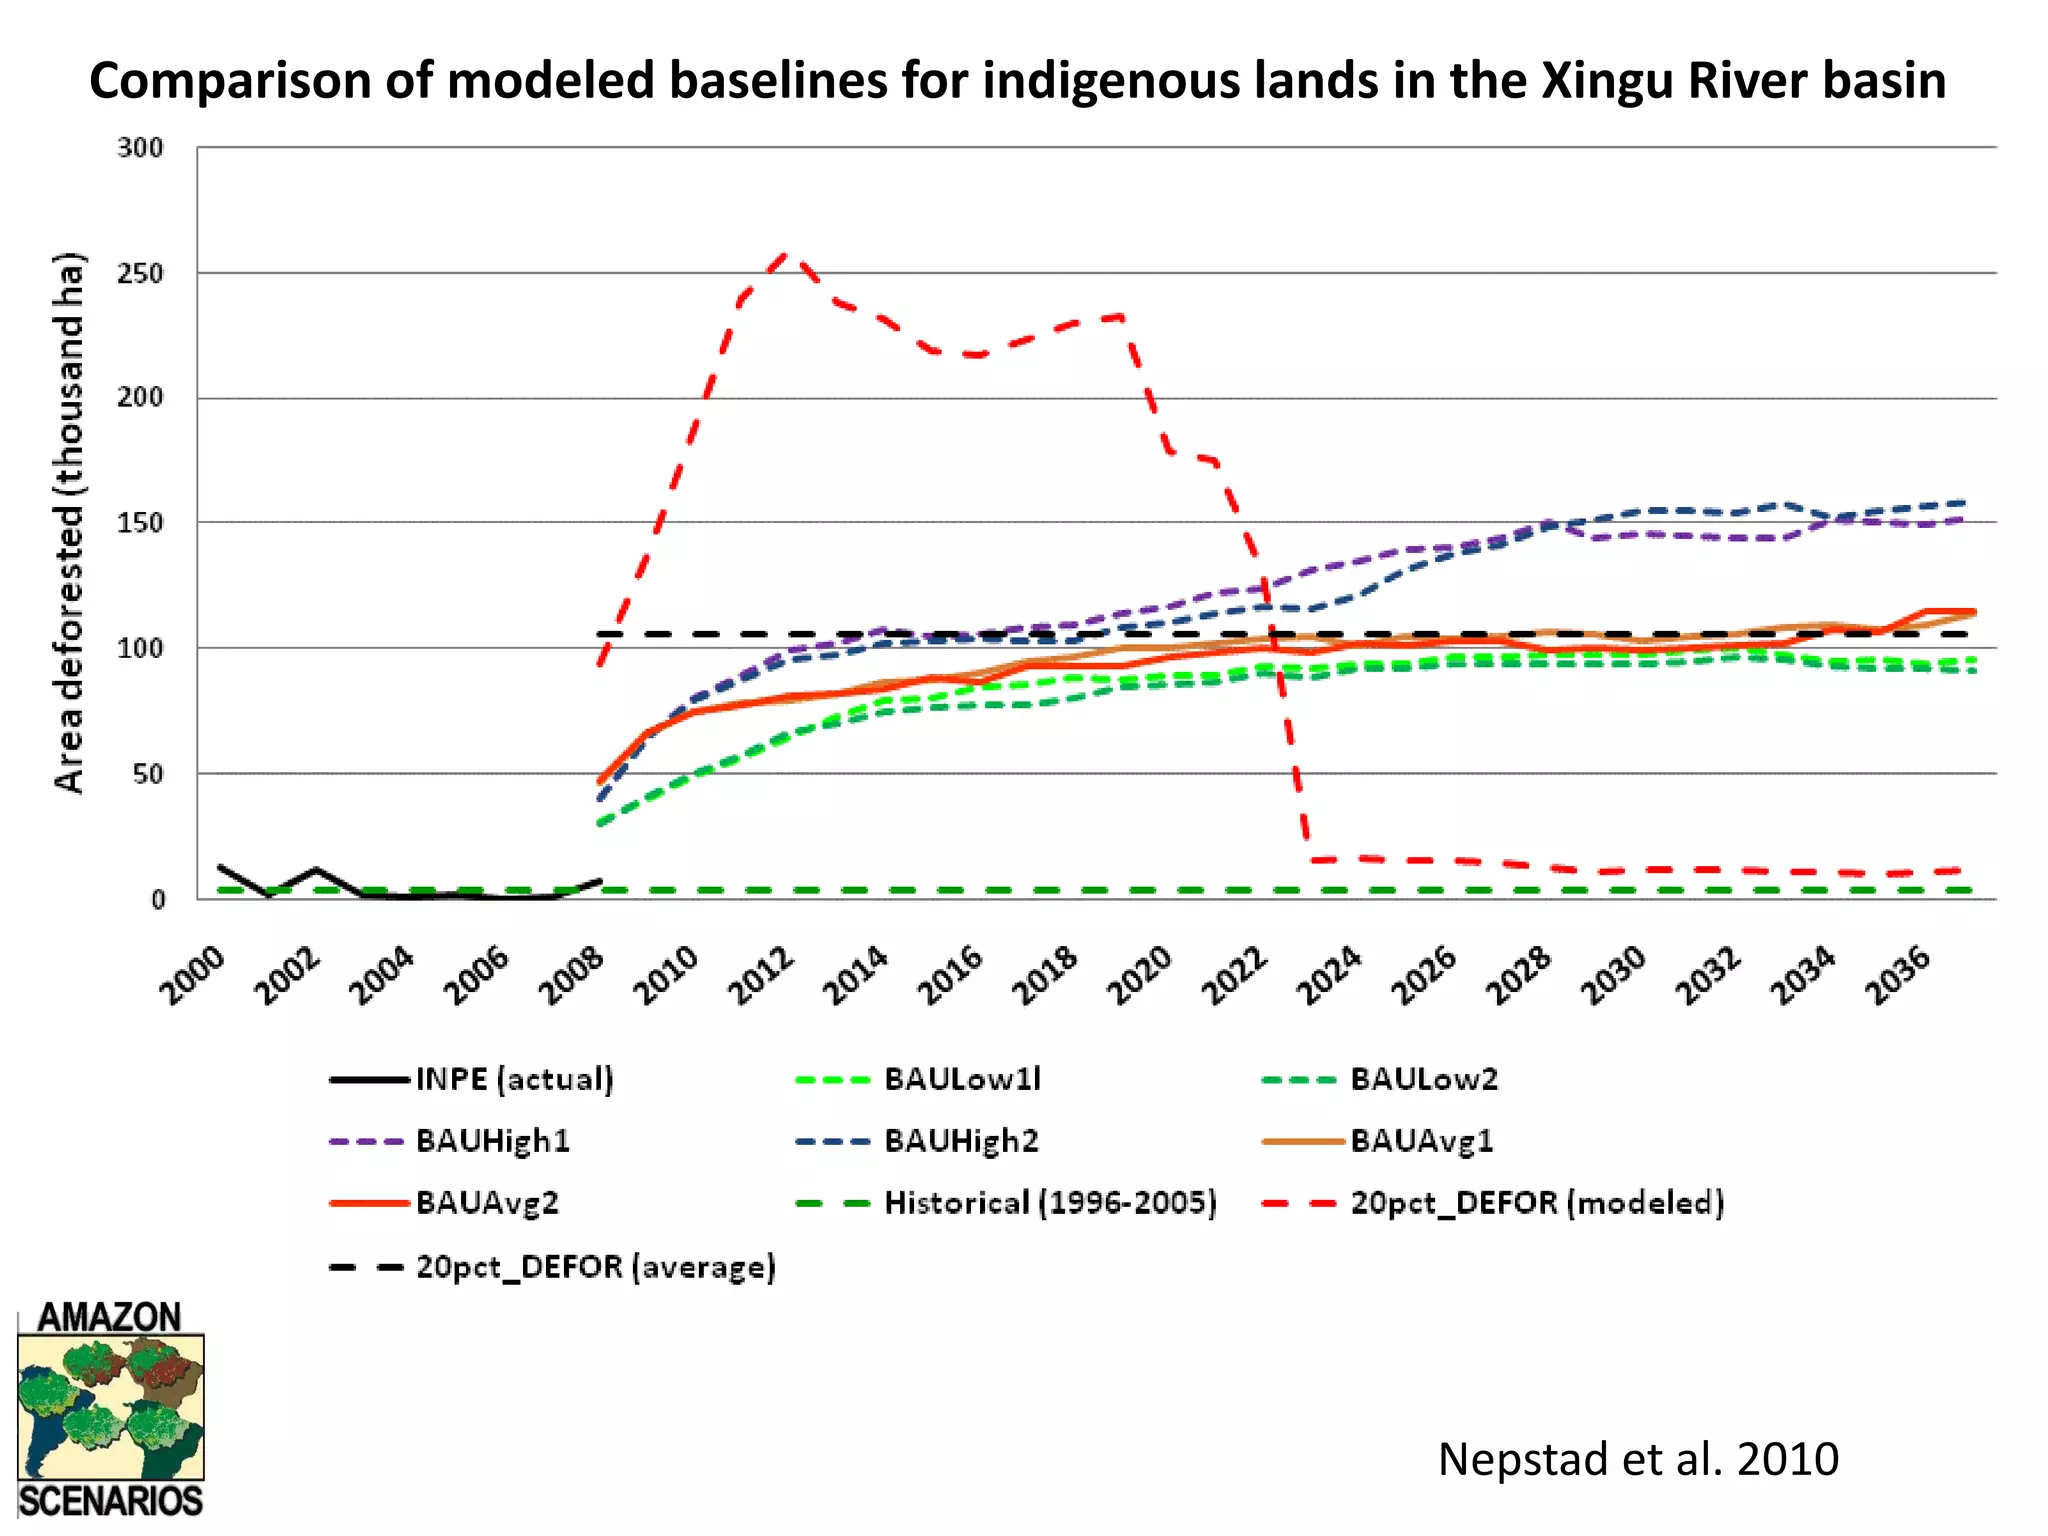
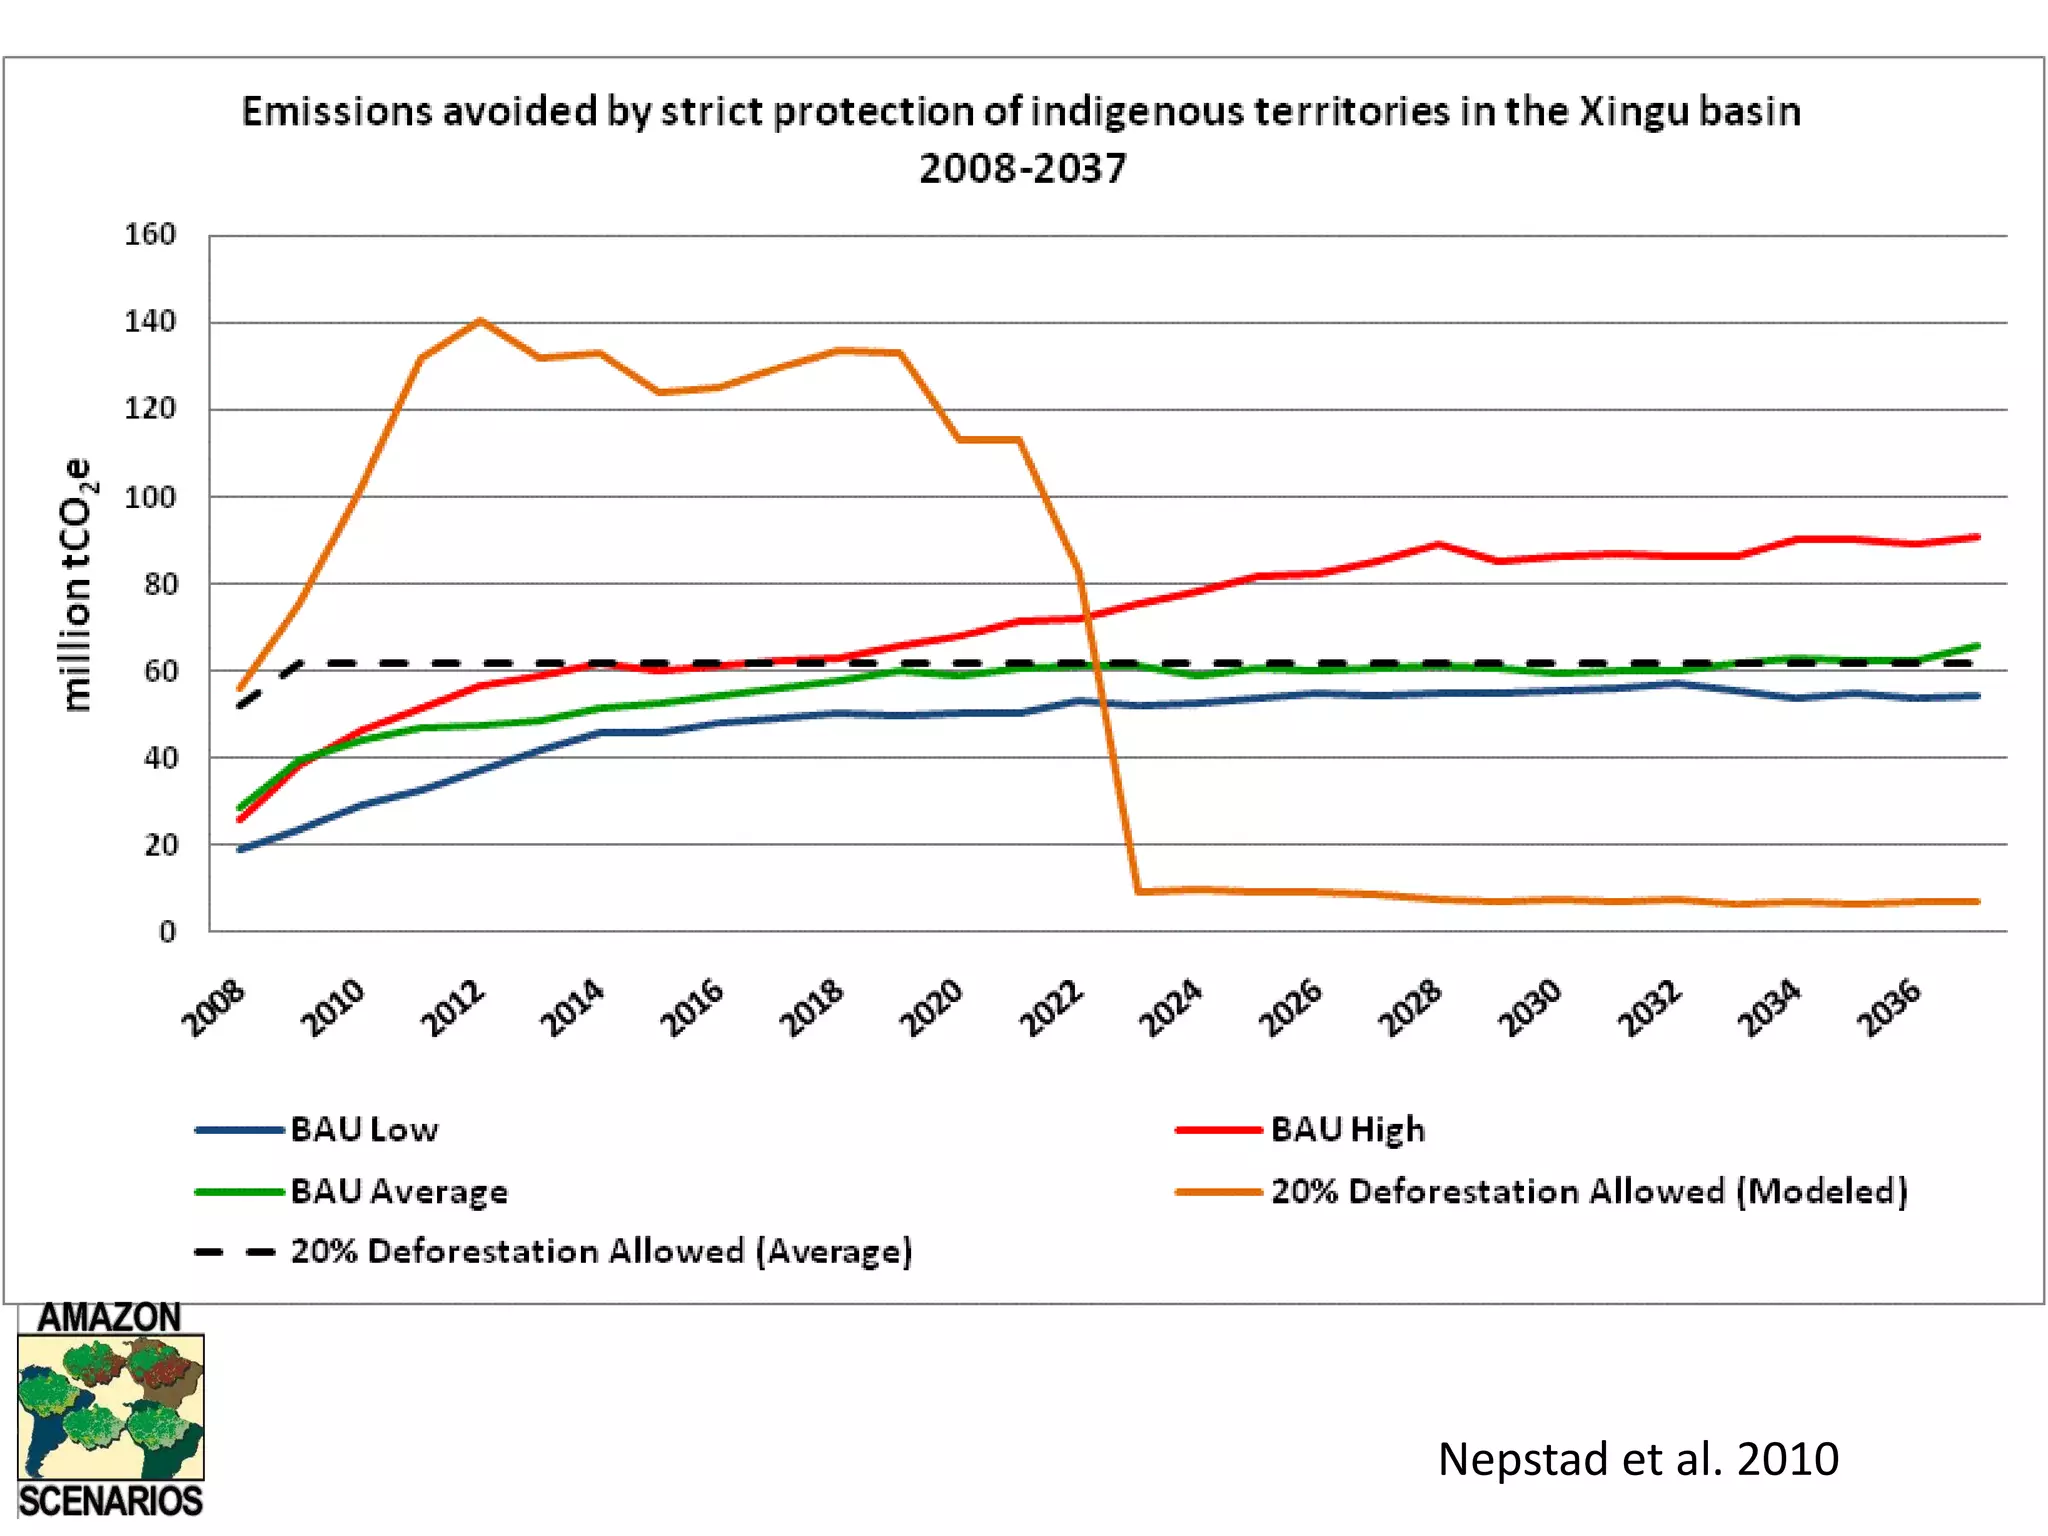
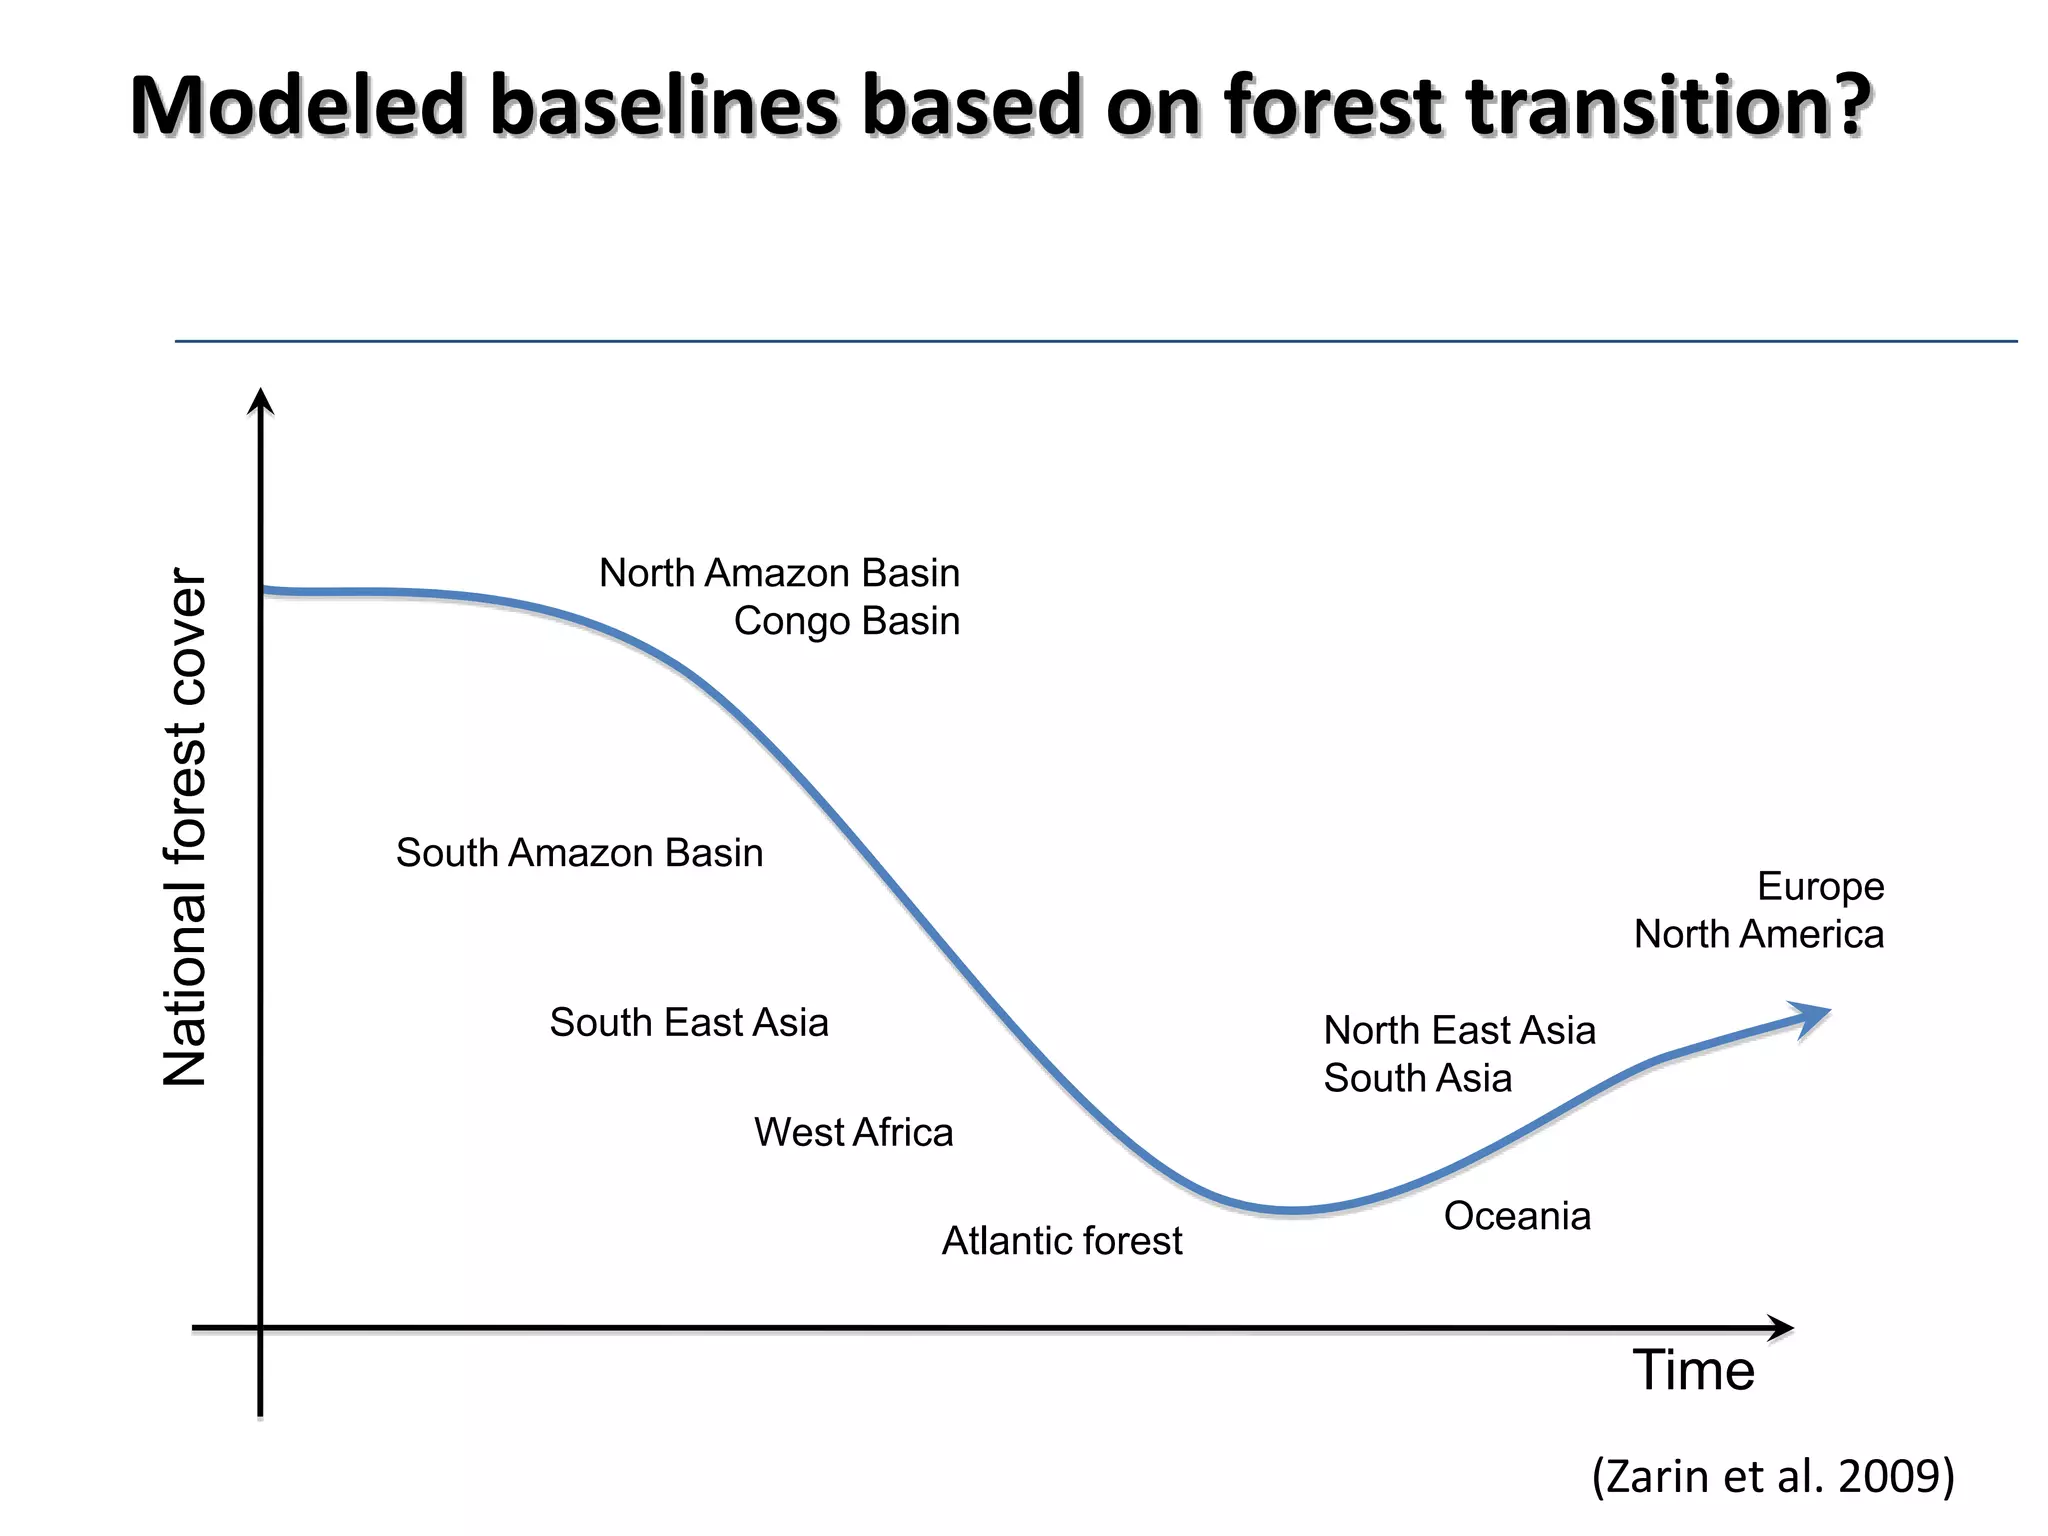
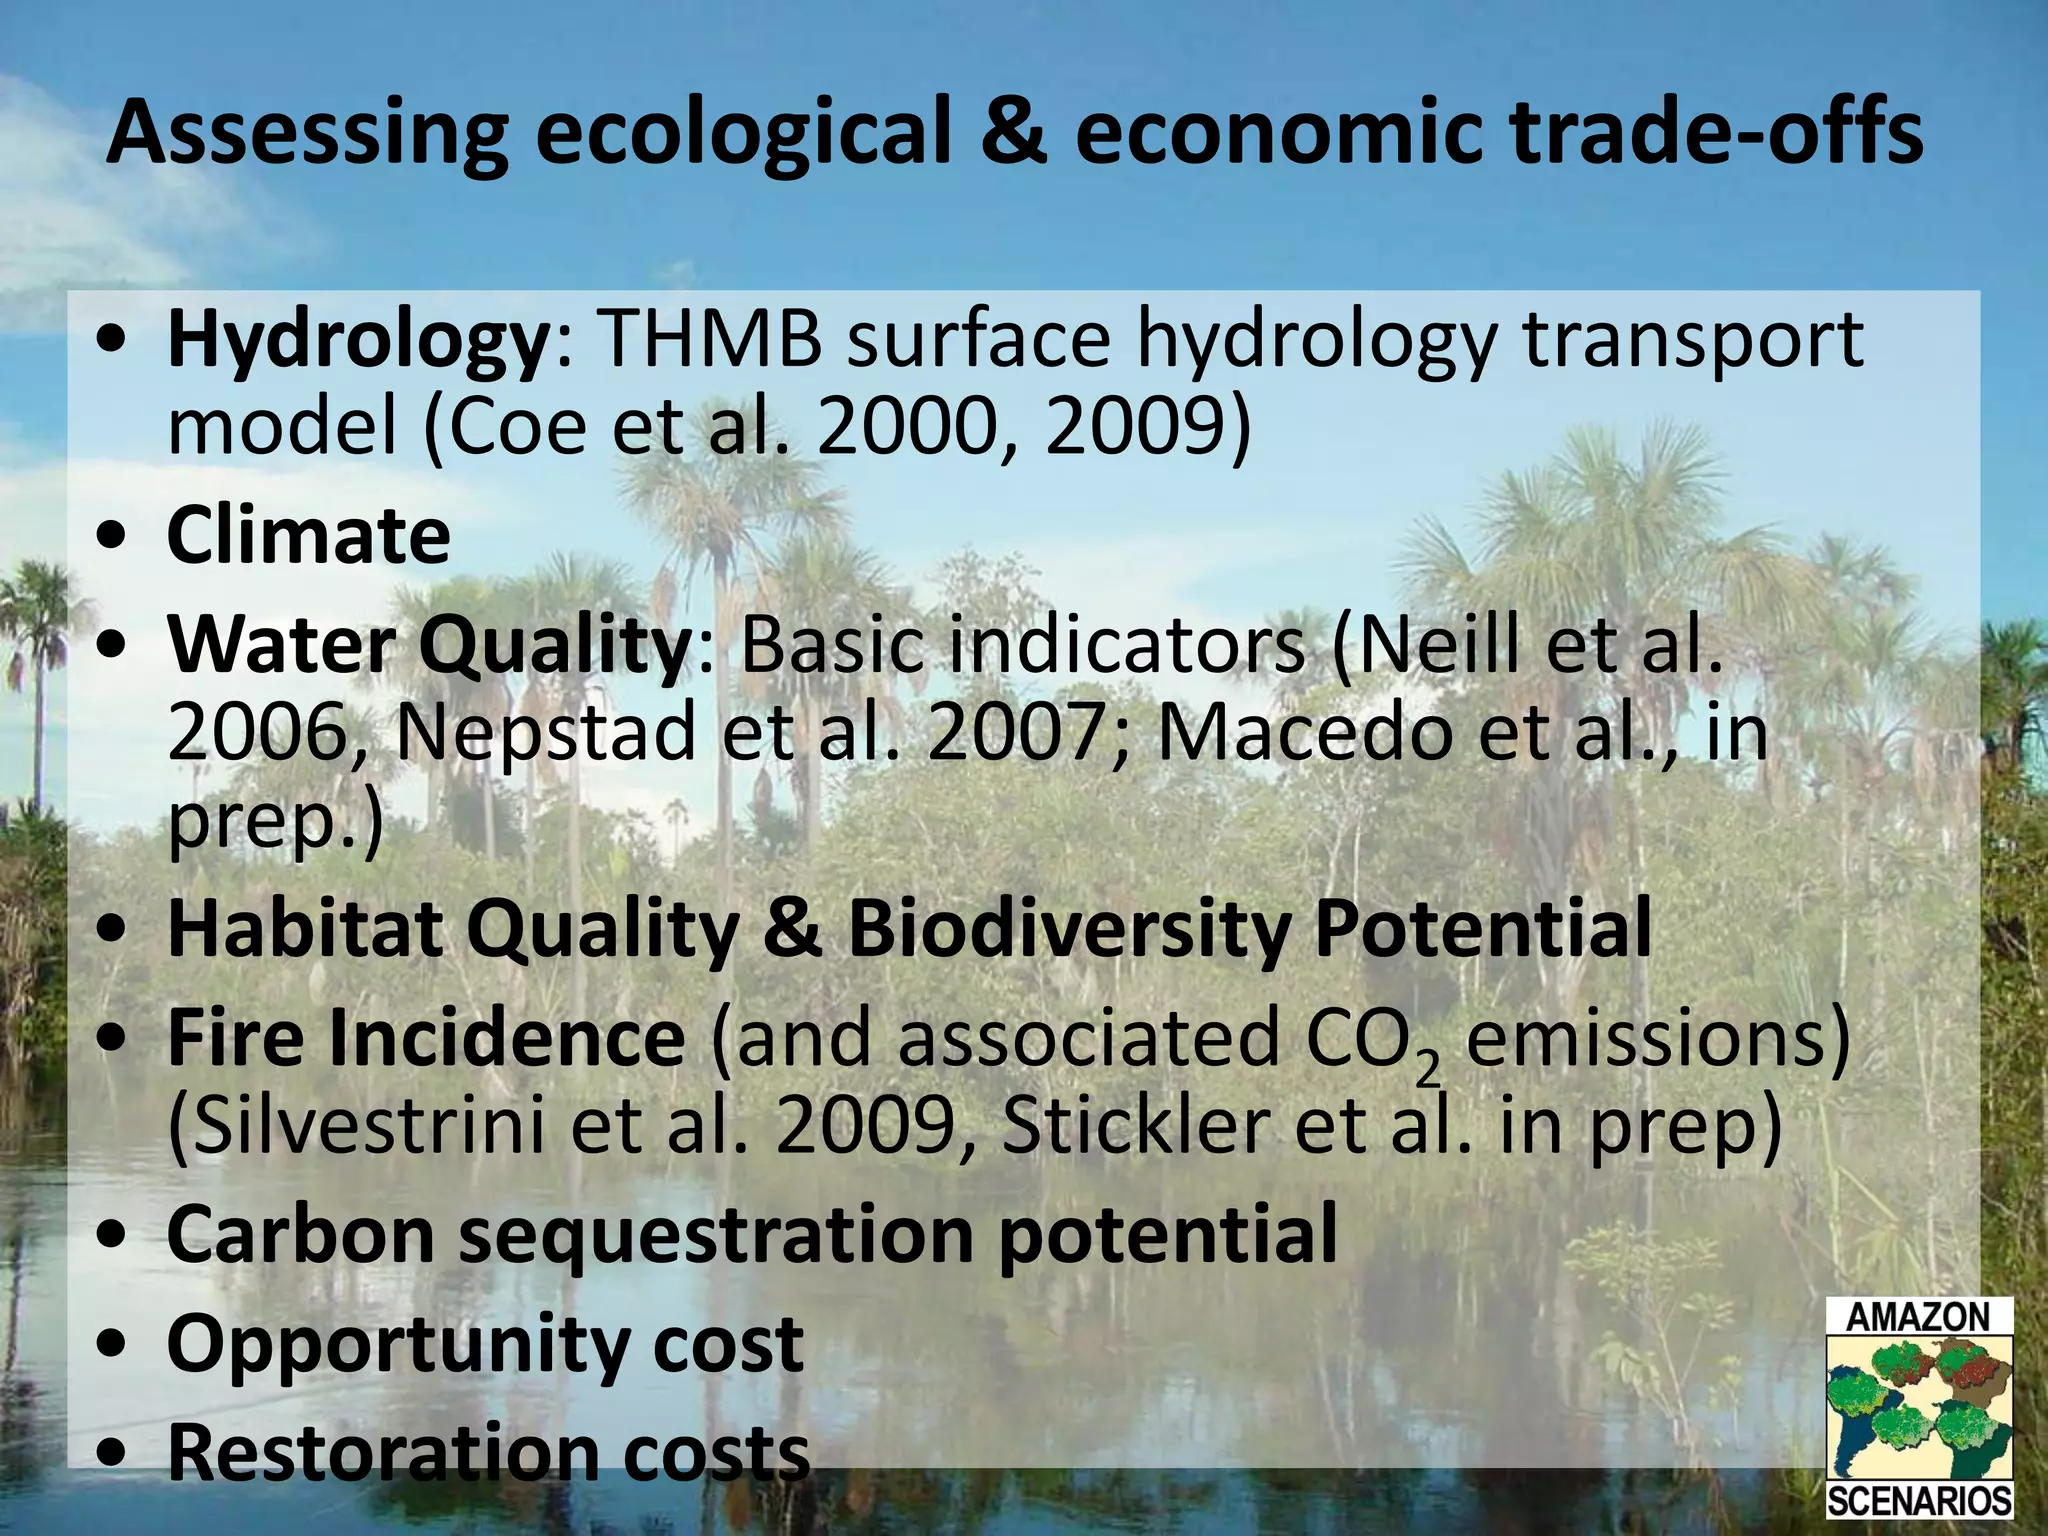
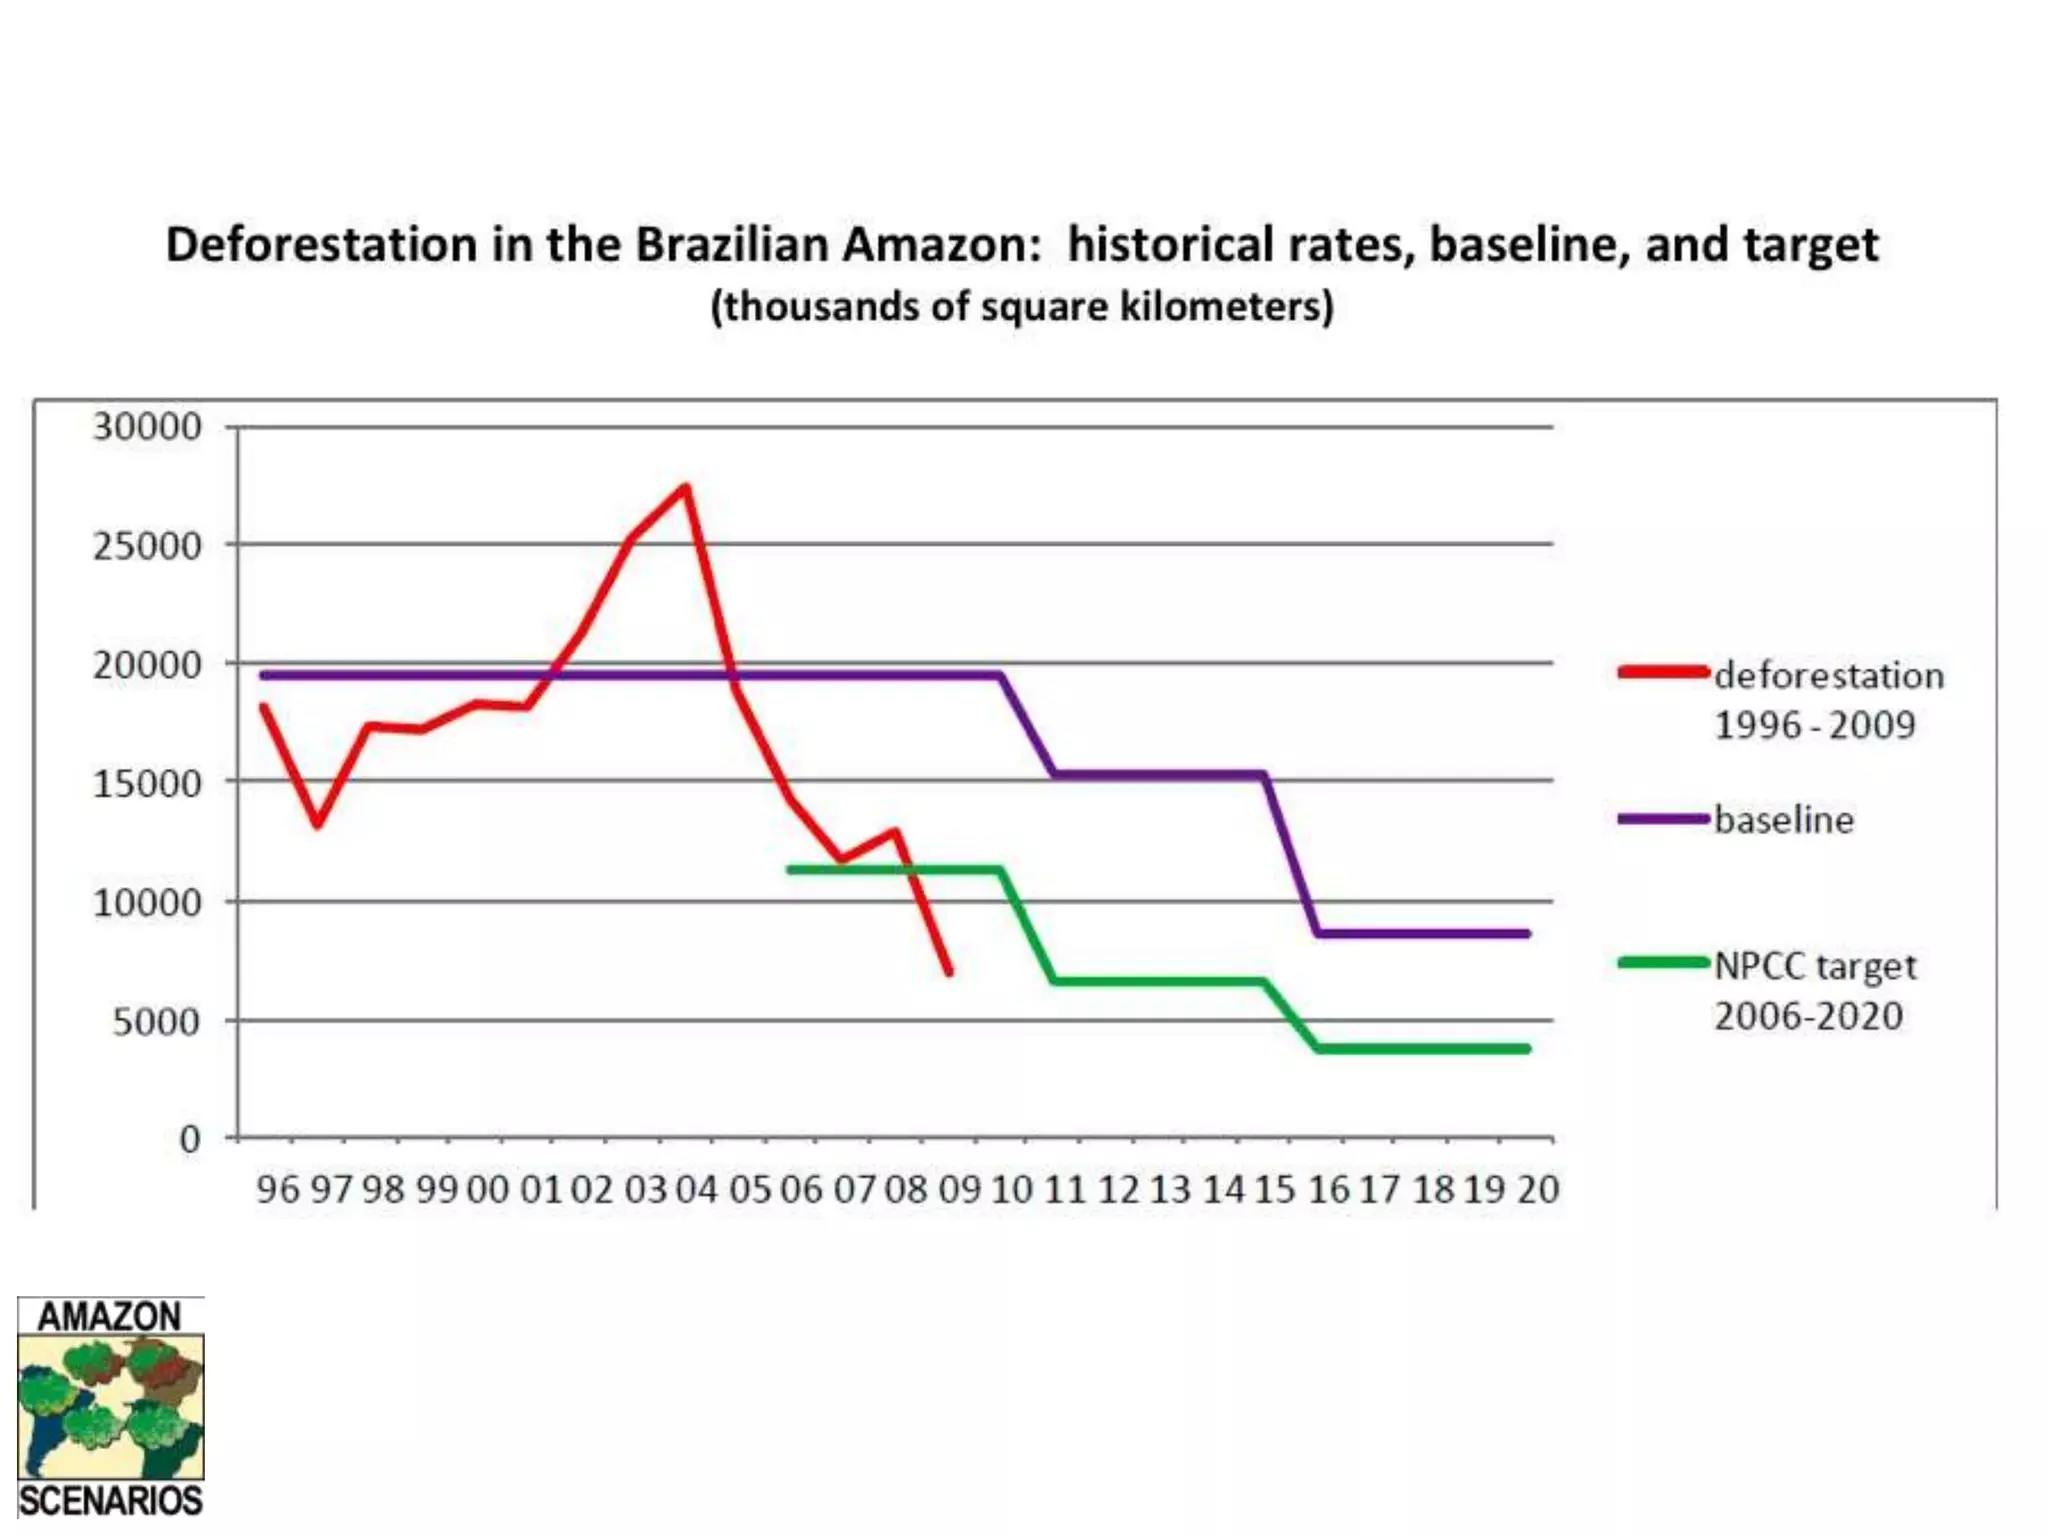
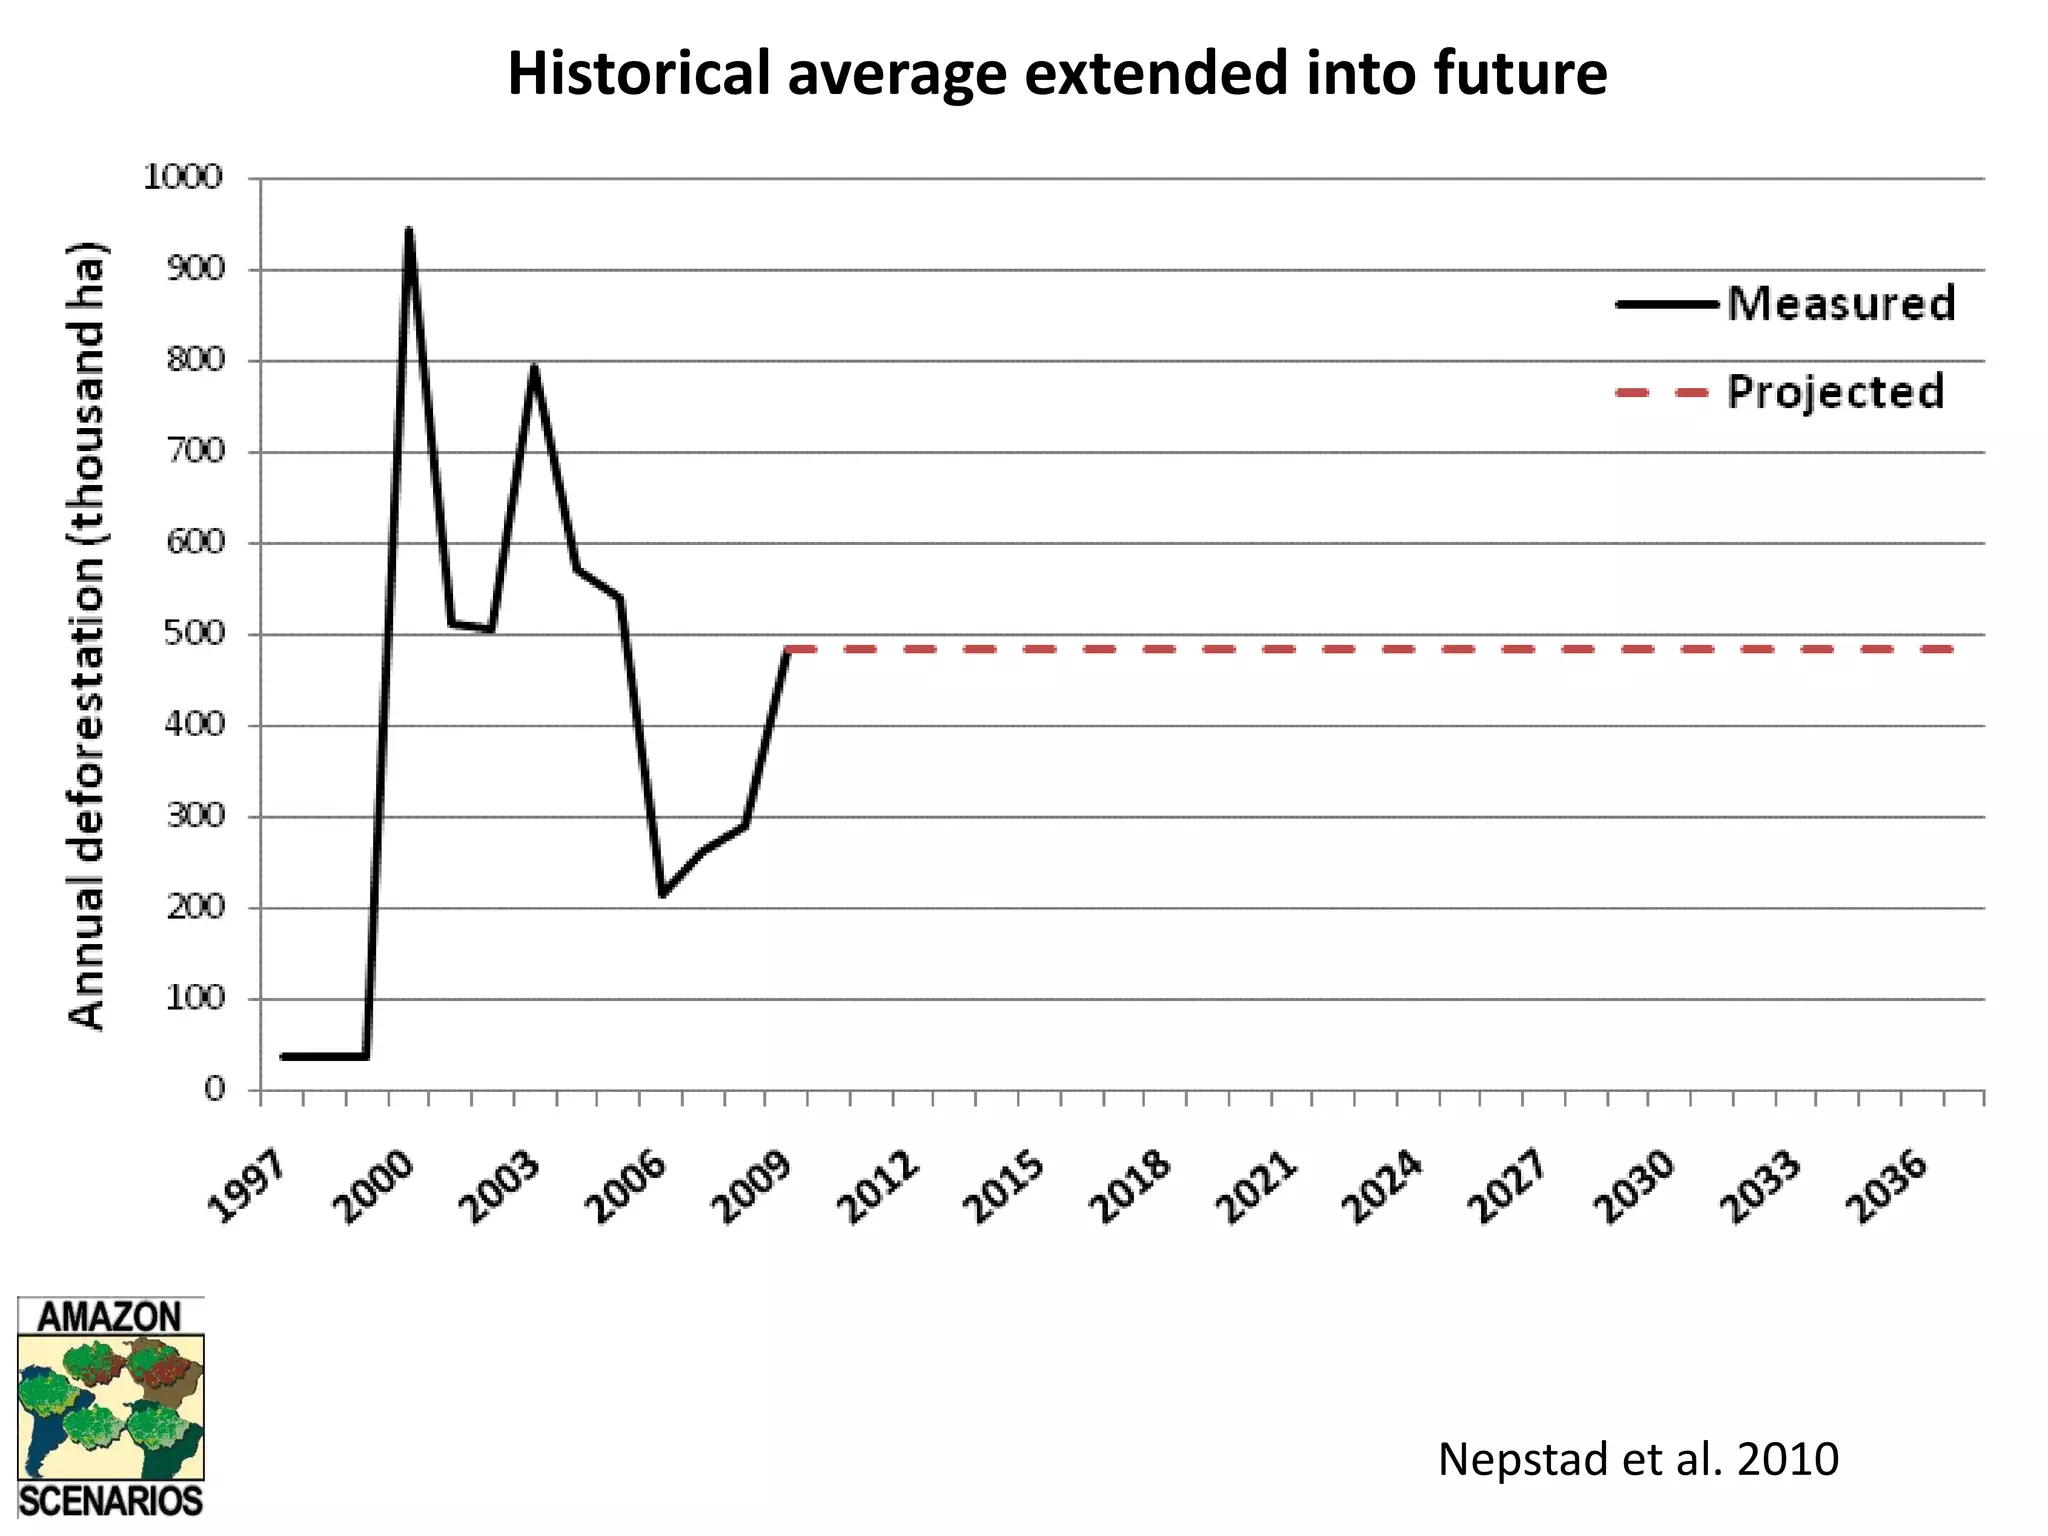
2) The model takes into account factors like protected areas, indigenous lands, roads, soils and historical deforestation patterns to generate high and low estimates of business-as-usual deforestation under different policy scenarios.
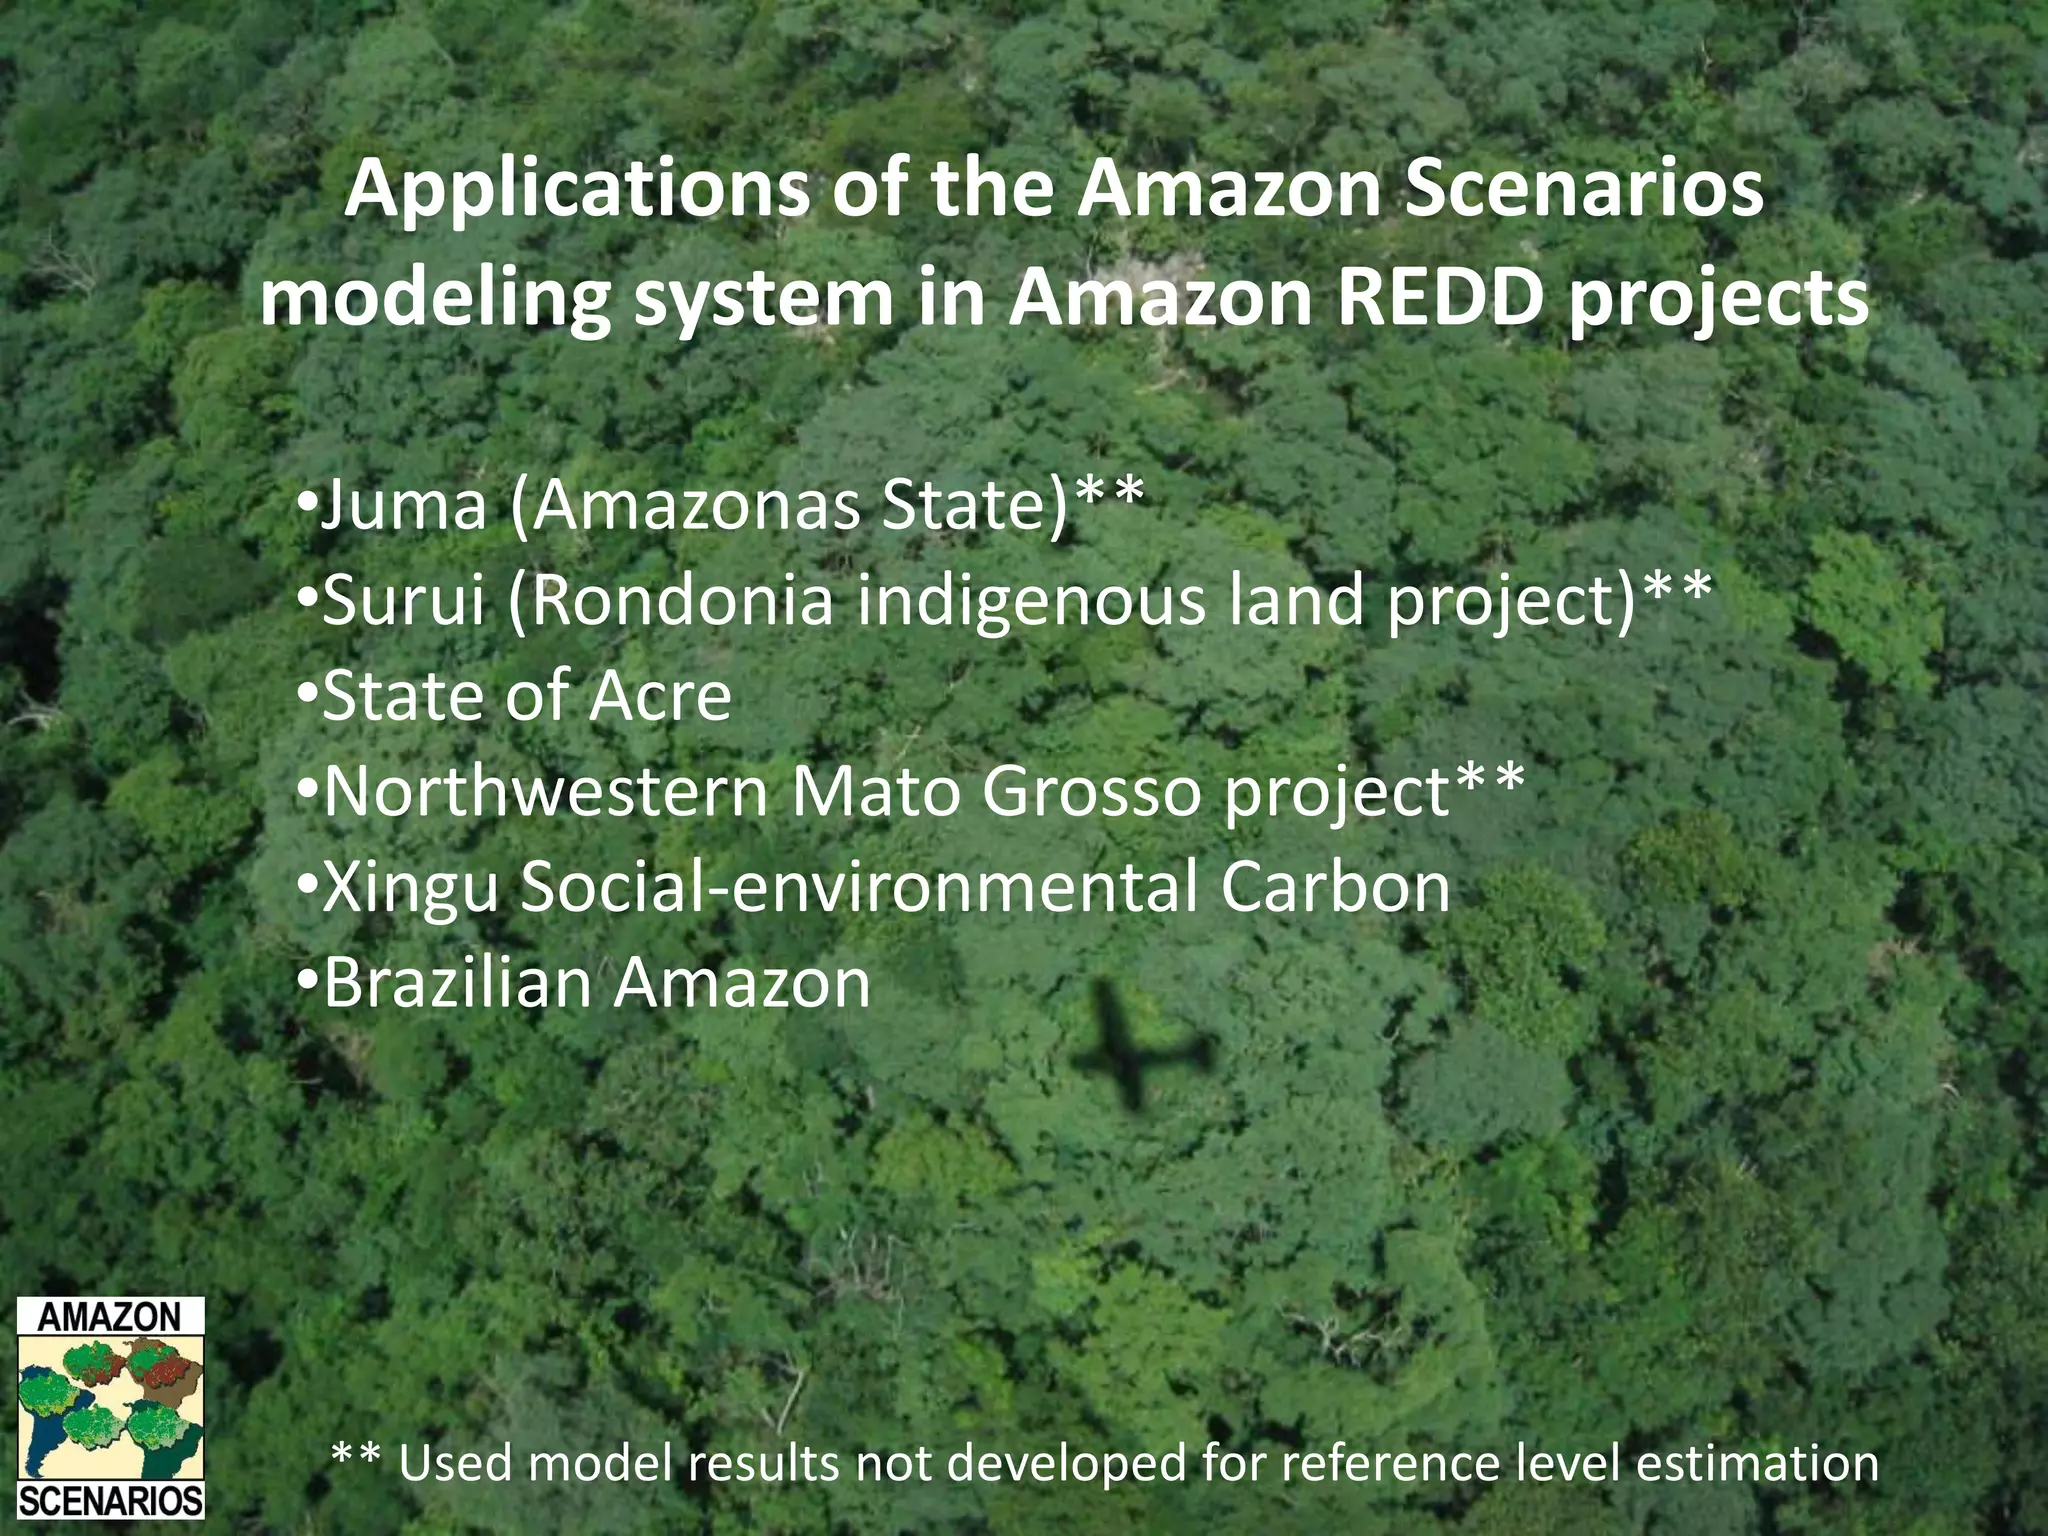
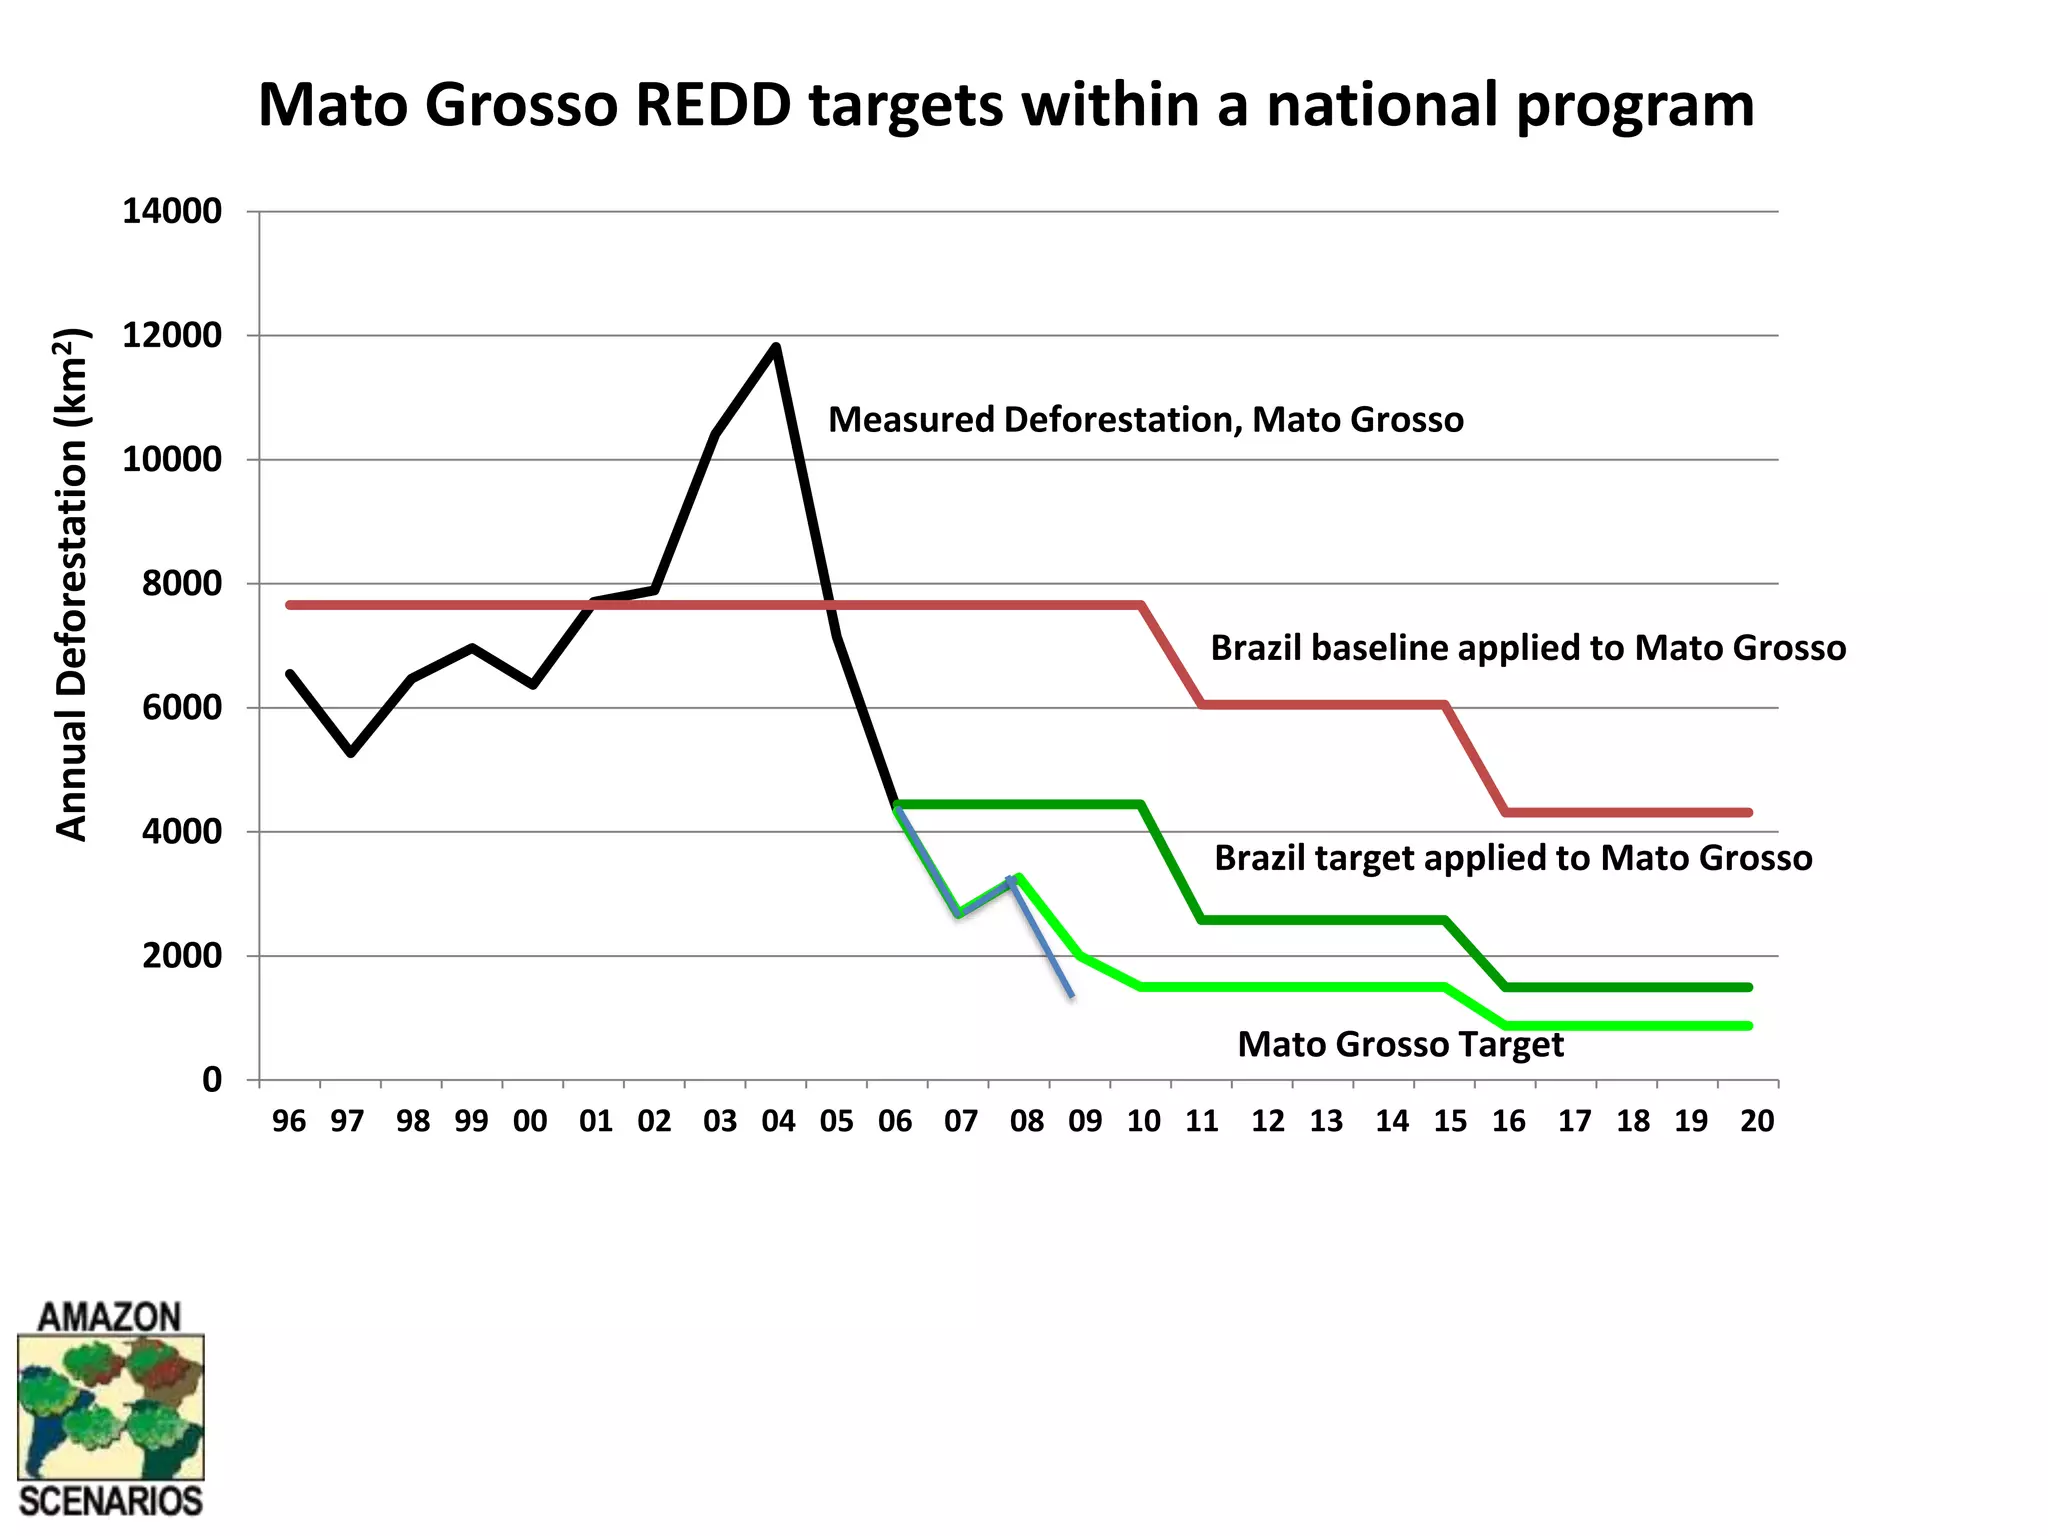
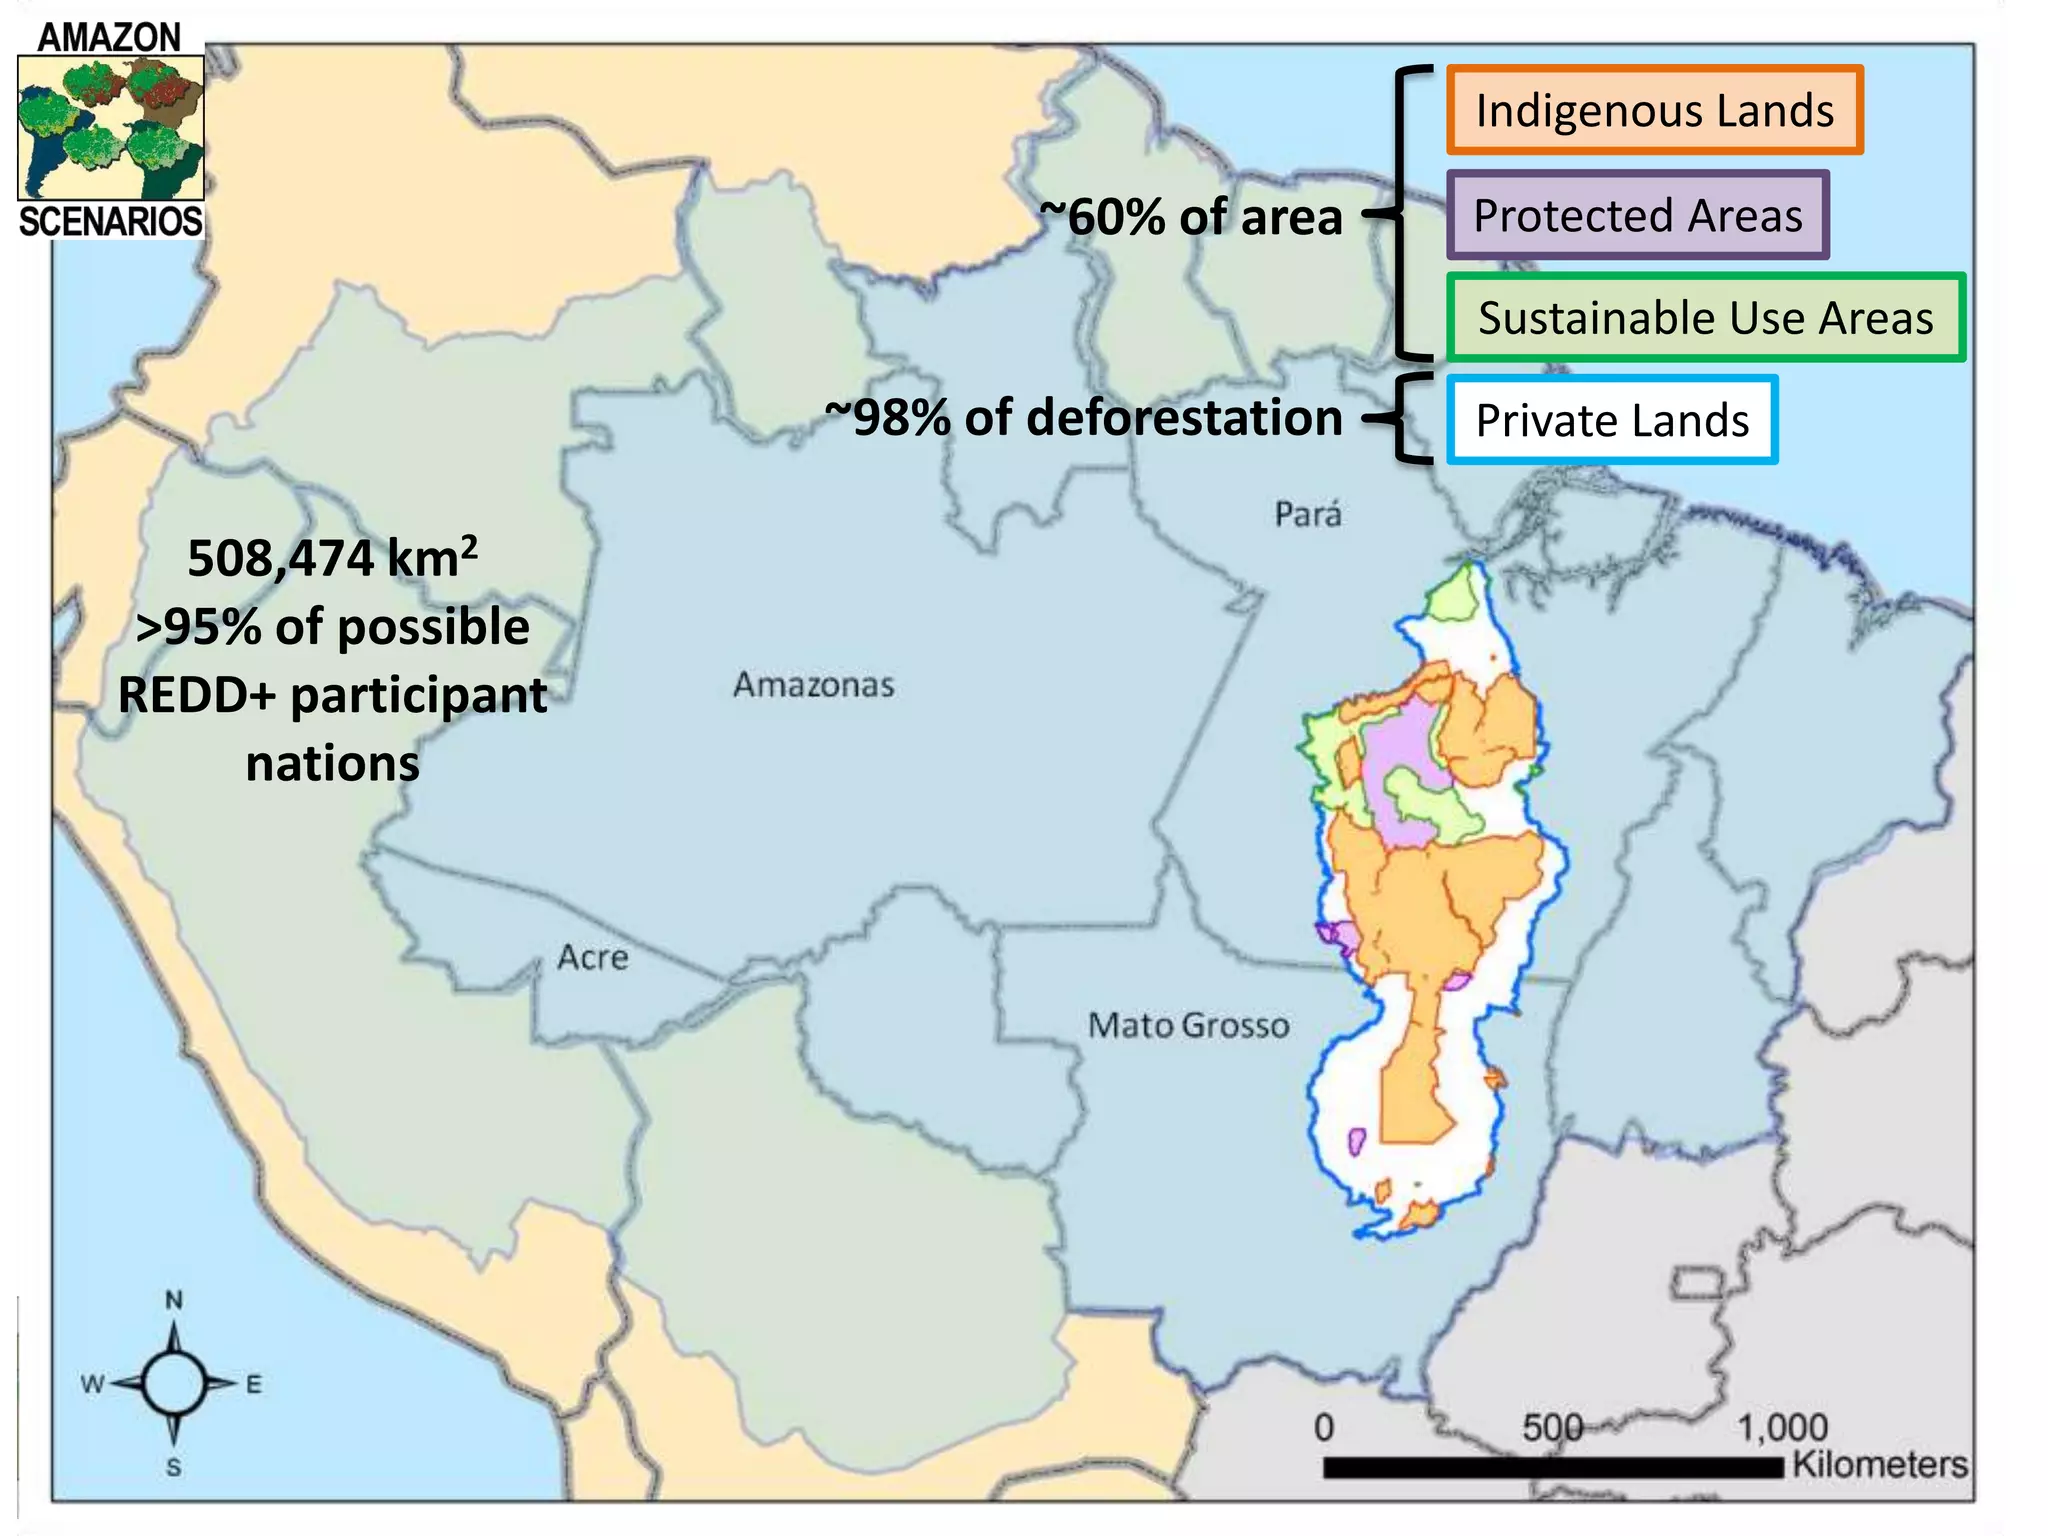
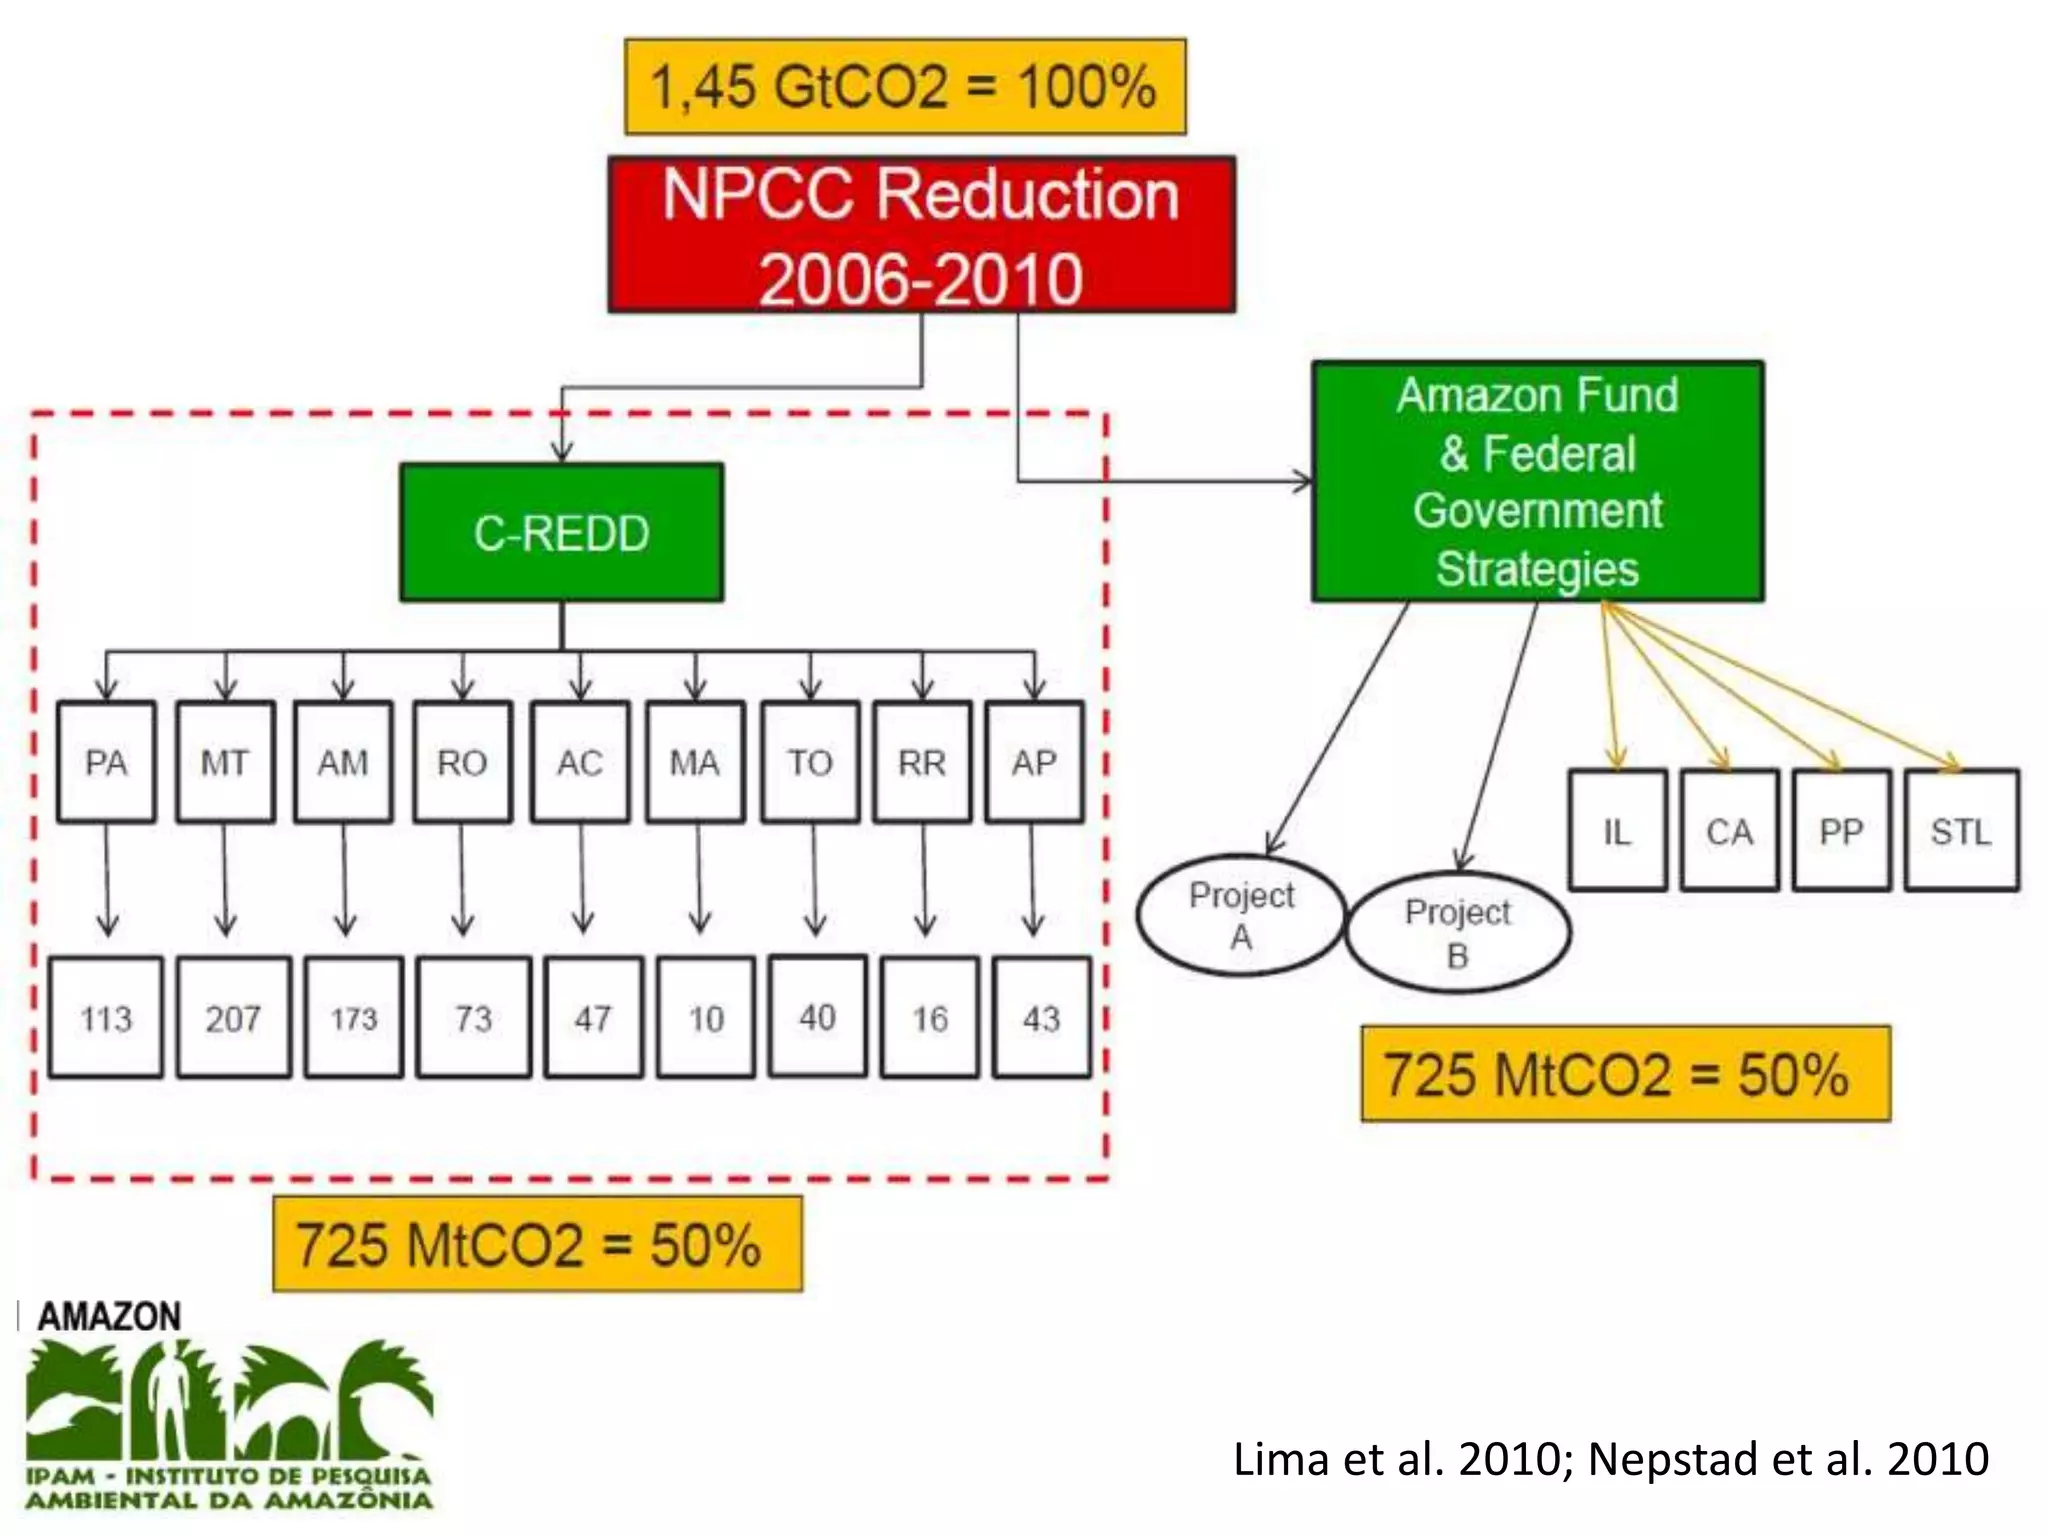
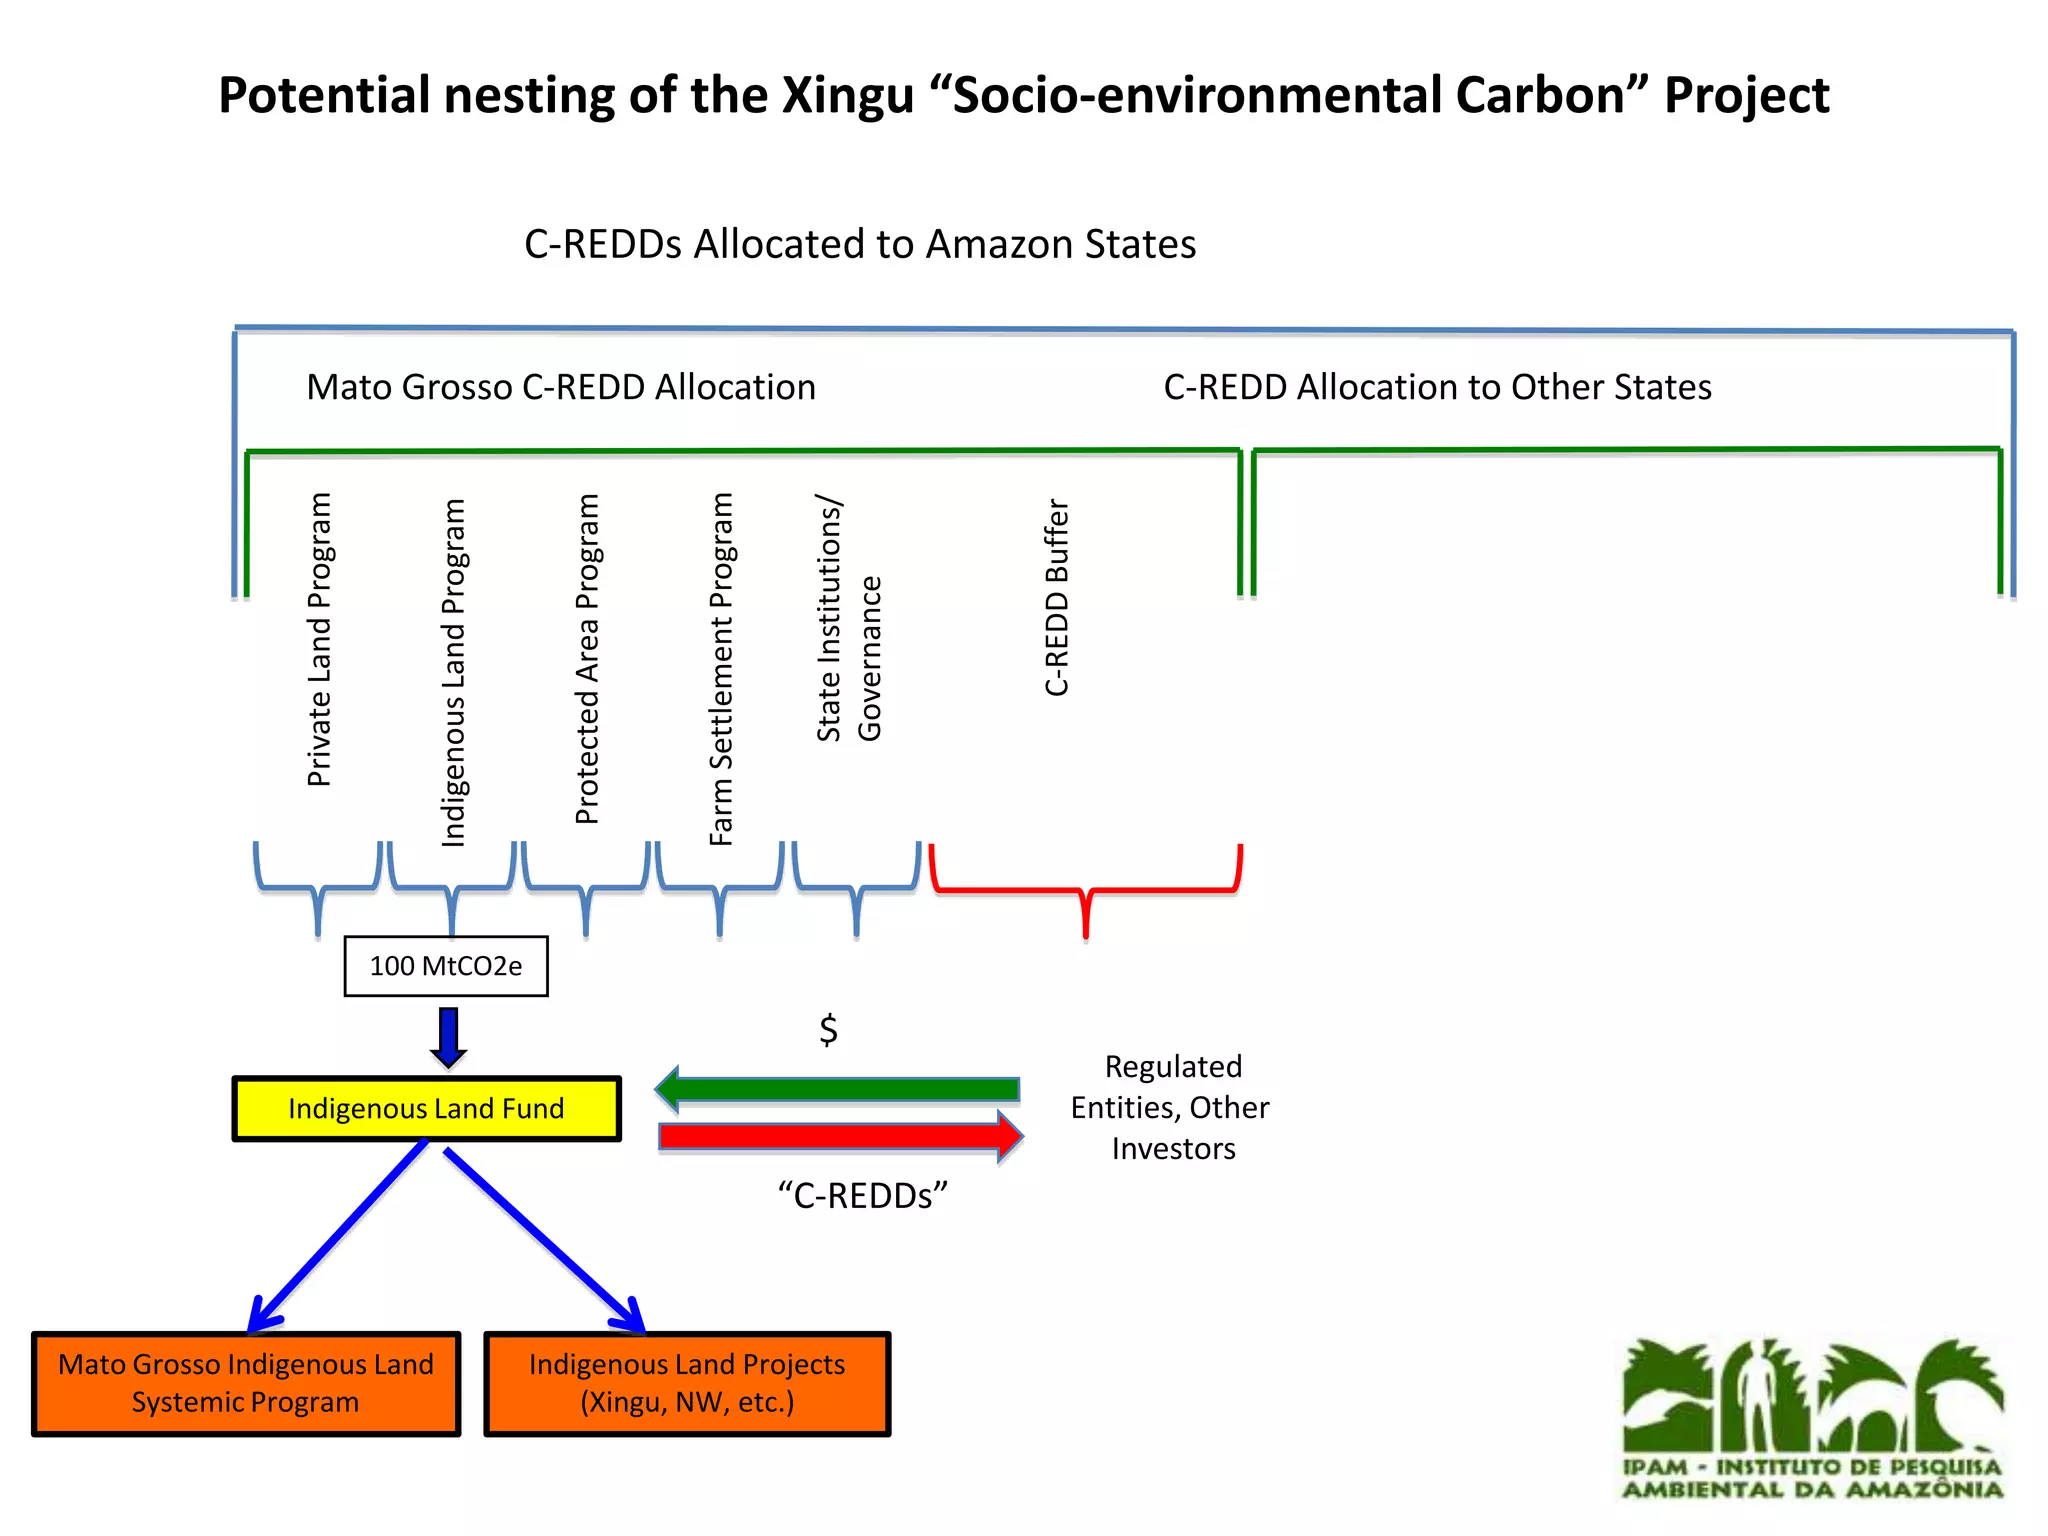
3) Results from the Amazon Scenarios model have been used to estimate baseline deforestation and emissions reductions for several specific REDD+ projects in Brazil, including in the states of Amazonas, Rondonia, Acre, and Mato Grosso.

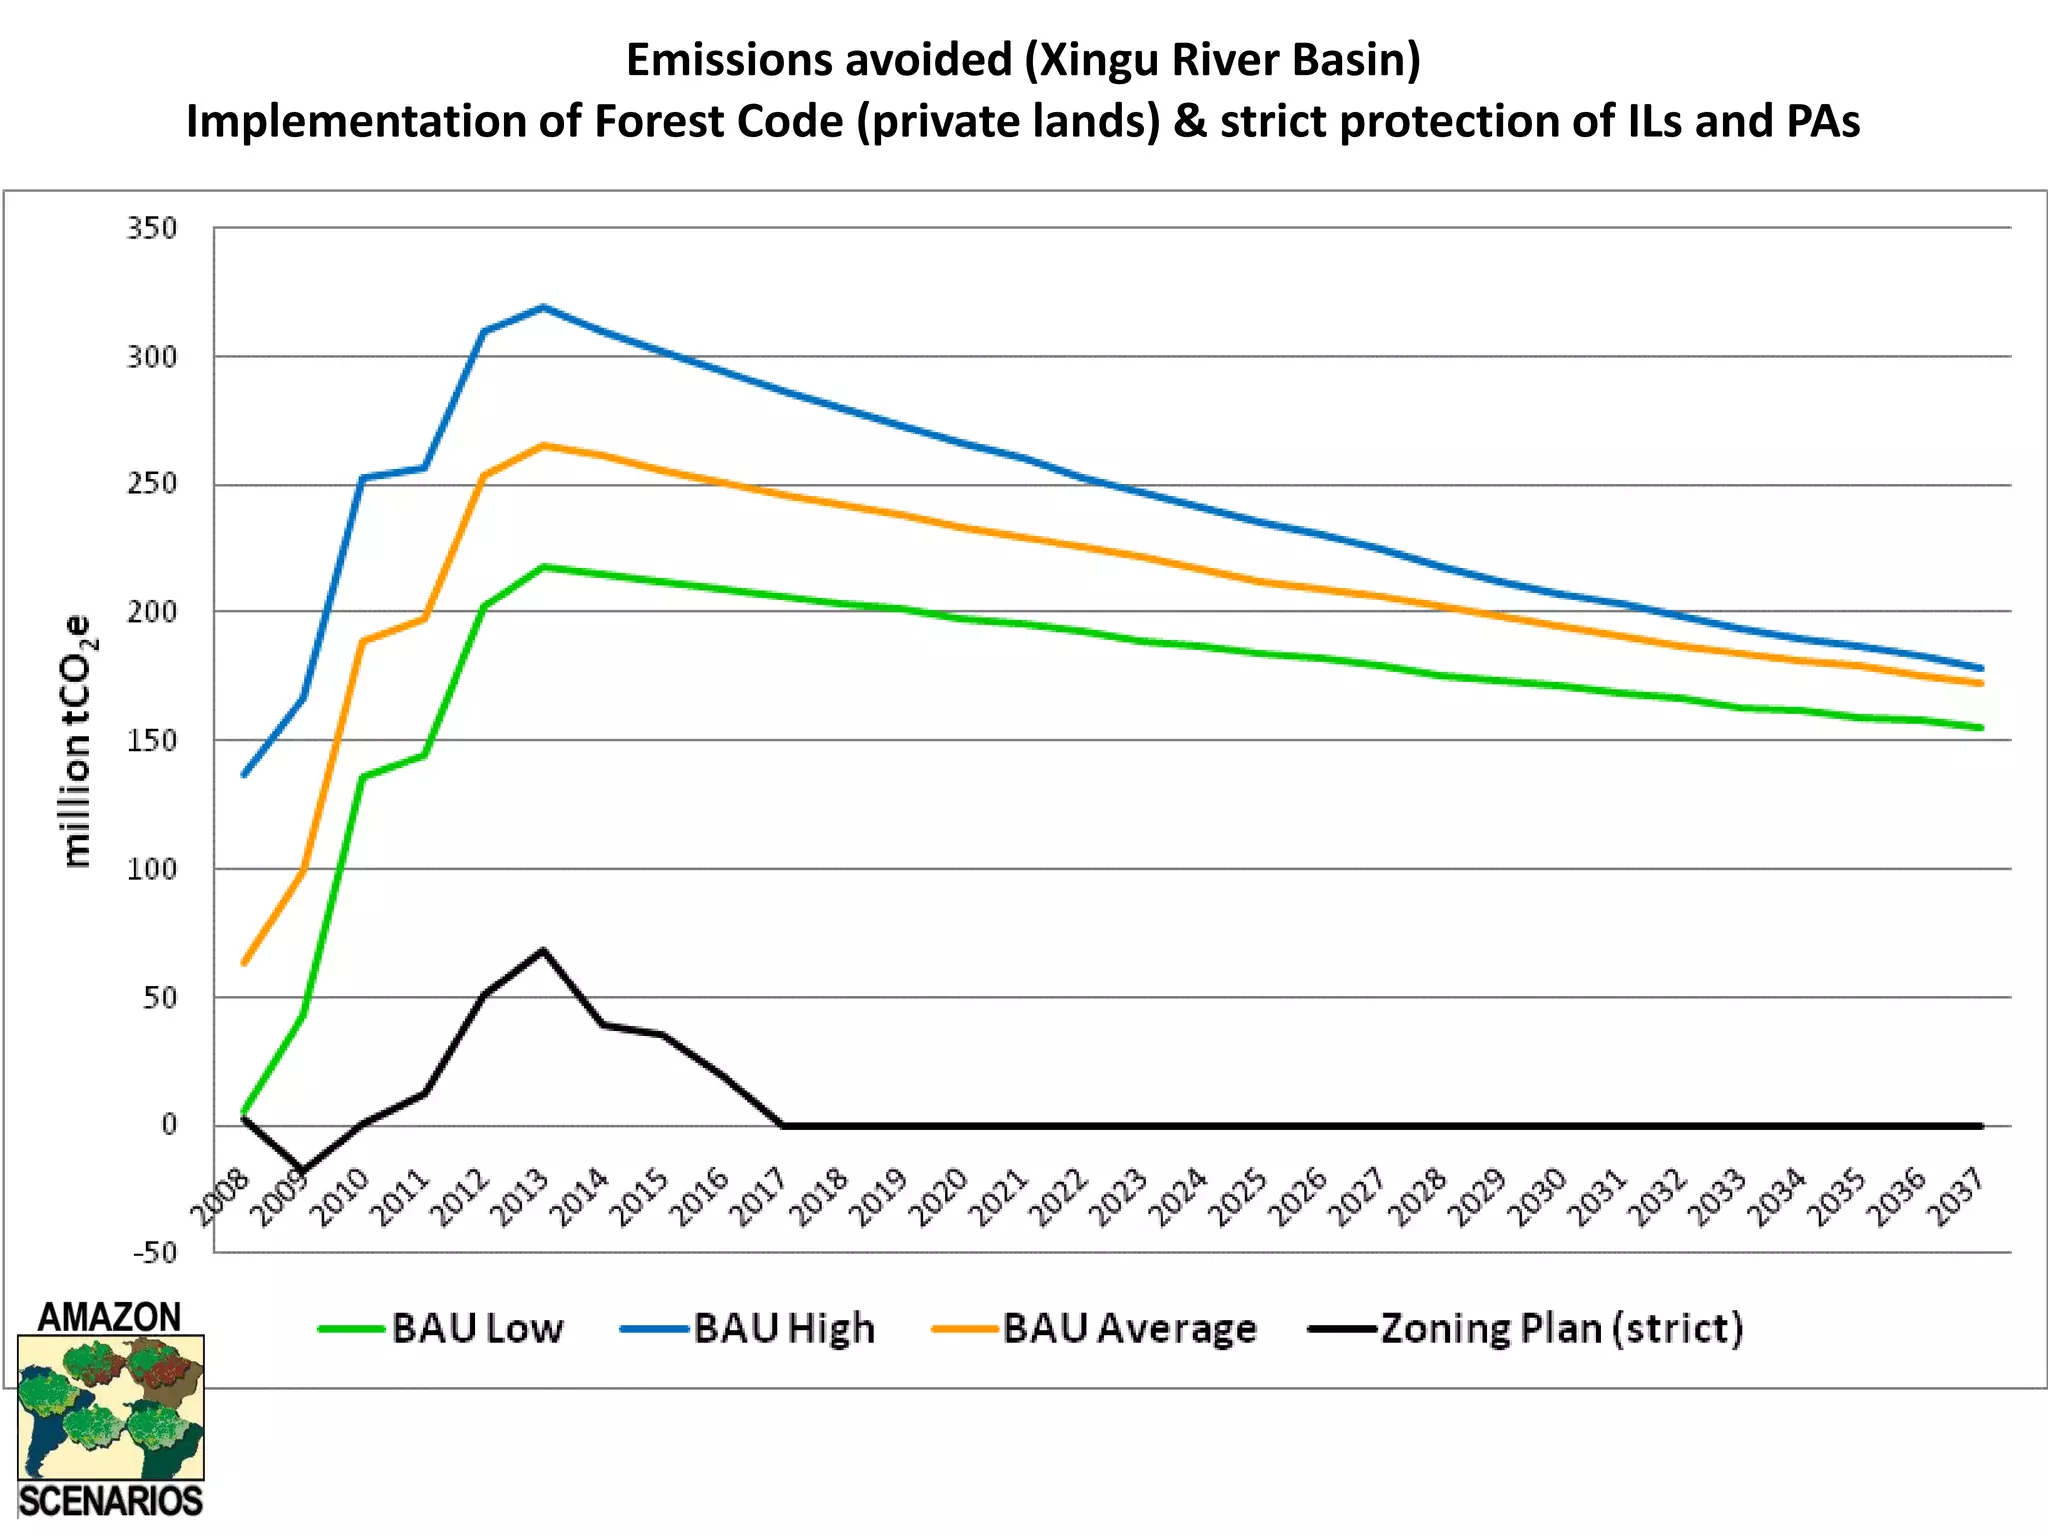
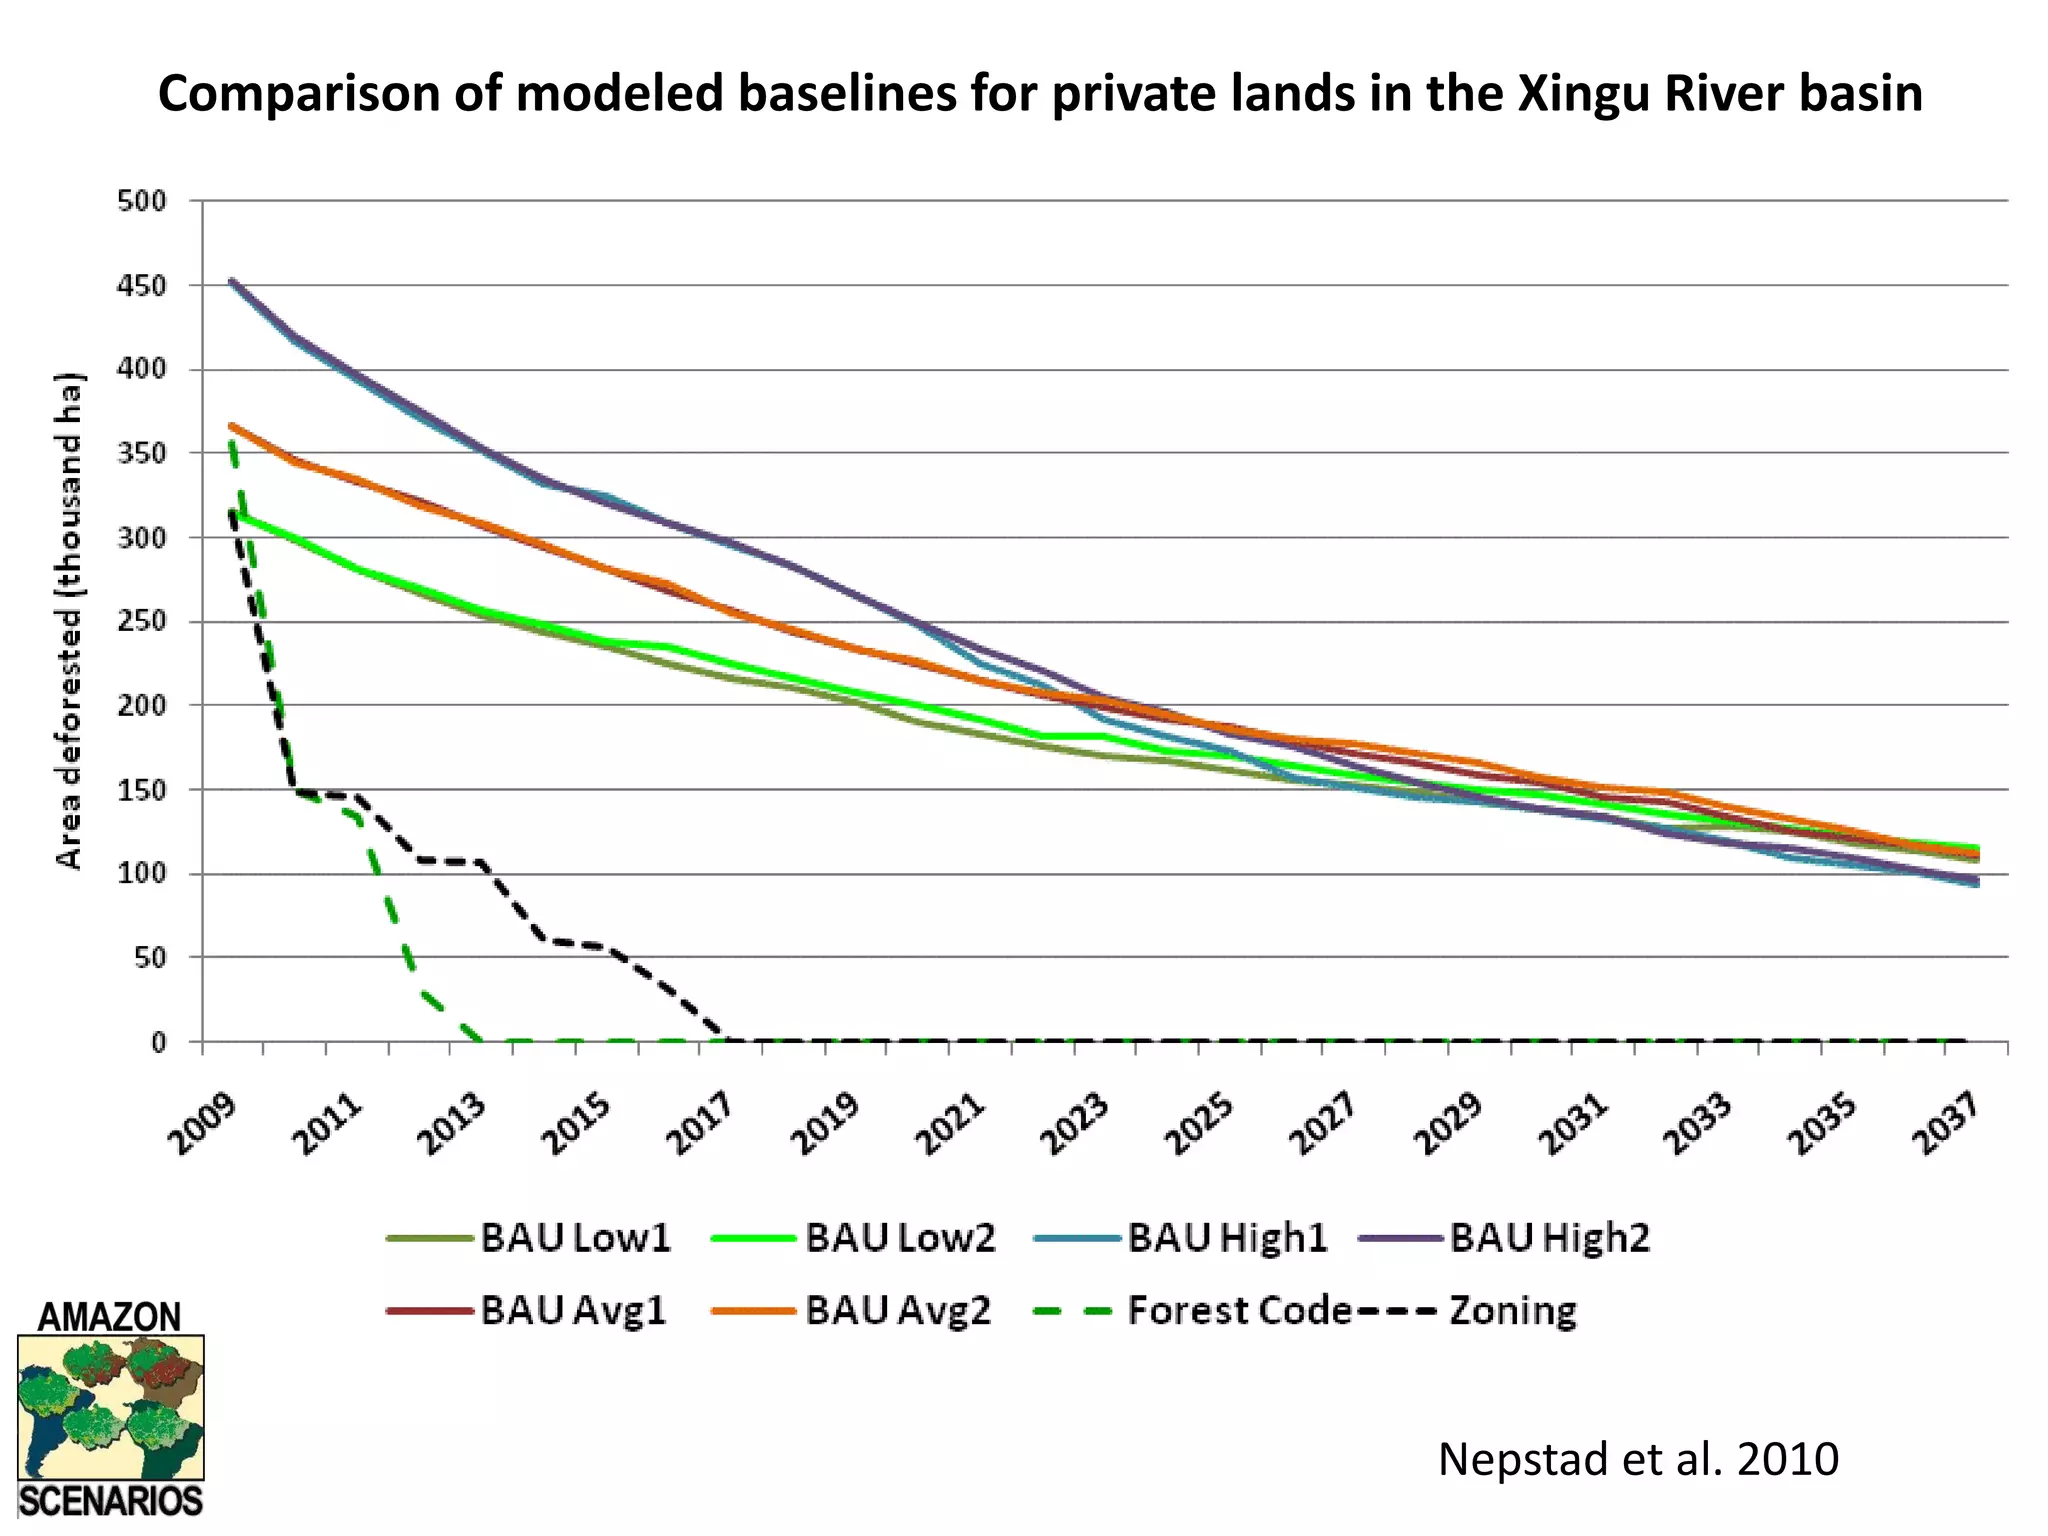
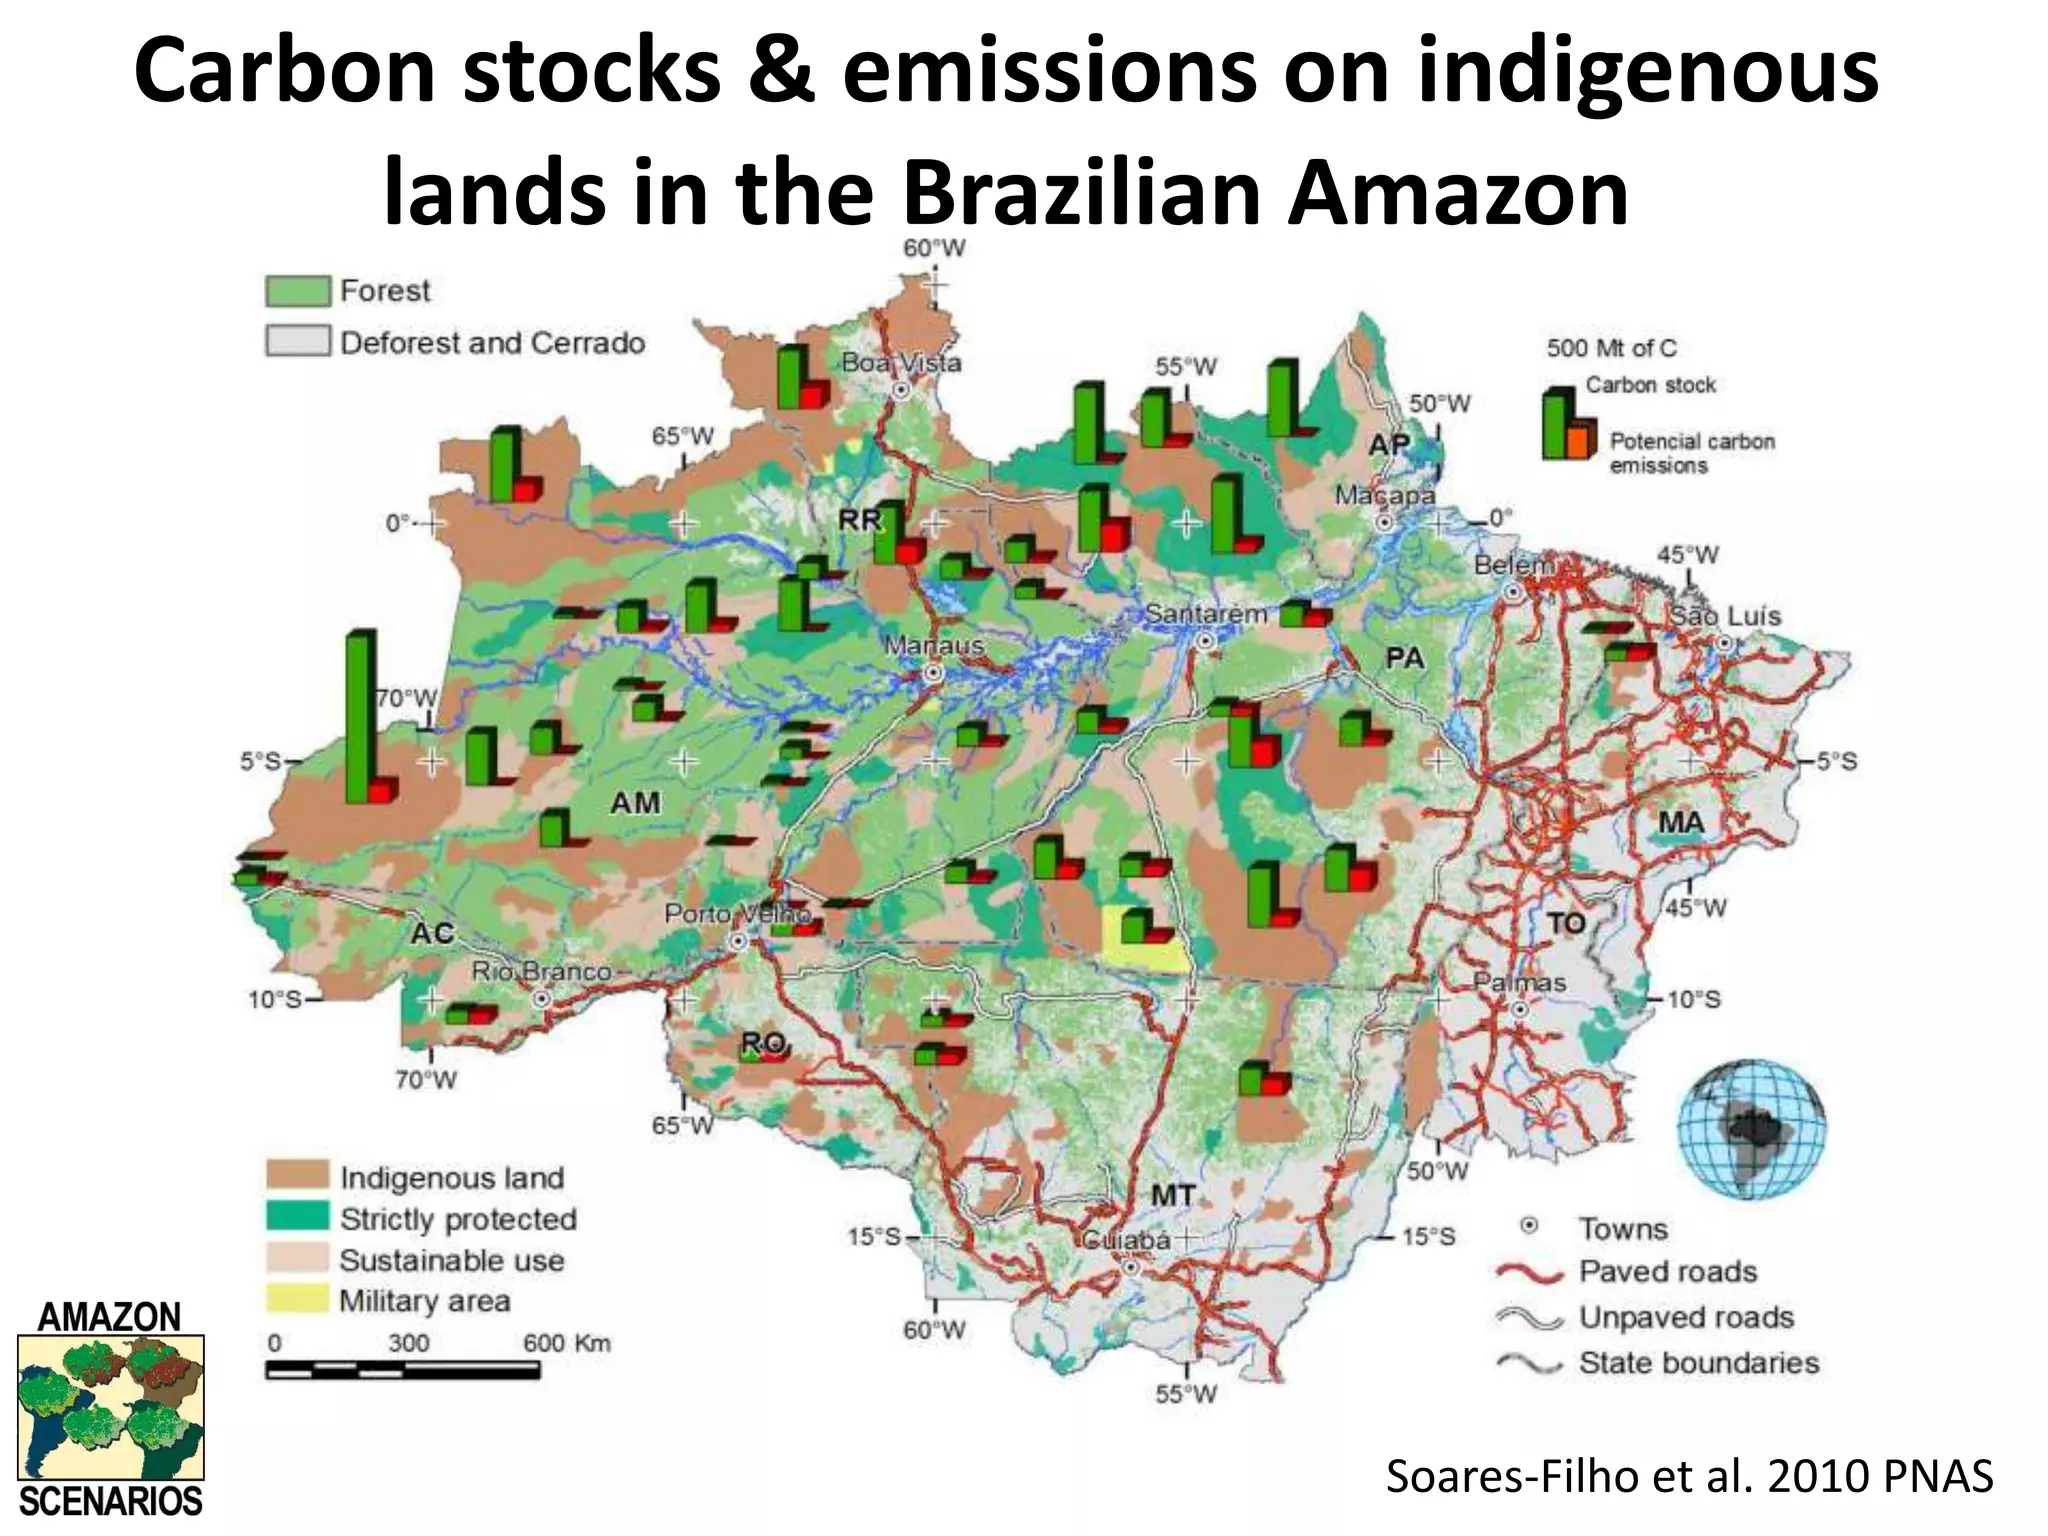


![Vibe Coding vs. Spec-Driven Development [Free Meetup]](https://cdn.slidesharecdn.com/ss_thumbnails/vibecodingvsspecdrivendevelopment-251209105622-43f455e7-thumbnail.jpg?width=640&height=640&fit=bounds)


