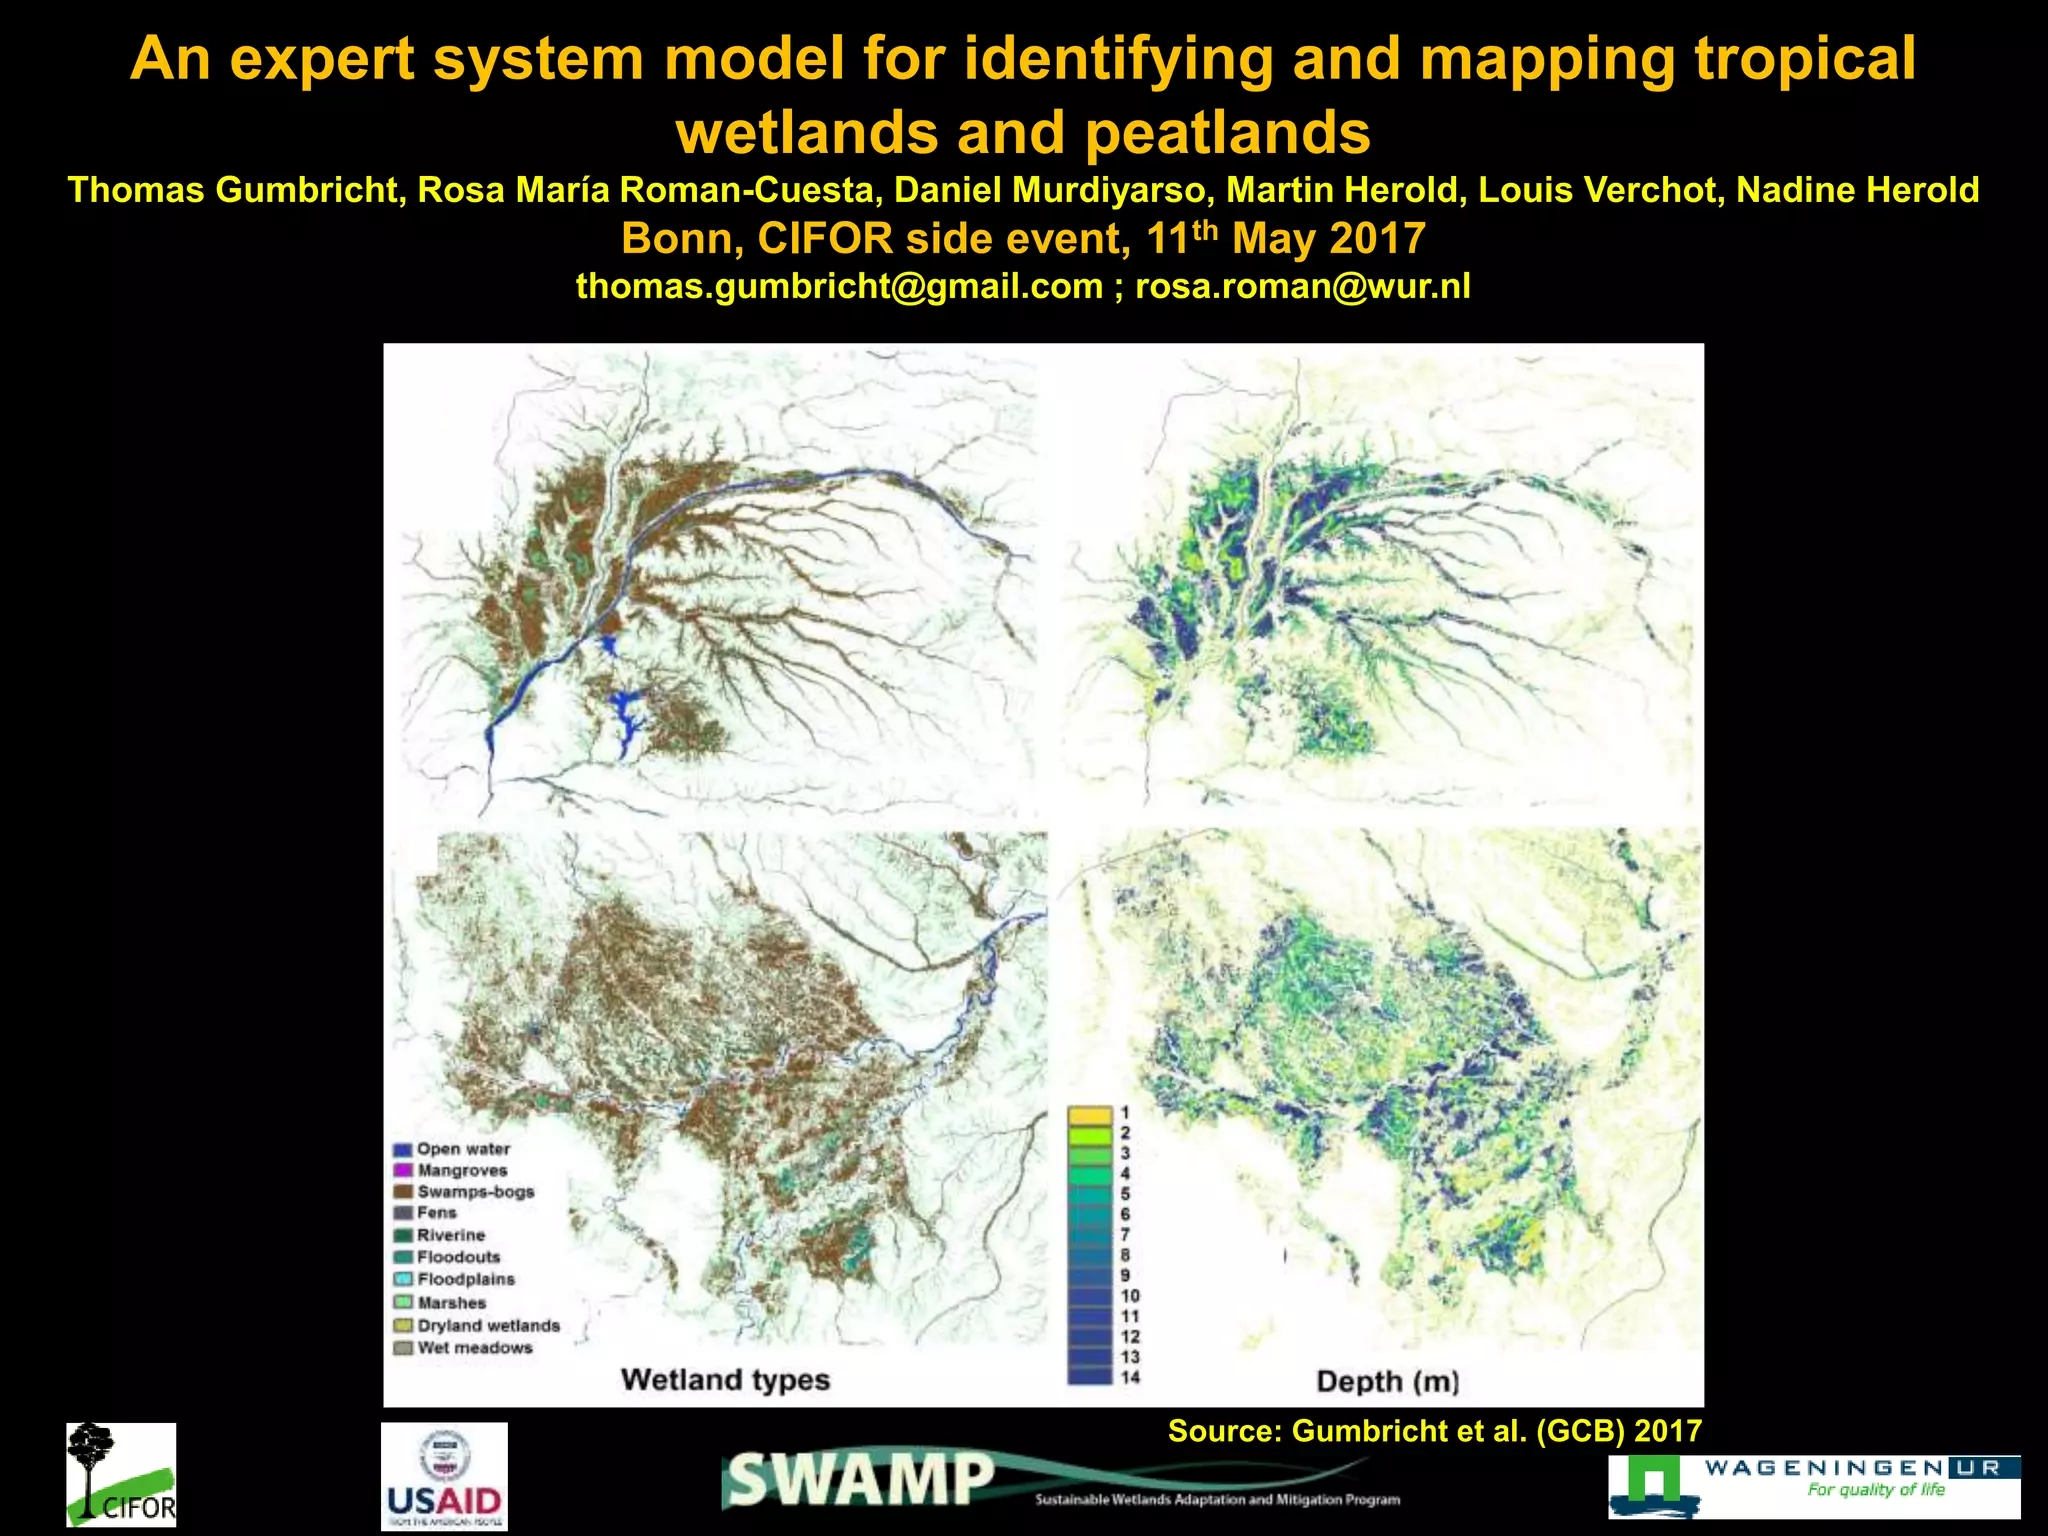
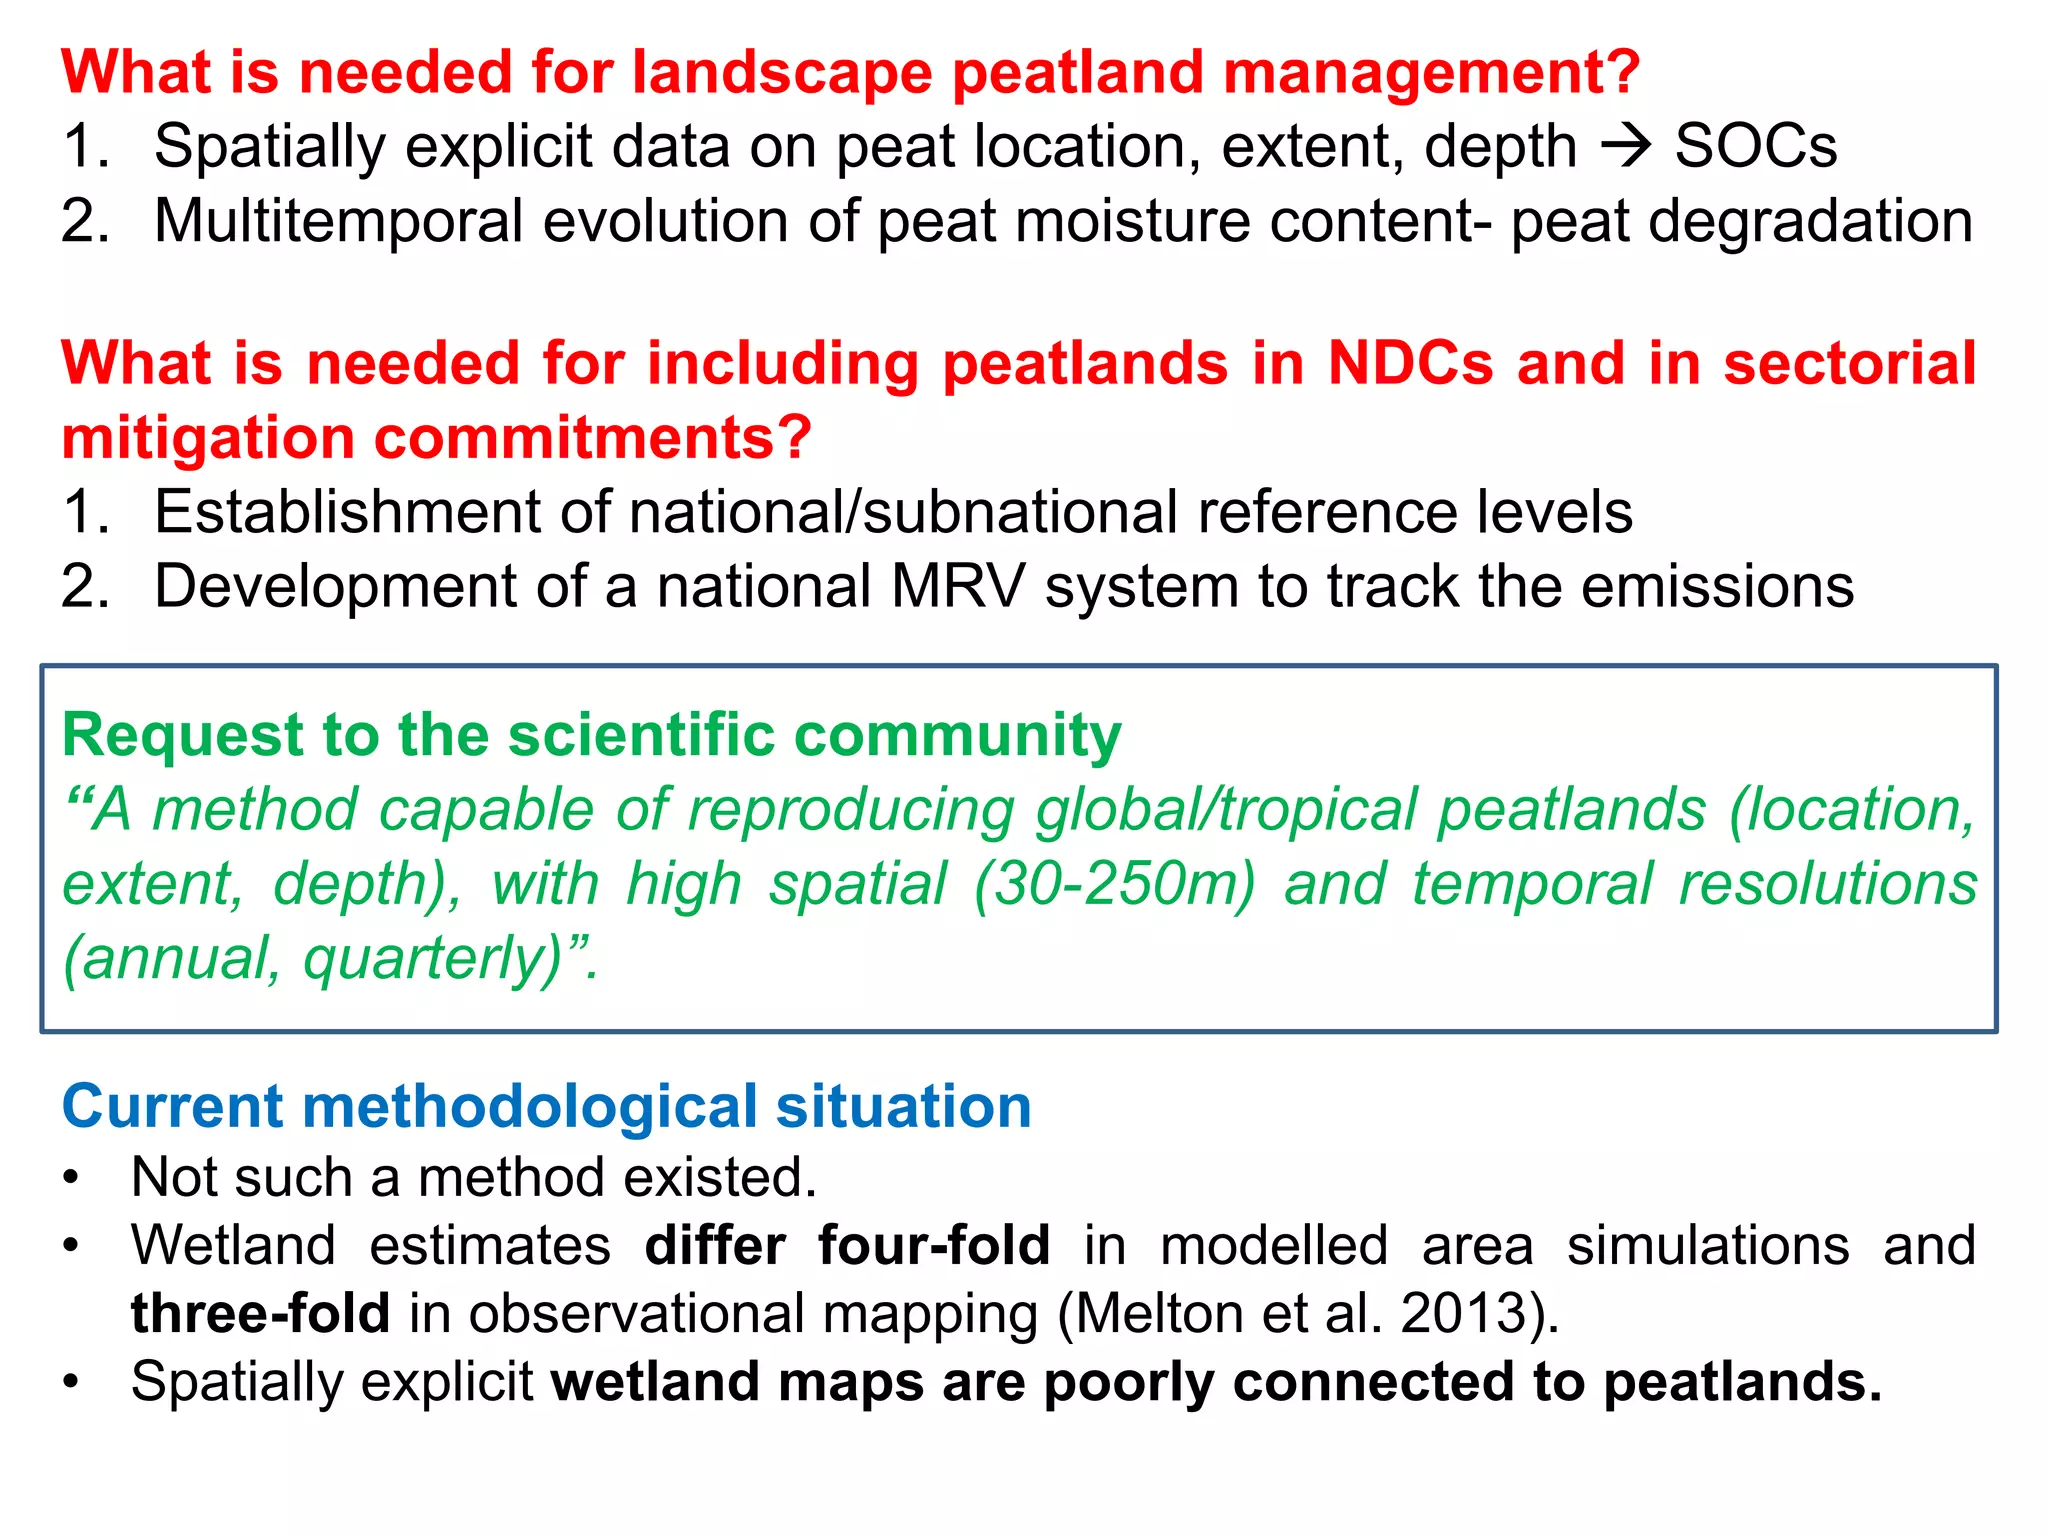
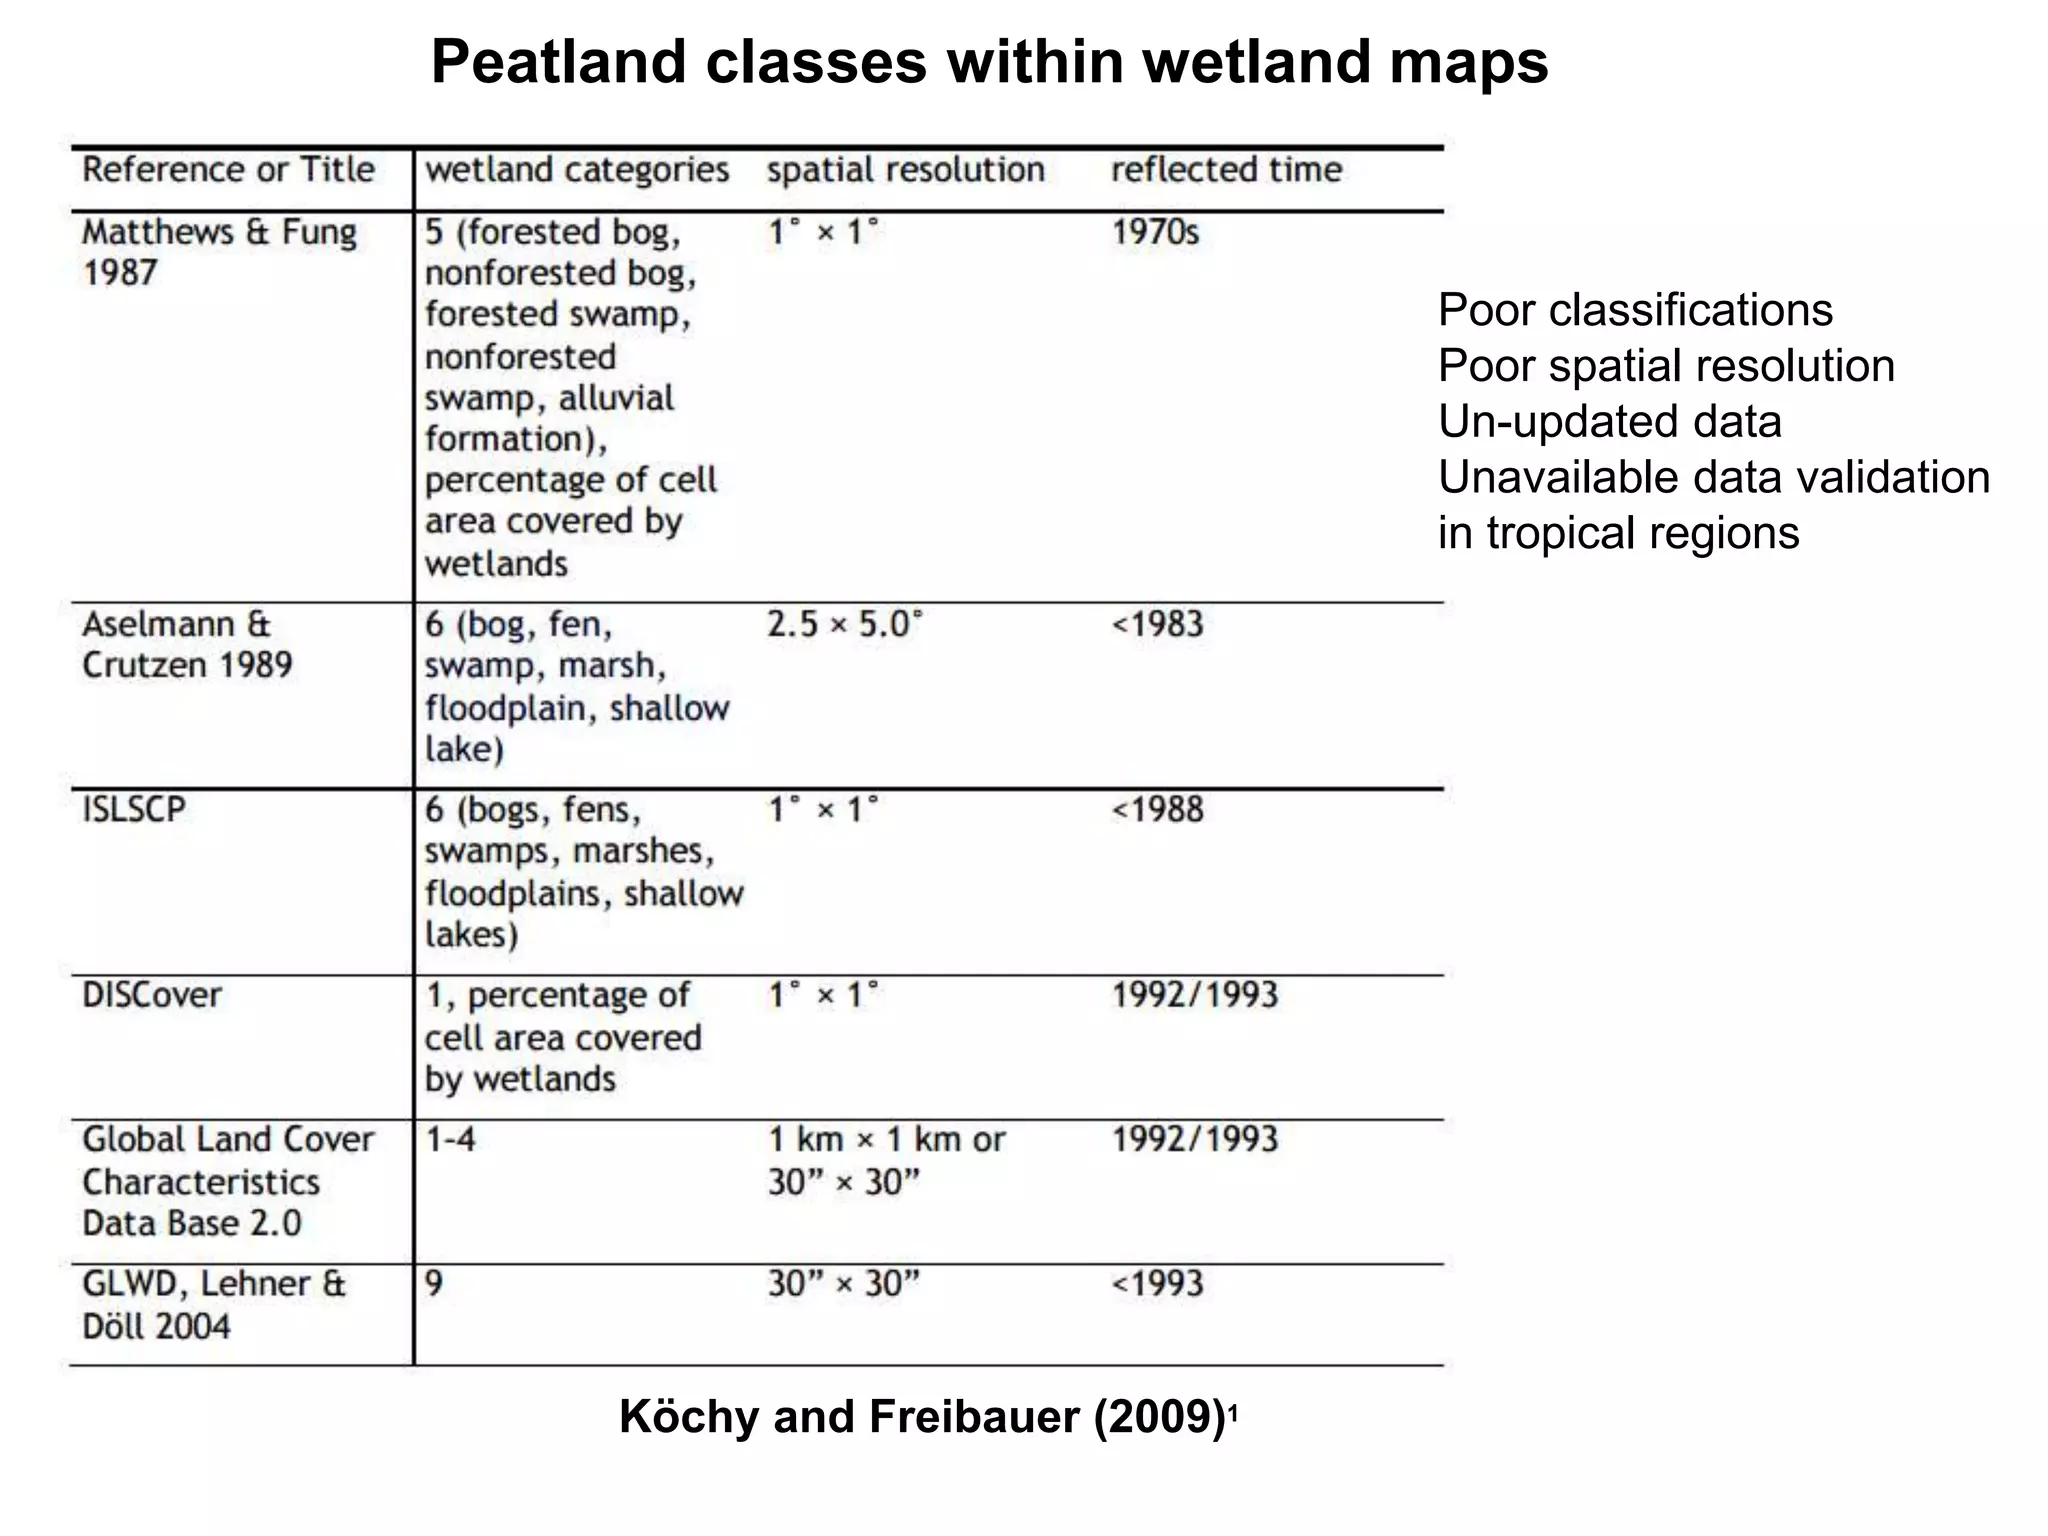
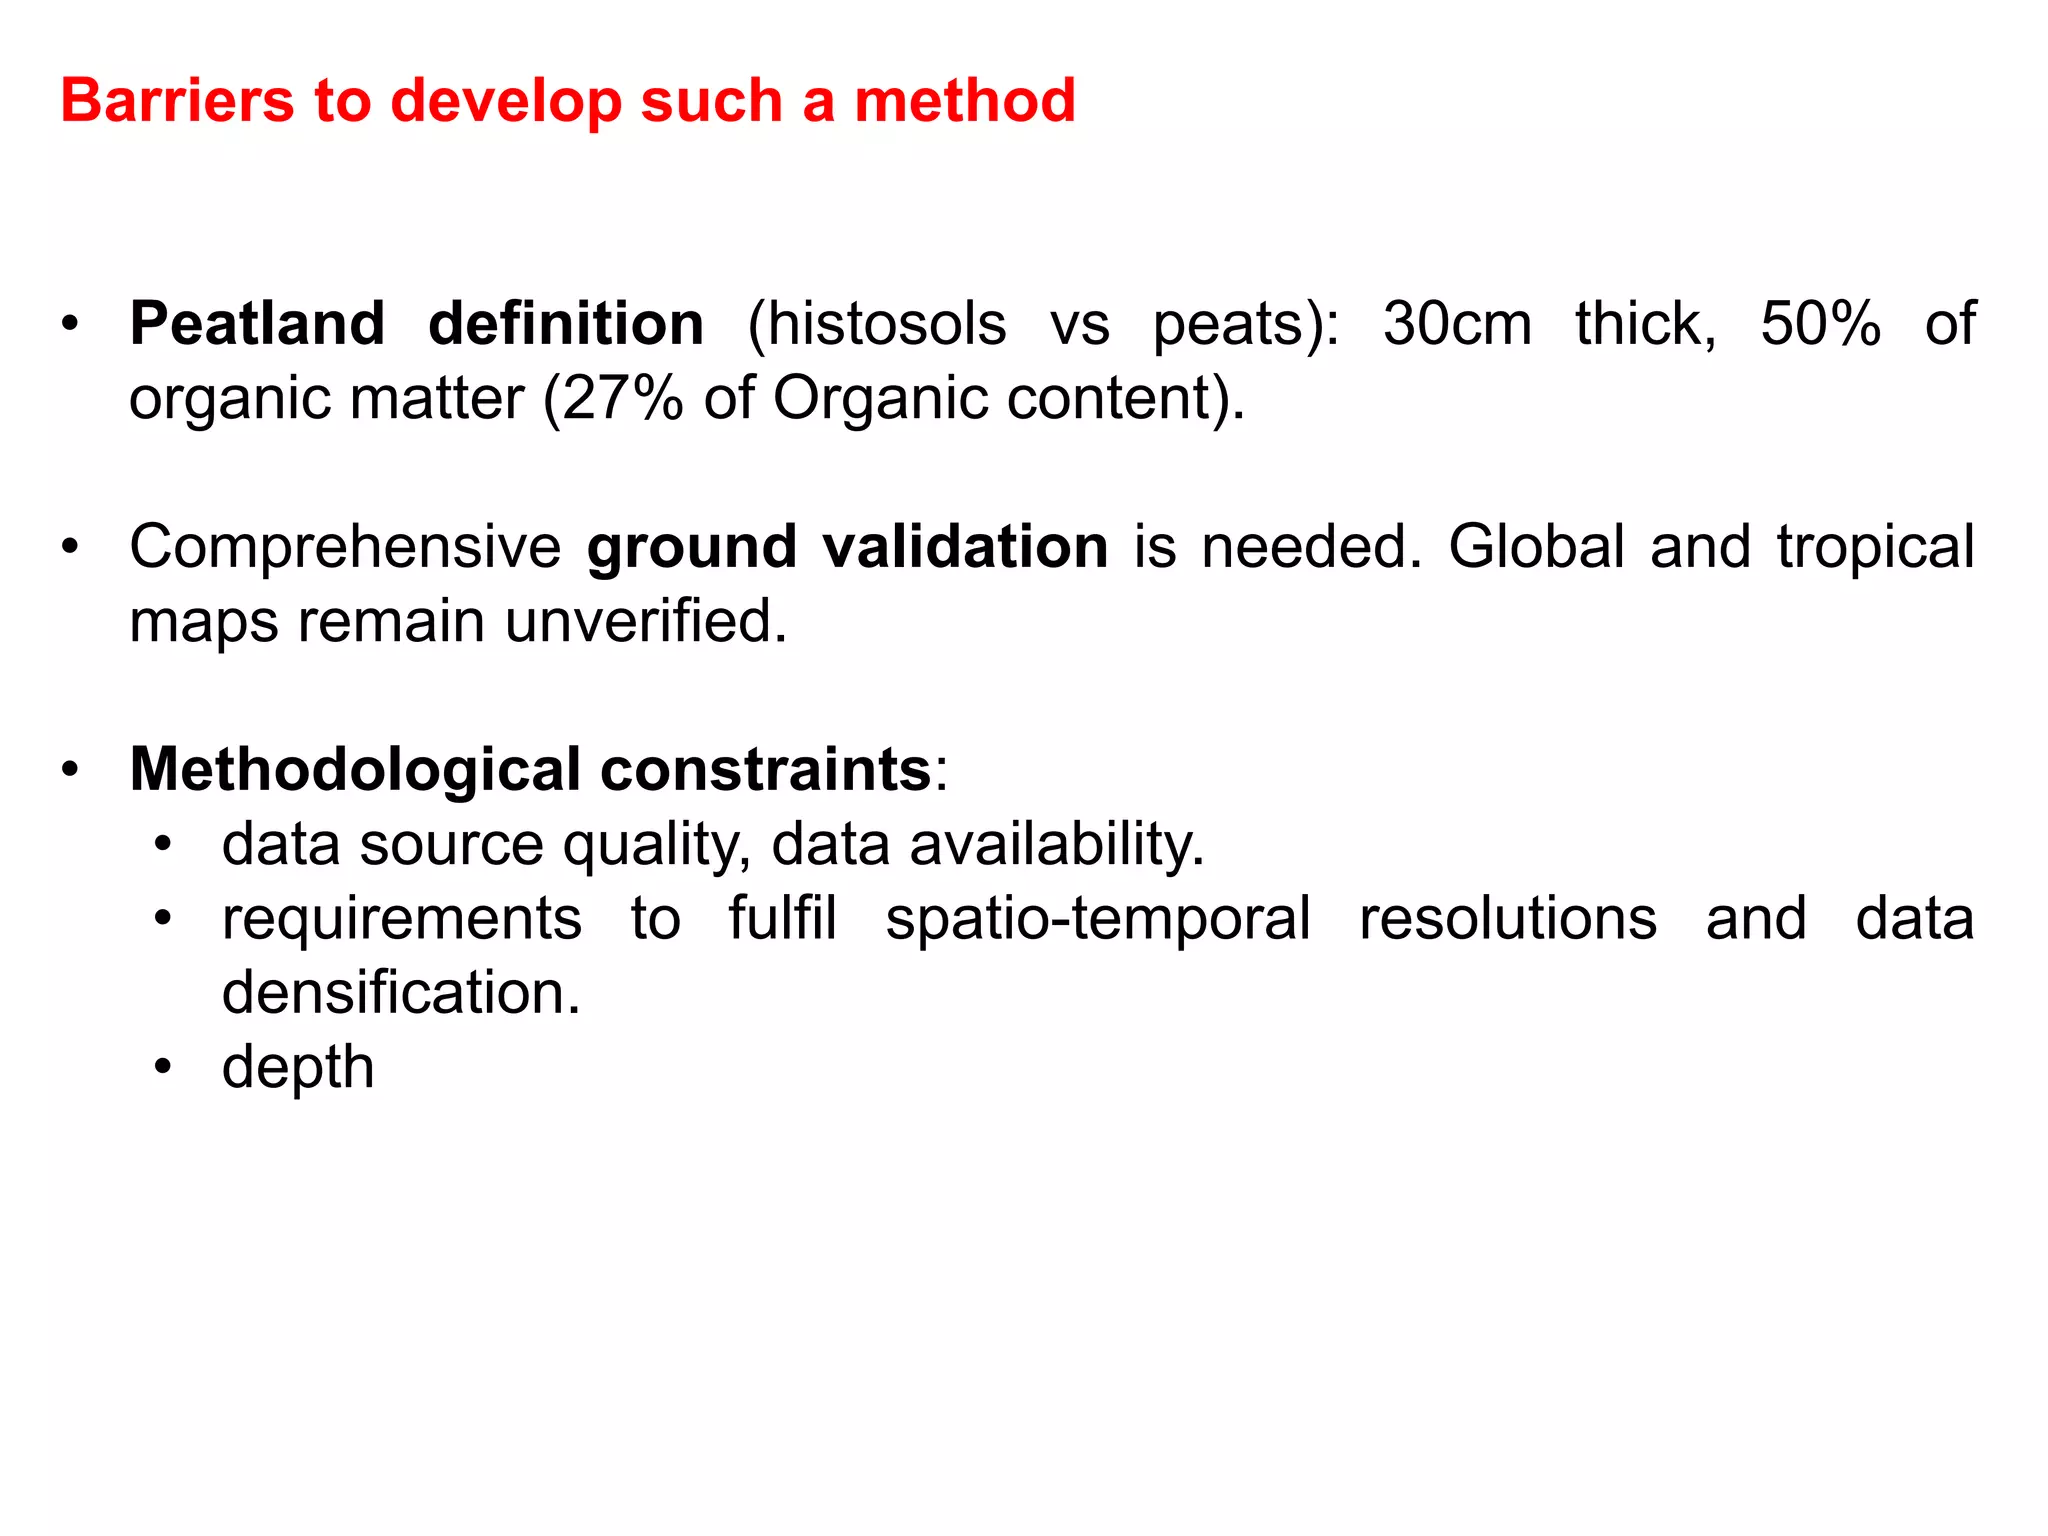
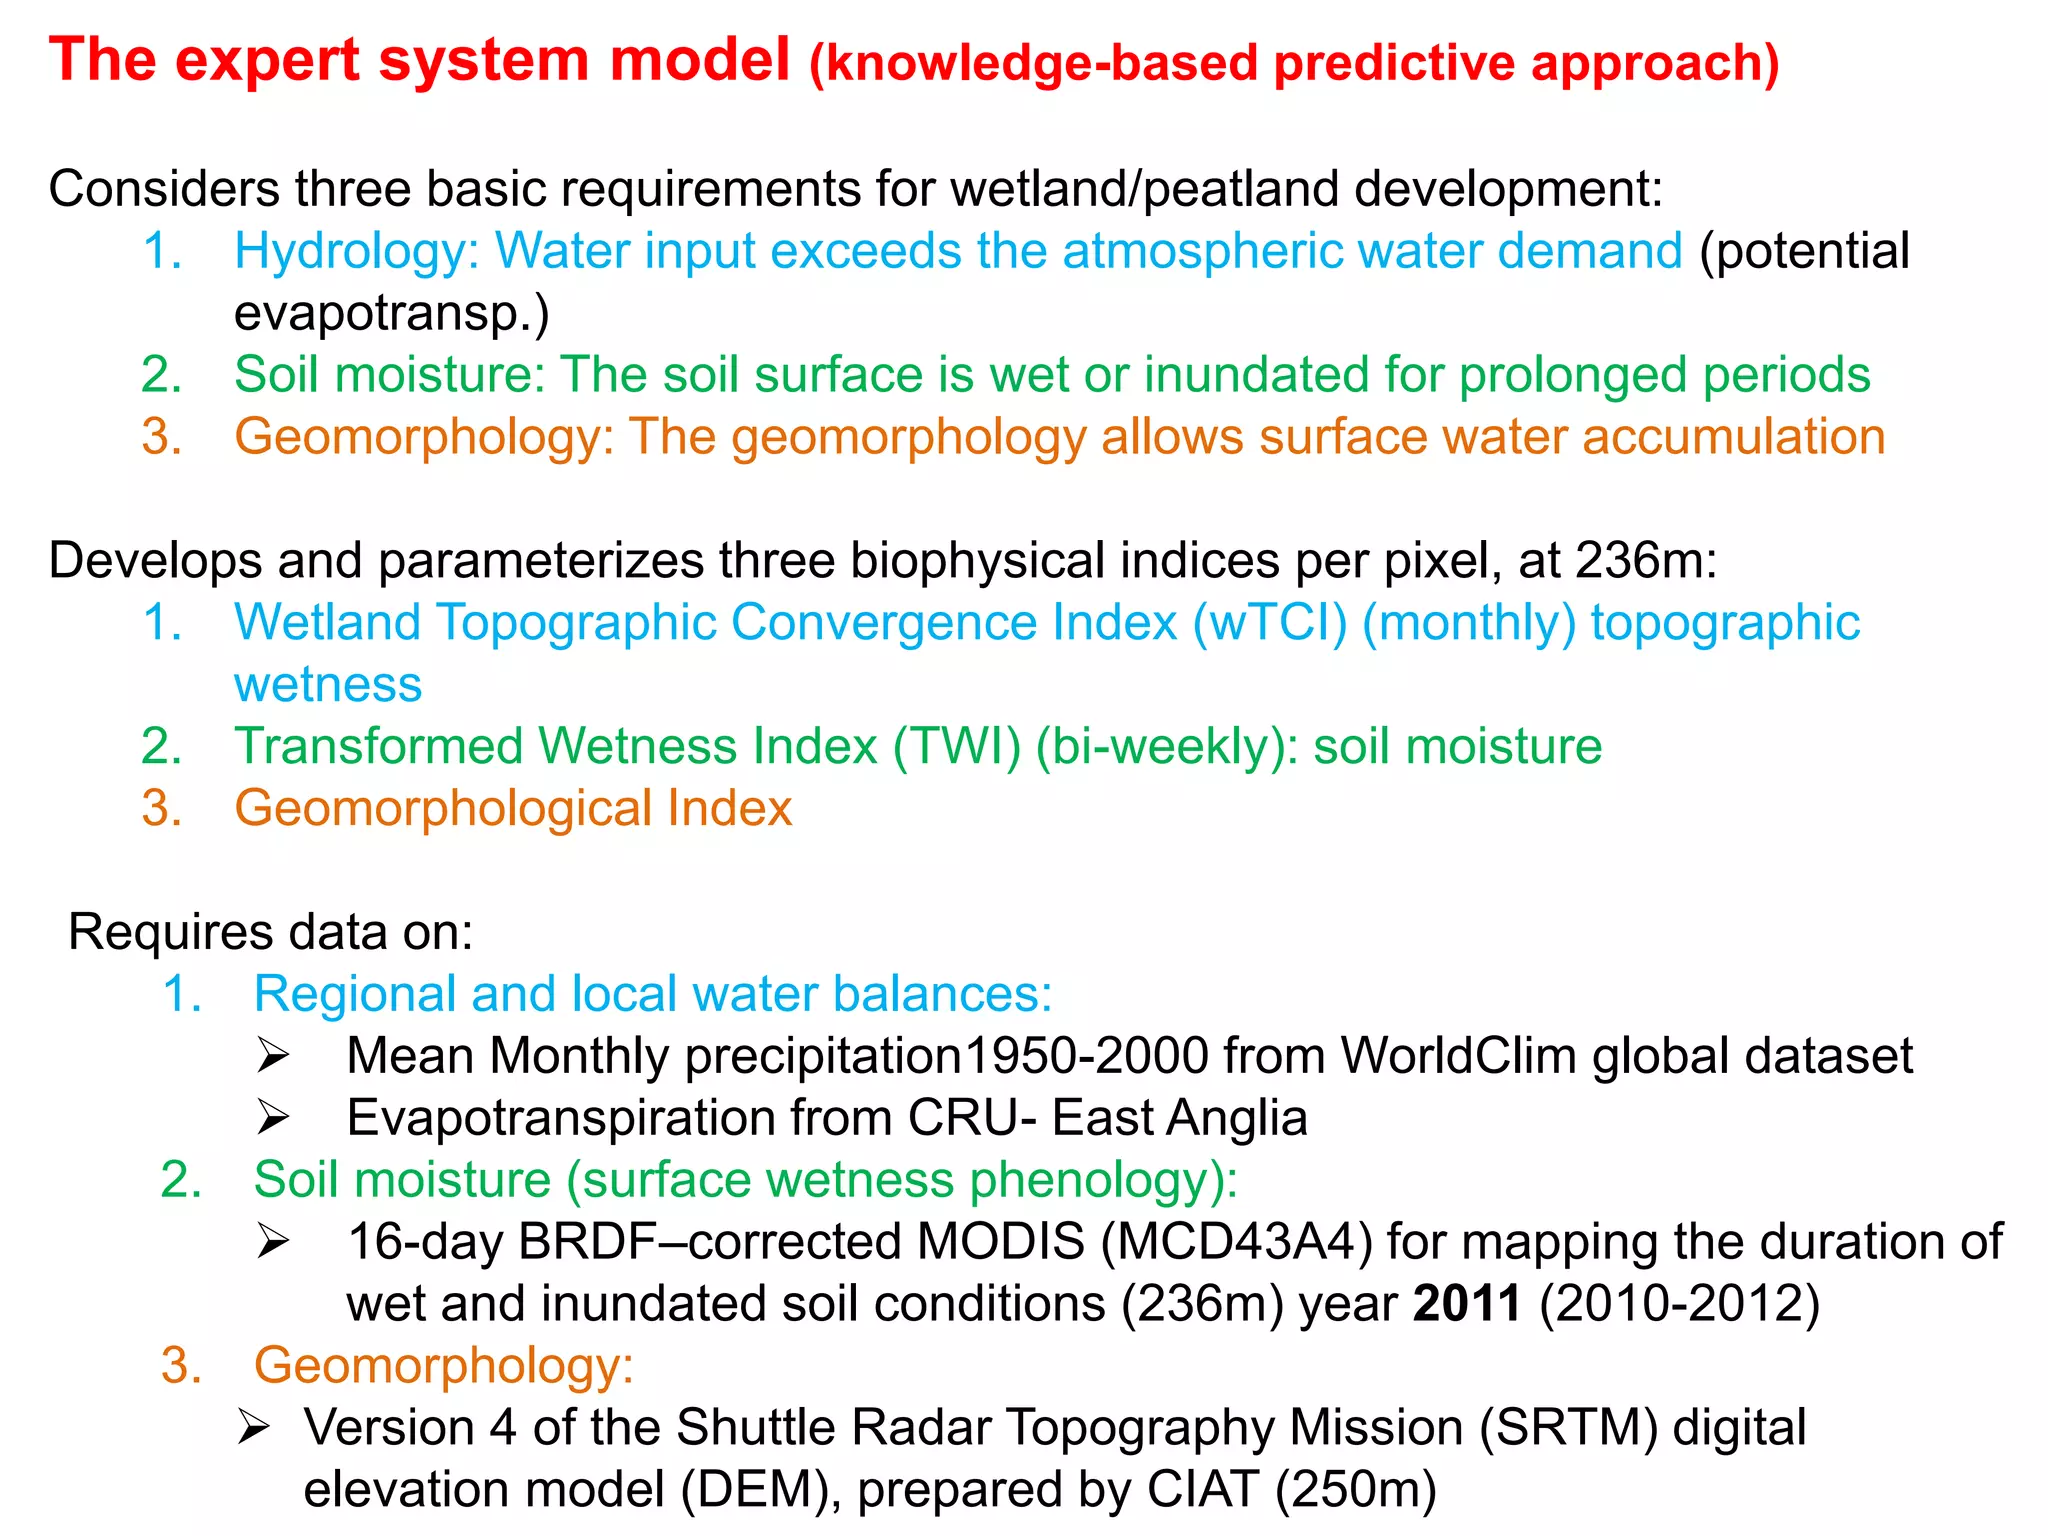
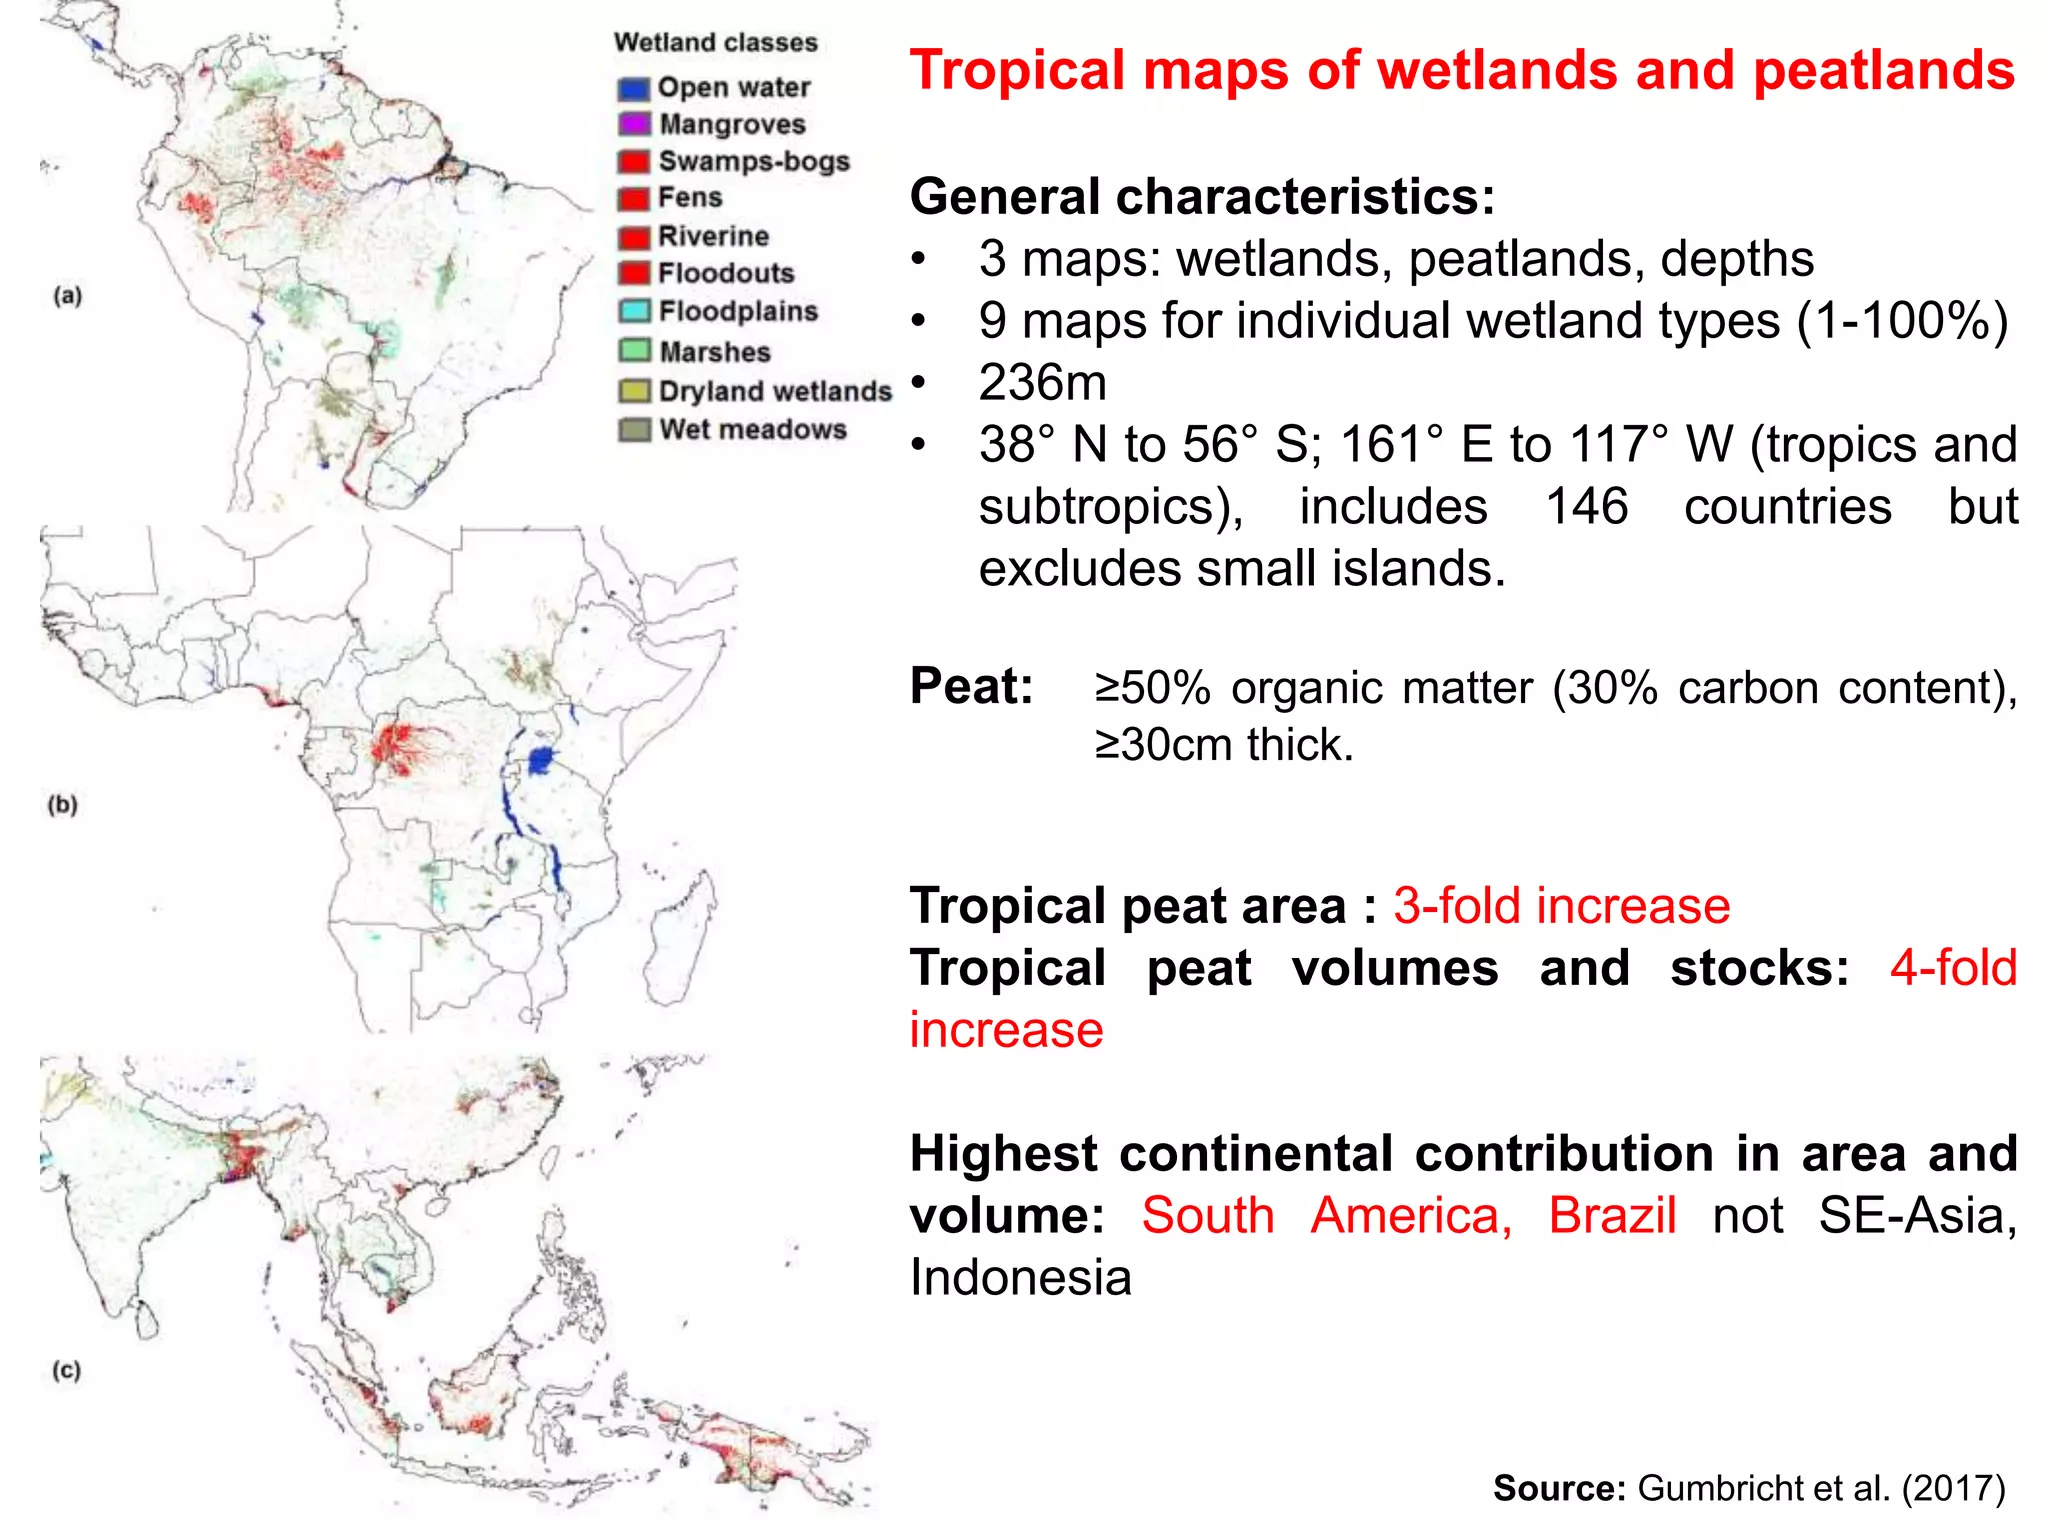
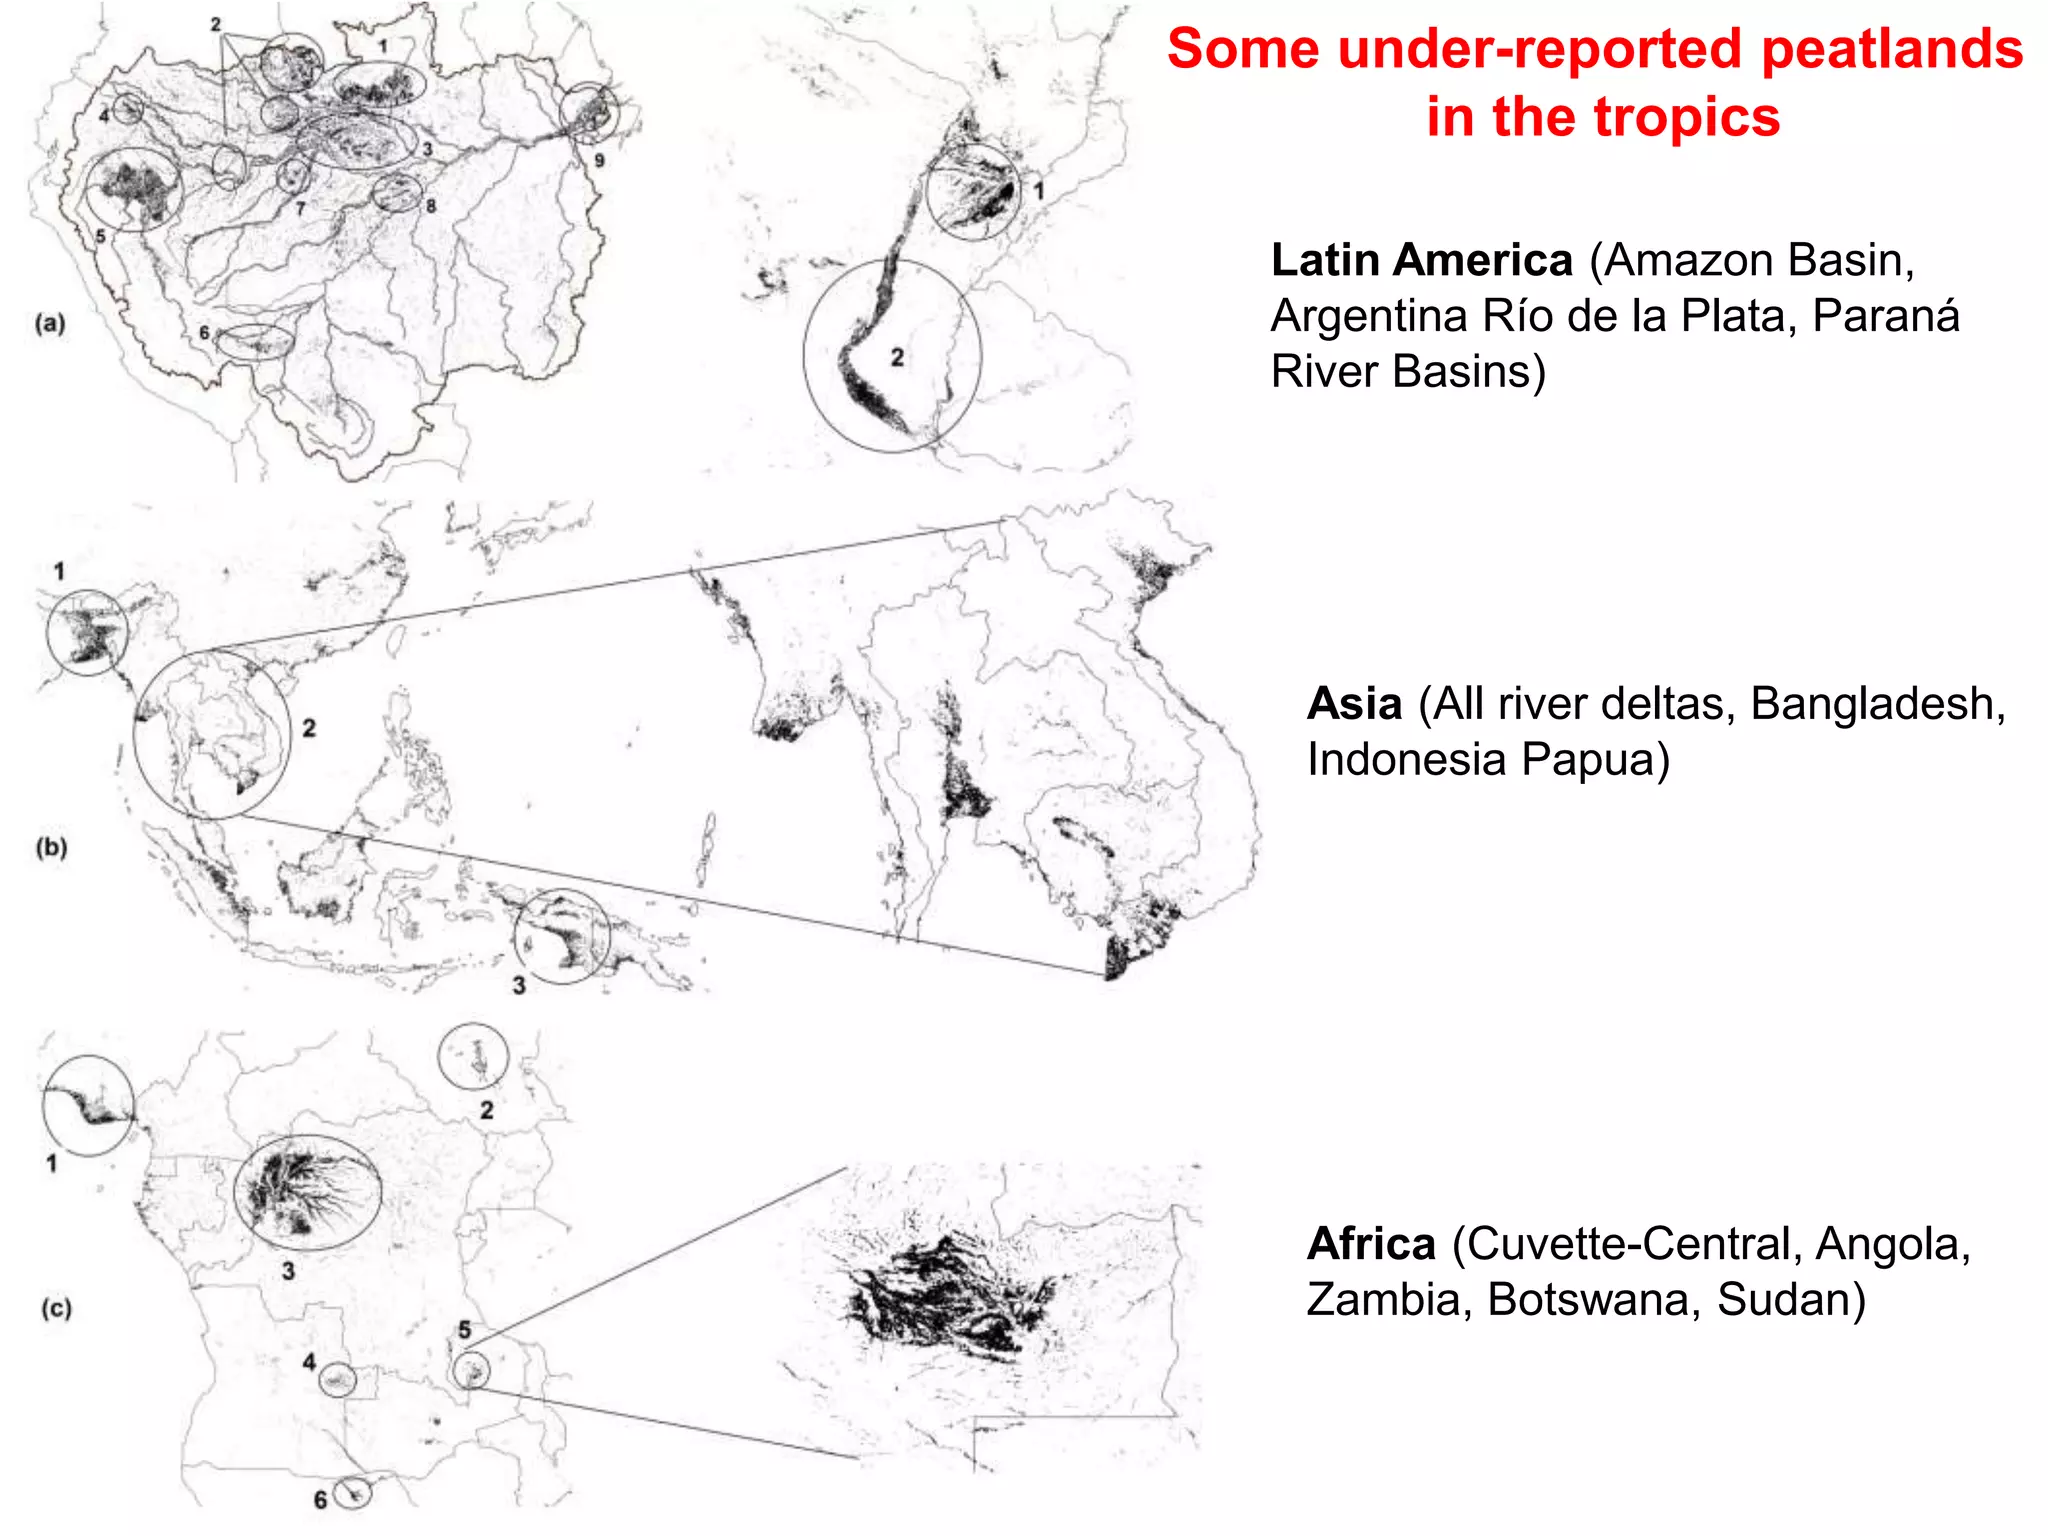
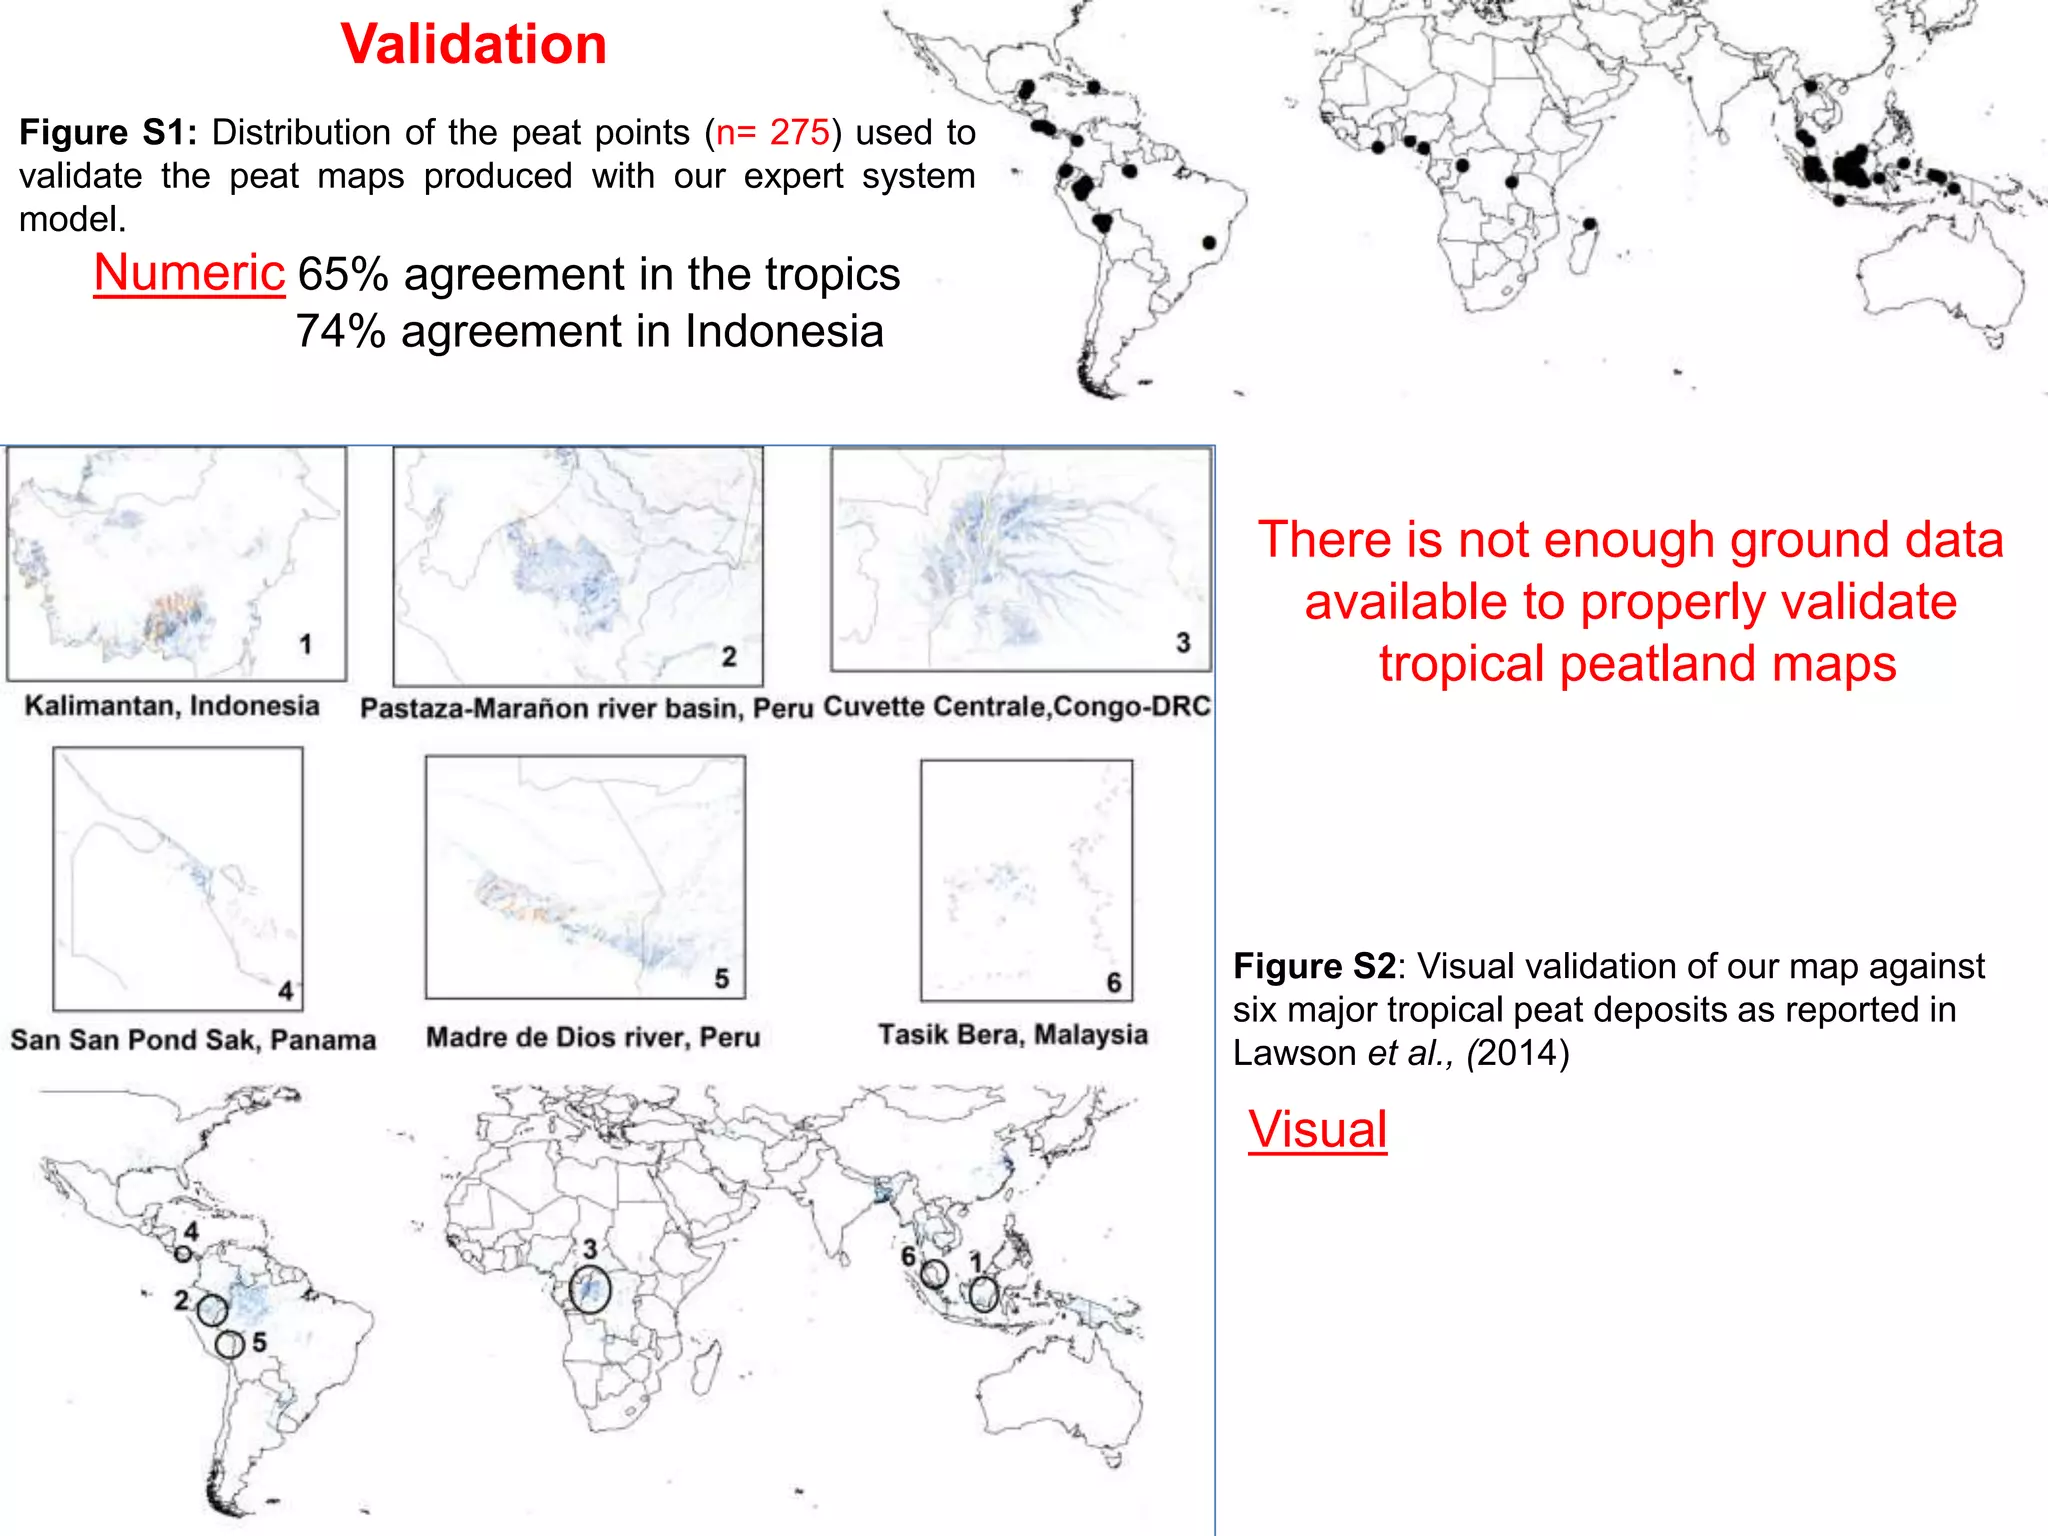
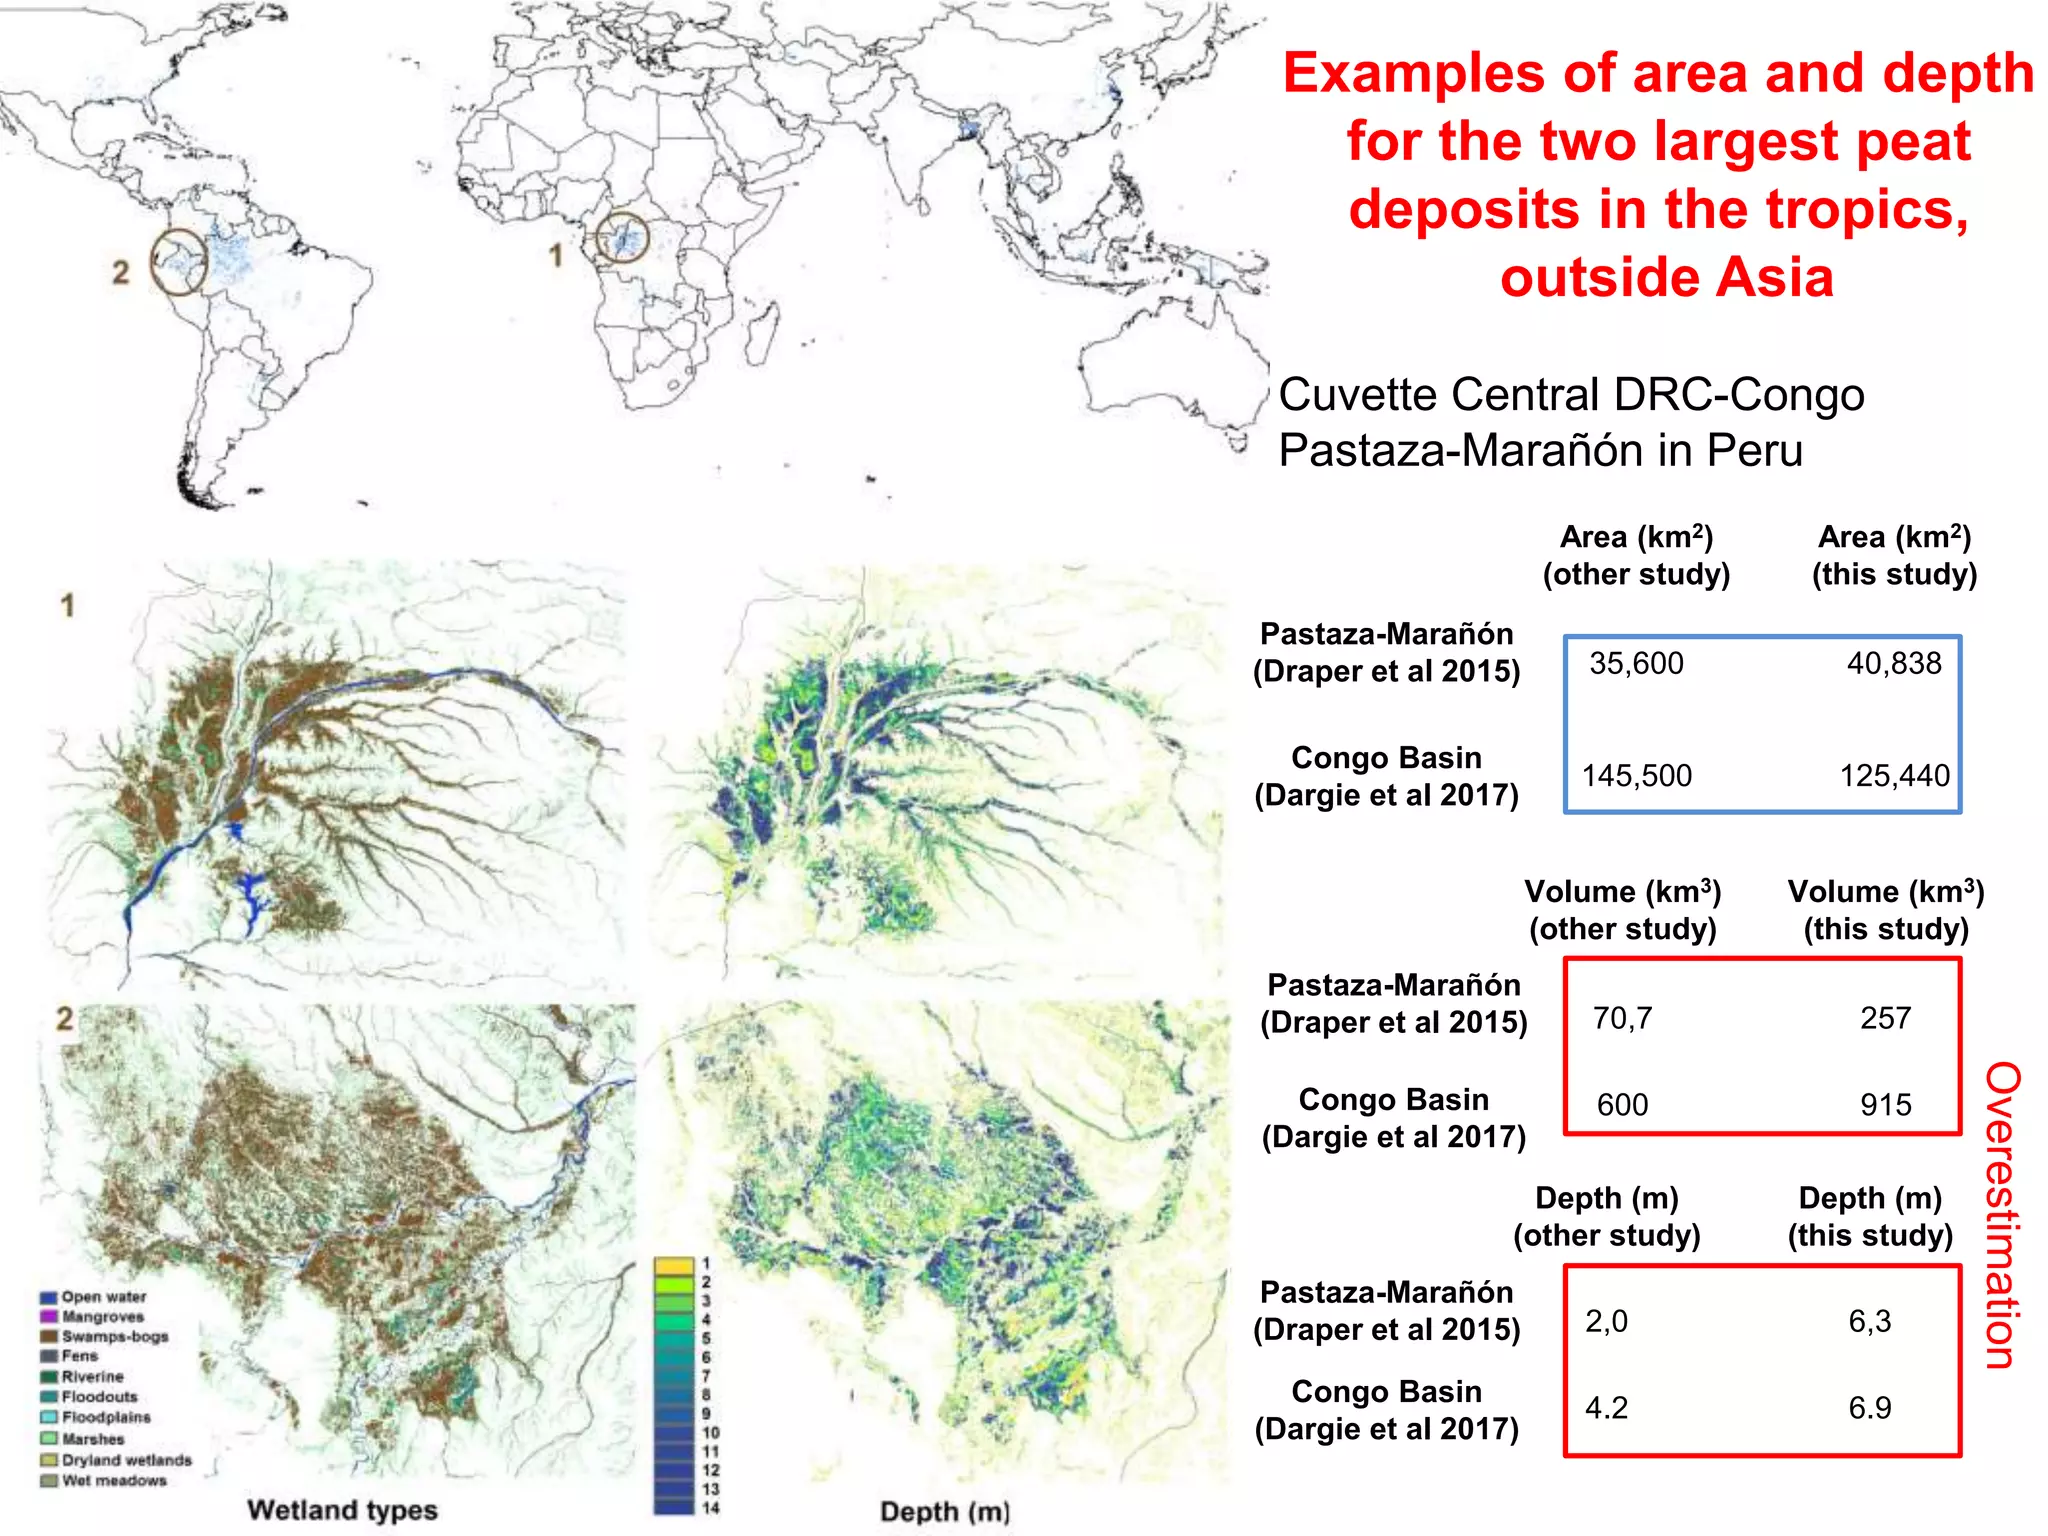
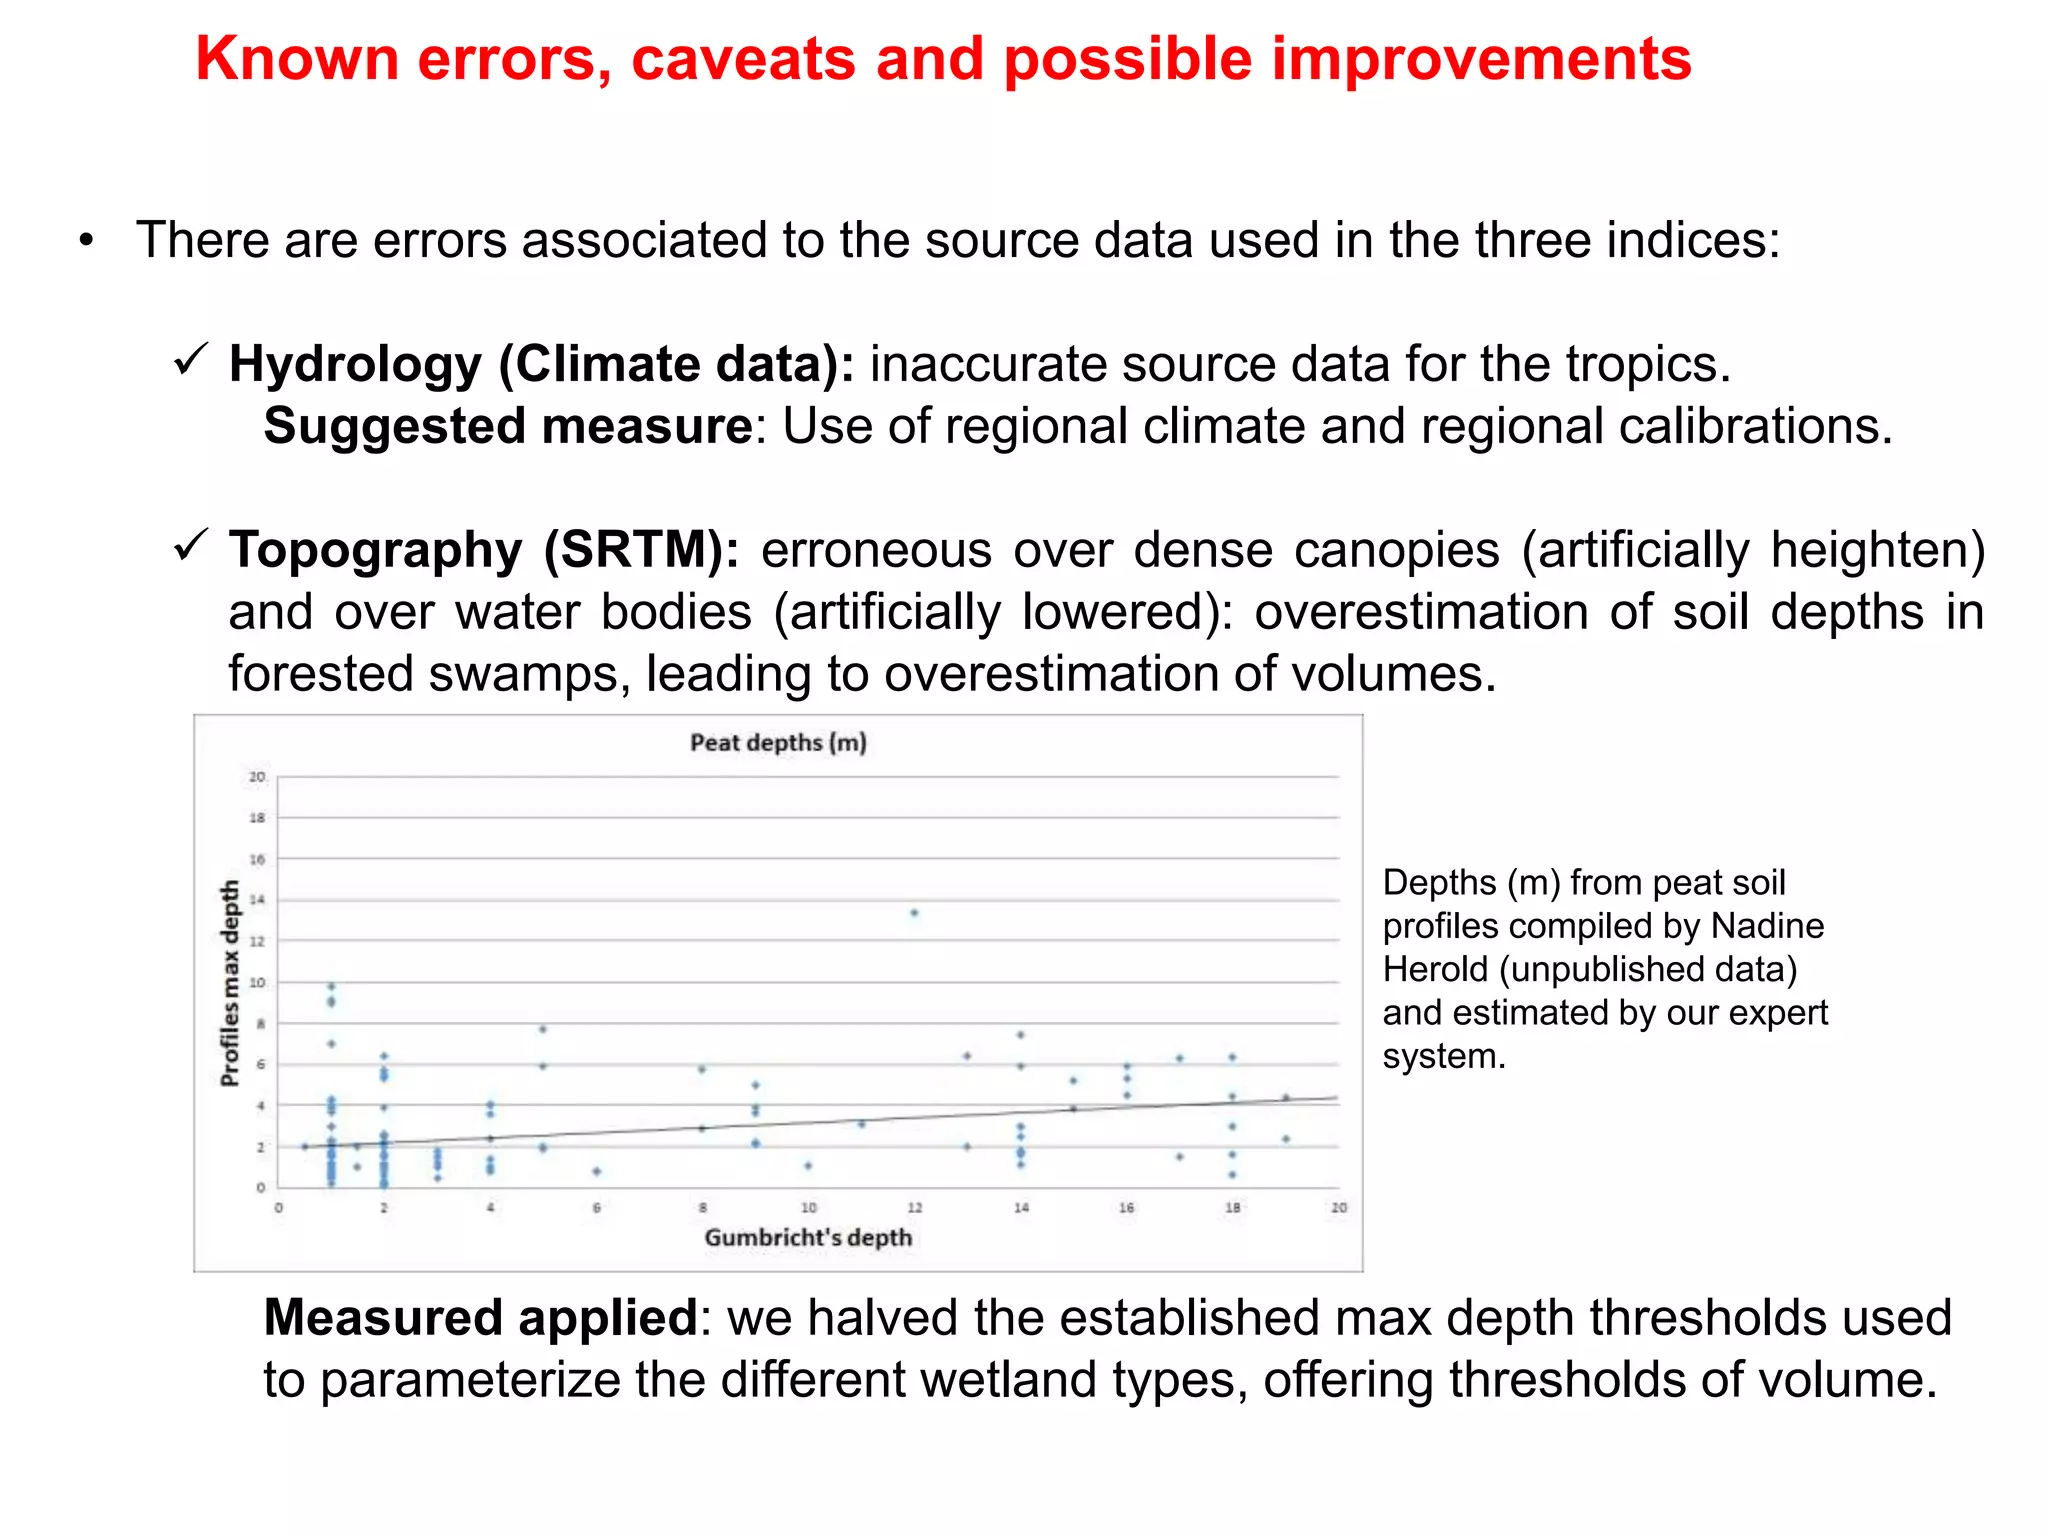
An expert system model for identifying and mapping tropical
wetlands and peatlands
Thomas Gumbricht, Rosa María Roman-Cuesta, Daniel Murdiyarso, Martin Herold, Louis Verchot, Nadine Herold
Bonn, CIFOR side event, 11th May 2017
thomas.gumbricht@gmail.com ; rosa.roman@wur.nl
Source: Gumbricht et al. (GCB) 2017
Dr. Thomas Gumbricht:
Karttur AB, Stockholm, Sweden
thomas.gumbricht@gmail.com
More methodological information and maps available at: http://www.karttur.com/
Data download at SWAMP website: http://www.cifor.org/global-wetlands/
Publications
• Gumbricht et al. (2002) Remote sensing to detect sub-surface peat firs and peat fire scars in
the Okavango Delta, Botswana. South African Journal of Science, 98,351-358.
• Gumbricht T (2015) Hybrid mapping of pantropical wetlands from optical satellite images,
hydrology and geomorphology. In: Remote Sensing of Wetlands: Applications and Advances.
(eds Ralph W. Tiner, Megan W. Lang, Victor V. Klemas), pp 433-452. CRP Press. Taylor and
Francis Group. Boca Raton, Florida.
• Gumbricht T (2016) Soil Moisture Dynamics Estimated from Modis Time Series Images. In:
Multitemporal Remote Sensing. Remote Sensing and Digital Image Processing (ed Y Ban).
Springer International Publishing, Cham, Switzerland. DOI 10.1007/978-3-319-47037-5_12.
• Gumbricht et al. (2017) An expert system model for mapping tropical wetlands and
peatlands reveals South America as the largest Contributor. Global Change Biology. DOI:
10.1111/gcb.13689
What is needed for landscape peatland management?
1. Spatially explicit data on peat location, extent, depth  SOCs
2. Multitemporal evolution of peat moisture content- peat degradation
What is needed for including peatlands in NDCs and in sectorial
mitigation commitments?
1. Establishment of national/subnational reference levels
2. Development of a national MRV system to track the emissions
Request to the scientific community
“A method capable of reproducing global/tropical peatlands (location,
extent, depth), with high spatial (30-250m) and temporal resolutions
(annual, quarterly)”.
Current methodological situation
• Not such a method existed.
• Wetland estimates differ four-fold in modelled area simulations and
three-fold in observational mapping (Melton et al. 2013).
• Spatially explicit wetland maps are poorly connected to peatlands.
Köchy and Freibauer (2009)1
Peatland classes within wetland maps
Poor classifications
Poor spatial resolution
Un-updated data
Unavailable data validation
in tropical regions
Barriers to develop such a method
• Peatland definition (histosols vs peats): 30cm thick, 50% of
organic matter (27% of Organic content).
• Comprehensive ground validation is needed. Global and tropical
maps remain unverified.
• Methodological constraints:
• data source quality, data availability.
• requirements to fulfil spatio-temporal resolutions and data
densification.
• depth
The expert system model (knowledge-based predictive approach)
Considers three basic requirements for wetland/peatland development:
1. Hydrology: Water input exceeds the atmospheric water demand (potential
evapotransp.)
2. Soil moisture: The soil surface is wet or inundated for prolonged periods
3. Geomorphology: The geomorphology allows surface water accumulation
Develops and parameterizes three biophysical indices per pixel, at 236m:
1. Wetland Topographic Convergence Index (wTCI) (monthly) topographic
wetness
2. Transformed Wetness Index (TWI) (bi-weekly): soil moisture
3. Geomorphological Index
Requires data on:
1. Regional and local water balances:
 Mean Monthly precipitation1950-2000 from WorldClim global dataset
 Evapotranspiration from CRU- East Anglia
2. Soil moisture (surface wetness phenology):
 16-day BRDF–corrected MODIS (MCD43A4) for mapping the duration of
wet and inundated soil conditions (236m) year 2011 (2010-2012)
3. Geomorphology:
 Version 4 of the Shuttle Radar Topography Mission (SRTM) digital
elevation model (DEM), prepared by CIAT (250m)
Tropical maps of wetlands and peatlands
General characteristics:
• 3 maps: wetlands, peatlands, depths
• 9 maps for individual wetland types (1-100%)
• 236m
• 38° N to 56° S; 161° E to 117° W (tropics and
subtropics), includes 146 countries but
excludes small islands.
Peat: ≥50% organic matter (30% carbon content),
≥30cm thick.
Tropical peat area : 3-fold increase
Tropical peat volumes and stocks: 4-fold
increase
Highest continental contribution in area and
volume: South America, Brazil not SE-Asia,
Indonesia
Source: Gumbricht et al. (2017)
Some under-reported peatlands
in the tropics
Latin America (Amazon Basin,
Argentina Río de la Plata, Paraná
River Basins)
Asia (All river deltas, Bangladesh,
Indonesia Papua)
Africa (Cuvette-Central, Angola,
Zambia, Botswana, Sudan)
Figure S2: Visual validation of our map against
six major tropical peat deposits as reported in
Lawson et al., (2014)
Figure S1: Distribution of the peat points (n= 275) used to
validate the peat maps produced with our expert system
model.
Numeric 65% agreement in the tropics
74% agreement in Indonesia
Validation
Visual
There is not enough ground data
available to properly validate
tropical peatland maps
Examples of area and depth
for the two largest peat
deposits in the tropics,
outside Asia
Cuvette Central DRC-Congo
Pastaza-Marañón in Peru
Area (km2)
(other study)
Area (km2)
(this study)
35,600 40,838
145,500 125,440
Volume (km3)
(other study)
Volume (km3)
(this study)
70,7 257
600 915
Depth (m)
(other study)
Depth (m)
(this study)
2,0 6,3
4.2 6.9
Pastaza-Marañón
(Draper et al 2015)
Congo Basin
(Dargie et al 2017)
Pastaza-Marañón
(Draper et al 2015)
Congo Basin
(Dargie et al 2017)
Pastaza-Marañón
(Draper et al 2015)
Congo Basin
(Dargie et al 2017)
Overestimation
Known errors, caveats and possible improvements
• There are errors associated to the source data used in the three indices:
 Hydrology (Climate data): inaccurate source data for the tropics.
Suggested measure: Use of regional climate and regional calibrations.
 Topography (SRTM): erroneous over dense canopies (artificially heighten)
and over water bodies (artificially lowered): overestimation of soil depths in
forested swamps, leading to overestimation of volumes.
Measured applied: we halved the established max depth thresholds used
to parameterize the different wetland types, offering thresholds of volume.
Depths (m) from peat soil
profiles compiled by Nadine
Herold (unpublished data)
and estimated by our expert
system.
Known errors, caveats and possible improvements
 Soil moisture (MODIS): optical imagery misses floods and inundated soil
conditions during cloud-persistent wet seasons, and overestimates moisture
in areas with strong forest shadows (needle-leaf forests in particular).
Underestimation of wetlands also occur in areas with dense grasses and
papyrus.
Suggested measure: adjustment of TWI by canopy cover, or calibration of
TWI using microwave data.
 Soil moisture (MODIS): temporal scale limited to 2011 (2010-2012) may
have captured anomalous wet La Niña conditions leading to overestimations
of peatland area.
Suggested measure: Adopt a larger MODIS period for analysing soil
moisture.
• Lack of ground data for organic soils, as well as unstandardized definitions of
wetlands and peatland jeopardizes map validation.
Questions?
Next steps for peatland monitoring
• Regional parameterizations in the tropics to improve the accuracy of the
estimates (i.e. South America, Asia, Africa). The expert system currently offers
one model and one tropical parameterization (although different for each
wetland).
• Inclusion of montane peatlands: new regional parameterization
• Inclusion of boreal peatlands: new regional parameterization
• Peatland degradation monitoring: the expert system can be used to monitor
wetland and peatland degradation through changes in soil moisture.
• Peatland area forecasting under changing climate: the expert system can be
used to forecast wetland areas under future climatic conditions.

An expert system model for identifying and mapping tropical wetlands and peatlands

  • 1.
    An expert systemmodel for identifying and mapping tropical wetlands and peatlands Thomas Gumbricht, Rosa María Roman-Cuesta, Daniel Murdiyarso, Martin Herold, Louis Verchot, Nadine Herold Bonn, CIFOR side event, 11th May 2017 thomas.gumbricht@gmail.com ; rosa.roman@wur.nl Source: Gumbricht et al. (GCB) 2017
  • 2.
    Dr. Thomas Gumbricht: KartturAB, Stockholm, Sweden thomas.gumbricht@gmail.com More methodological information and maps available at: http://www.karttur.com/ Data download at SWAMP website: http://www.cifor.org/global-wetlands/ Publications • Gumbricht et al. (2002) Remote sensing to detect sub-surface peat firs and peat fire scars in the Okavango Delta, Botswana. South African Journal of Science, 98,351-358. • Gumbricht T (2015) Hybrid mapping of pantropical wetlands from optical satellite images, hydrology and geomorphology. In: Remote Sensing of Wetlands: Applications and Advances. (eds Ralph W. Tiner, Megan W. Lang, Victor V. Klemas), pp 433-452. CRP Press. Taylor and Francis Group. Boca Raton, Florida. • Gumbricht T (2016) Soil Moisture Dynamics Estimated from Modis Time Series Images. In: Multitemporal Remote Sensing. Remote Sensing and Digital Image Processing (ed Y Ban). Springer International Publishing, Cham, Switzerland. DOI 10.1007/978-3-319-47037-5_12. • Gumbricht et al. (2017) An expert system model for mapping tropical wetlands and peatlands reveals South America as the largest Contributor. Global Change Biology. DOI: 10.1111/gcb.13689
  • 3.
    What is neededfor landscape peatland management? 1. Spatially explicit data on peat location, extent, depth  SOCs 2. Multitemporal evolution of peat moisture content- peat degradation What is needed for including peatlands in NDCs and in sectorial mitigation commitments? 1. Establishment of national/subnational reference levels 2. Development of a national MRV system to track the emissions Request to the scientific community “A method capable of reproducing global/tropical peatlands (location, extent, depth), with high spatial (30-250m) and temporal resolutions (annual, quarterly)”. Current methodological situation • Not such a method existed. • Wetland estimates differ four-fold in modelled area simulations and three-fold in observational mapping (Melton et al. 2013). • Spatially explicit wetland maps are poorly connected to peatlands.
  • 4.
    Köchy and Freibauer(2009)1 Peatland classes within wetland maps Poor classifications Poor spatial resolution Un-updated data Unavailable data validation in tropical regions
  • 5.
    Barriers to developsuch a method • Peatland definition (histosols vs peats): 30cm thick, 50% of organic matter (27% of Organic content). • Comprehensive ground validation is needed. Global and tropical maps remain unverified. • Methodological constraints: • data source quality, data availability. • requirements to fulfil spatio-temporal resolutions and data densification. • depth
  • 6.
    The expert systemmodel (knowledge-based predictive approach) Considers three basic requirements for wetland/peatland development: 1. Hydrology: Water input exceeds the atmospheric water demand (potential evapotransp.) 2. Soil moisture: The soil surface is wet or inundated for prolonged periods 3. Geomorphology: The geomorphology allows surface water accumulation Develops and parameterizes three biophysical indices per pixel, at 236m: 1. Wetland Topographic Convergence Index (wTCI) (monthly) topographic wetness 2. Transformed Wetness Index (TWI) (bi-weekly): soil moisture 3. Geomorphological Index Requires data on: 1. Regional and local water balances:  Mean Monthly precipitation1950-2000 from WorldClim global dataset  Evapotranspiration from CRU- East Anglia 2. Soil moisture (surface wetness phenology):  16-day BRDF–corrected MODIS (MCD43A4) for mapping the duration of wet and inundated soil conditions (236m) year 2011 (2010-2012) 3. Geomorphology:  Version 4 of the Shuttle Radar Topography Mission (SRTM) digital elevation model (DEM), prepared by CIAT (250m)
  • 7.
    Tropical maps ofwetlands and peatlands General characteristics: • 3 maps: wetlands, peatlands, depths • 9 maps for individual wetland types (1-100%) • 236m • 38° N to 56° S; 161° E to 117° W (tropics and subtropics), includes 146 countries but excludes small islands. Peat: ≥50% organic matter (30% carbon content), ≥30cm thick. Tropical peat area : 3-fold increase Tropical peat volumes and stocks: 4-fold increase Highest continental contribution in area and volume: South America, Brazil not SE-Asia, Indonesia Source: Gumbricht et al. (2017)
  • 8.
    Some under-reported peatlands inthe tropics Latin America (Amazon Basin, Argentina Río de la Plata, Paraná River Basins) Asia (All river deltas, Bangladesh, Indonesia Papua) Africa (Cuvette-Central, Angola, Zambia, Botswana, Sudan)
  • 9.
    Figure S2: Visualvalidation of our map against six major tropical peat deposits as reported in Lawson et al., (2014) Figure S1: Distribution of the peat points (n= 275) used to validate the peat maps produced with our expert system model. Numeric 65% agreement in the tropics 74% agreement in Indonesia Validation Visual There is not enough ground data available to properly validate tropical peatland maps
  • 10.
    Examples of areaand depth for the two largest peat deposits in the tropics, outside Asia Cuvette Central DRC-Congo Pastaza-Marañón in Peru Area (km2) (other study) Area (km2) (this study) 35,600 40,838 145,500 125,440 Volume (km3) (other study) Volume (km3) (this study) 70,7 257 600 915 Depth (m) (other study) Depth (m) (this study) 2,0 6,3 4.2 6.9 Pastaza-Marañón (Draper et al 2015) Congo Basin (Dargie et al 2017) Pastaza-Marañón (Draper et al 2015) Congo Basin (Dargie et al 2017) Pastaza-Marañón (Draper et al 2015) Congo Basin (Dargie et al 2017) Overestimation
  • 11.
    Known errors, caveatsand possible improvements • There are errors associated to the source data used in the three indices:  Hydrology (Climate data): inaccurate source data for the tropics. Suggested measure: Use of regional climate and regional calibrations.  Topography (SRTM): erroneous over dense canopies (artificially heighten) and over water bodies (artificially lowered): overestimation of soil depths in forested swamps, leading to overestimation of volumes. Measured applied: we halved the established max depth thresholds used to parameterize the different wetland types, offering thresholds of volume. Depths (m) from peat soil profiles compiled by Nadine Herold (unpublished data) and estimated by our expert system.
  • 12.
    Known errors, caveatsand possible improvements  Soil moisture (MODIS): optical imagery misses floods and inundated soil conditions during cloud-persistent wet seasons, and overestimates moisture in areas with strong forest shadows (needle-leaf forests in particular). Underestimation of wetlands also occur in areas with dense grasses and papyrus. Suggested measure: adjustment of TWI by canopy cover, or calibration of TWI using microwave data.  Soil moisture (MODIS): temporal scale limited to 2011 (2010-2012) may have captured anomalous wet La Niña conditions leading to overestimations of peatland area. Suggested measure: Adopt a larger MODIS period for analysing soil moisture. • Lack of ground data for organic soils, as well as unstandardized definitions of wetlands and peatland jeopardizes map validation.
  • 13.
  • 14.
    Next steps forpeatland monitoring • Regional parameterizations in the tropics to improve the accuracy of the estimates (i.e. South America, Asia, Africa). The expert system currently offers one model and one tropical parameterization (although different for each wetland). • Inclusion of montane peatlands: new regional parameterization • Inclusion of boreal peatlands: new regional parameterization • Peatland degradation monitoring: the expert system can be used to monitor wetland and peatland degradation through changes in soil moisture. • Peatland area forecasting under changing climate: the expert system can be used to forecast wetland areas under future climatic conditions.