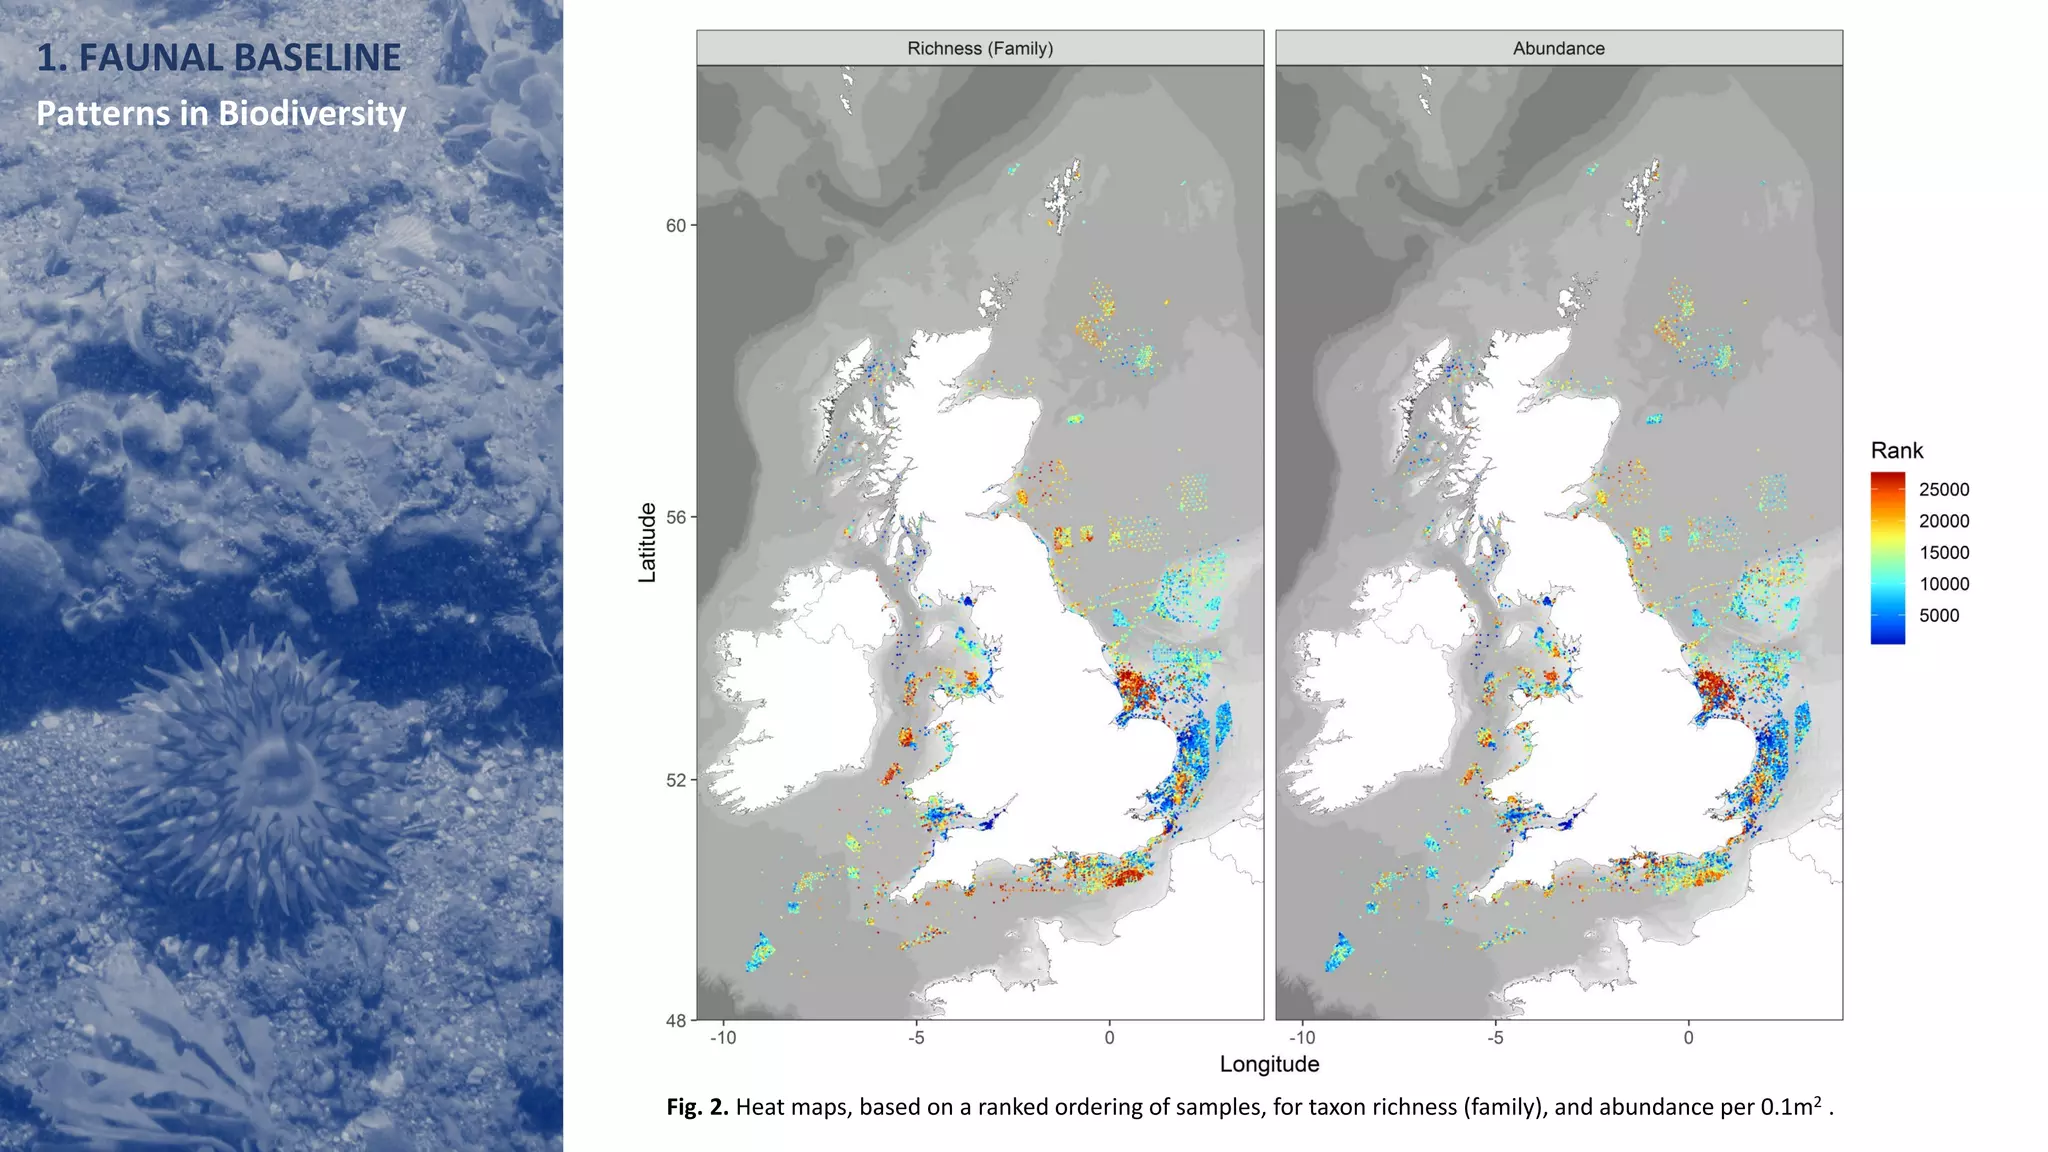
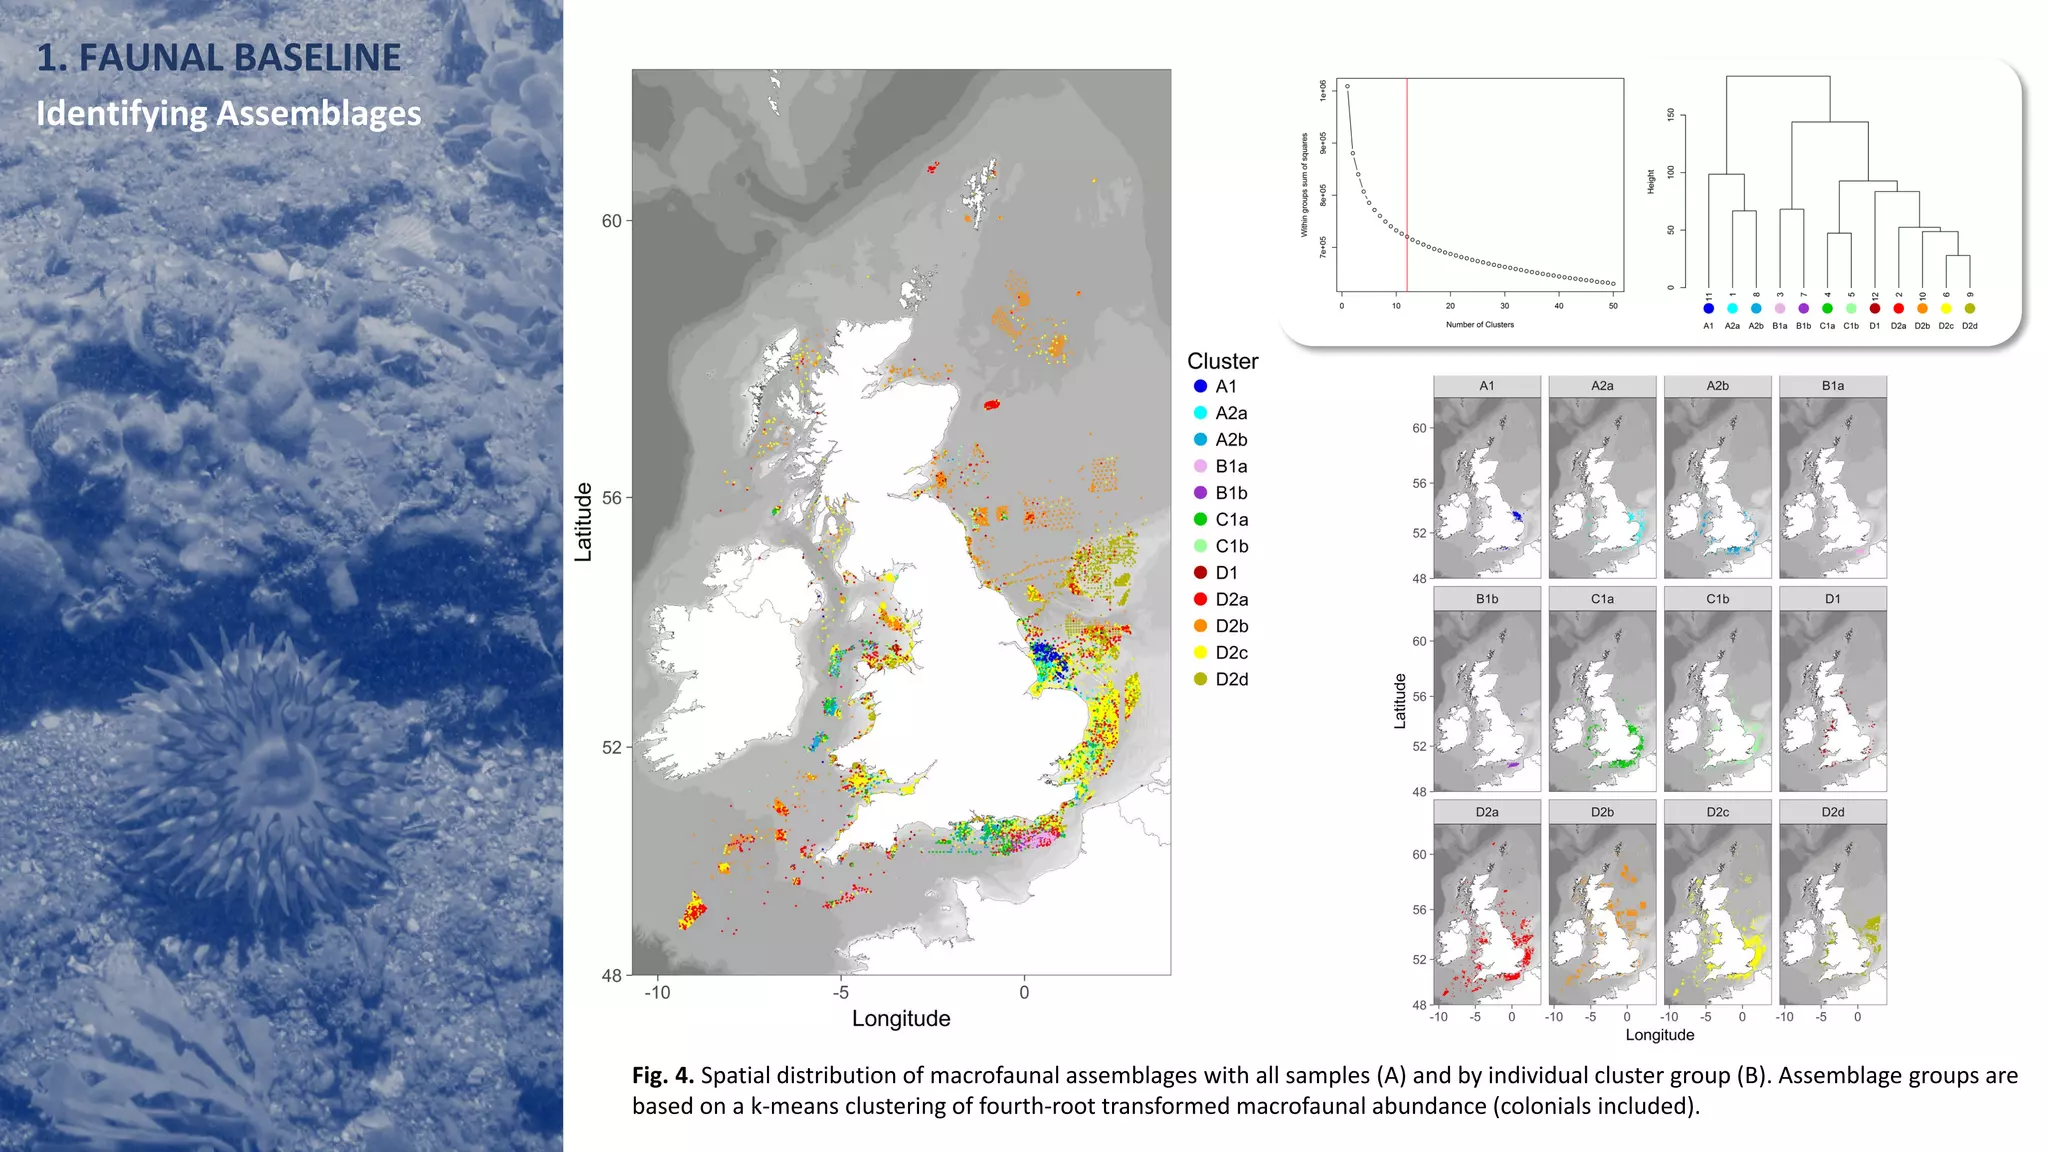
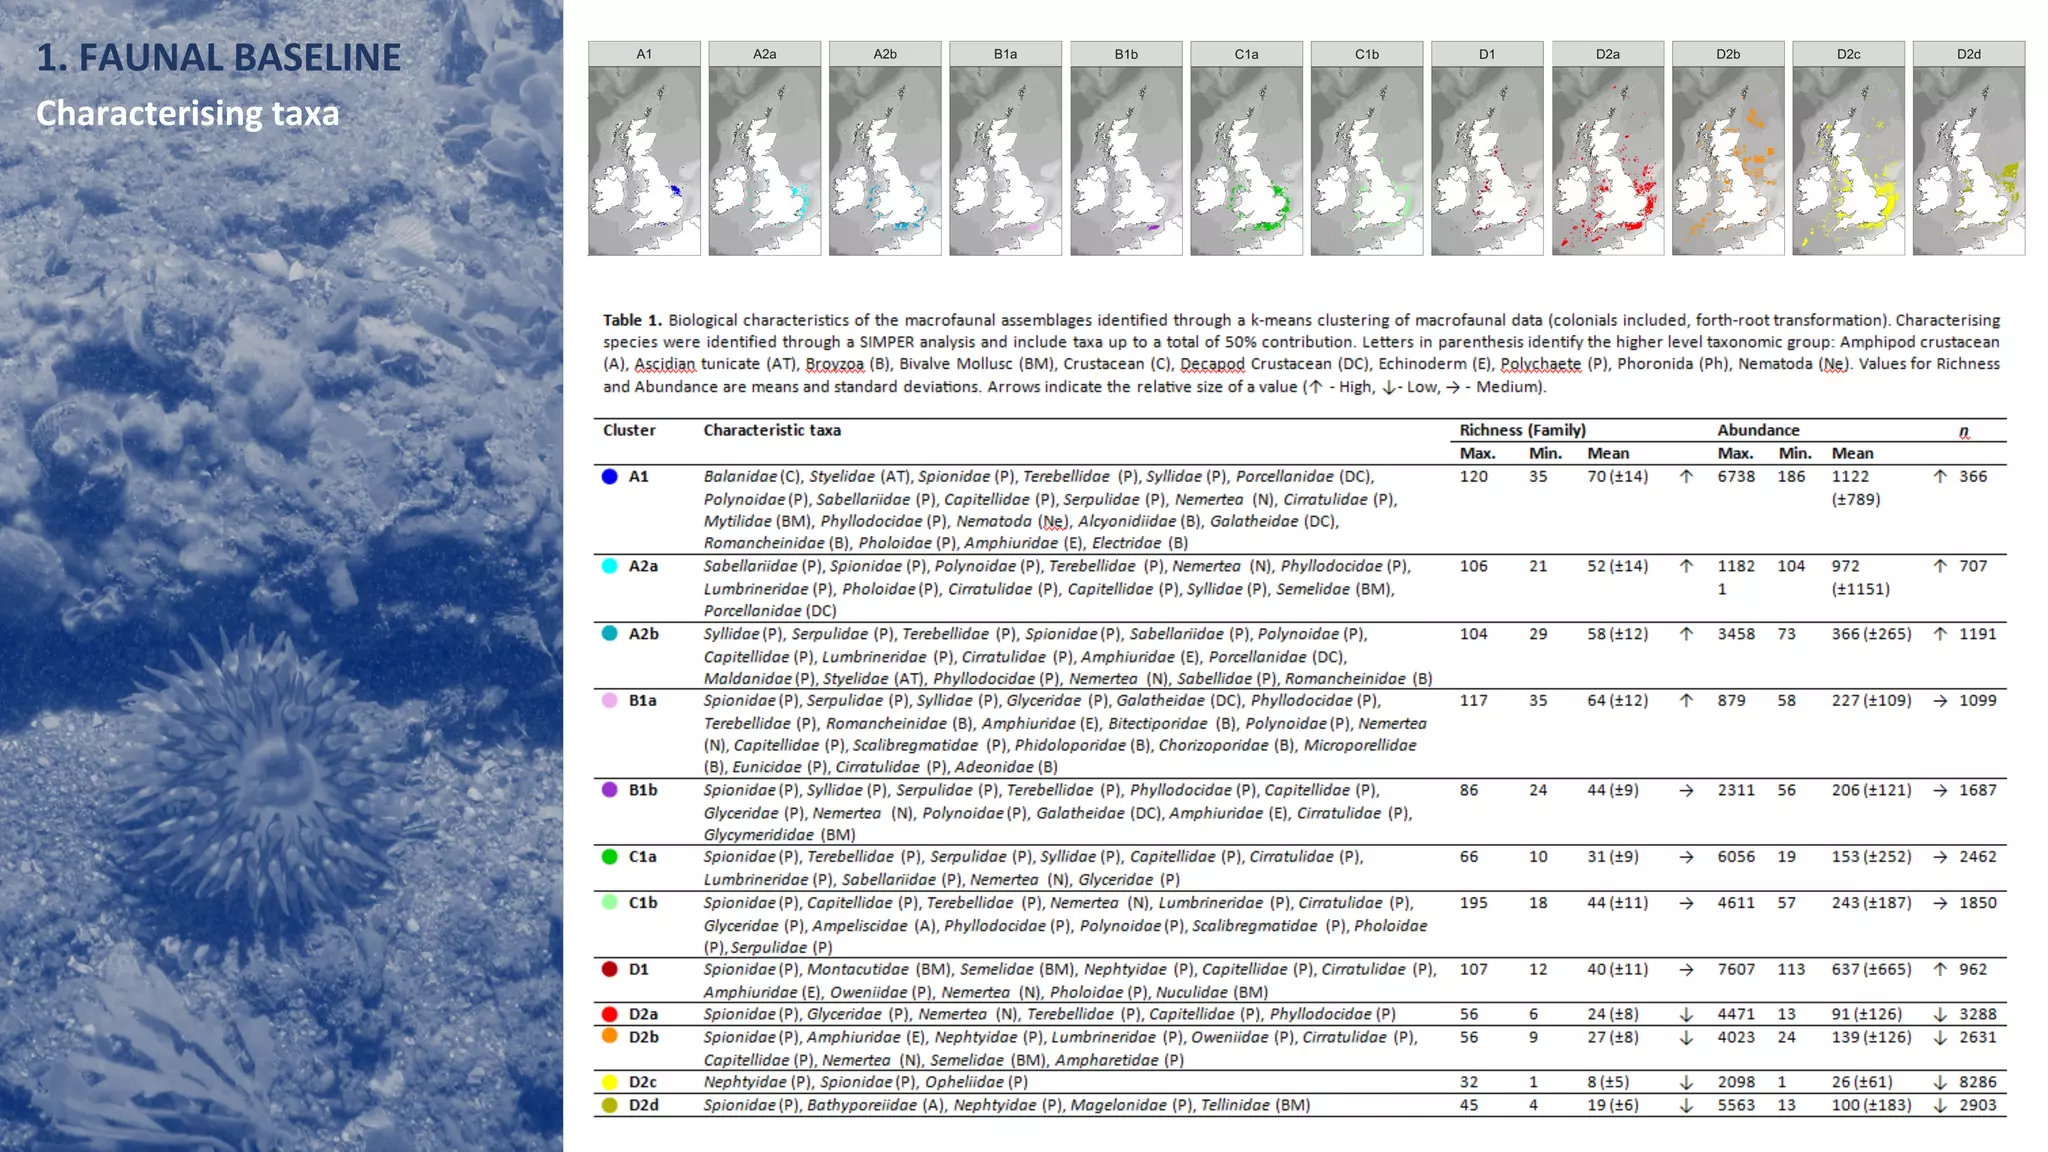
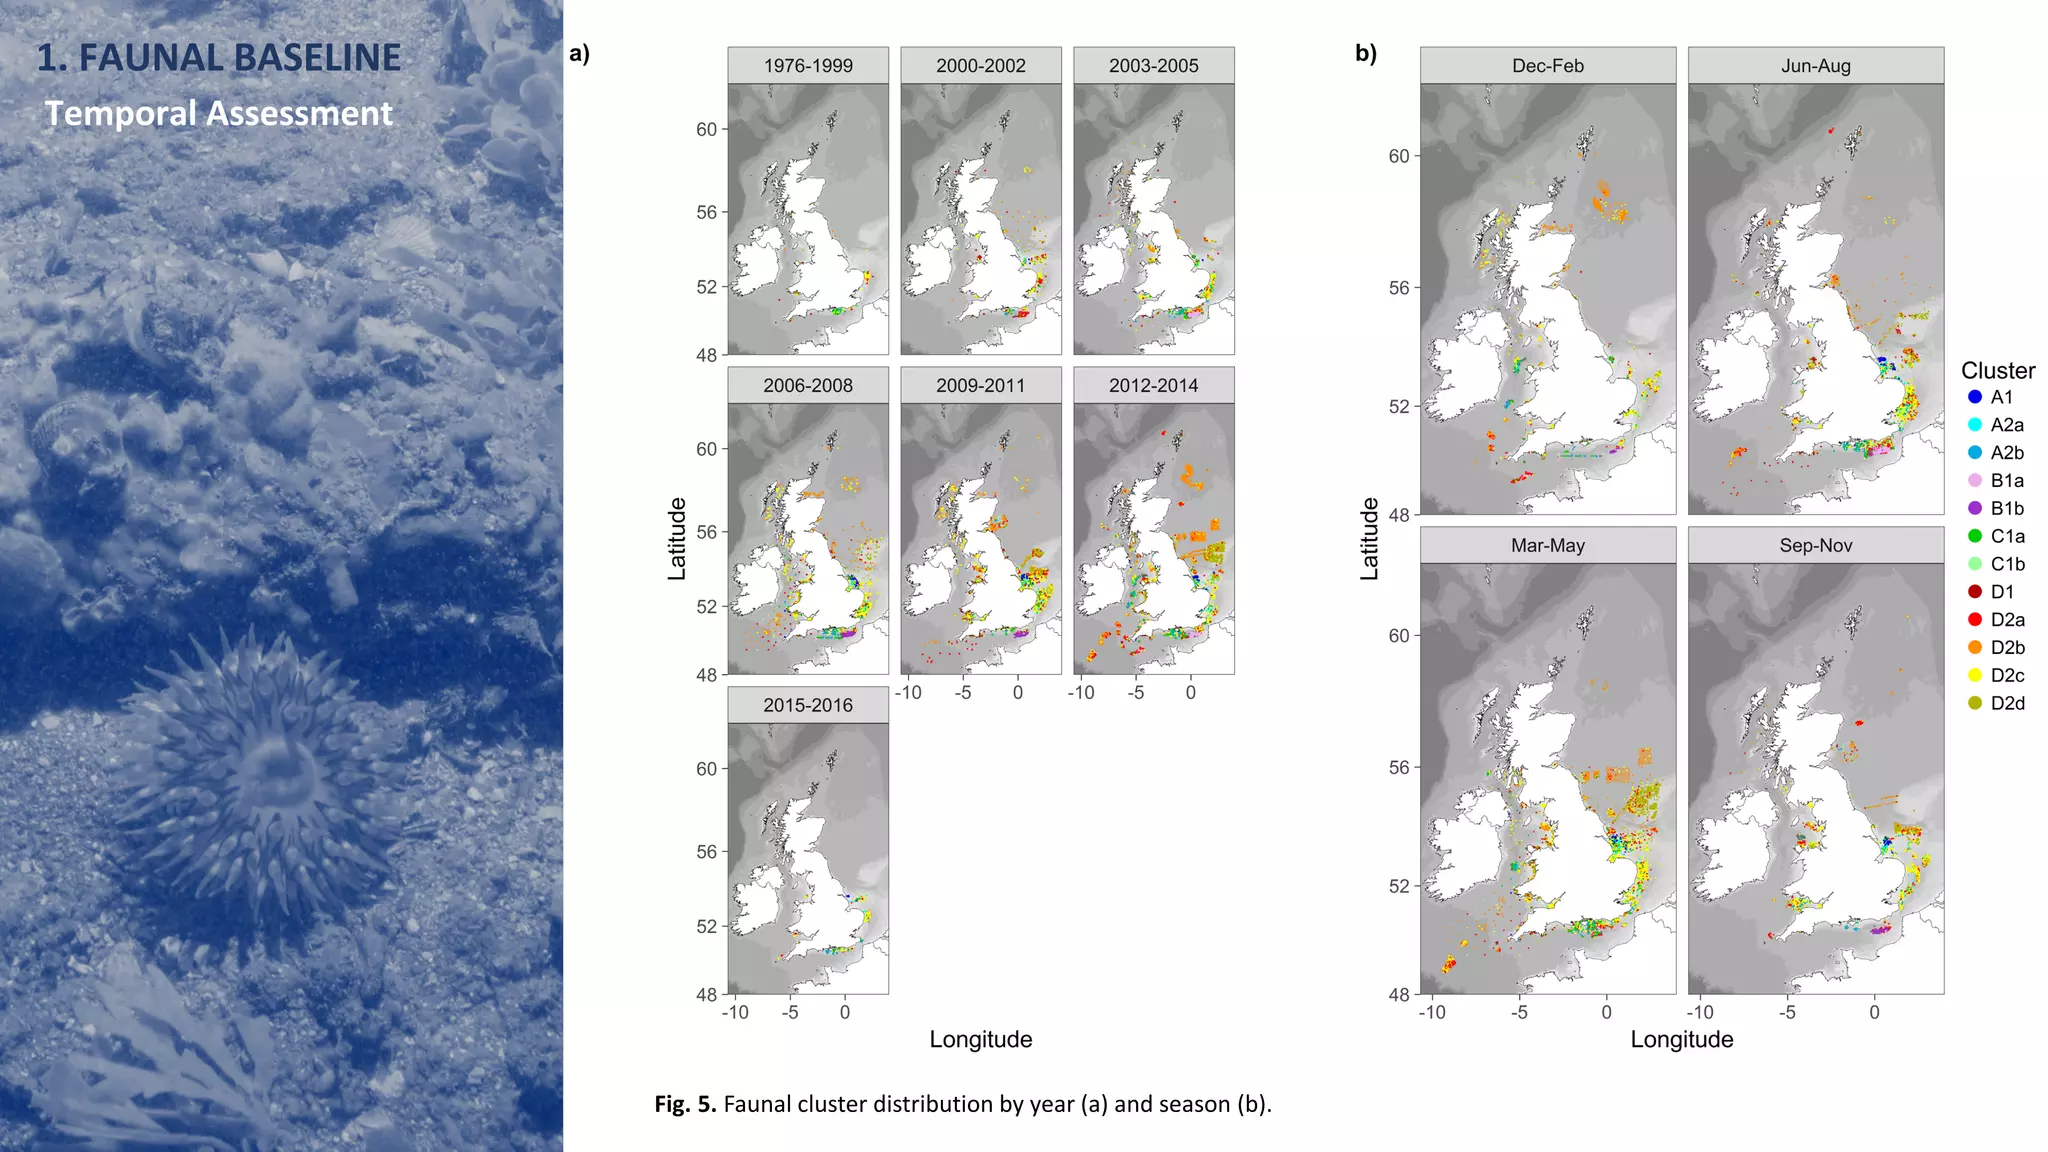
Download as PDF, PPTX
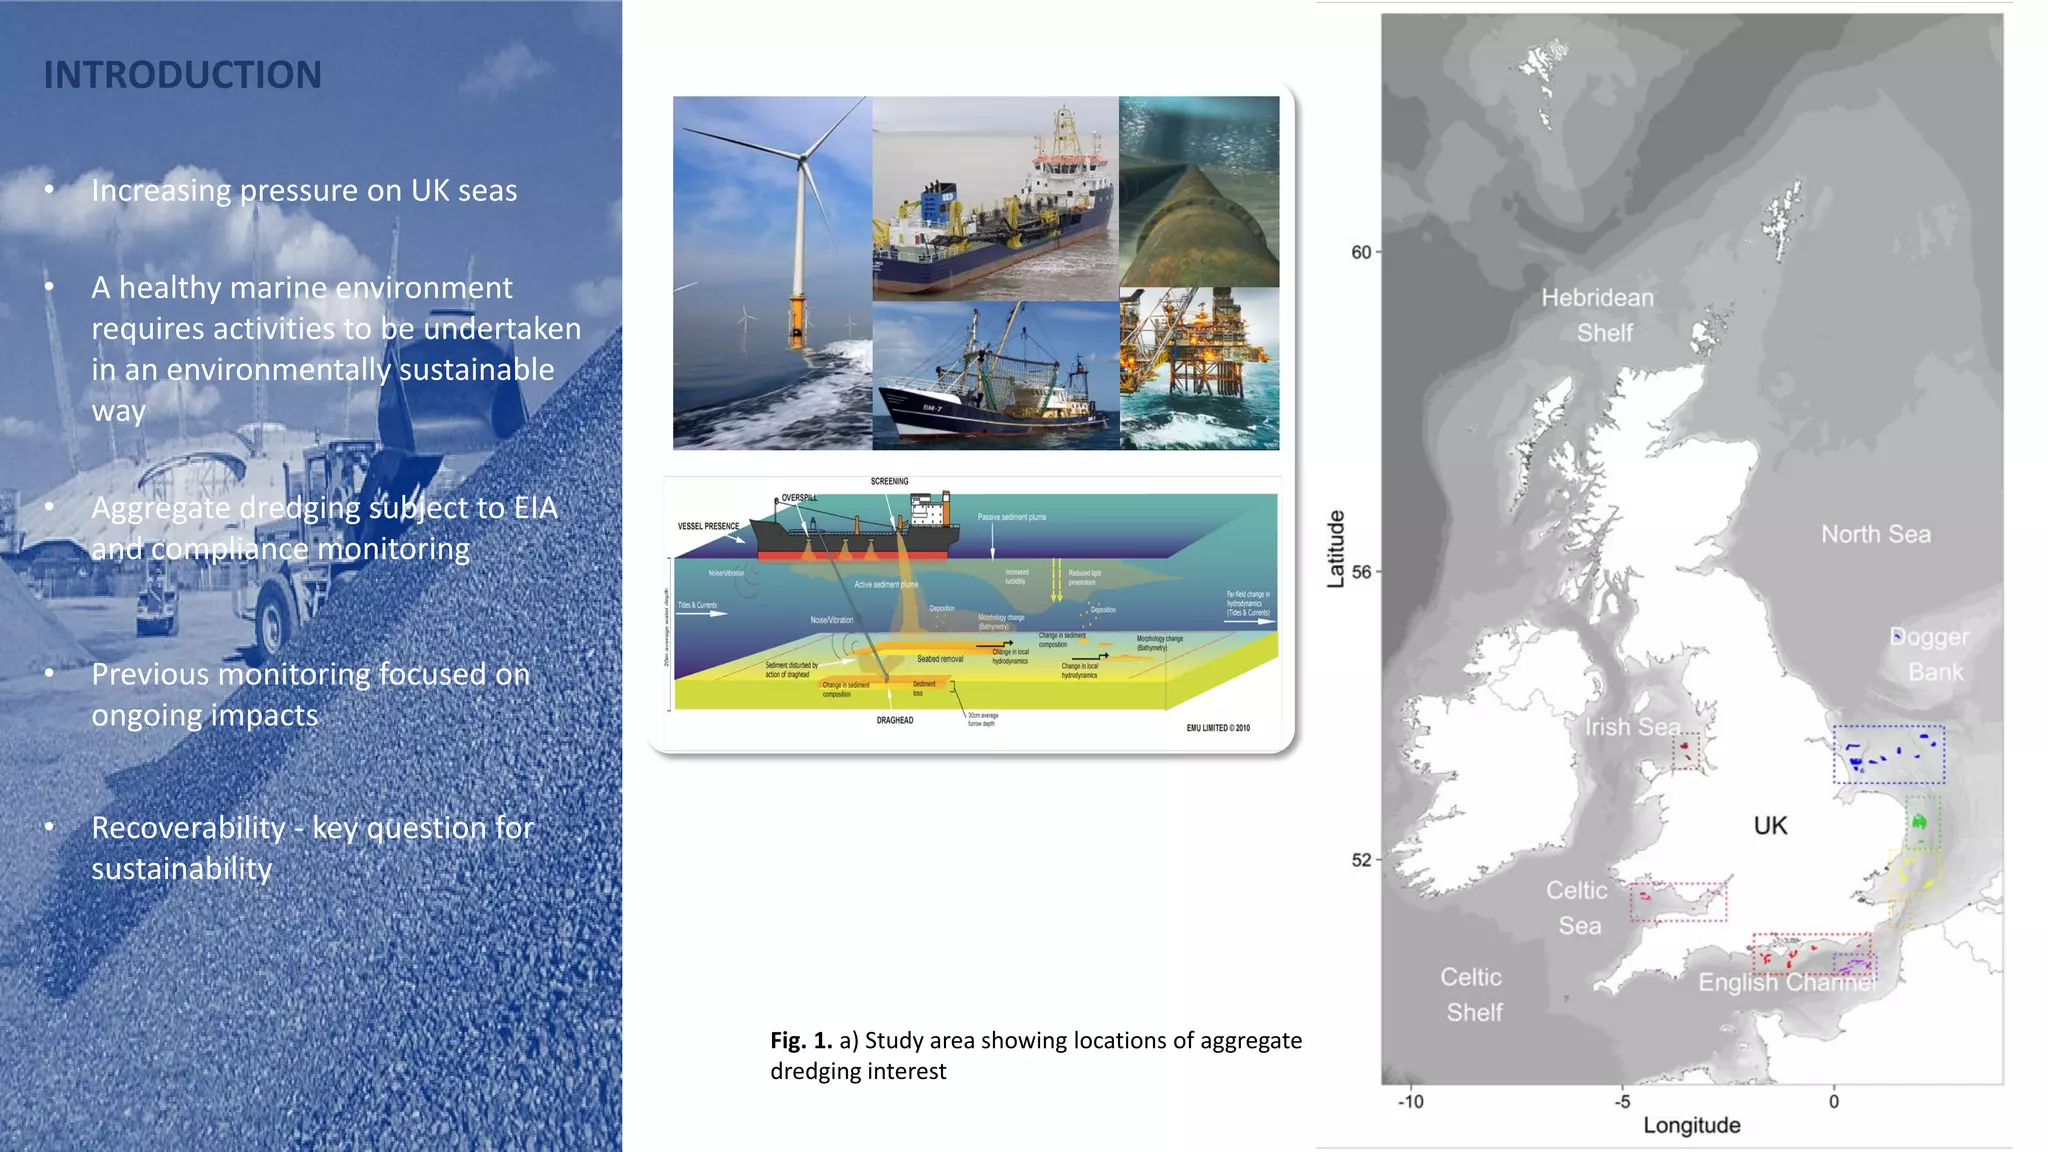
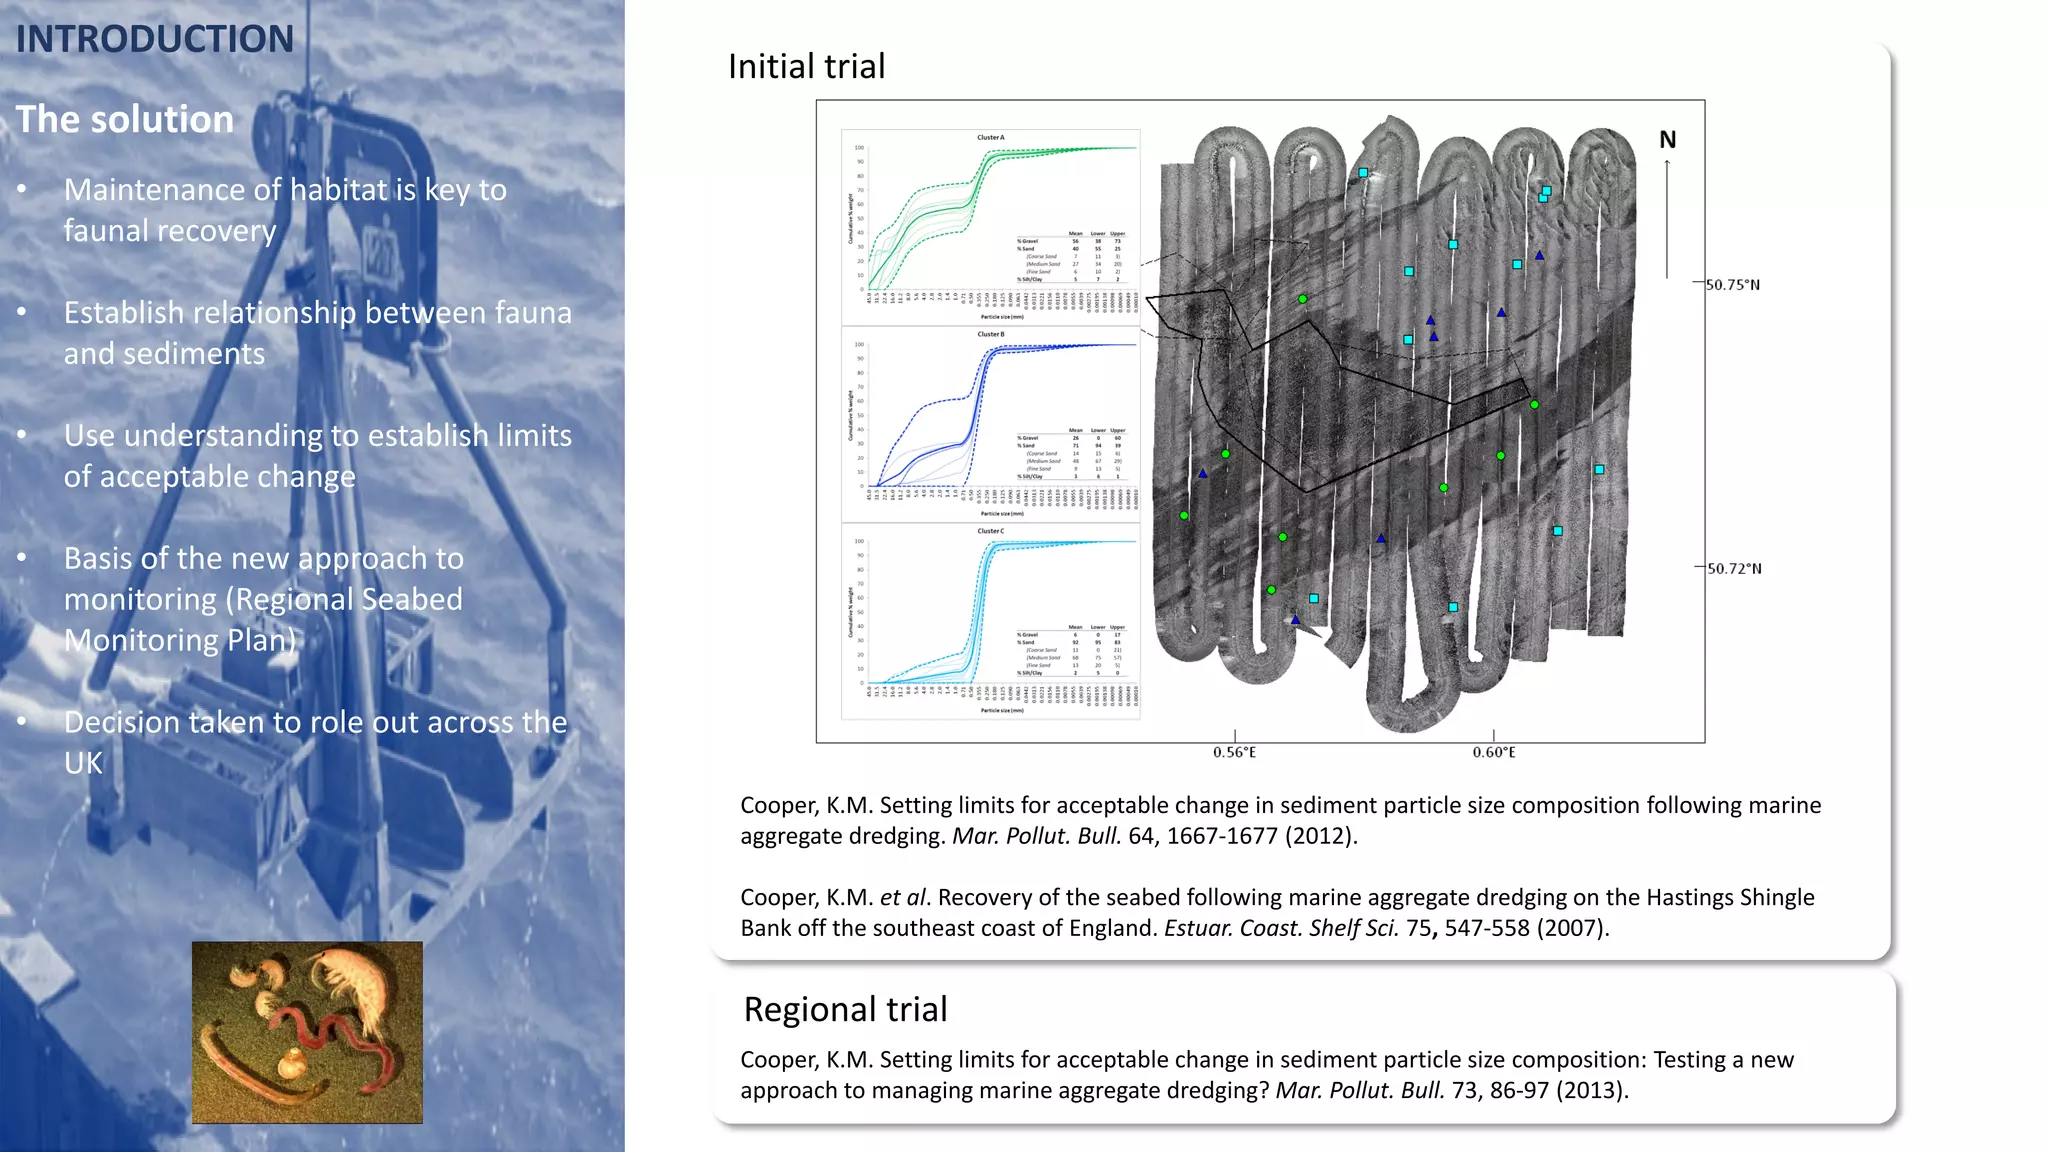
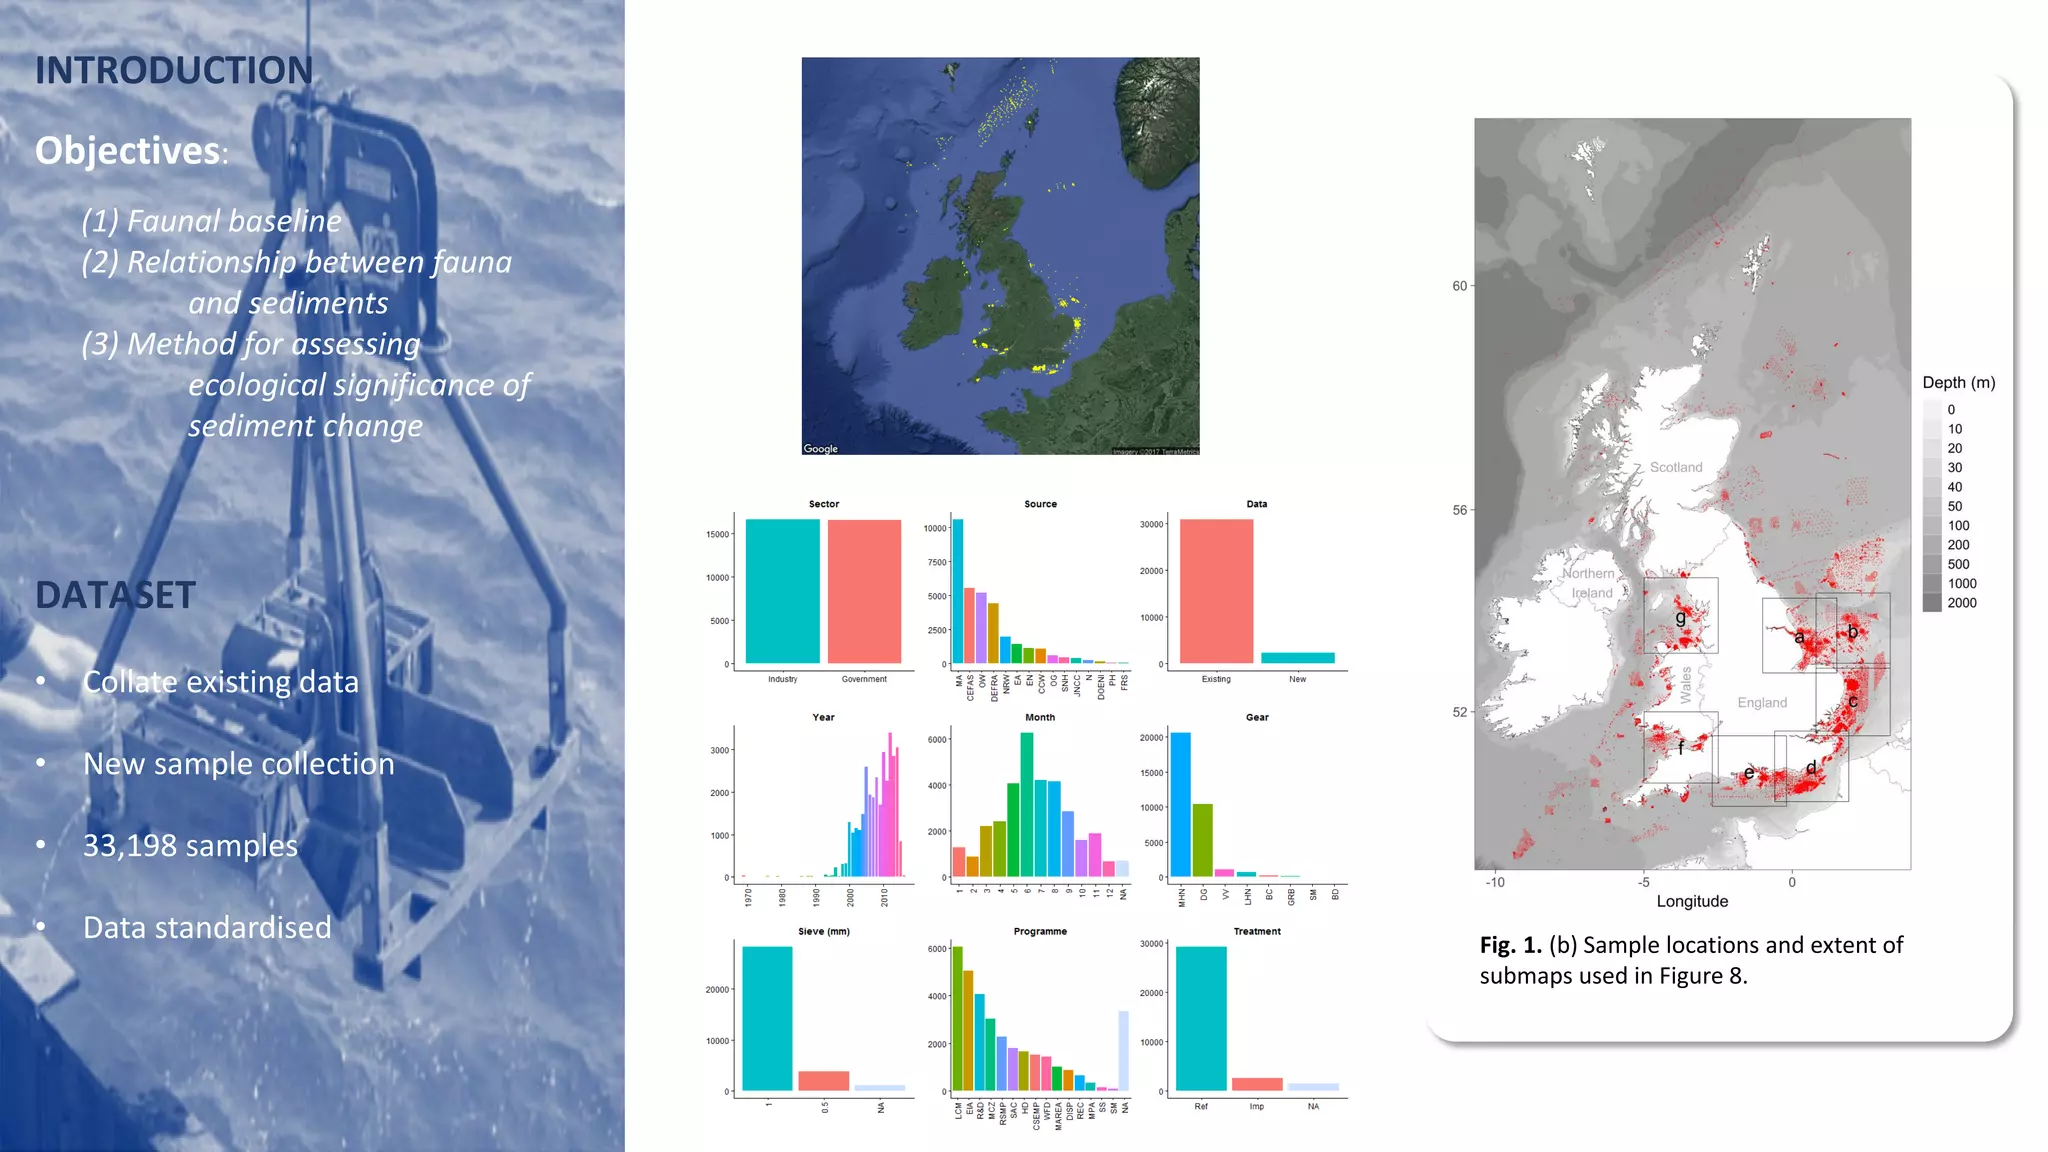
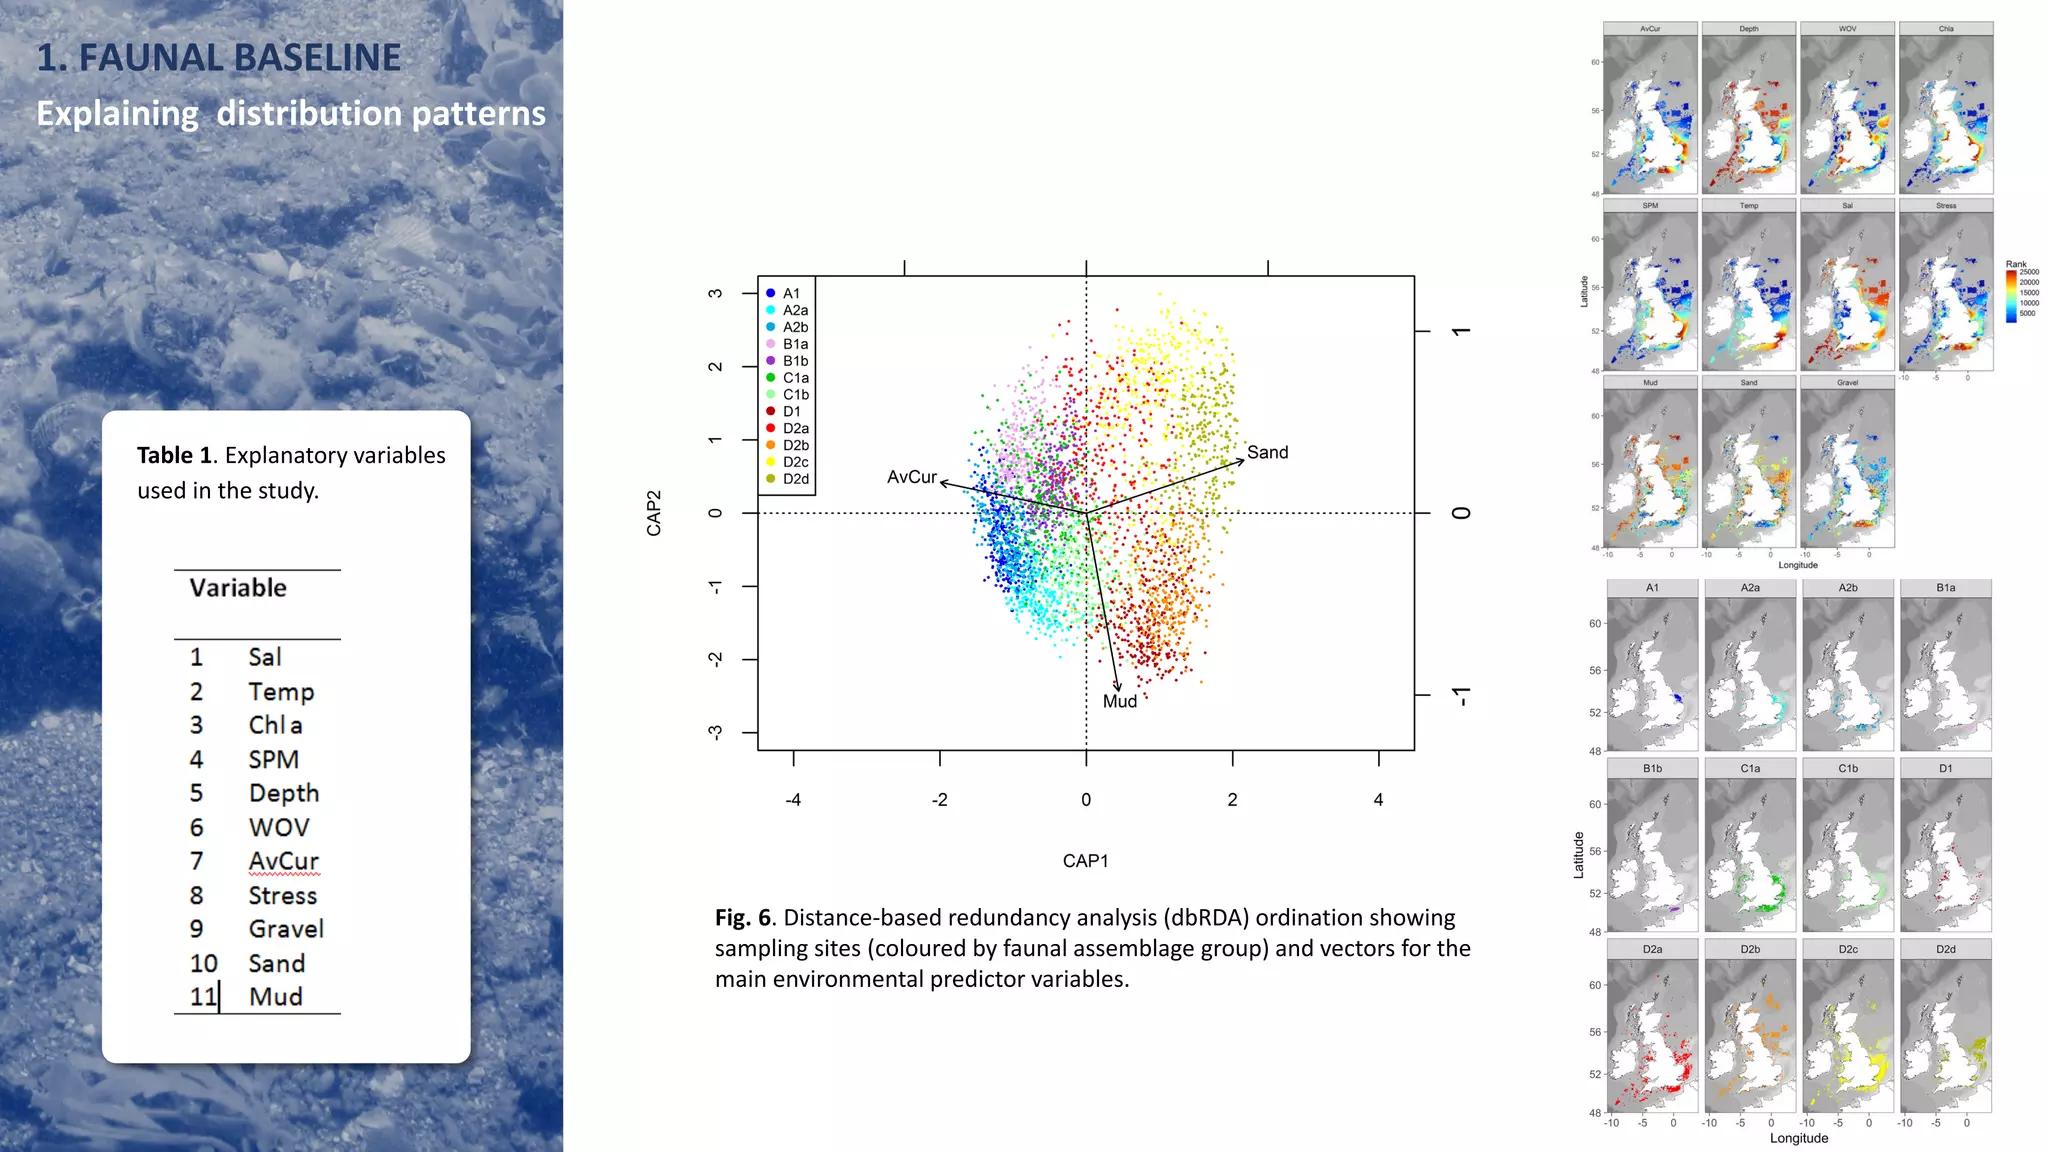
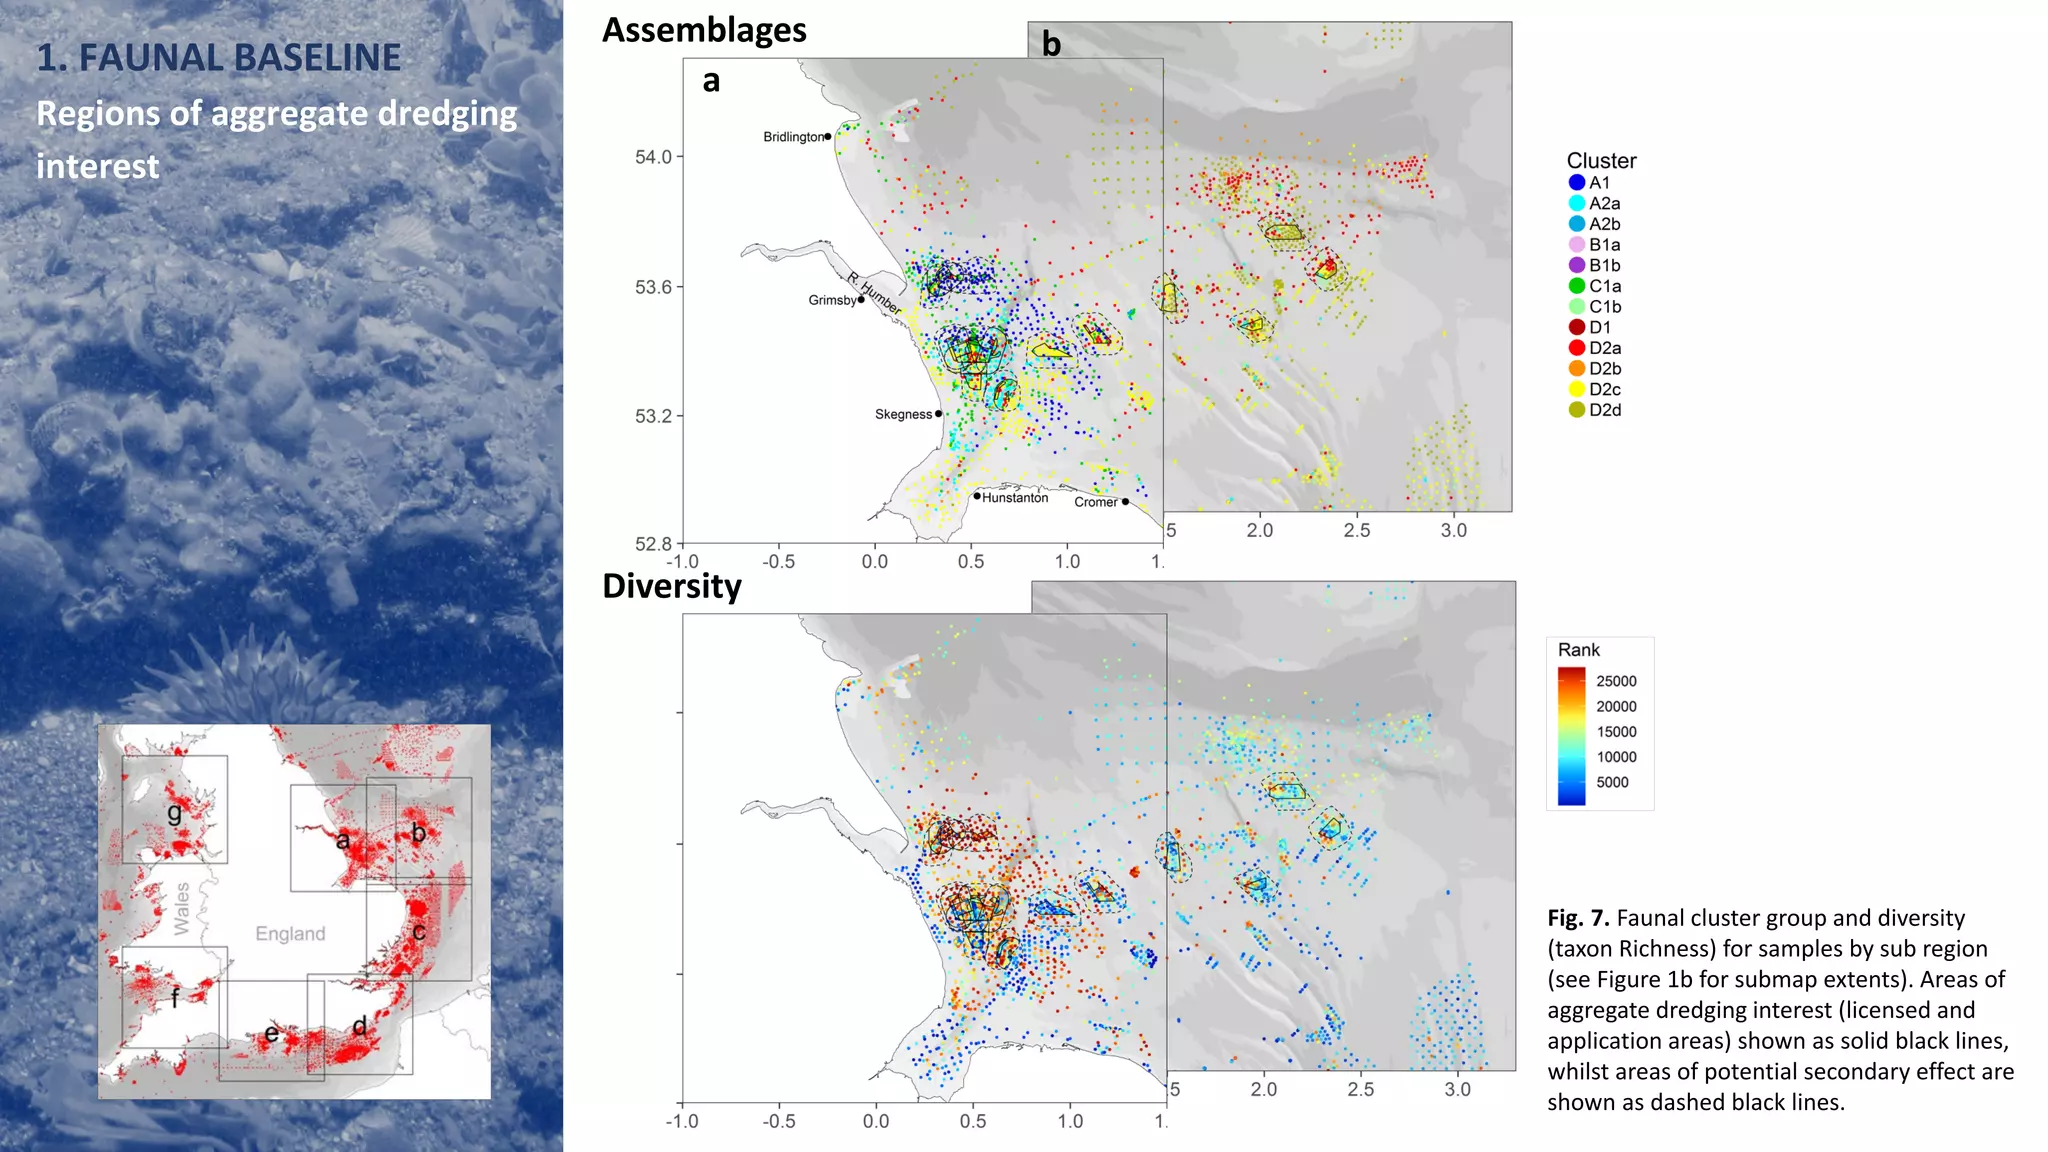
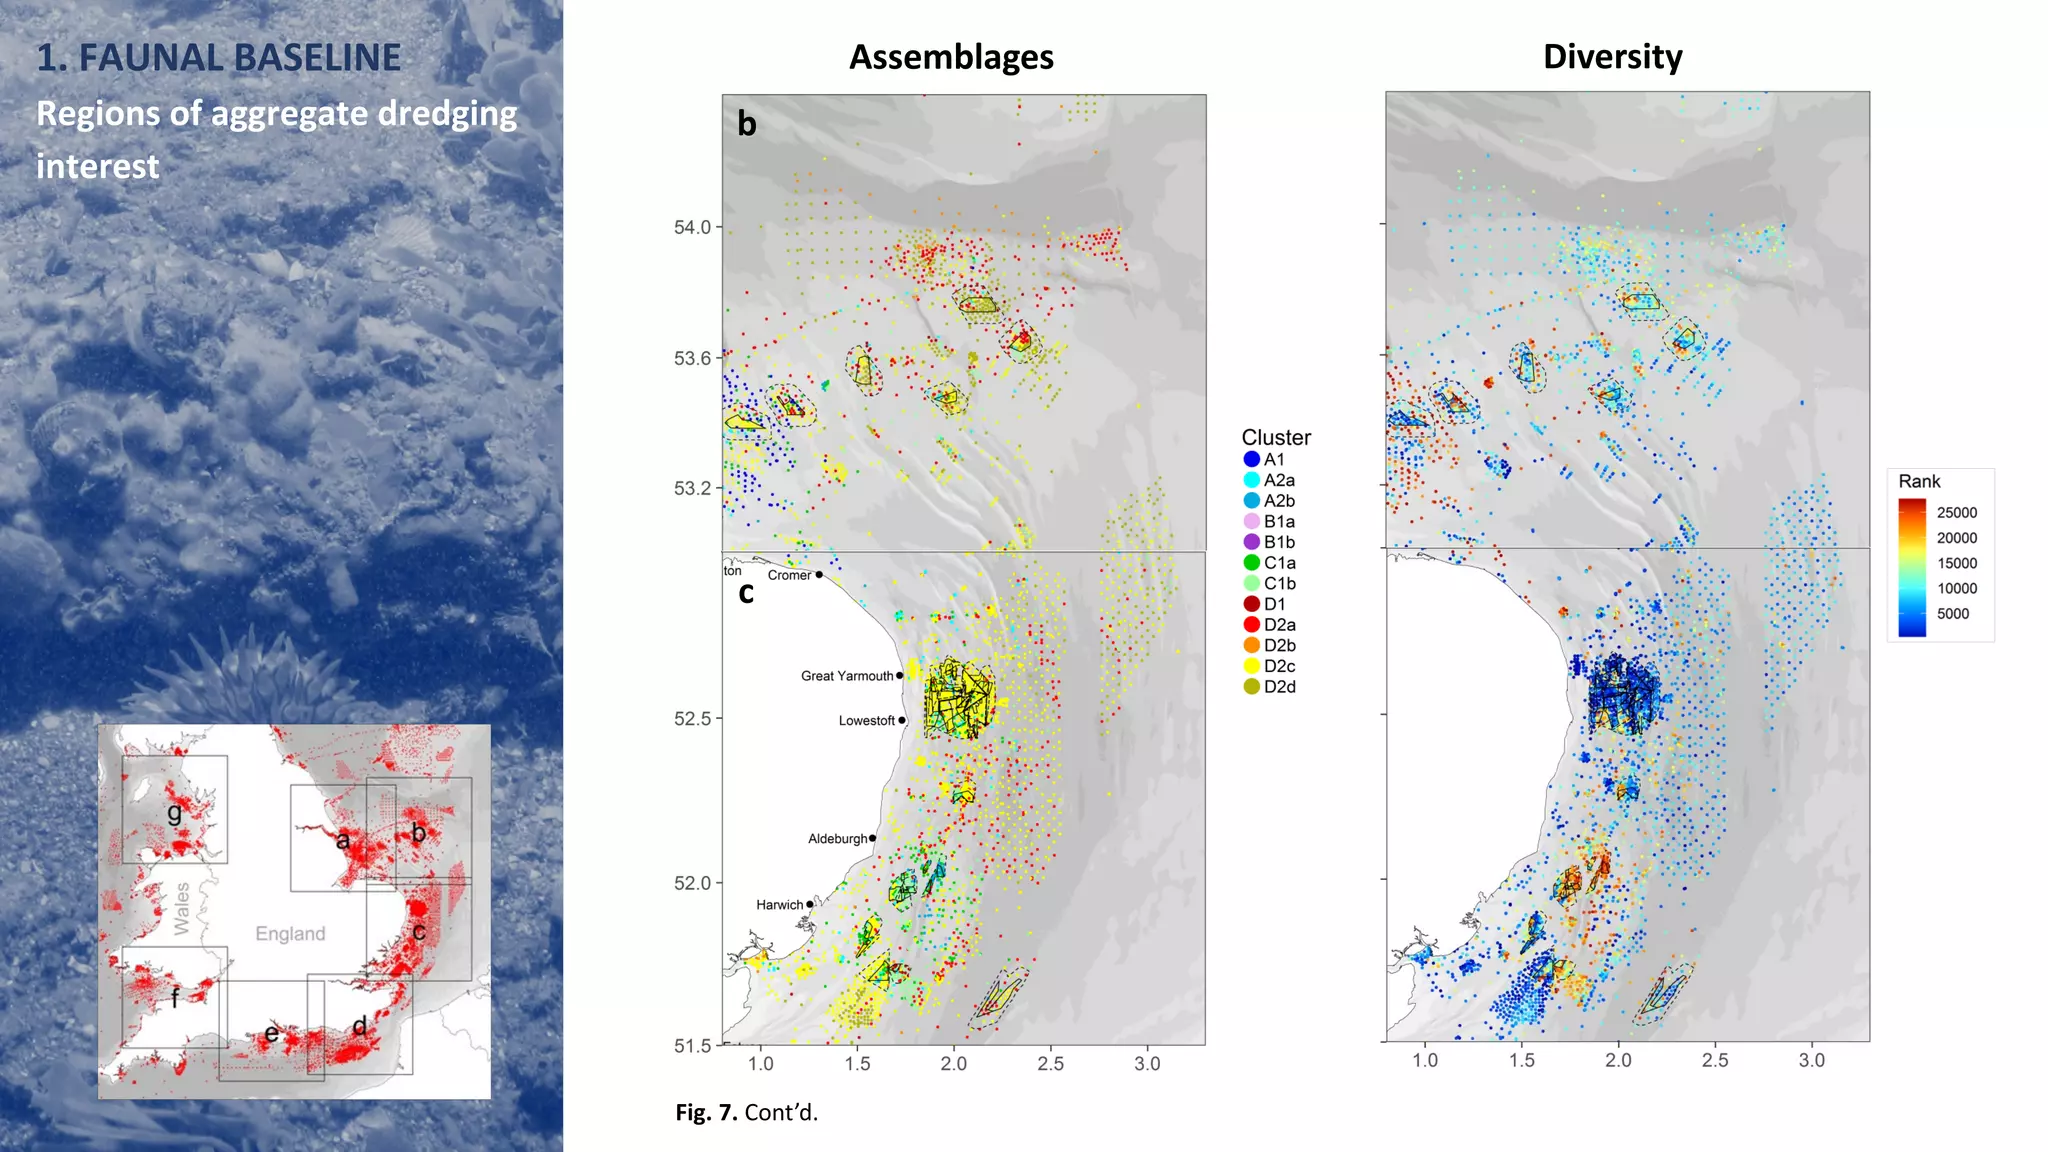
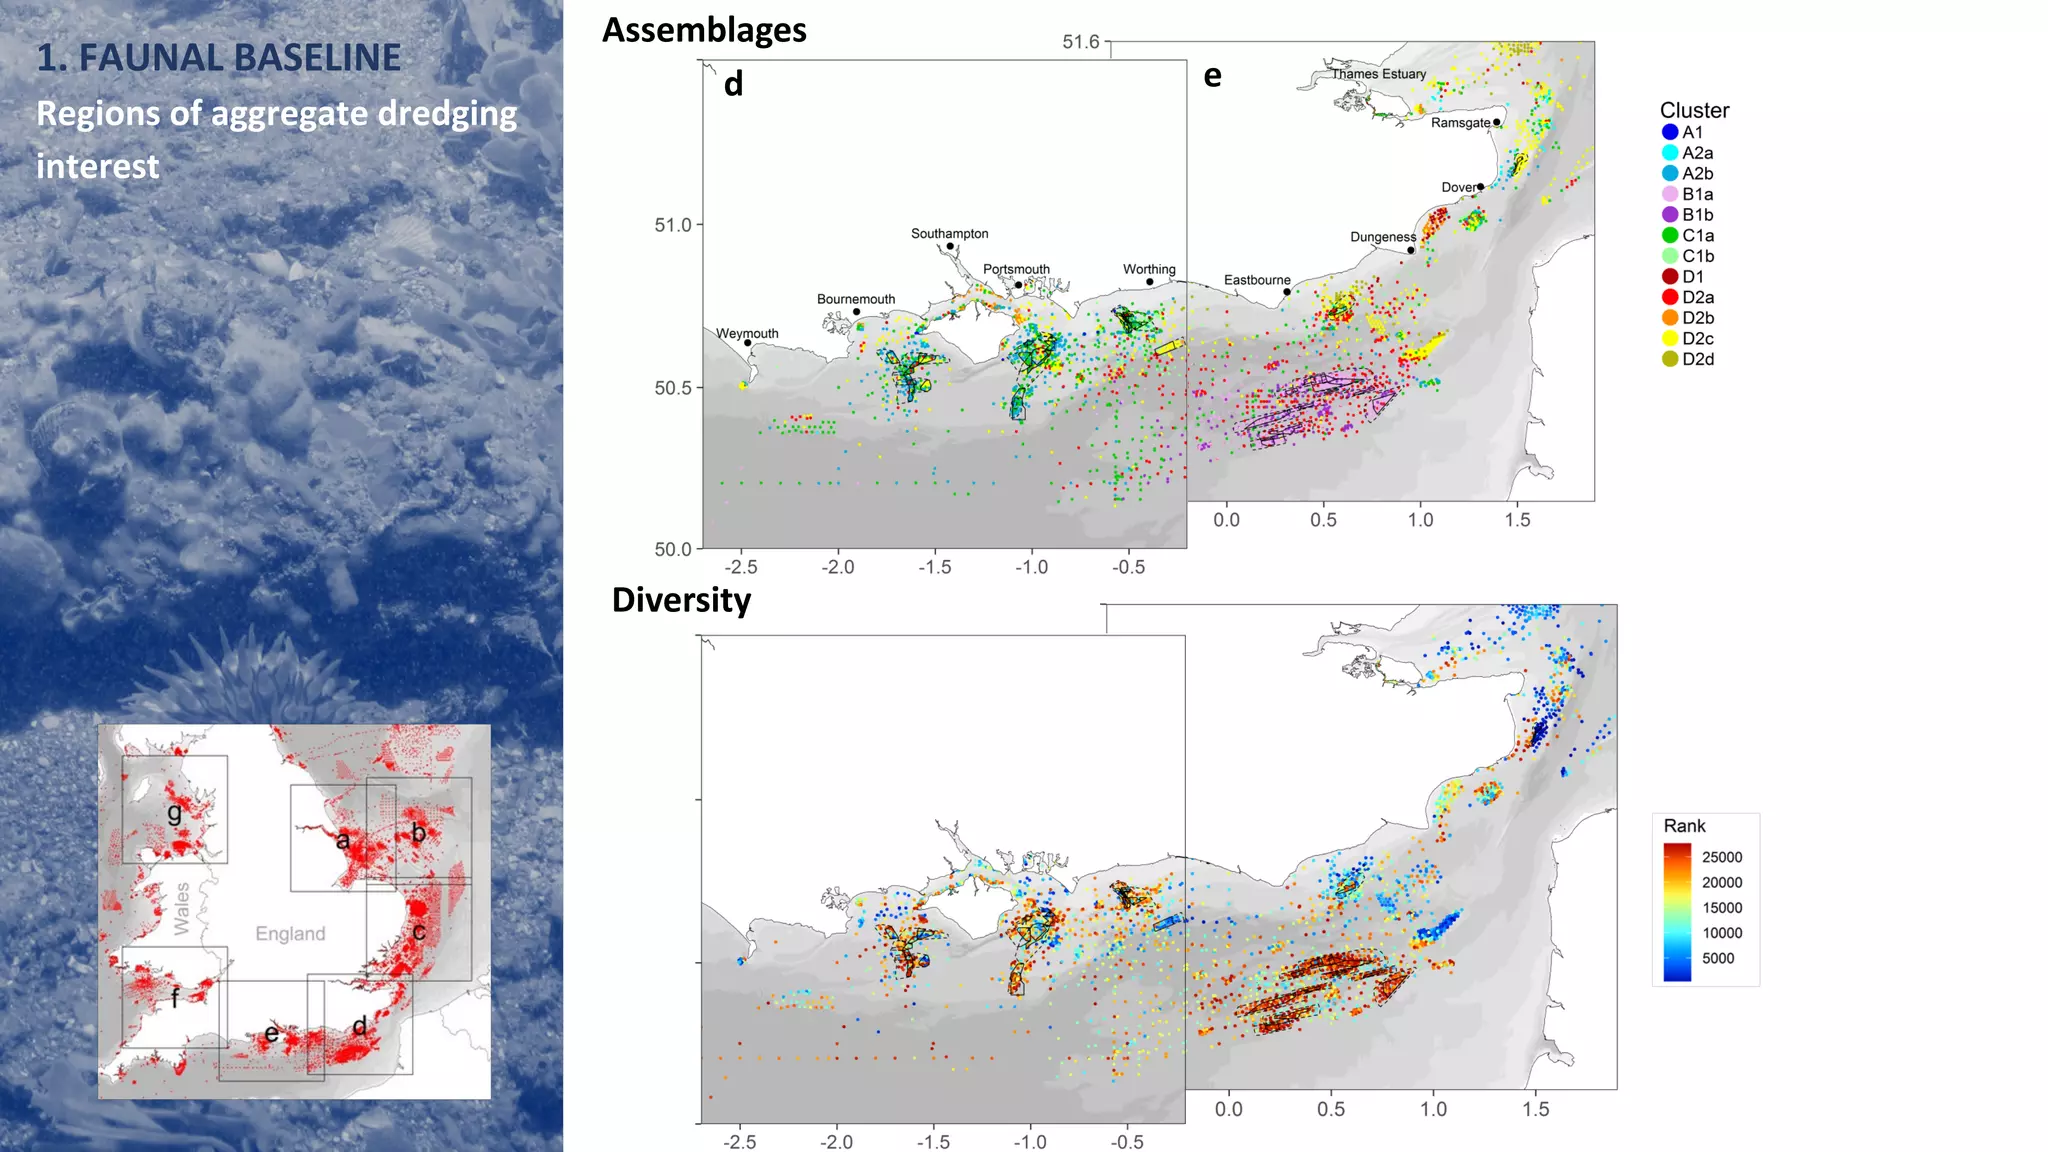
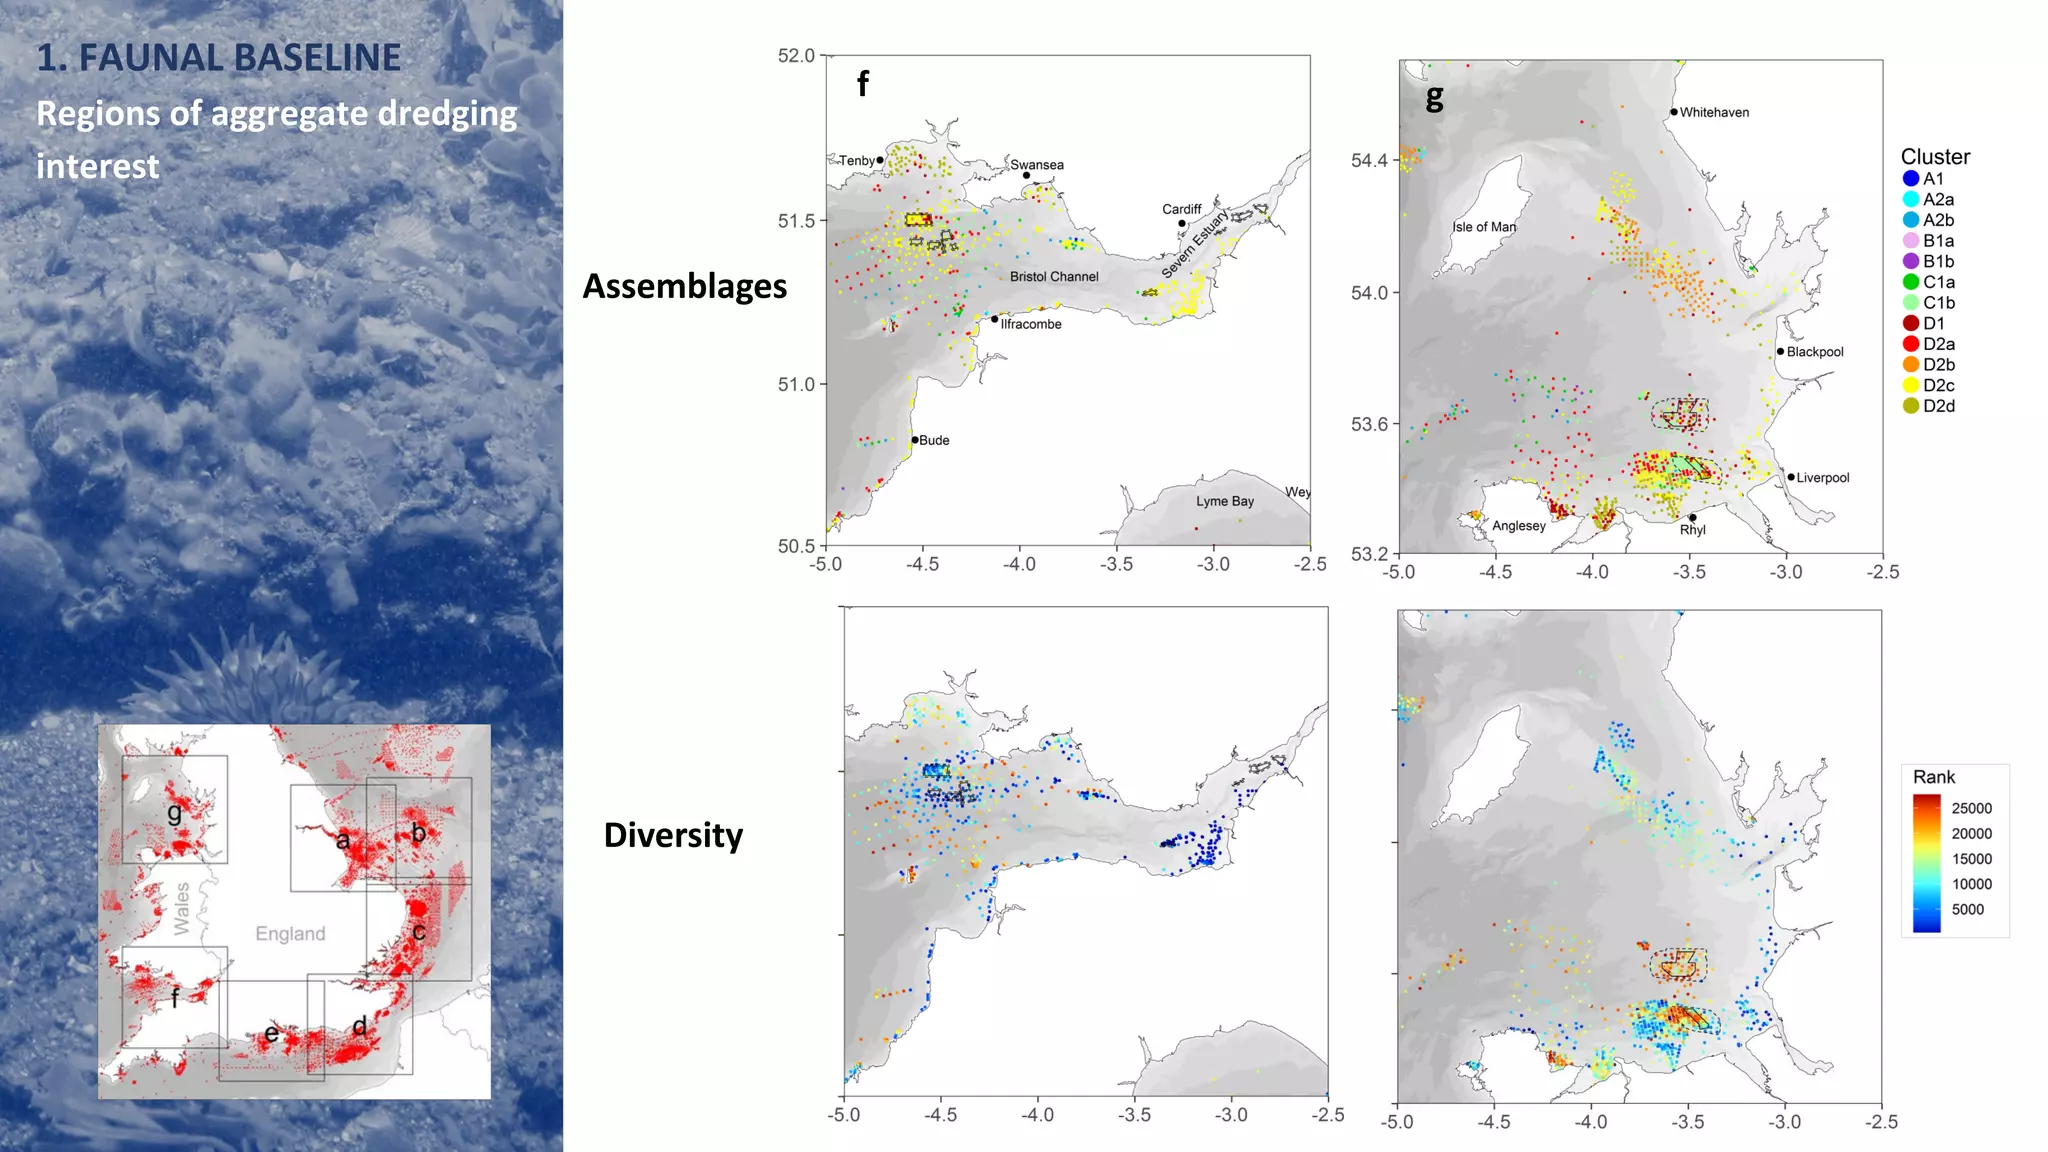


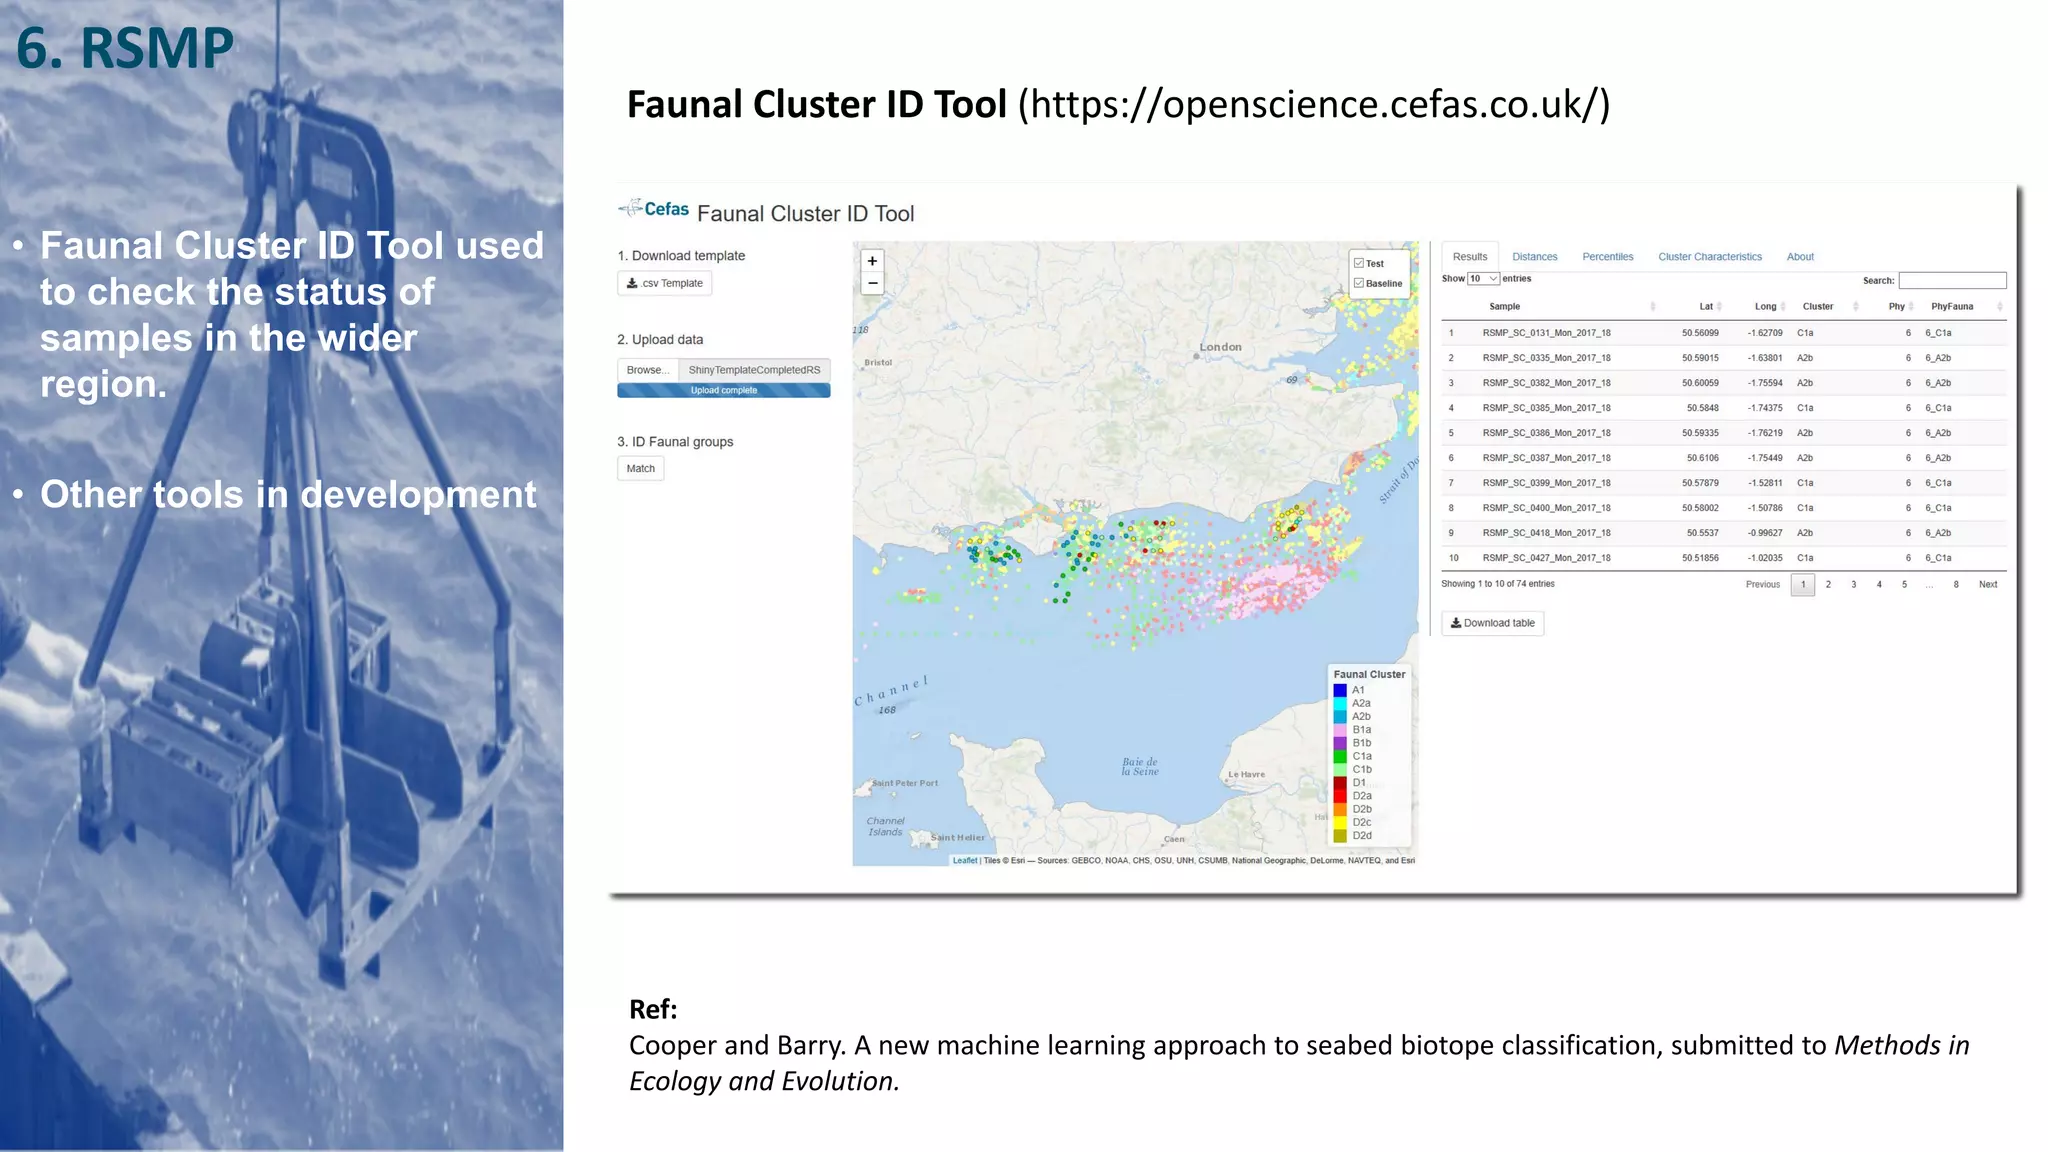


(1) The document presents a new approach to macrofaunal baseline assessment, monitoring, and sustainable exploitation of the seabed using big data. (2) Over 33,000 samples were collected and analyzed to characterize faunal assemblages, relate fauna to sediment composition, and establish a method to assess sediment change from dredging. (3) Online tools were developed to provide the faunal baseline, relate fauna and sediments, and assess sediment change, enabling more effective environmental management and monitoring.


