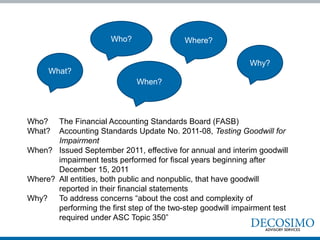
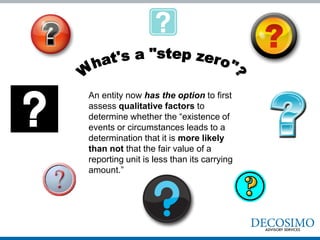
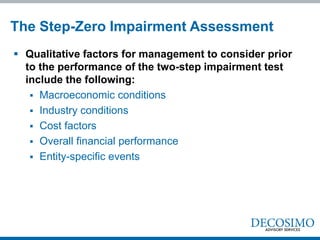
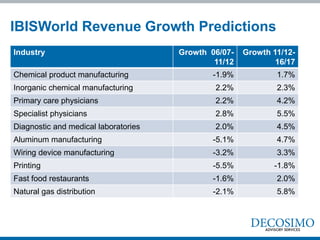
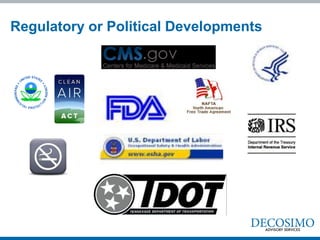
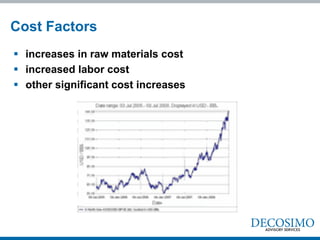
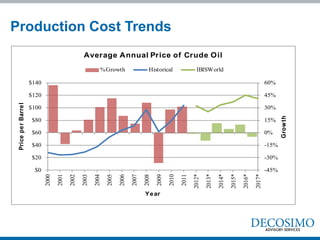
A Global Reach with a Local Perspective


    2012 DECOSIMO ACCOUNTING SEMINAR


                                                                        www.decosimo.com

Step Zero: New Qualitative Assessment Allowed for Assessing Goodwill

SHANNON FARR, CPA, ABV, CFF
Valuation Manager, Decosimo Advisory Services
Who?                 Where?

                                                              Why?
     What?
                              When?


Who?   The Financial Accounting Standards Board (FASB)
What?  Accounting Standards Update No. 2011-08, Testing Goodwill for
       Impairment
When? Issued September 2011, effective for annual and interim goodwill
       impairment tests performed for fiscal years beginning after
       December 15, 2011
Where? All entities, both public and nonpublic, that have goodwill
       reported in their financial statements
Why? To address concerns “about the cost and complexity of
       performing the first step of the two-step goodwill impairment test
       required under ASC Topic 350”
An entity now has the option to first
assess qualitative factors to
determine whether the “existence of
events or circumstances leads to a
determination that it is more likely
than not that the fair value of a
reporting unit is less than its carrying
amount.”
The Step-Zero Impairment Assessment
 Qualitative factors for management to consider prior
  to the performance of the two-step impairment test
  include the following:
    Macroeconomic conditions
    Industry conditions
    Cost factors
    Overall financial performance
    Entity-specific events
The Step-Zero Impairment Assessment – cont’d
 If qualitative assessment indicates that “it is more
   likely than not” that the fair value of a reporting unit
   is less than its carrying amount,
       the entity is required to proceed to Step 1 of the
       goodwill impairment test
  (“More likely than not” is defined as “a likelihood of
                      more than 50 percent”)
Macroeconomic Conditions
   A deterioration in general economic conditions
   Limitations on accessing capital
   Fluctuations in foreign exchange rates
   Other developments in equity and credit markets
General Economic Conditions?
National Economic Conditions
According to Decosimo’s National Economic Conditions:
    In November 2011, the FOMC predicted that real GDP growth would have
    a central tendency between 1.6% and 1.7%, between 2.5% and 2.9%, and
    between 3.0% and 3.5% during 2011, 2012, and 2013, respectively. In its
    longer run projection, the FOMC predicted that real GDP growth would
    have a central tendency between 2.4% and 2.7% (consistent with its
    previous longer-run projection).
    The third quarter Philadelphia Federal Reserve Survey of Professional
    Forecasters (the “Philly Survey”) predicts real GDP growth of 1.6%, 1.8%,
    1.9%, and 2.1% (SAAR) for the fourth quarter of 2011 and the first, second
    and third quarters of 2012, respectively. The Philly Survey further
    predicts annual GDP growth of 2.0%, 2.1% during 2011 and 2012,
    respectively.
    The September Wall Street Journal Survey of Economic Forecasters (the
    “WSJ Survey”) predicts growth rates of 2.1%, 2.1%, 2.4%, and 2.6%
    (SAAR), for the fourth quarter of 2011 and the first, second, and third
    quarters of 2012, respectively. The WSJ Survey projects GDP will
    experience annual growth rates of 1.5% and 2.4% in 2011 and 2012,
    respectively.
Other Economic Resources
 TENNESSEE BUSINESS AND ECONOMIC OUTLOOK,
  Center for Business and Economic Research,
  College of Business Administration, The University
  of Tennessee, Knoxville, Tennessee
 Federal Reserve (various information available at
  www.federalreserve.gov)
 U.S. Department of Commerce, Bureau of Economic
  Analysis
 U.S. Census Bureau
 Local Chamber of Commerce websites
Industry Conditions
 a deterioration in the market in which an entity
  operates
 increased competition
 a decline in market-dependent multiples or metrics
  (absolute or relative)
 change in the market for the entity’s products or
  services
 a regulatory or political development
Market Deterioration?
IBISWorld Revenue Growth Predictions
Industry                              Growth 06/07-   Growth 11/12-
                                              11/12           16/17
Chemical product manufacturing                -1.9%           1.7%
Inorganic chemical manufacturing              2.2%            2.3%
Primary care physicians                       2.2%            4.2%
Specialist physicians                         2.8%            5.5%
Diagnostic and medical laboratories           2.0%            4.5%
Aluminum manufacturing                        -5.1%           4.7%
Wiring device manufacturing                   -3.2%           3.3%
Printing                                      -5.5%          -1.8%
Fast food restaurants                         -1.6%           2.0%
Natural gas distribution                      -2.1%           5.8%
Regulatory or Political Developments
Cost Factors
 increases in raw materials cost
 increased labor cost
 other significant cost increases
Production Cost Expectations?
Production Cost Trends
                                                  Average Annual Price of Crude Oil
                                                            % Growth                    Historical                 IBISWorld

                      $140                                                                                                                                       60%

                      $120                                                                                                                                       45%
 Price pe r Barre l


                      $100                                                                                                                                       30%


                                                                                                                                                                        Grow th
                      $80                                                                                                                                        15%

                      $60                                                                                                                                        0%

                      $40                                                                                                                                        -15%

                      $20                                                                                                                                        -30%

                       $0                                                                                                                                        -45%


                                                                                                                                         2015*
                                                                                                                                                 2016*
                                                                                                                                                         2017*
                                                                                                                 2012*
                                                                                                                         2013*
                                                                                                                                 2014*
                             2000
                                    2001


                                                                       2006
                                                                              2007
                                                                                     2008
                                                                                            2009
                                                                                                   2010
                                           2002
                                                  2003
                                                         2004
                                                                2005


                                                                                                          2011
                                                                                     Ye ar
Overall Financial Performance
 negative or declining cash flows
 a decline in actual or planned revenue or earnings
  compared with actual and projected results of prior
  periods
What’s Happening with EBITDA?
Entity-Specific Events
   changes in management or key personnel
   changes in strategy or customers
   contemplation of bankruptcy
   litigation issues, etc.
Realistic Assessment of the Effects of a Change in Strategy?
Other Relevant Events and Circumstances to
Consider

 A change in the composition or carrying amount of a
  RU’s net assets
 An expectation of selling or disposing all, or a
  portion of a reporting unit
 If applicable, a sustained decrease in share price
  (absolute or relative)
Reaching a Conclusion
The desired result of the qualitative assessment is to
  reach a conclusion as to whether it is more likely
  than not that the fair value of a reporting unit is less
  than its carrying amount.
To what extent could each of the adverse events or
  circumstances identified affect the reporting unit’s
  fair value or the carrying value of its net assets?
The End Result
If after assessing the totality of events and
   circumstances described,
    an entity decides
    “it is not more likely than not”
    that the fair value of a RU is less than its carrying
   amount,
    then the first and second steps of the goodwill
   impairment test are unnecessary
Take Aways
 Qualitative assessment ≠ no assessment
    Document, document, document
 Many free resources are available to aid in the
  assessment
 Decosimo advisors can help you research industry
  trends, transaction multiples and guideline public
  company multiples
 If a goodwill impairment test is necessary, Decosimo
  provides that service (for our audit clients, we will be
  glad to refer you to an independent firm)
Shannon Farr
CPA, ABV, CFF
Valuation Manager | shannonfarr@decosimo.com

Shannon Farr is a valuation manager with more than 15 years
of accounting experience. Her practice has focused on
business valuation and litigation since 2004. She is accredited
in business valuation (ABV) and also certified in financial
forensics (CFF). Shannon performs fair value for financial
reporting valuations to be used in purchase price allocations
and goodwill impairment testing. Her litigation support
experience has been used in numerous marital dissolution
cases as well as contract and shareholder disputes. Shannon
provides expert witness testimony, as well as serving the court
as Special Master.

Step Zero: New Qualitative Assessment Allowed for Assessing Goodwill

  • 1.
    A Global Reachwith a Local Perspective 2012 DECOSIMO ACCOUNTING SEMINAR www.decosimo.com Step Zero: New Qualitative Assessment Allowed for Assessing Goodwill SHANNON FARR, CPA, ABV, CFF Valuation Manager, Decosimo Advisory Services
  • 3.
    Who? Where? Why? What? When? Who? The Financial Accounting Standards Board (FASB) What? Accounting Standards Update No. 2011-08, Testing Goodwill for Impairment When? Issued September 2011, effective for annual and interim goodwill impairment tests performed for fiscal years beginning after December 15, 2011 Where? All entities, both public and nonpublic, that have goodwill reported in their financial statements Why? To address concerns “about the cost and complexity of performing the first step of the two-step goodwill impairment test required under ASC Topic 350”
  • 4.
    An entity nowhas the option to first assess qualitative factors to determine whether the “existence of events or circumstances leads to a determination that it is more likely than not that the fair value of a reporting unit is less than its carrying amount.”
  • 5.
    The Step-Zero ImpairmentAssessment  Qualitative factors for management to consider prior to the performance of the two-step impairment test include the following:  Macroeconomic conditions  Industry conditions  Cost factors  Overall financial performance  Entity-specific events
  • 6.
    The Step-Zero ImpairmentAssessment – cont’d  If qualitative assessment indicates that “it is more likely than not” that the fair value of a reporting unit is less than its carrying amount, the entity is required to proceed to Step 1 of the goodwill impairment test (“More likely than not” is defined as “a likelihood of more than 50 percent”)
  • 7.
    Macroeconomic Conditions  A deterioration in general economic conditions  Limitations on accessing capital  Fluctuations in foreign exchange rates  Other developments in equity and credit markets
  • 8.
  • 9.
    National Economic Conditions Accordingto Decosimo’s National Economic Conditions: In November 2011, the FOMC predicted that real GDP growth would have a central tendency between 1.6% and 1.7%, between 2.5% and 2.9%, and between 3.0% and 3.5% during 2011, 2012, and 2013, respectively. In its longer run projection, the FOMC predicted that real GDP growth would have a central tendency between 2.4% and 2.7% (consistent with its previous longer-run projection). The third quarter Philadelphia Federal Reserve Survey of Professional Forecasters (the “Philly Survey”) predicts real GDP growth of 1.6%, 1.8%, 1.9%, and 2.1% (SAAR) for the fourth quarter of 2011 and the first, second and third quarters of 2012, respectively. The Philly Survey further predicts annual GDP growth of 2.0%, 2.1% during 2011 and 2012, respectively. The September Wall Street Journal Survey of Economic Forecasters (the “WSJ Survey”) predicts growth rates of 2.1%, 2.1%, 2.4%, and 2.6% (SAAR), for the fourth quarter of 2011 and the first, second, and third quarters of 2012, respectively. The WSJ Survey projects GDP will experience annual growth rates of 1.5% and 2.4% in 2011 and 2012, respectively.
  • 10.
    Other Economic Resources TENNESSEE BUSINESS AND ECONOMIC OUTLOOK, Center for Business and Economic Research, College of Business Administration, The University of Tennessee, Knoxville, Tennessee  Federal Reserve (various information available at www.federalreserve.gov)  U.S. Department of Commerce, Bureau of Economic Analysis  U.S. Census Bureau  Local Chamber of Commerce websites
  • 11.
    Industry Conditions  adeterioration in the market in which an entity operates  increased competition  a decline in market-dependent multiples or metrics (absolute or relative)  change in the market for the entity’s products or services  a regulatory or political development
  • 12.
  • 13.
    IBISWorld Revenue GrowthPredictions Industry Growth 06/07- Growth 11/12- 11/12 16/17 Chemical product manufacturing -1.9% 1.7% Inorganic chemical manufacturing 2.2% 2.3% Primary care physicians 2.2% 4.2% Specialist physicians 2.8% 5.5% Diagnostic and medical laboratories 2.0% 4.5% Aluminum manufacturing -5.1% 4.7% Wiring device manufacturing -3.2% 3.3% Printing -5.5% -1.8% Fast food restaurants -1.6% 2.0% Natural gas distribution -2.1% 5.8%
  • 14.
  • 15.
    Cost Factors  increasesin raw materials cost  increased labor cost  other significant cost increases
  • 16.
  • 17.
    Production Cost Trends Average Annual Price of Crude Oil % Growth Historical IBISWorld $140 60% $120 45% Price pe r Barre l $100 30% Grow th $80 15% $60 0% $40 -15% $20 -30% $0 -45% 2015* 2016* 2017* 2012* 2013* 2014* 2000 2001 2006 2007 2008 2009 2010 2002 2003 2004 2005 2011 Ye ar
  • 18.
    Overall Financial Performance negative or declining cash flows  a decline in actual or planned revenue or earnings compared with actual and projected results of prior periods
  • 19.
  • 20.
    Entity-Specific Events  changes in management or key personnel  changes in strategy or customers  contemplation of bankruptcy  litigation issues, etc.
  • 21.
    Realistic Assessment ofthe Effects of a Change in Strategy?
  • 22.
    Other Relevant Eventsand Circumstances to Consider  A change in the composition or carrying amount of a RU’s net assets  An expectation of selling or disposing all, or a portion of a reporting unit  If applicable, a sustained decrease in share price (absolute or relative)
  • 23.
    Reaching a Conclusion Thedesired result of the qualitative assessment is to reach a conclusion as to whether it is more likely than not that the fair value of a reporting unit is less than its carrying amount. To what extent could each of the adverse events or circumstances identified affect the reporting unit’s fair value or the carrying value of its net assets?
  • 24.
    The End Result Ifafter assessing the totality of events and circumstances described, an entity decides “it is not more likely than not” that the fair value of a RU is less than its carrying amount, then the first and second steps of the goodwill impairment test are unnecessary
  • 25.
    Take Aways  Qualitativeassessment ≠ no assessment  Document, document, document  Many free resources are available to aid in the assessment  Decosimo advisors can help you research industry trends, transaction multiples and guideline public company multiples  If a goodwill impairment test is necessary, Decosimo provides that service (for our audit clients, we will be glad to refer you to an independent firm)
  • 26.
    Shannon Farr CPA, ABV,CFF Valuation Manager | shannonfarr@decosimo.com Shannon Farr is a valuation manager with more than 15 years of accounting experience. Her practice has focused on business valuation and litigation since 2004. She is accredited in business valuation (ABV) and also certified in financial forensics (CFF). Shannon performs fair value for financial reporting valuations to be used in purchase price allocations and goodwill impairment testing. Her litigation support experience has been used in numerous marital dissolution cases as well as contract and shareholder disputes. Shannon provides expert witness testimony, as well as serving the court as Special Master.