Download to read offline
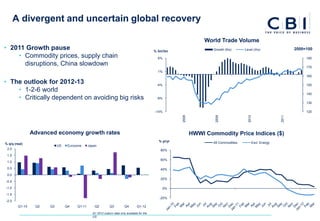
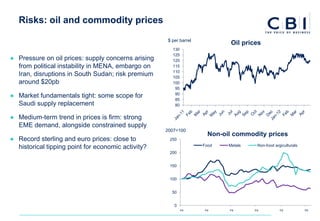
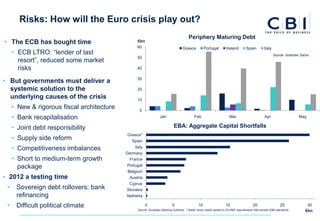

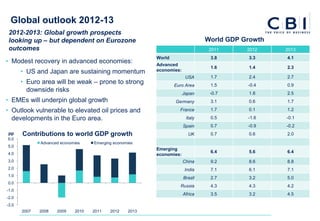
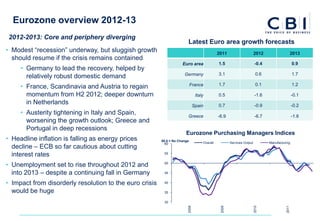
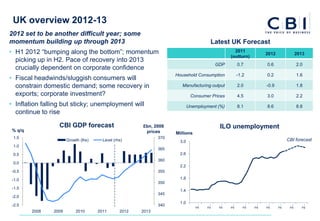
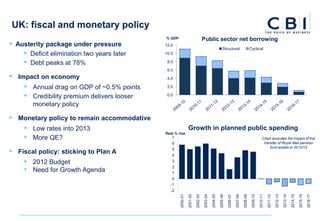
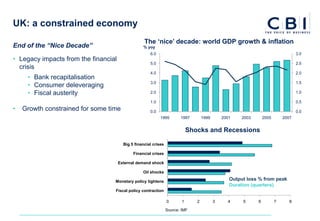
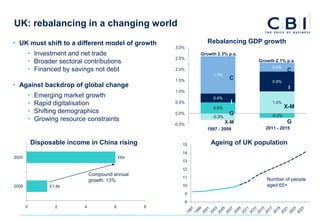

The document discusses the economic outlook and challenges for businesses, highlighting a divergent and uncertain global recovery influenced by various factors including commodity prices, supply chain disruptions, and the eurozone crisis. It indicates that while advanced economies are experiencing modest recovery, emerging market economies are expected to underpin global growth, although risks remain from oil prices and political tensions. The UK faces significant challenges with austerity measures impacting growth and increasing unemployment, requiring a shift towards a new growth model.