Download to read offline


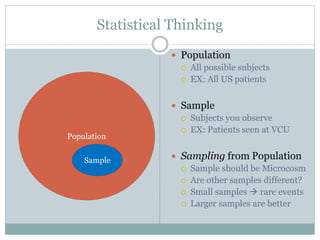


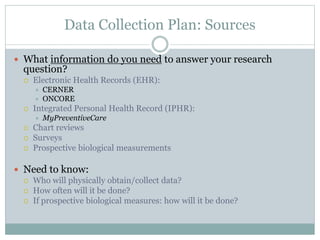
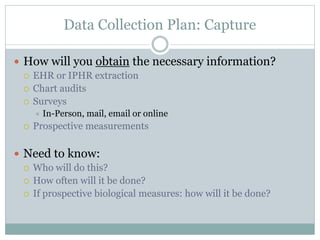
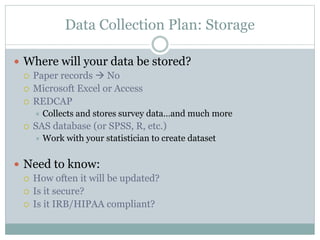

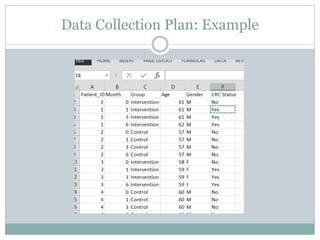


The document provides an overview of quantitative data analysis methods for medical research. It discusses statistical thinking, analytic methods including determining appropriate statistical tests based on the type of data and research question. It also covers designing a data collection plan, including determining data sources, capture and storage, as well as sample size determination. The key topics covered are choosing the right statistical tests, developing a robust data collection process, and ensuring adequate sample sizes.