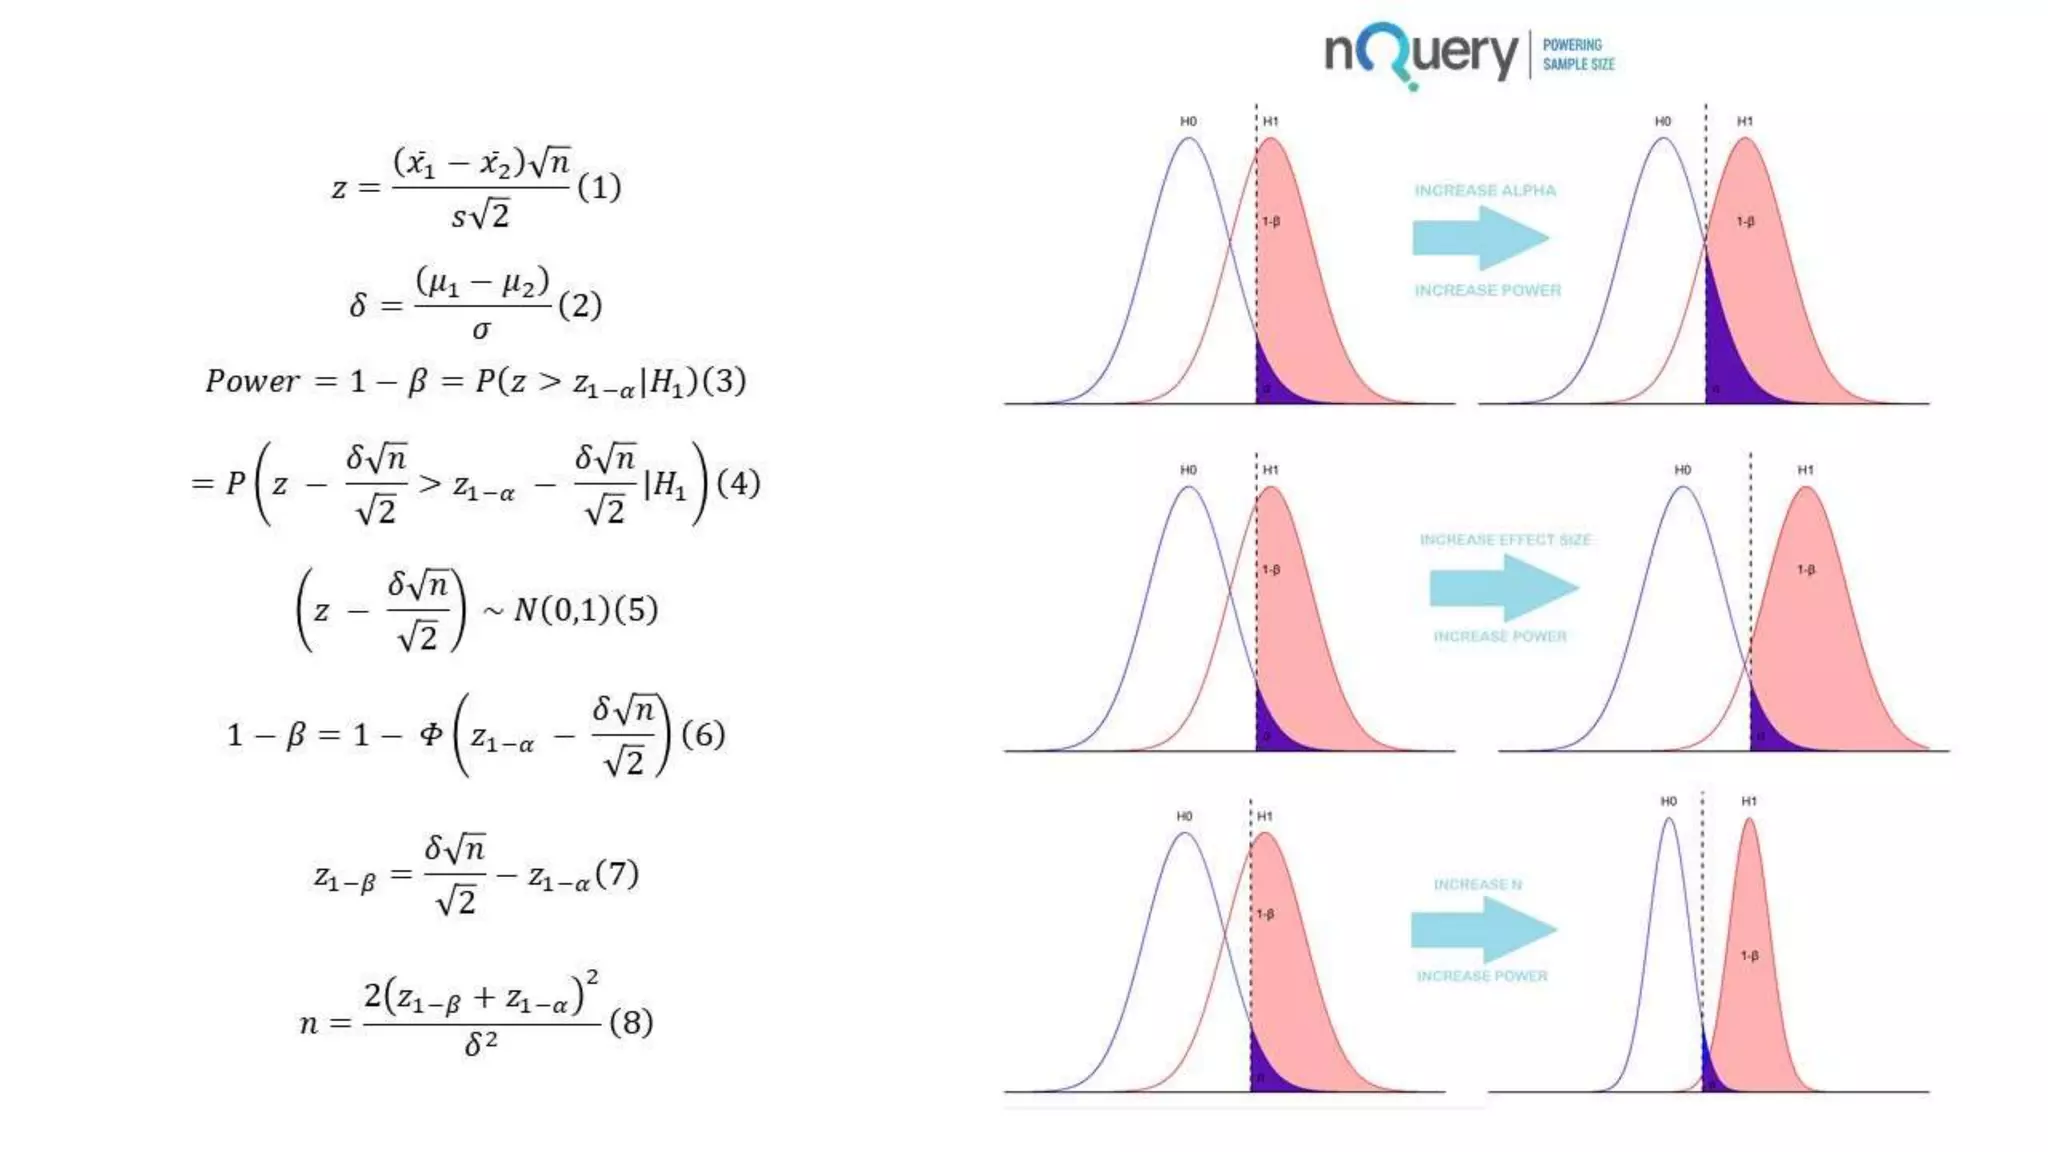
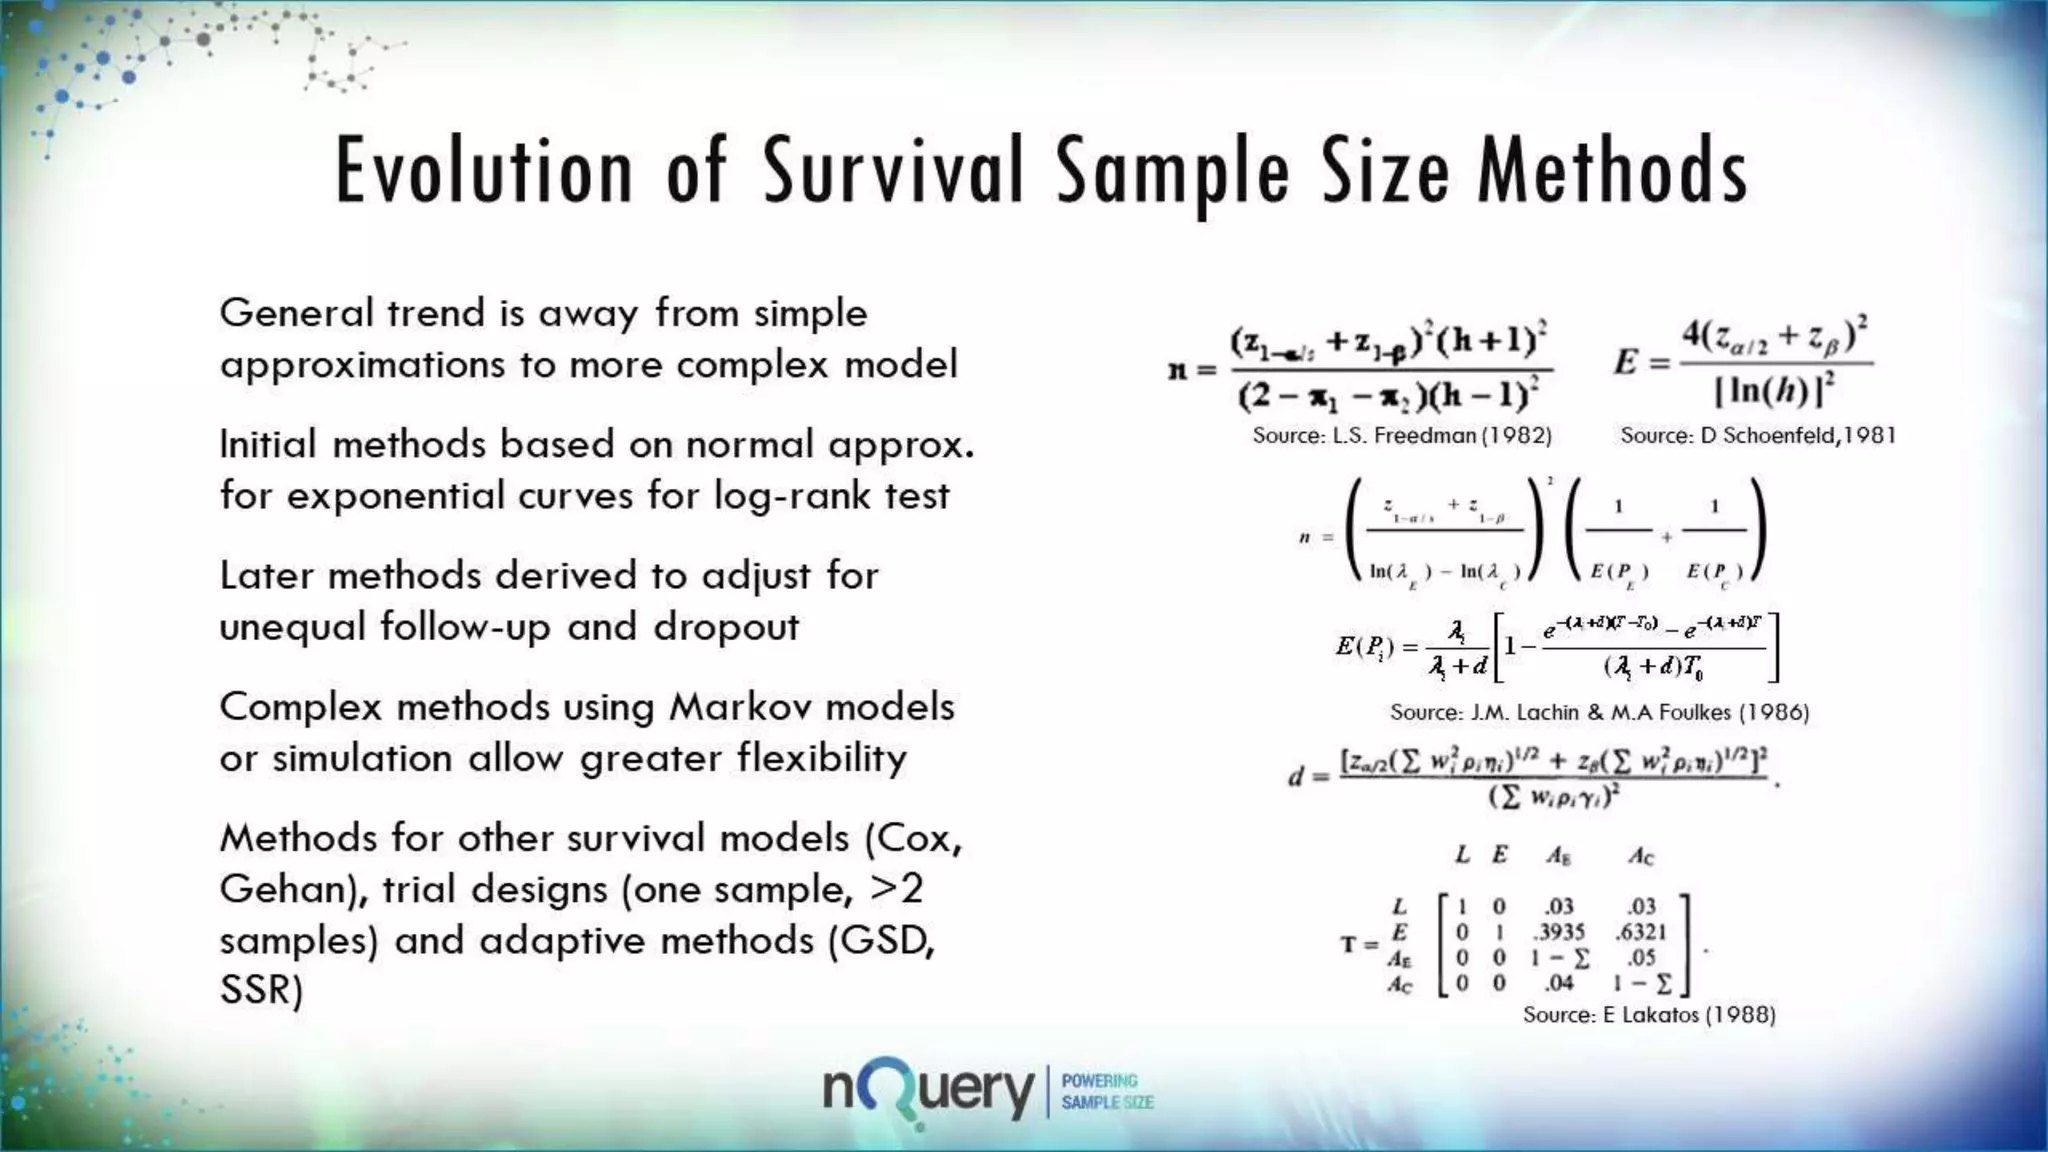
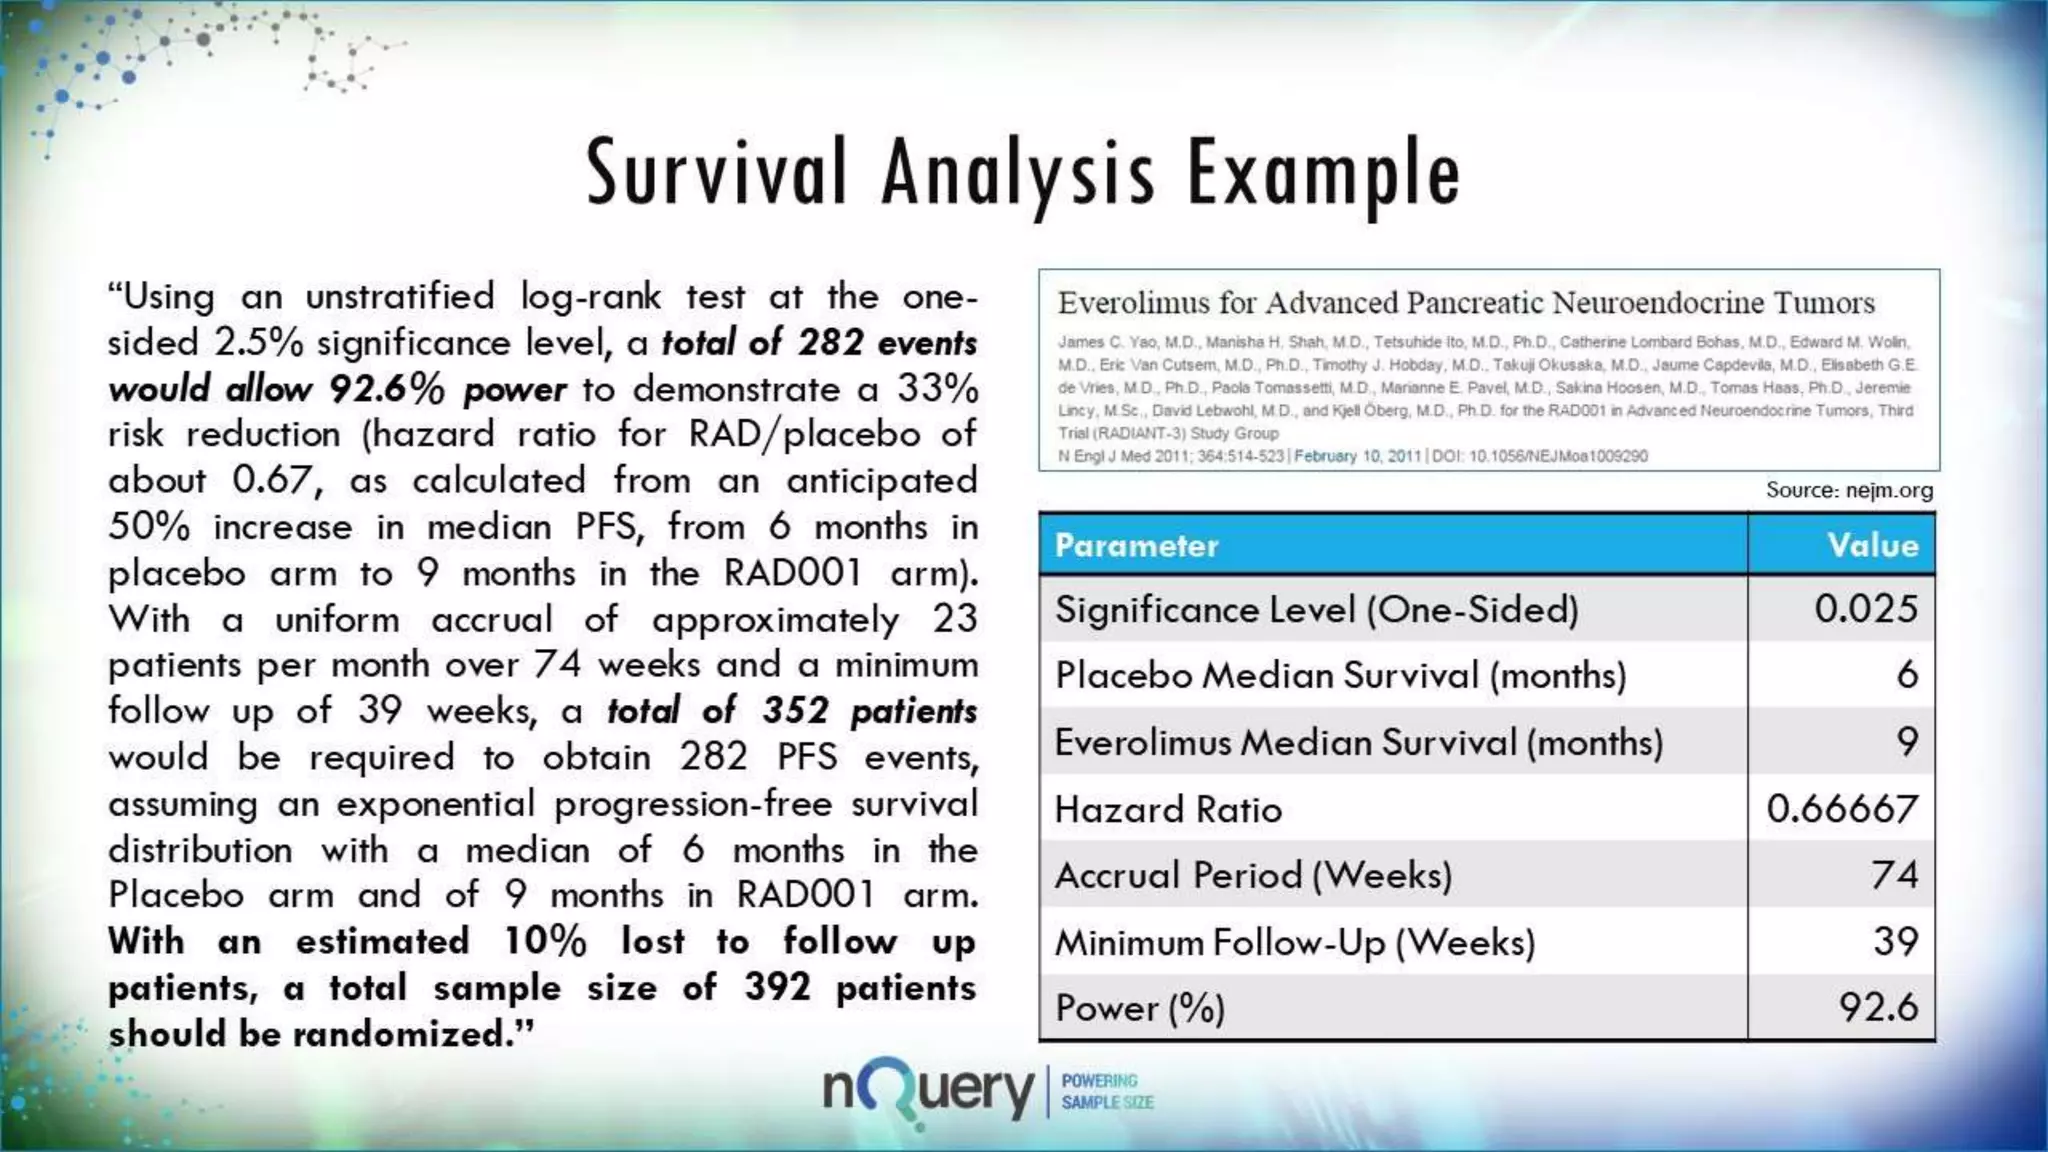
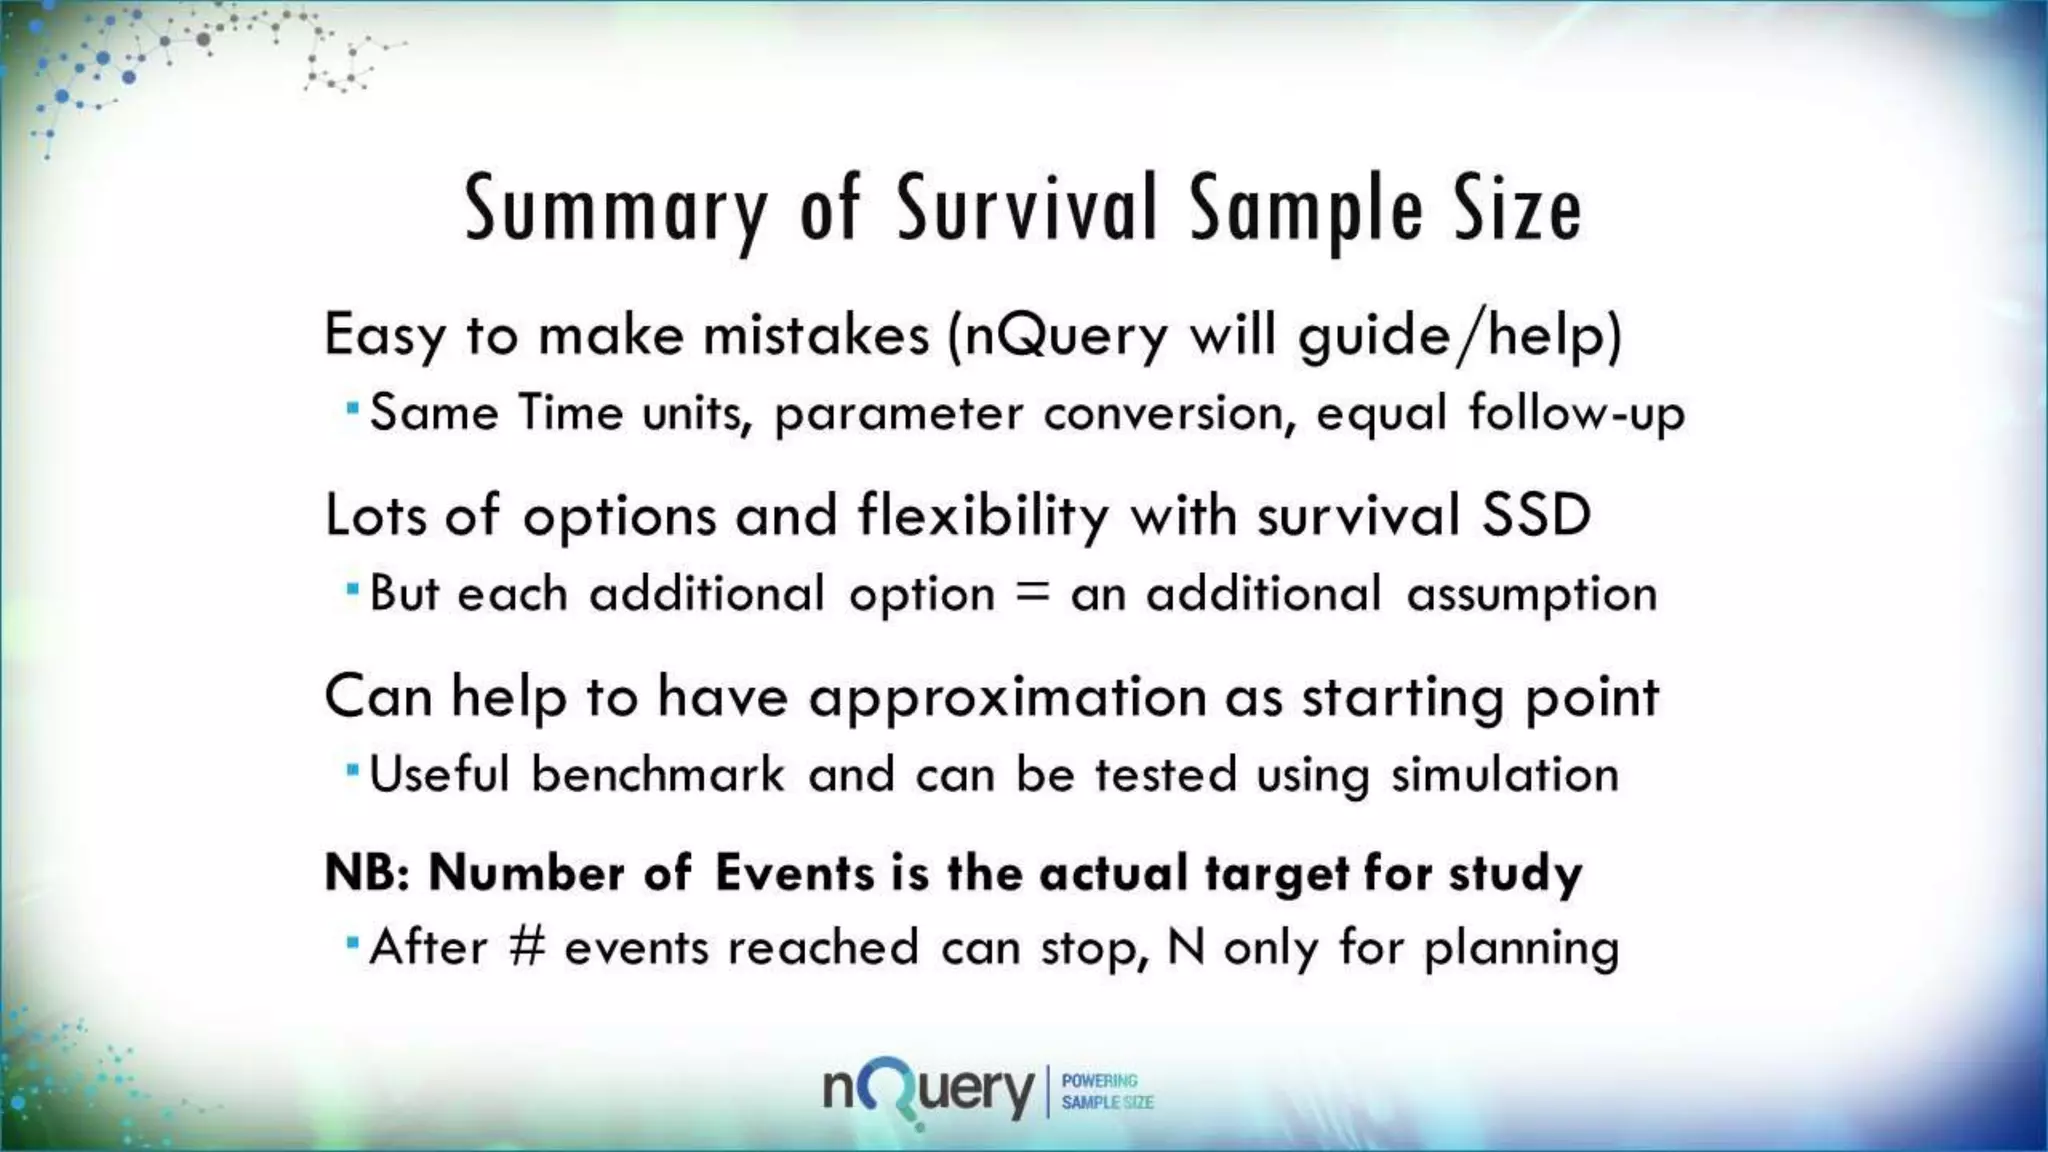
HOSTED BY:
Ronan Fitzpatrick
 Head of
Statistics
 FDA Guest
Speaker
 nQuery
Lead
Researcher
 Guest
Lecturer
Webinar Presenter
Webinar Content
CONTEN
T>
Introducing Sample Size Determination
Sample Size for Survival Analysis
Background
Discussion and Q&A
Survival Analysis Demonstration
PART I
Sample Size
Determination
What is Sample Size
Estimation?
The process for finding the appropriate
sample size for your study.
The most common metric for this is
statistical power
The power is the probability that the
study will be able to detect a true effect
of a specified size.
In other words, Power is the probability of
rejecting the null hypothesis when it is
false
𝑧 =
𝑥1 − 𝑥2 𝑛
𝑠 2
1
𝛿 =
𝜇1 − 𝜇2
𝜎
2
𝑃𝑜𝑤𝑒𝑟 = 1 − 𝛽 = 𝑃 𝑧 > 𝑧1−𝛼 𝐻1 3
= 𝑃 𝑧 −
𝛿 𝑛
2
> 𝑧1−𝛼 −
𝛿 𝑛
2
|𝐻1 4
𝑧 −
𝛿 𝑛
2
~ 𝑁 0,1 5
1 − 𝛽 = 1 − 𝛷 𝑧1−𝛼 −
𝛿 𝑛
2
6
𝑧1−𝛽 =
𝛿 𝑛
2
− 𝑧1−𝛼 7
𝑛 =
2 𝑧1−𝛽 + 𝑧1−𝛼
2
𝛿2
8
Why Estimate Sample Size?
Crucial to Arrive at Valid Conclusions
Reduce Chance of Large Errors (Type S/M
Errors)
Balance Ethical and Practical
Considerations
Both how many needed and how many not
needed!
Standard Trial Design Requirement
EMA, FDA, Nature Group Publishing
Guidelines etc.
5 Essential Steps for Sample Size
1 Formulate the study
Study question, primary outcome,
statistical method
2
Specify analysis
parameters
Standard deviation, ICC, dispersion
3
Specify the Effect Size
for Test
Expected/targeted difference or ratio
4
Compute Sample Size
N for specified power or power for
PART II
Survival Sample
Size Determination
Sample Size for Survival
Analysis
Survival Analysis is about the
expected duration of time to an
event
 Methods like log-rank test & Cox
Model
Power is related to the number
of events NOT the sample size
 Sample Size = Subjects to get no.
of events
Flexibility expected in survival
analysis methods and
estimation
 Sample Size methods need to
follow suit but can make mistakes
Source: SEER, NCI
Evolution of Survival Sample Size
Methods
General trend is away from
simple approximations to more
complex model
Initial methods based on normal
approx. for exponential curves
for log-rank test
Later methods derived to adjust
for unequal follow-up and
dropout
Complex methods using Markov
models or simulation allow
greater flexibility
Methods for other survival
models (Cox, Gehan), trial
Source: D Schoenfeld,1981
Source: J.M. Lachin & M.A Foulkes (1986)
Source: E Lakatos (1988)
Source: L.S. Freedman (1982)
Considerations in Survival Sample
Size
What is the expected survival curve(s) in the
group(s)?
Assume parametric approximation? Which test
appropriate?
Effect of unequal follow-up due to accrual
period?
What accrual pattern to assume? Set max follow-up
same for all?
How to deal with expected dropouts or
censoring?
Simple loss-to-follow up or integrate dropout
PART III
Survival Analysis
Demonstration
Demo Software: nQuery
Over 20 Years of Experience in Sample Size
Determination and Power Analysis for
Clinical Trials
Latest Release has Methods for ~250 Trial
Designs
Used by 45/50 Top Pharma and Biotech
Companies
nQuery’s 20 Years of Success is Based on
1. Being Easy to Use and Accessible to All Users
2. Being Fully Validated and an Industry
Survival Analysis Example
“Using an unstratified log-rank test at the
one-sided 2.5% significance level, a total
of 282 events would allow 92.6% power
to demonstrate a 33% risk reduction
(hazard ratio for RAD/placebo of about
0.67, as calculated from an anticipated
50% increase in median PFS, from 6
months in placebo arm to 9 months in
the RAD001 arm). With a uniform accrual
of approximately 23 patients per month
over 74 weeks and a minimum follow up
of 39 weeks, a total of 352 patients
would be required to obtain 282 PFS
events, assuming an exponential
progression-free survival distribution
with a median of 6 months in the Placebo
arm and of 9 months in RAD001 arm.
With an estimated 10% lost to follow up
patients, a total sample size of 392
Source: nejm.org
Parameter Value
Significance Level (One-Sided) 0.025
Placebo Median Survival
(months)
6
Everolimus Median Survival
(months)
9
Hazard Ratio 0.6666
7
Accrual Period (Weeks) 74
Minimum Follow-Up (Weeks) 39
PART IV
Discussion and
Q&A
Summary of Survival Sample
Size
Easy to make mistakes (nQuery will
guide/help)
Same Time units, parameter conversion, equal
follow-up
Lots of options and flexibility with
survival SSD
But each additional option = an additional
assumption
Can help to have approximation as
starting point
Useful benchmark and can be tested using
nQuery Advanced Overview
nQuery Advanced is a
complete overhaul of
nQuery
Integrates nQuery +
nTerim into a modern
application
Number of UX
improvements
including for IQ/OQ
Added new tables
related to survival &
Bayesian analysis
New Survival
Tables
New Bayes Tables
Bonus Tables
- n-of-1 Trials
- Gamma Regression
Future Plans
Next Release: April
2018
Focus on tables
related to:
1. Epidemiology
2. Non-inferiority &
Equivalence testing
3. Correlation &
Diagnostic Screening
Measures
Areas of focus for
Survival Analysis:
1. Adaptive Designs
2. More Flexible
Methods
3. Improved Simulation
4. Alternative Rank
Tests
5. Assurance
Q&A
Any Questions?
For further details about
anything discussed
today,
email us at:
info@statsols.com
Thanks for listening!
References
Freedman, L. S. (1982). Tables of the number of patients required in clinical trials using
the logrank test. Statistics in medicine, 1(2), 121-129.
Schoenfeld, D. A. (1983). Sample-size formula for the proportional-hazards regression
model. Biometrics, 499-503.
Lachin, J. M., & Foulkes, M. A. (1986). Evaluation of sample size and power for analyses
of survival with allowance for nonuniform patient entry, losses to follow-up,
noncompliance, and stratification. Biometrics, 507-519.
Lakatos, E. (1988). Sample sizes based on the log-rank statistic in complex clinical
trials. Biometrics, 229-241.
Lee, E. T., & Wang, J. (2003). Statistical methods for survival data analysis (Vol. 476).
John Wiley & Sons.
Yao, J. C., Shah, M. H., Ito, T., Bohas, C. L., Wolin, E. M., Van Cutsem, E., ... &
Tomassetti, P. (2011). Everolimus for advanced pancreatic neuroendocrine tumors. New
England Journal of Medicine, 364(6), 514-523.

Power and sample size calculations for survival analysis webinar Slides

  • 2.
    HOSTED BY: Ronan Fitzpatrick Head of Statistics  FDA Guest Speaker  nQuery Lead Researcher  Guest Lecturer Webinar Presenter
  • 3.
    Webinar Content CONTEN T> Introducing SampleSize Determination Sample Size for Survival Analysis Background Discussion and Q&A Survival Analysis Demonstration
  • 4.
  • 5.
    What is SampleSize Estimation? The process for finding the appropriate sample size for your study. The most common metric for this is statistical power The power is the probability that the study will be able to detect a true effect of a specified size. In other words, Power is the probability of rejecting the null hypothesis when it is false
  • 6.
    𝑧 = 𝑥1 −𝑥2 𝑛 𝑠 2 1 𝛿 = 𝜇1 − 𝜇2 𝜎 2 𝑃𝑜𝑤𝑒𝑟 = 1 − 𝛽 = 𝑃 𝑧 > 𝑧1−𝛼 𝐻1 3 = 𝑃 𝑧 − 𝛿 𝑛 2 > 𝑧1−𝛼 − 𝛿 𝑛 2 |𝐻1 4 𝑧 − 𝛿 𝑛 2 ~ 𝑁 0,1 5 1 − 𝛽 = 1 − 𝛷 𝑧1−𝛼 − 𝛿 𝑛 2 6 𝑧1−𝛽 = 𝛿 𝑛 2 − 𝑧1−𝛼 7 𝑛 = 2 𝑧1−𝛽 + 𝑧1−𝛼 2 𝛿2 8
  • 7.
    Why Estimate SampleSize? Crucial to Arrive at Valid Conclusions Reduce Chance of Large Errors (Type S/M Errors) Balance Ethical and Practical Considerations Both how many needed and how many not needed! Standard Trial Design Requirement EMA, FDA, Nature Group Publishing Guidelines etc.
  • 8.
    5 Essential Stepsfor Sample Size 1 Formulate the study Study question, primary outcome, statistical method 2 Specify analysis parameters Standard deviation, ICC, dispersion 3 Specify the Effect Size for Test Expected/targeted difference or ratio 4 Compute Sample Size N for specified power or power for
  • 9.
  • 10.
    Sample Size forSurvival Analysis Survival Analysis is about the expected duration of time to an event  Methods like log-rank test & Cox Model Power is related to the number of events NOT the sample size  Sample Size = Subjects to get no. of events Flexibility expected in survival analysis methods and estimation  Sample Size methods need to follow suit but can make mistakes Source: SEER, NCI
  • 11.
    Evolution of SurvivalSample Size Methods General trend is away from simple approximations to more complex model Initial methods based on normal approx. for exponential curves for log-rank test Later methods derived to adjust for unequal follow-up and dropout Complex methods using Markov models or simulation allow greater flexibility Methods for other survival models (Cox, Gehan), trial Source: D Schoenfeld,1981 Source: J.M. Lachin & M.A Foulkes (1986) Source: E Lakatos (1988) Source: L.S. Freedman (1982)
  • 12.
    Considerations in SurvivalSample Size What is the expected survival curve(s) in the group(s)? Assume parametric approximation? Which test appropriate? Effect of unequal follow-up due to accrual period? What accrual pattern to assume? Set max follow-up same for all? How to deal with expected dropouts or censoring? Simple loss-to-follow up or integrate dropout
  • 13.
  • 14.
    Demo Software: nQuery Over20 Years of Experience in Sample Size Determination and Power Analysis for Clinical Trials Latest Release has Methods for ~250 Trial Designs Used by 45/50 Top Pharma and Biotech Companies nQuery’s 20 Years of Success is Based on 1. Being Easy to Use and Accessible to All Users 2. Being Fully Validated and an Industry
  • 15.
    Survival Analysis Example “Usingan unstratified log-rank test at the one-sided 2.5% significance level, a total of 282 events would allow 92.6% power to demonstrate a 33% risk reduction (hazard ratio for RAD/placebo of about 0.67, as calculated from an anticipated 50% increase in median PFS, from 6 months in placebo arm to 9 months in the RAD001 arm). With a uniform accrual of approximately 23 patients per month over 74 weeks and a minimum follow up of 39 weeks, a total of 352 patients would be required to obtain 282 PFS events, assuming an exponential progression-free survival distribution with a median of 6 months in the Placebo arm and of 9 months in RAD001 arm. With an estimated 10% lost to follow up patients, a total sample size of 392 Source: nejm.org Parameter Value Significance Level (One-Sided) 0.025 Placebo Median Survival (months) 6 Everolimus Median Survival (months) 9 Hazard Ratio 0.6666 7 Accrual Period (Weeks) 74 Minimum Follow-Up (Weeks) 39
  • 16.
  • 17.
    Summary of SurvivalSample Size Easy to make mistakes (nQuery will guide/help) Same Time units, parameter conversion, equal follow-up Lots of options and flexibility with survival SSD But each additional option = an additional assumption Can help to have approximation as starting point Useful benchmark and can be tested using
  • 18.
    nQuery Advanced Overview nQueryAdvanced is a complete overhaul of nQuery Integrates nQuery + nTerim into a modern application Number of UX improvements including for IQ/OQ Added new tables related to survival & Bayesian analysis New Survival Tables New Bayes Tables Bonus Tables - n-of-1 Trials - Gamma Regression
  • 19.
    Future Plans Next Release:April 2018 Focus on tables related to: 1. Epidemiology 2. Non-inferiority & Equivalence testing 3. Correlation & Diagnostic Screening Measures Areas of focus for Survival Analysis: 1. Adaptive Designs 2. More Flexible Methods 3. Improved Simulation 4. Alternative Rank Tests 5. Assurance
  • 20.
    Q&A Any Questions? For furtherdetails about anything discussed today, email us at: info@statsols.com Thanks for listening!
  • 21.
    References Freedman, L. S.(1982). Tables of the number of patients required in clinical trials using the logrank test. Statistics in medicine, 1(2), 121-129. Schoenfeld, D. A. (1983). Sample-size formula for the proportional-hazards regression model. Biometrics, 499-503. Lachin, J. M., & Foulkes, M. A. (1986). Evaluation of sample size and power for analyses of survival with allowance for nonuniform patient entry, losses to follow-up, noncompliance, and stratification. Biometrics, 507-519. Lakatos, E. (1988). Sample sizes based on the log-rank statistic in complex clinical trials. Biometrics, 229-241. Lee, E. T., & Wang, J. (2003). Statistical methods for survival data analysis (Vol. 476). John Wiley & Sons. Yao, J. C., Shah, M. H., Ito, T., Bohas, C. L., Wolin, E. M., Van Cutsem, E., ... & Tomassetti, P. (2011). Everolimus for advanced pancreatic neuroendocrine tumors. New England Journal of Medicine, 364(6), 514-523.

Editor's Notes

  • #6 Appropriate would usually be defined in terms of preventing too low sample size, though too high has practical costs. Other metrics include confidence interval width (precision), cost based and Bayesian methods. Important to note that you need to specify an exact value for the effect even though alternative hypothesis acceptance space can technically can be any non-null hypothesis point value (commonly any non-zero value) Can be though of as the area of the alternative pdf which is contained within the rejection region of the null hypothesis. Interesting to note that power of 50% is equivalent to lower limit of CI being equal to zero for zero-based z-statistic null
  • #8 Point 1: http://rsos.royalsocietypublishing.org/content/1/3/140216 -> Screening problem analogy. Type S Error = Sign Error i.e. sign of estimate is different than actual population value Type M Error = Magnitude Error i.e. estimate is order of magnitude different than actual value Point 2: Know we have only 100 subjects available. Need to know what power will this give us, i.e. is there enough power to justify even doing the study. Stage III clinical trials constitute 90% of trial costs, vital to reduce waste and ensure can fulfil goal. Point 3: Sample Size requirements described in ICH Efficacy Guidelines 9: STATISTICAL PRINCIPLES FOR CLINICAL TRIALS See FDA/NIH draft protocol template here: http://osp.od.nih.gov/sites/default/files/Protocol_Template_05Feb2016_508.pdf (Section 10.5) Nature Statistical Checklist: http://www.nature.com/nature/authors/gta/Statistical_checklist.doc Point 4: In Cohen’s (1962) seminal power analysis of the journal of Abnormal and Social Psychology he concluded that over half of the published studies were insufficiently powered to result in statistical significance for the main hypothesis. Many journals (e.g. Nature) now require that authors submit power estimates for their studies. Power/Sample size one of areas highlighted when discussing “crisis of reproducibility” (Ioannidis). Relatively easy fix compared to finding p-hacking etc.
  • #9 More detail available on our website via a whitepaper.
  • #11 Alternative linear rank tests include Tahone-Ware, Gehan. Planned for next release circa. Summer 2016. Sample size mainly asking “How many subjects needed to attain X events?” Most methods optimised for exponential survival but could enter piece-wise linear approximation of probability at time t for other distributions (e.g. Weibull) Analytic vs Simulation = Much wider debate. Usually have ease of use vs flexibility trade-off. Simulation better suited to programming environment e.g. R
  • #18 Appropriate would usually be defined in terms of preventing too low sample size, though too high has practical costs. Other metrics include confidence interval width (precision), cost based and Bayesian methods. Important to note that you need to specify an exact value for the effect even though alternative hypothesis acceptance space can technically can be any non-null hypothesis point value (commonly any non-zero value) Can be though of as the area of the alternative pdf which is contained within the rejection region of the null hypothesis. Interesting to note that power of 50% is equivalent to lower limit of CI being equal to zero for zero-based z-statistic null
  • #19 Alternative linear rank tests include Tahone-Ware, Gehan. Planned for next release circa. Summer 2016. Sample size mainly asking “How many subjects needed to attain X events?” Most methods optimised for exponential survival but could enter piece-wise linear approximation of probability at time t for other distributions (e.g. Weibull) Analytic vs Simulation = Much wider debate. Usually have ease of use vs flexibility trade-off. Simulation better suited to programming environment e.g. R