COURSE CONTENT
• BasicTerms in Statistics
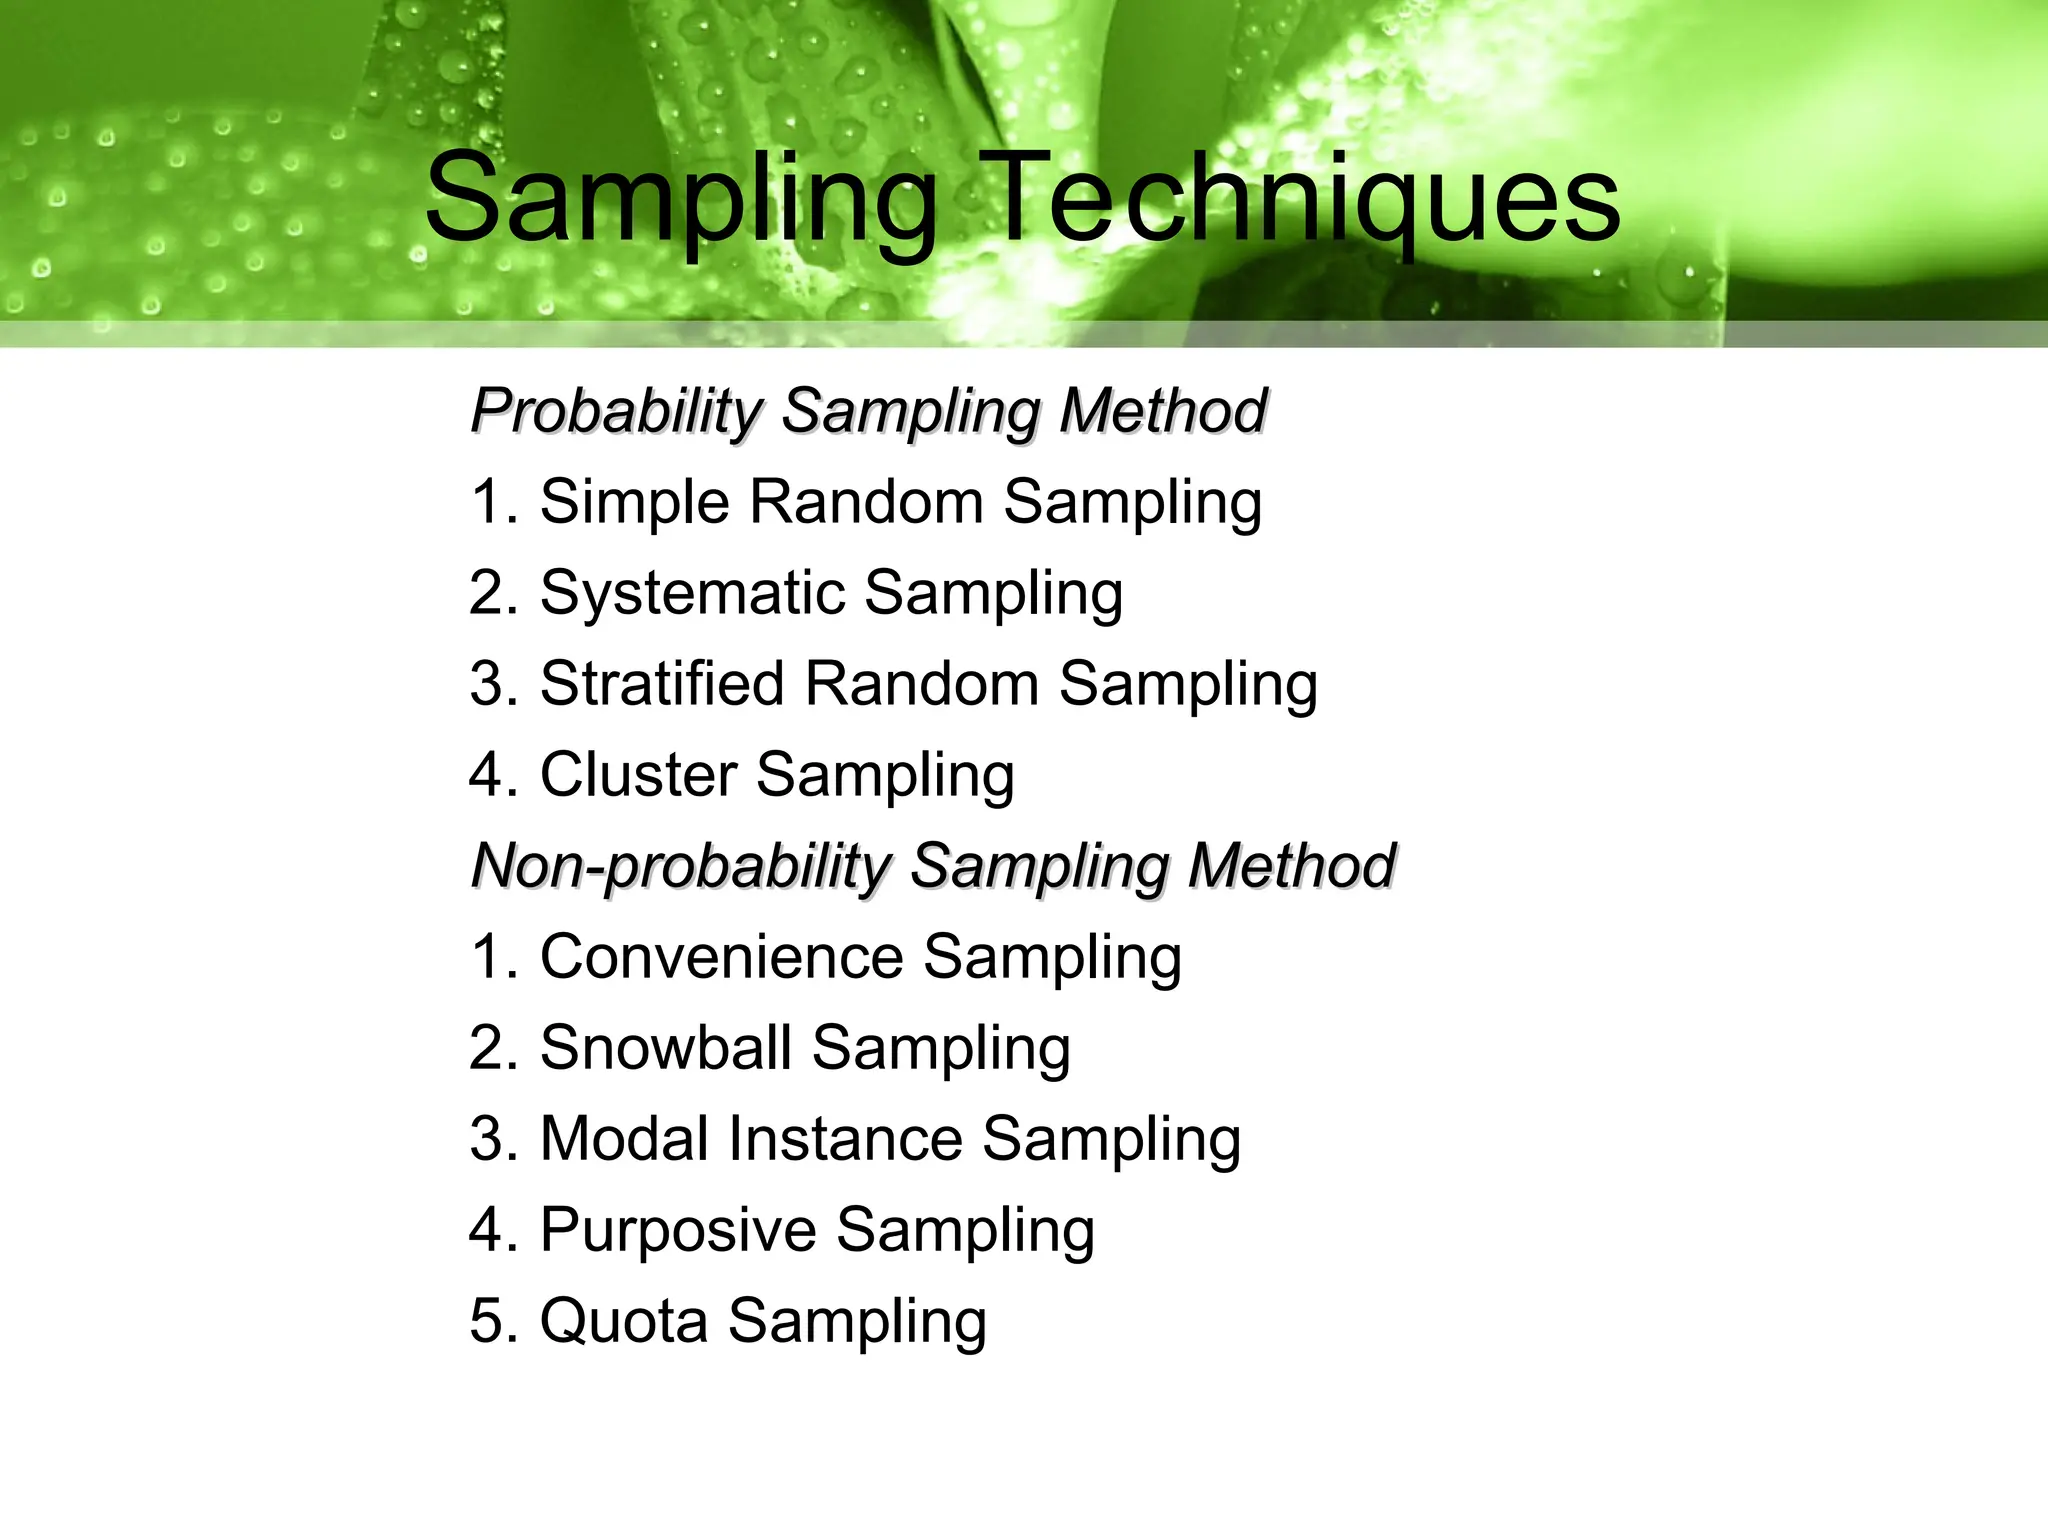
• Sampling Techniques
• Measures of Central Tendency
• Measures of Variability
• Test of Hypothesis
3.
STATISTICS
is a branchof mathematics that deals with the
collection, organization or presentation,
analysis, and interpretation of data.
is a collection of methods for planning
experiments, obtaining data, and then
organizing, summarizing, presenting,
analyzing, interpreting, and drawing
conclusions based on the data.
4.
STATISTICS
Collection
Collection refers tothe gathering of
information or data.
Organization
Organization or presentation
presentation involves
summarizing data or information in textual,
graphical or tabular form.
Analysis
Analysis involves describing the data using
statistical methods and procedures.
Interpretation
Interpretation refers to the process of making
conclusions based on the result of the
statistical treatment of the data.
5.
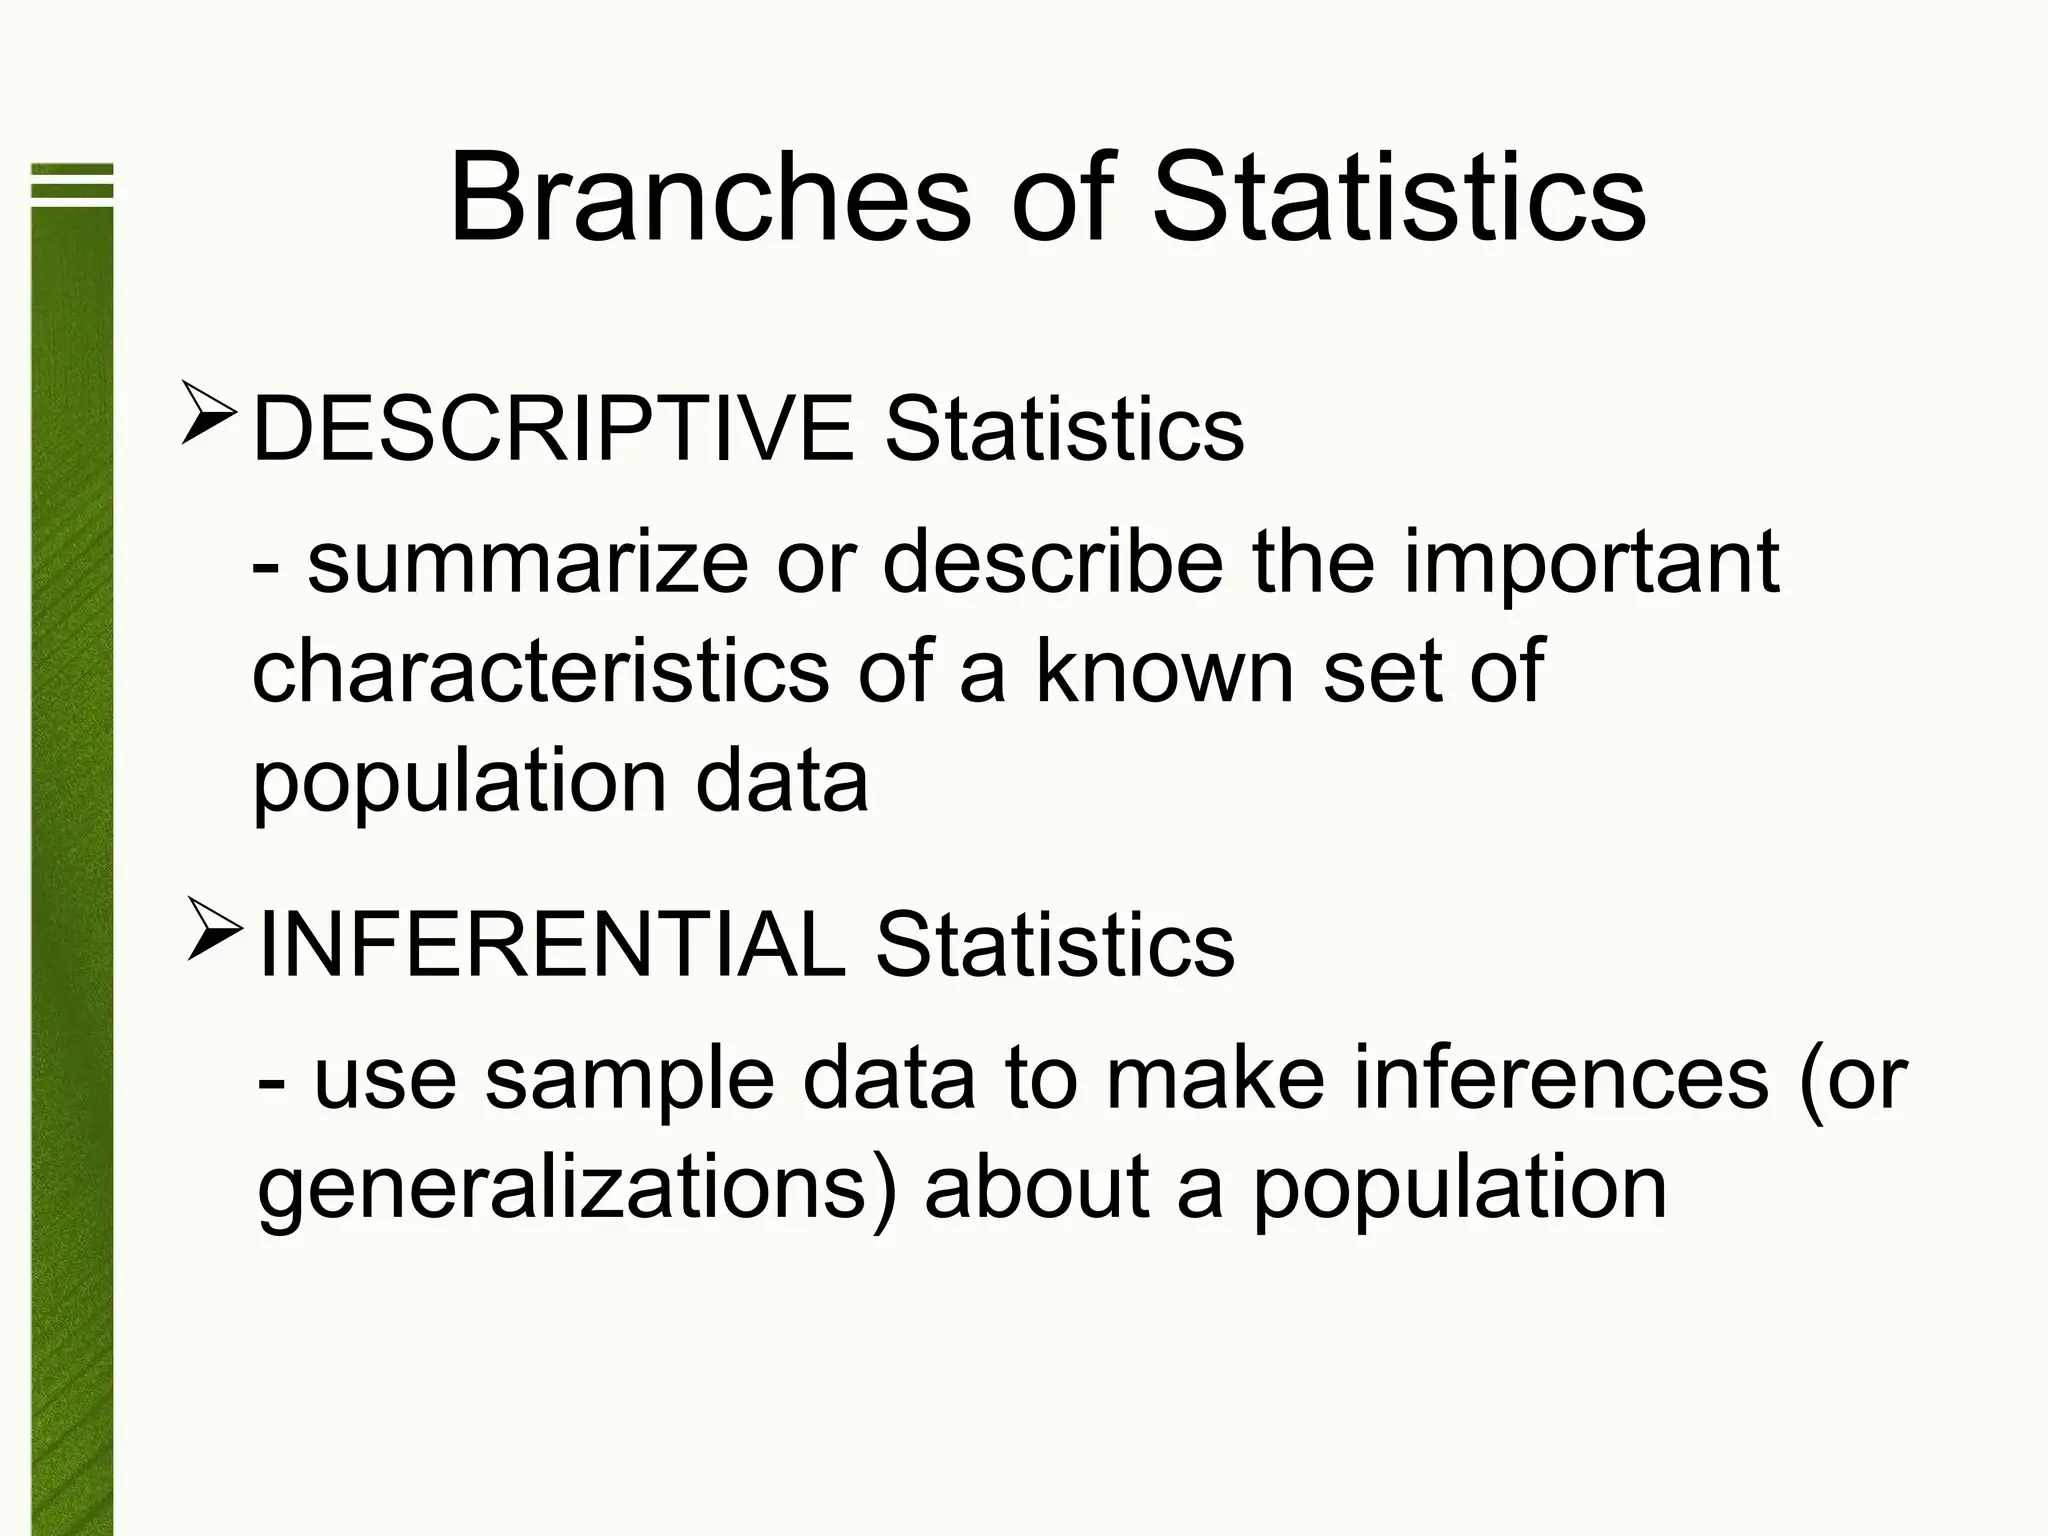
Branches of Statistics
DESCRIPTIVEStatistics
- summarize or describe the important
characteristics of a known set of
population data
INFERENTIAL Statistics
- use sample data to make inferences (or
generalizations) about a population
6.
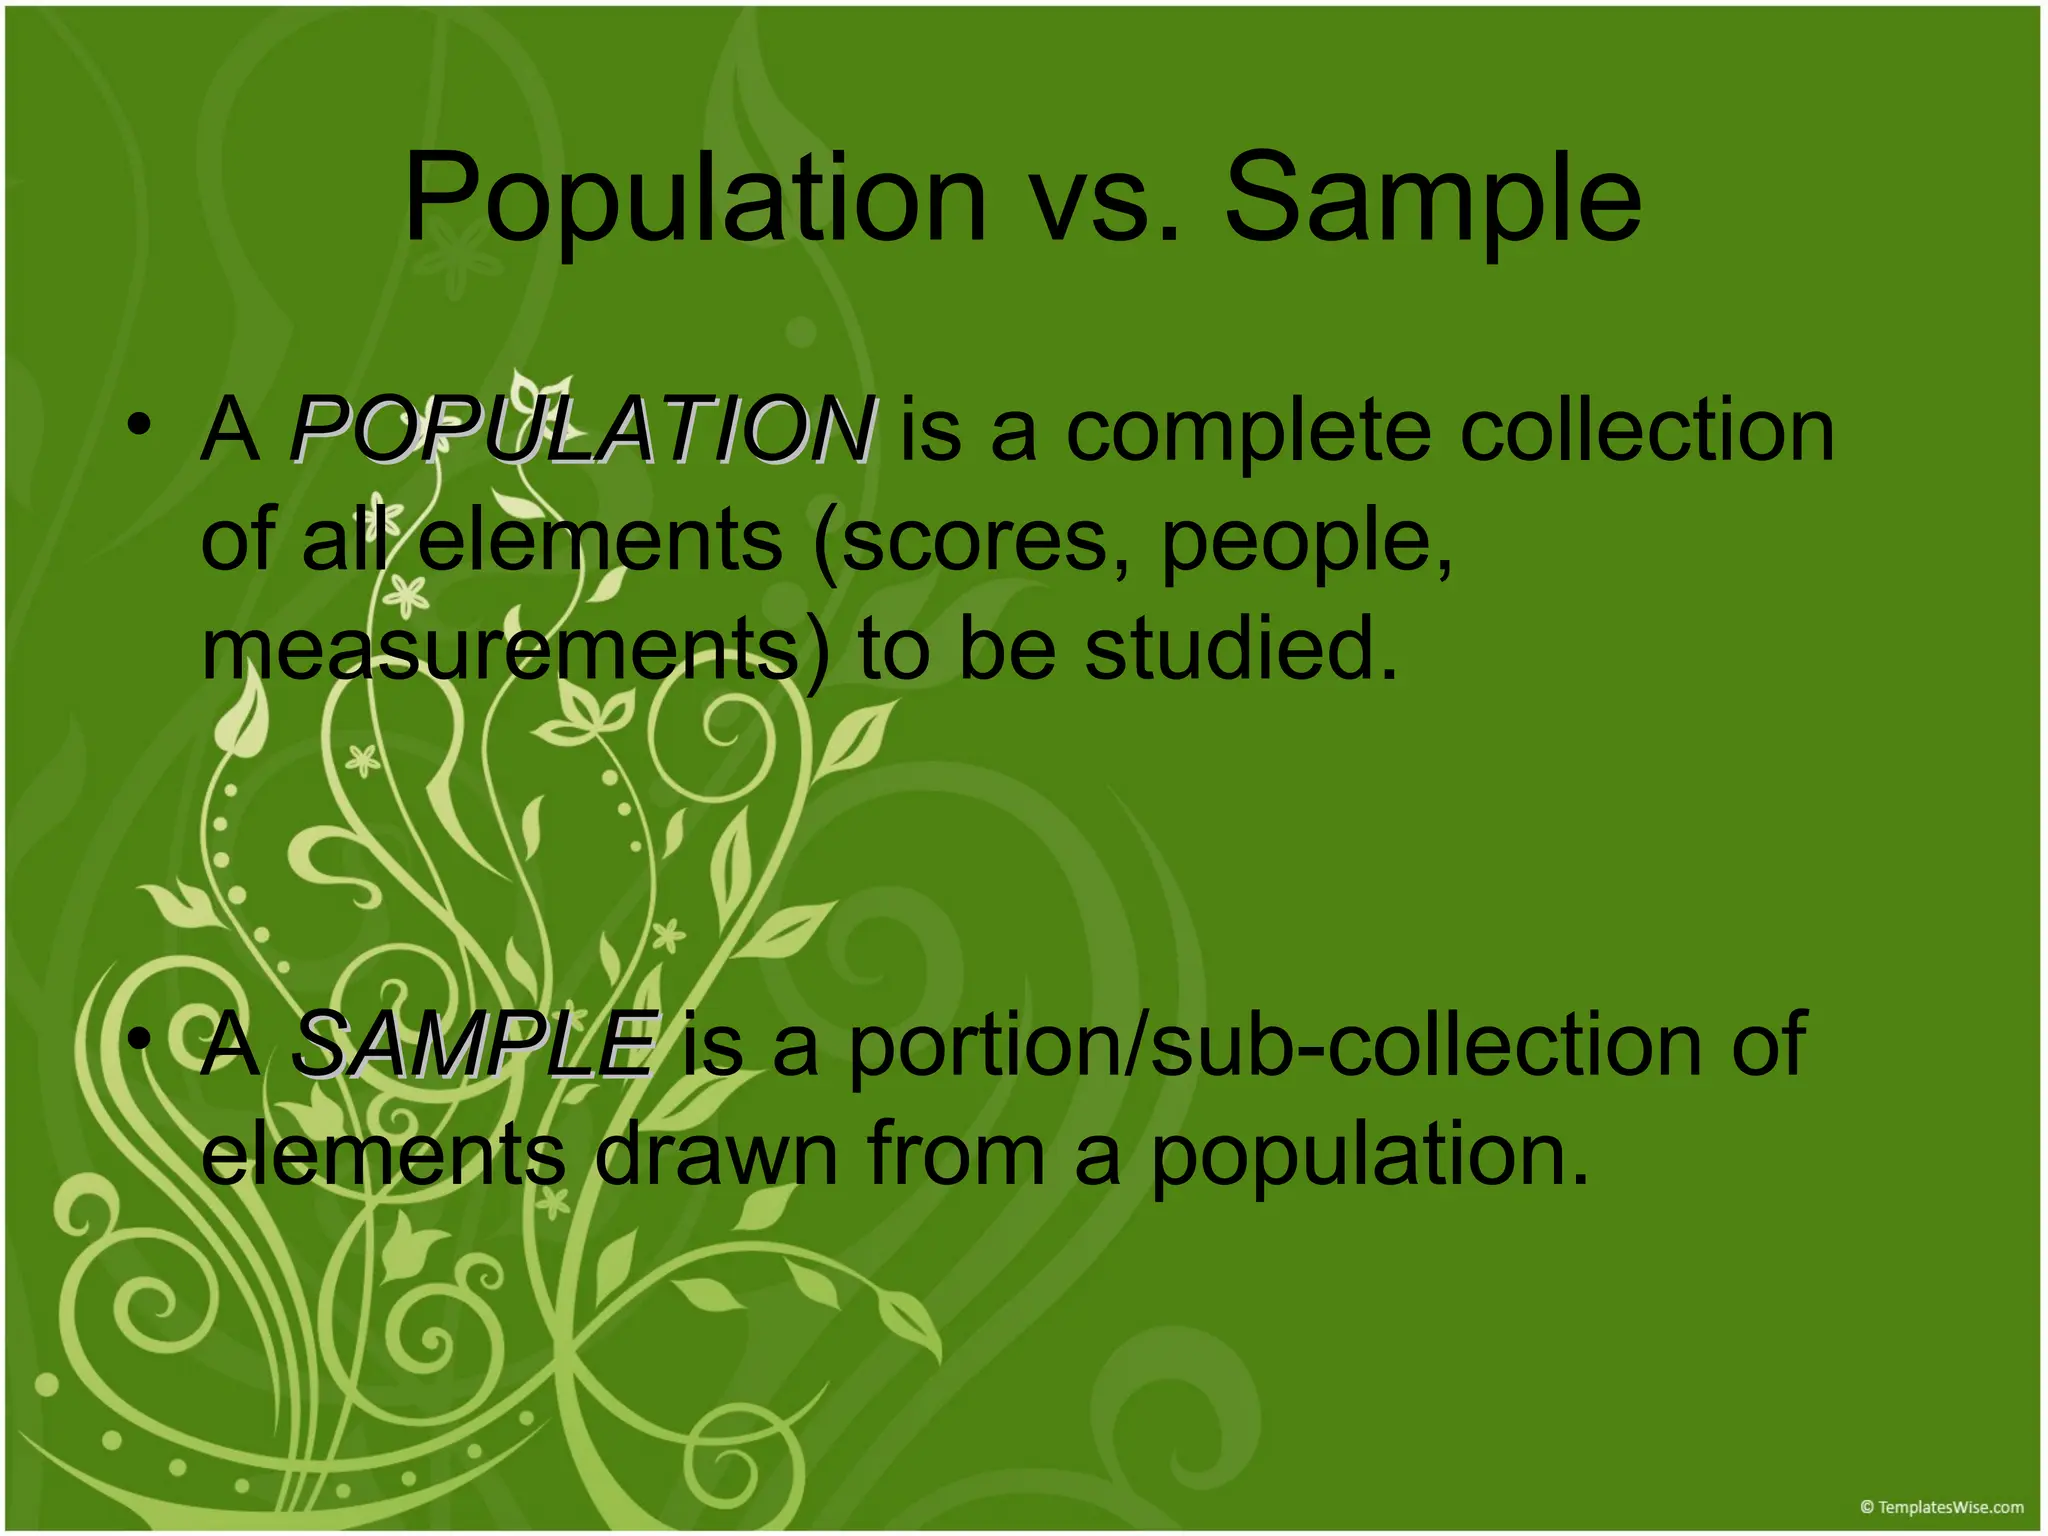
Population vs. Sample
•A POPULATION
POPULATION is a complete collection
of all elements (scores, people,
measurements) to be studied.
• A SAMPLE
SAMPLE is a portion/sub-collection of
elements drawn from a population.
7.
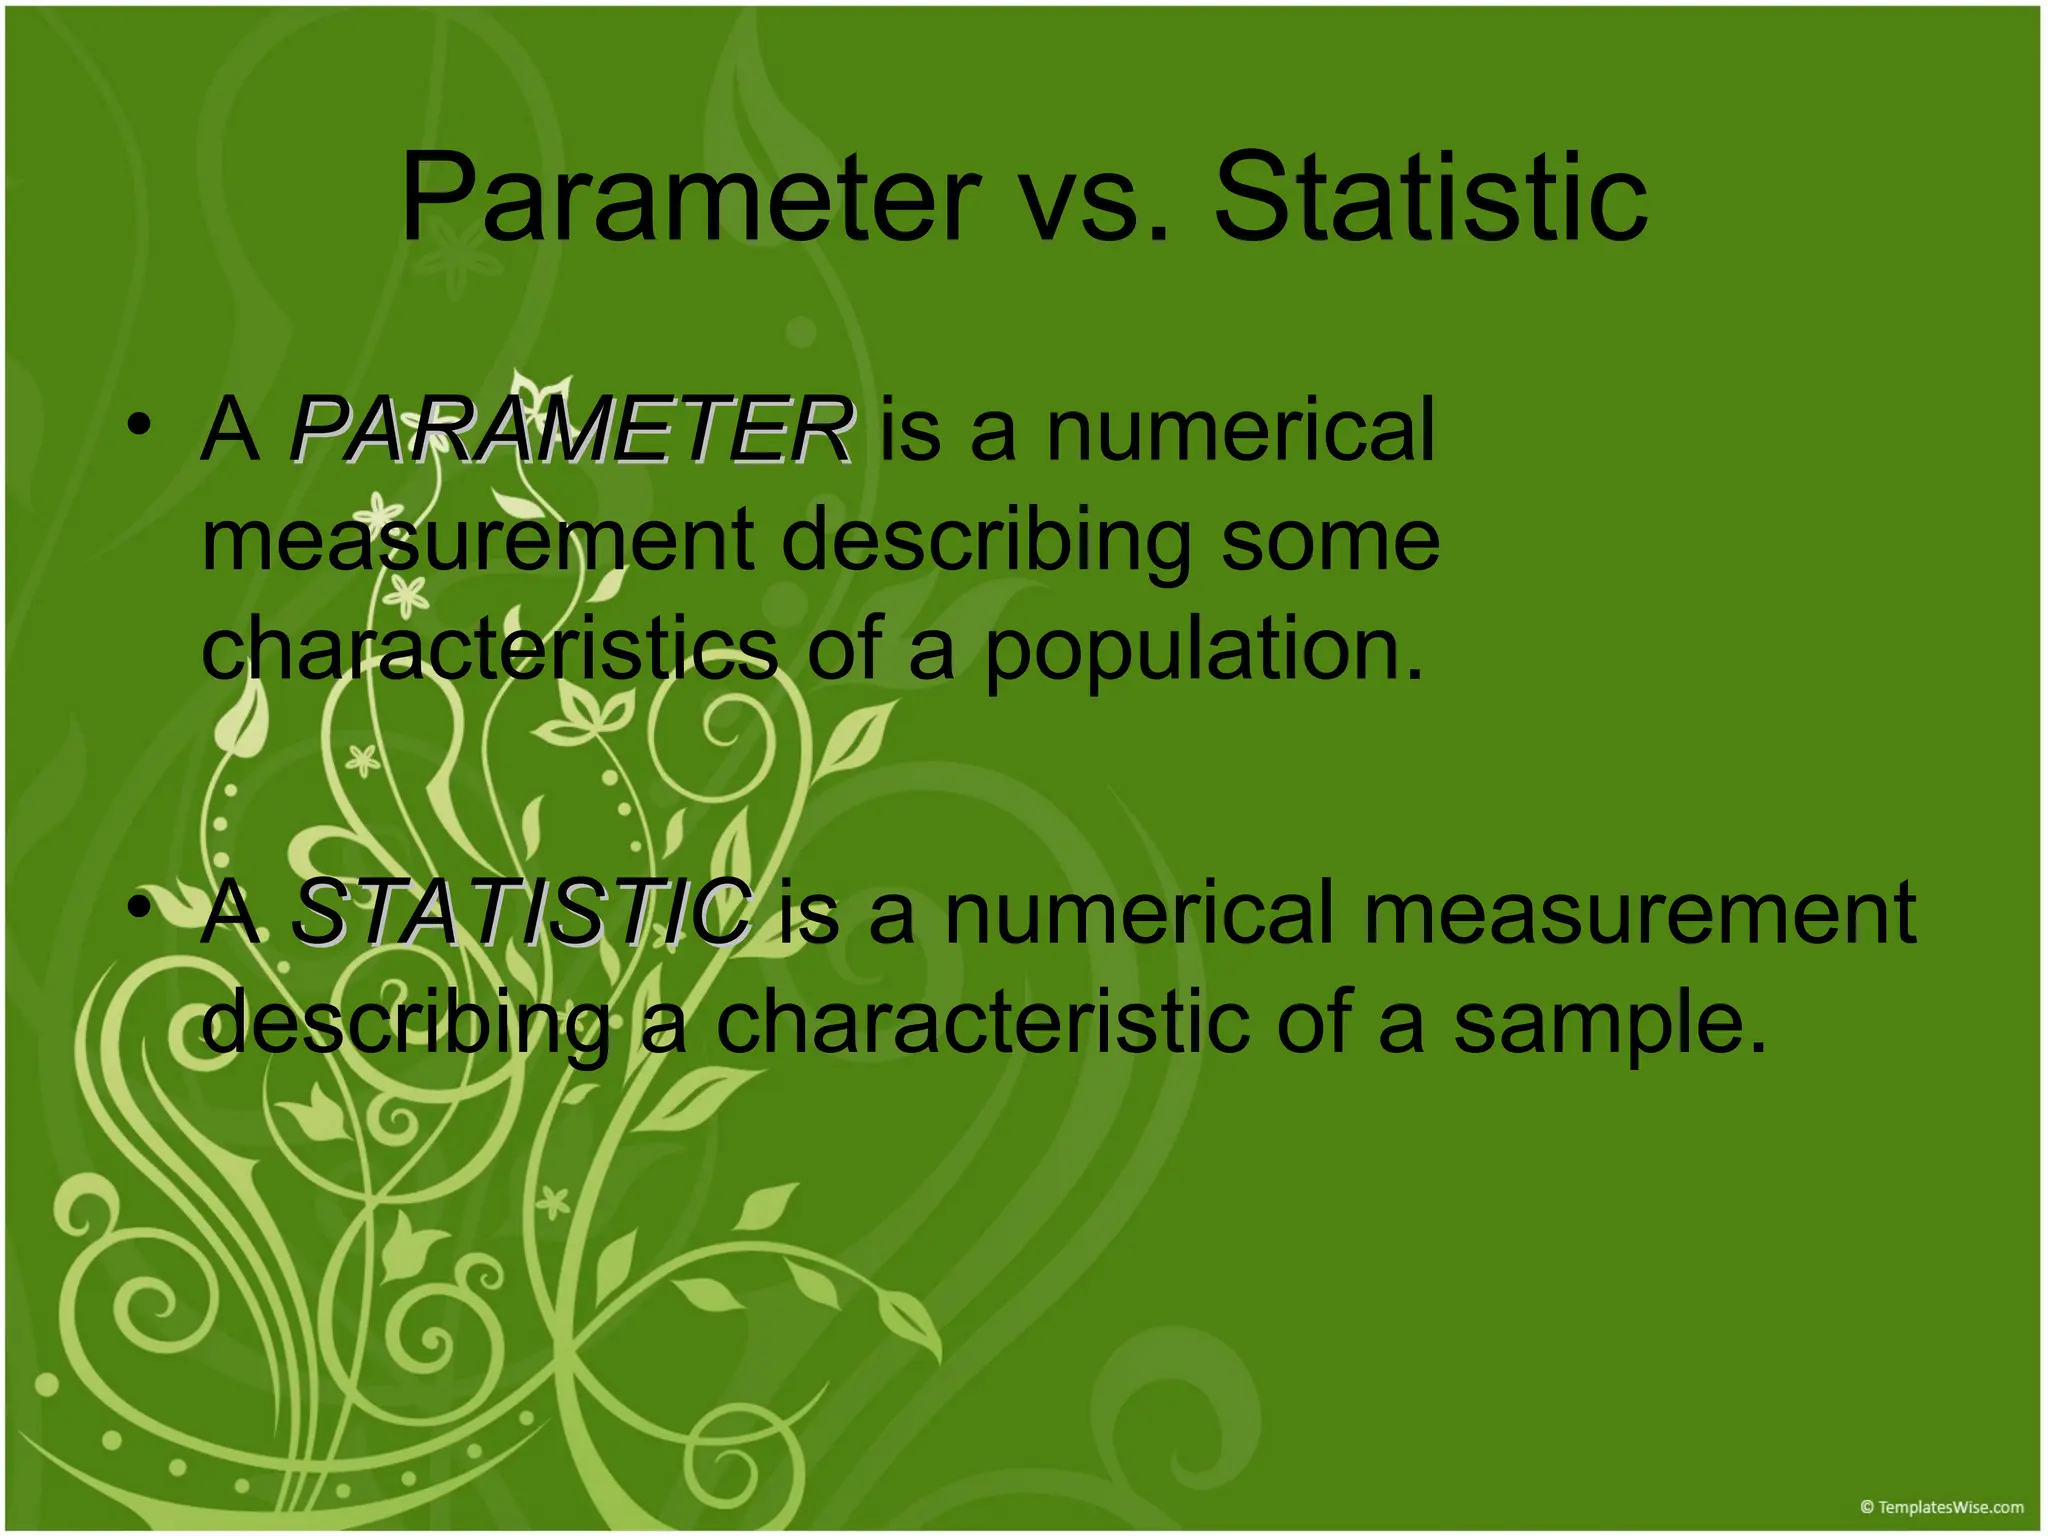
• A PARAMETER
PARAMETERis a numerical
measurement describing some
characteristics of a population.
• A STATISTIC
STATISTIC is a numerical measurement
describing a characteristic of a sample.
Parameter vs. Statistic
8.
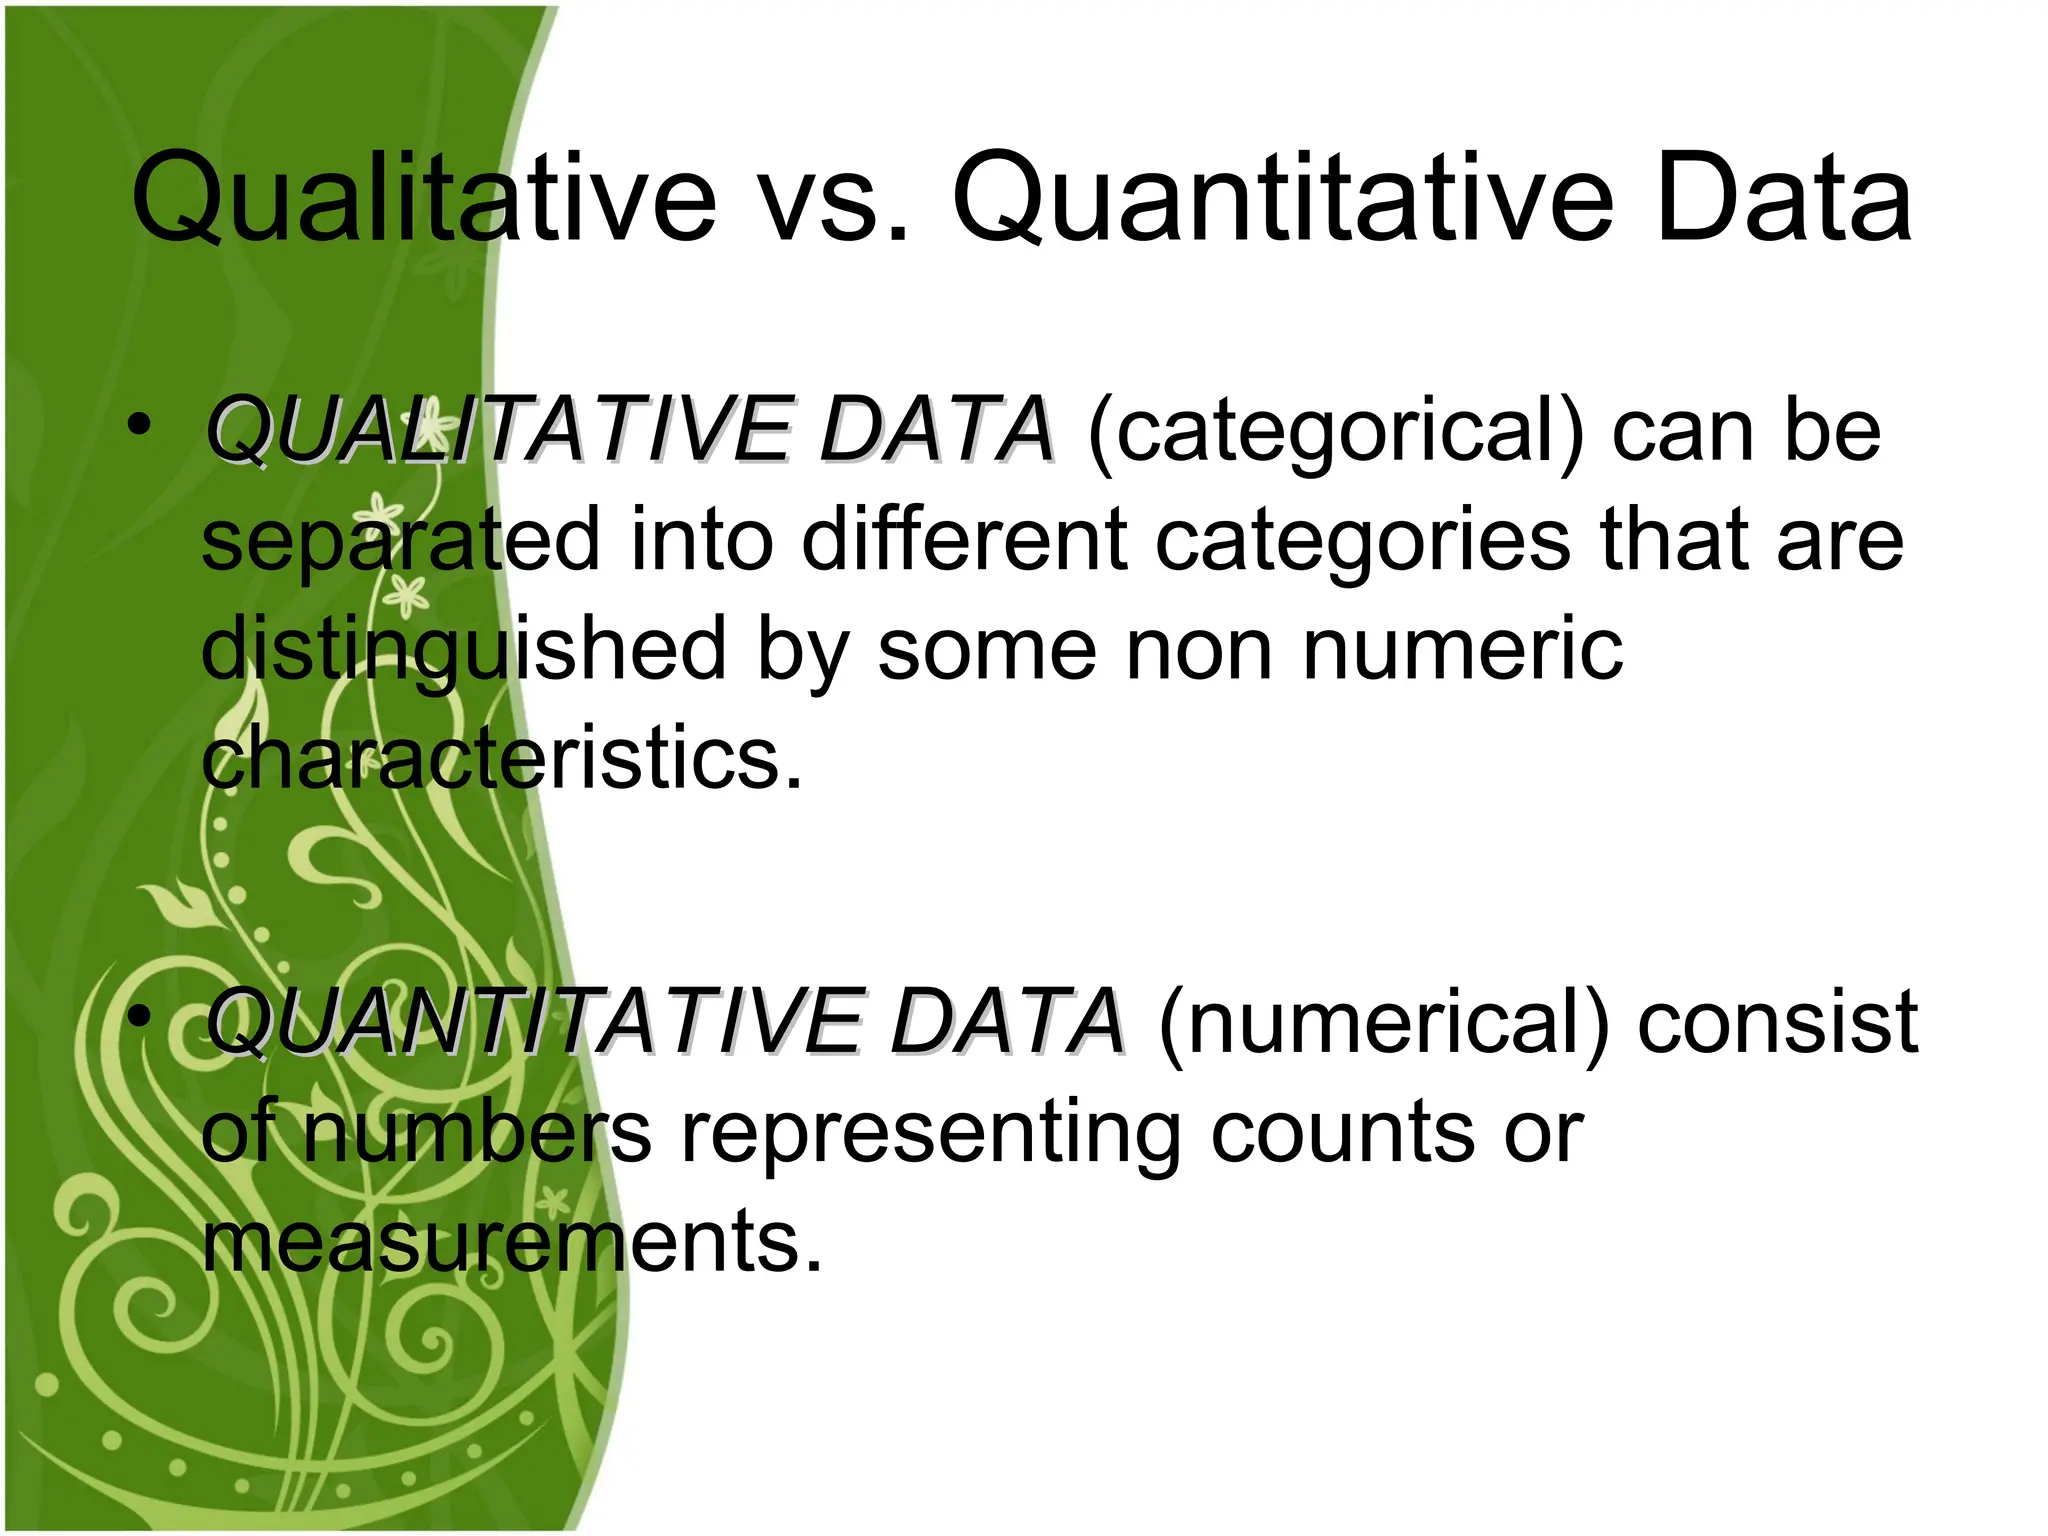
• QUALITATIVE DATA
QUALITATIVEDATA (categorical) can be
separated into different categories that are
distinguished by some non numeric
characteristics.
• QUANTITATIVE DATA
QUANTITATIVE DATA (numerical) consist
of numbers representing counts or
measurements.
Qualitative vs. Quantitative Data
9.
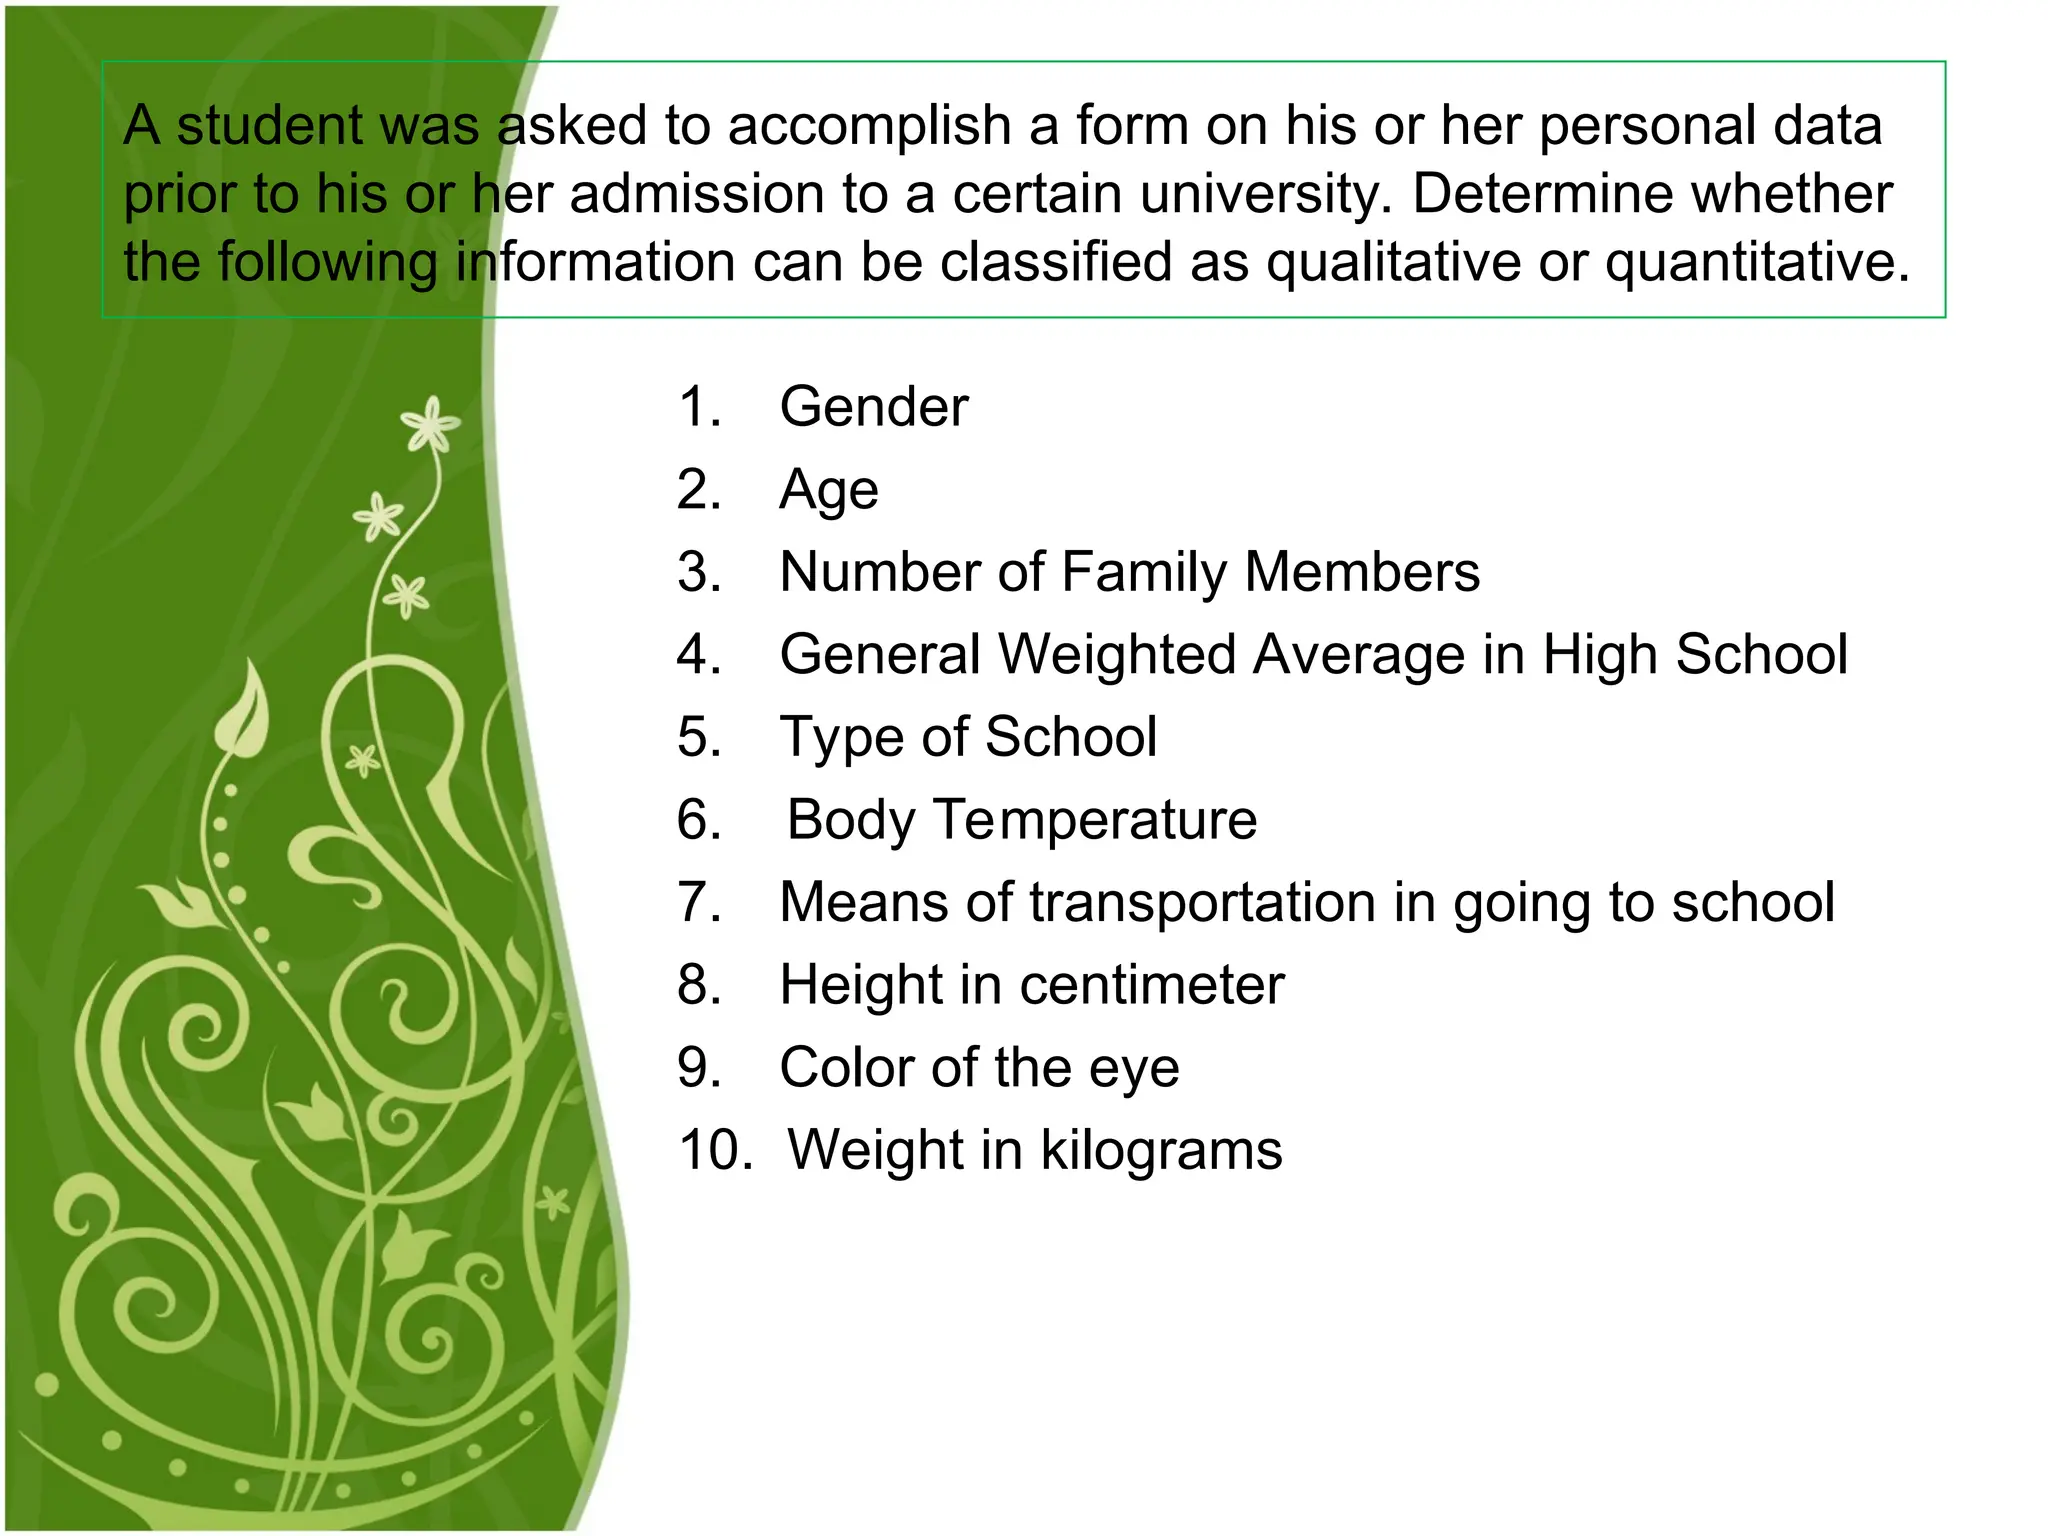
1. Gender
2. Age
3.Number of Family Members
4. General Weighted Average in High School
5. Type of School
6. Body Temperature
7. Means of transportation in going to school
8. Height in centimeter
9. Color of the eye
10. Weight in kilograms
A student was asked to accomplish a form on his or her personal data
prior to his or her admission to a certain university. Determine whether
the following information can be classified as qualitative or quantitative.
10.
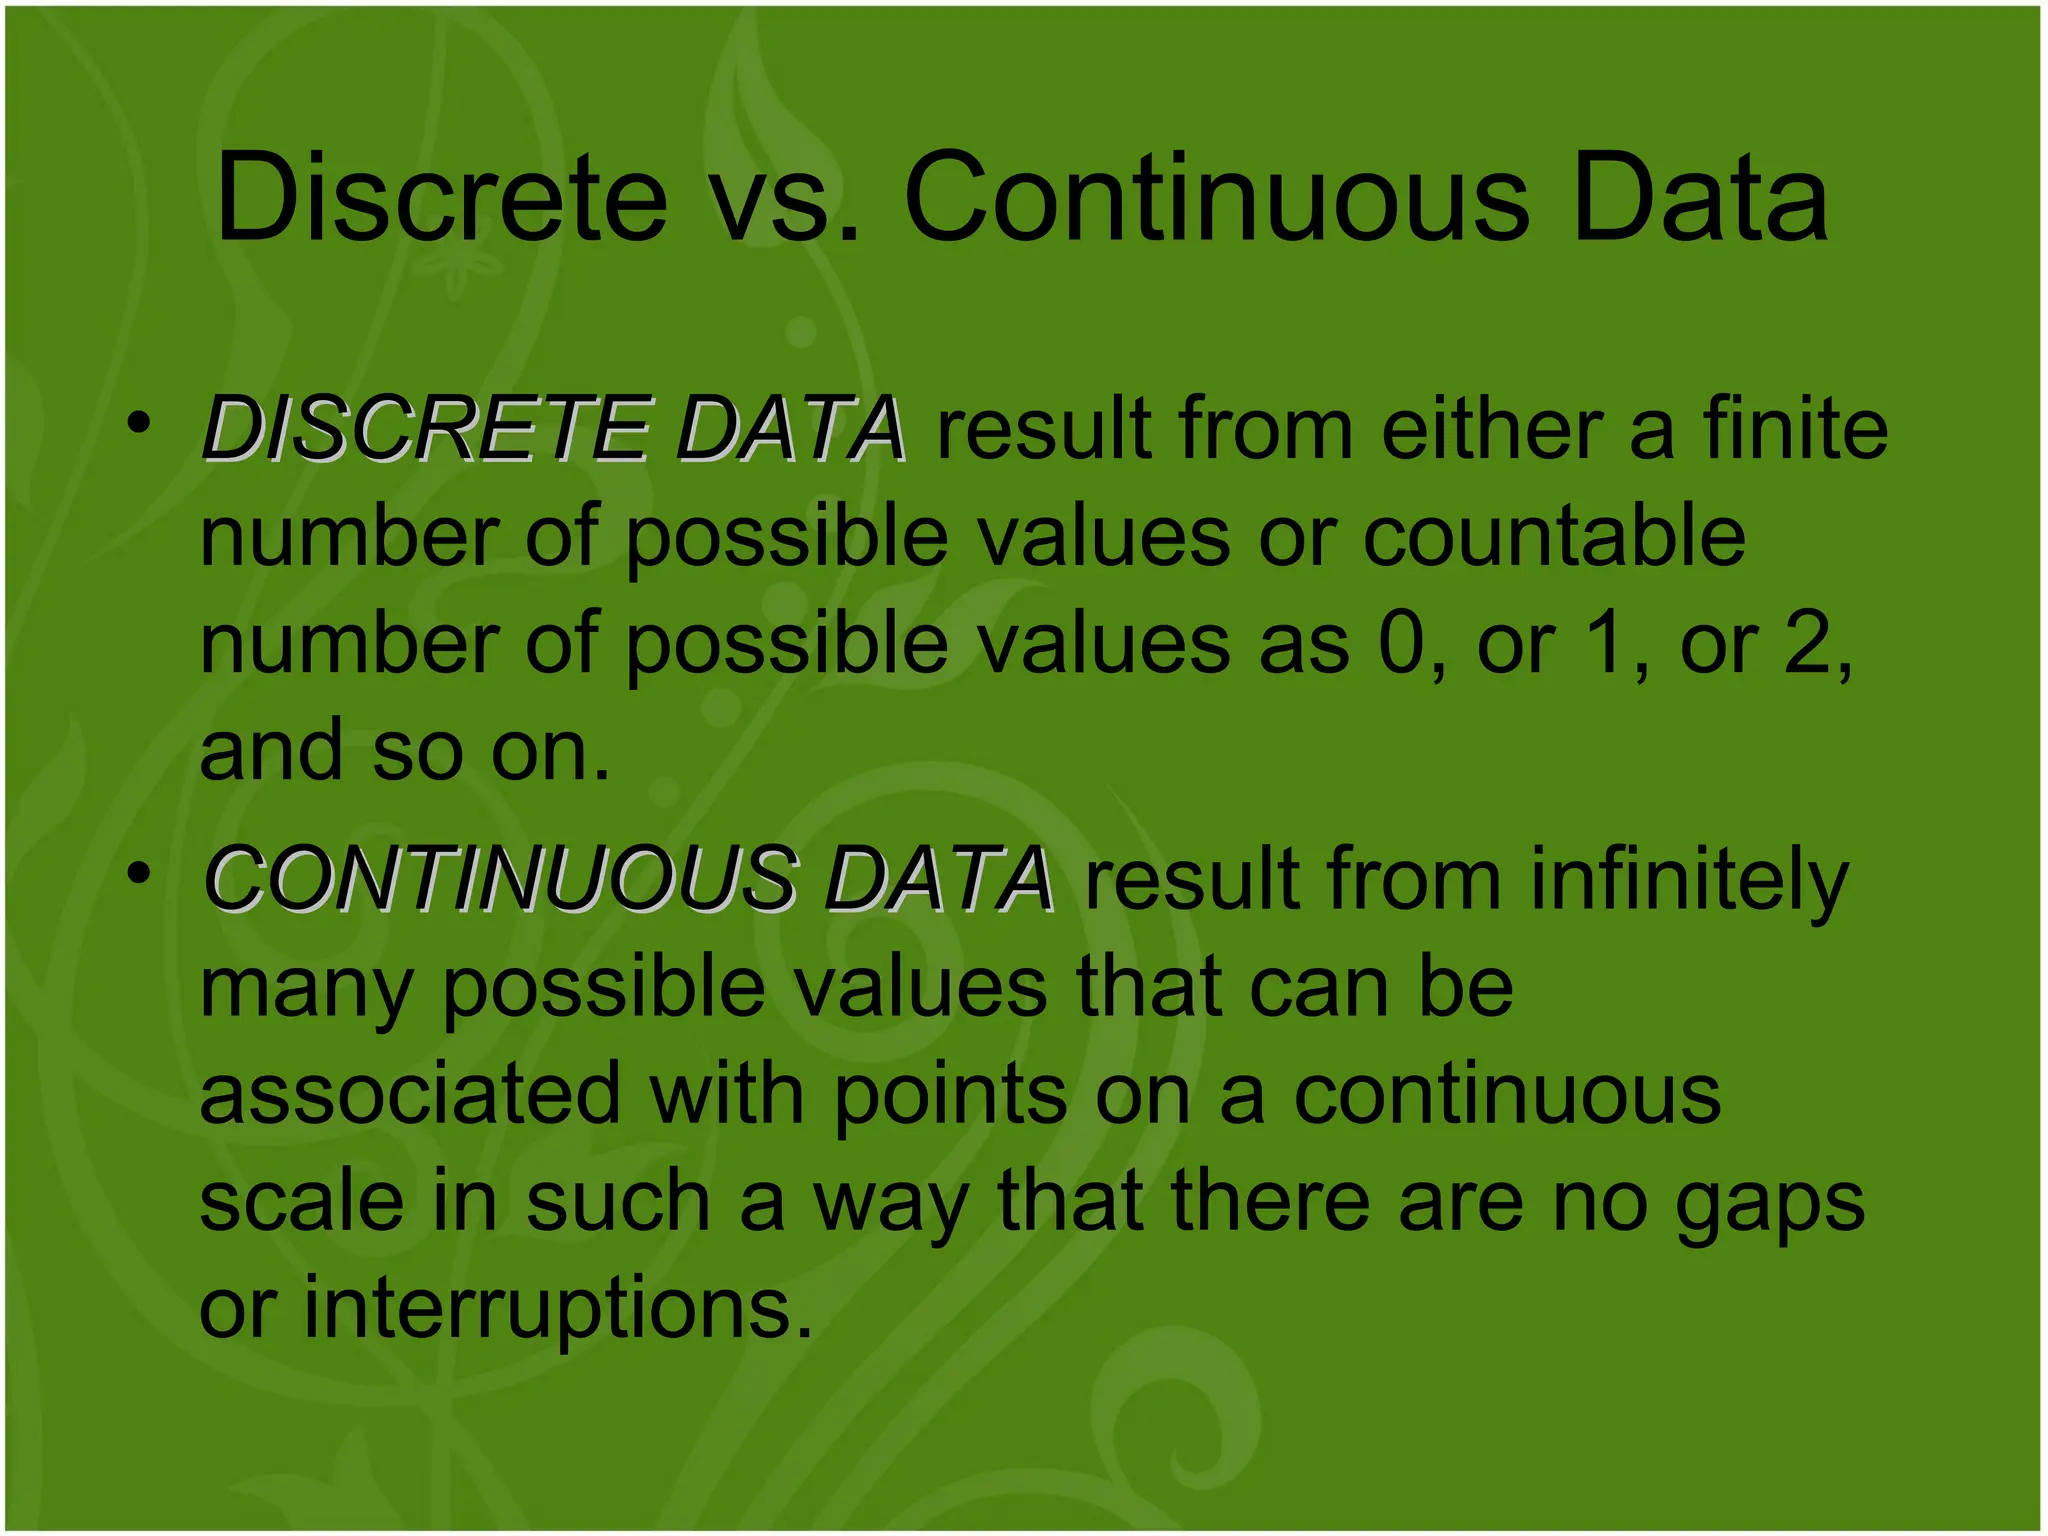
• DISCRETE DATA
DISCRETEDATA result from either a finite
number of possible values or countable
number of possible values as 0, or 1, or 2,
and so on.
• CONTINUOUS DATA
CONTINUOUS DATA result from infinitely
many possible values that can be
associated with points on a continuous
scale in such a way that there are no gaps
or interruptions.
Discrete vs. Continuous Data
11.
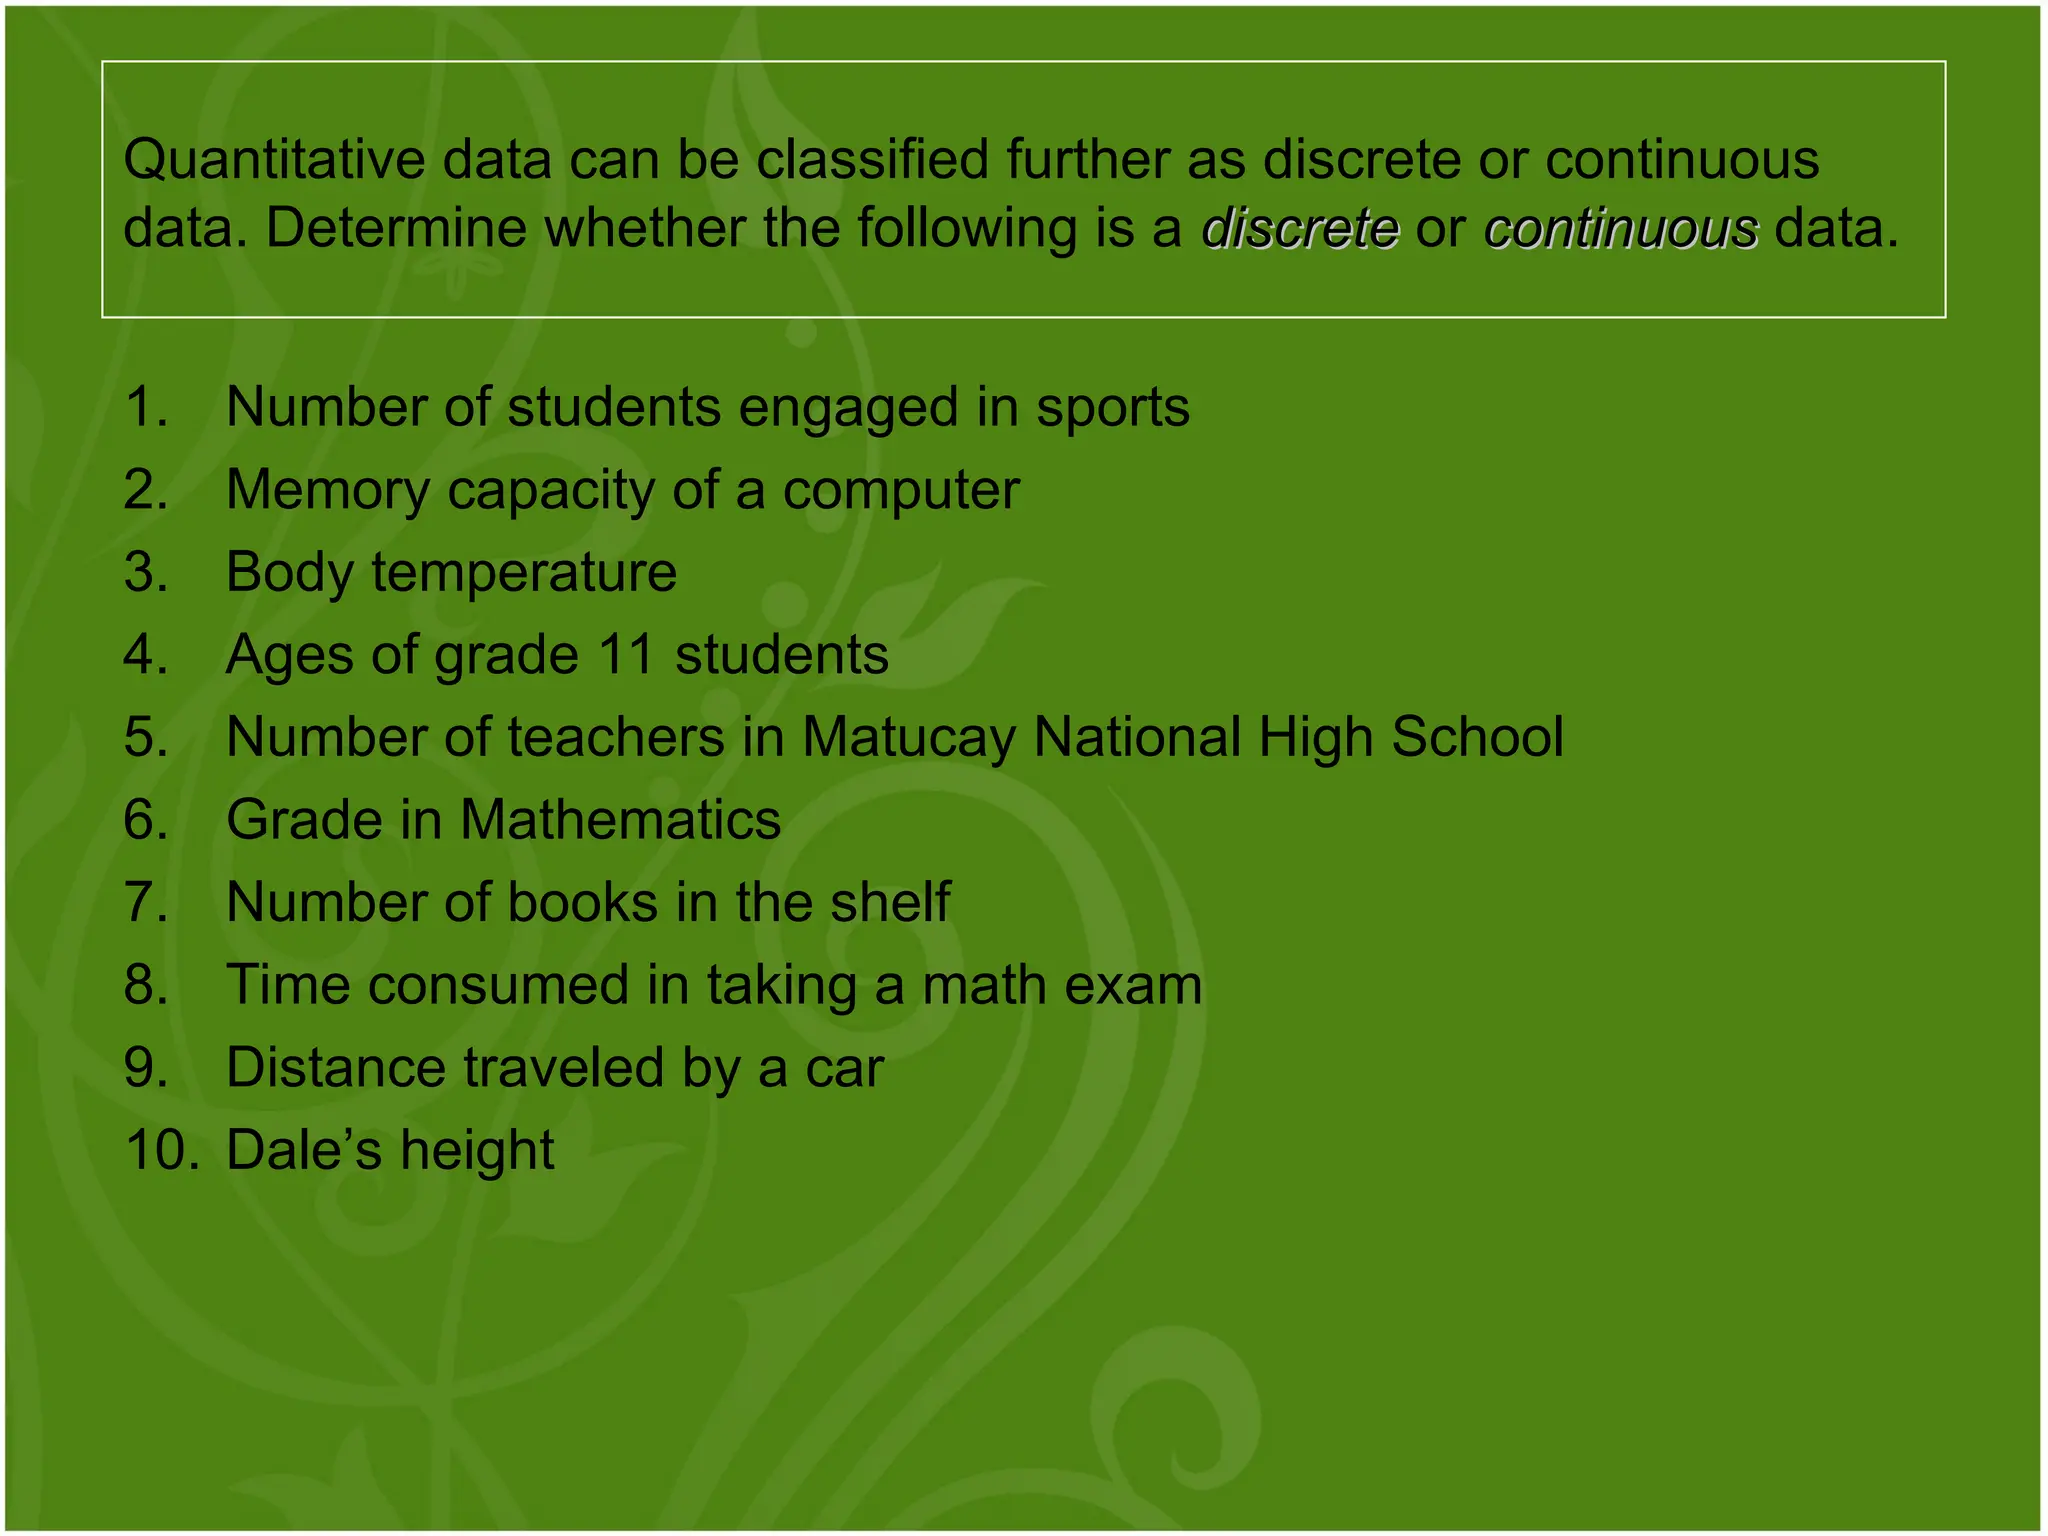
1. Number ofstudents engaged in sports
2. Memory capacity of a computer
3. Body temperature
4. Ages of grade 11 students
5. Number of teachers in Matucay National High School
6. Grade in Mathematics
7. Number of books in the shelf
8. Time consumed in taking a math exam
9. Distance traveled by a car
10. Dale’s height
Quantitative data can be classified further as discrete or continuous
data. Determine whether the following is a discrete
discrete or continuous
continuous data.
12.
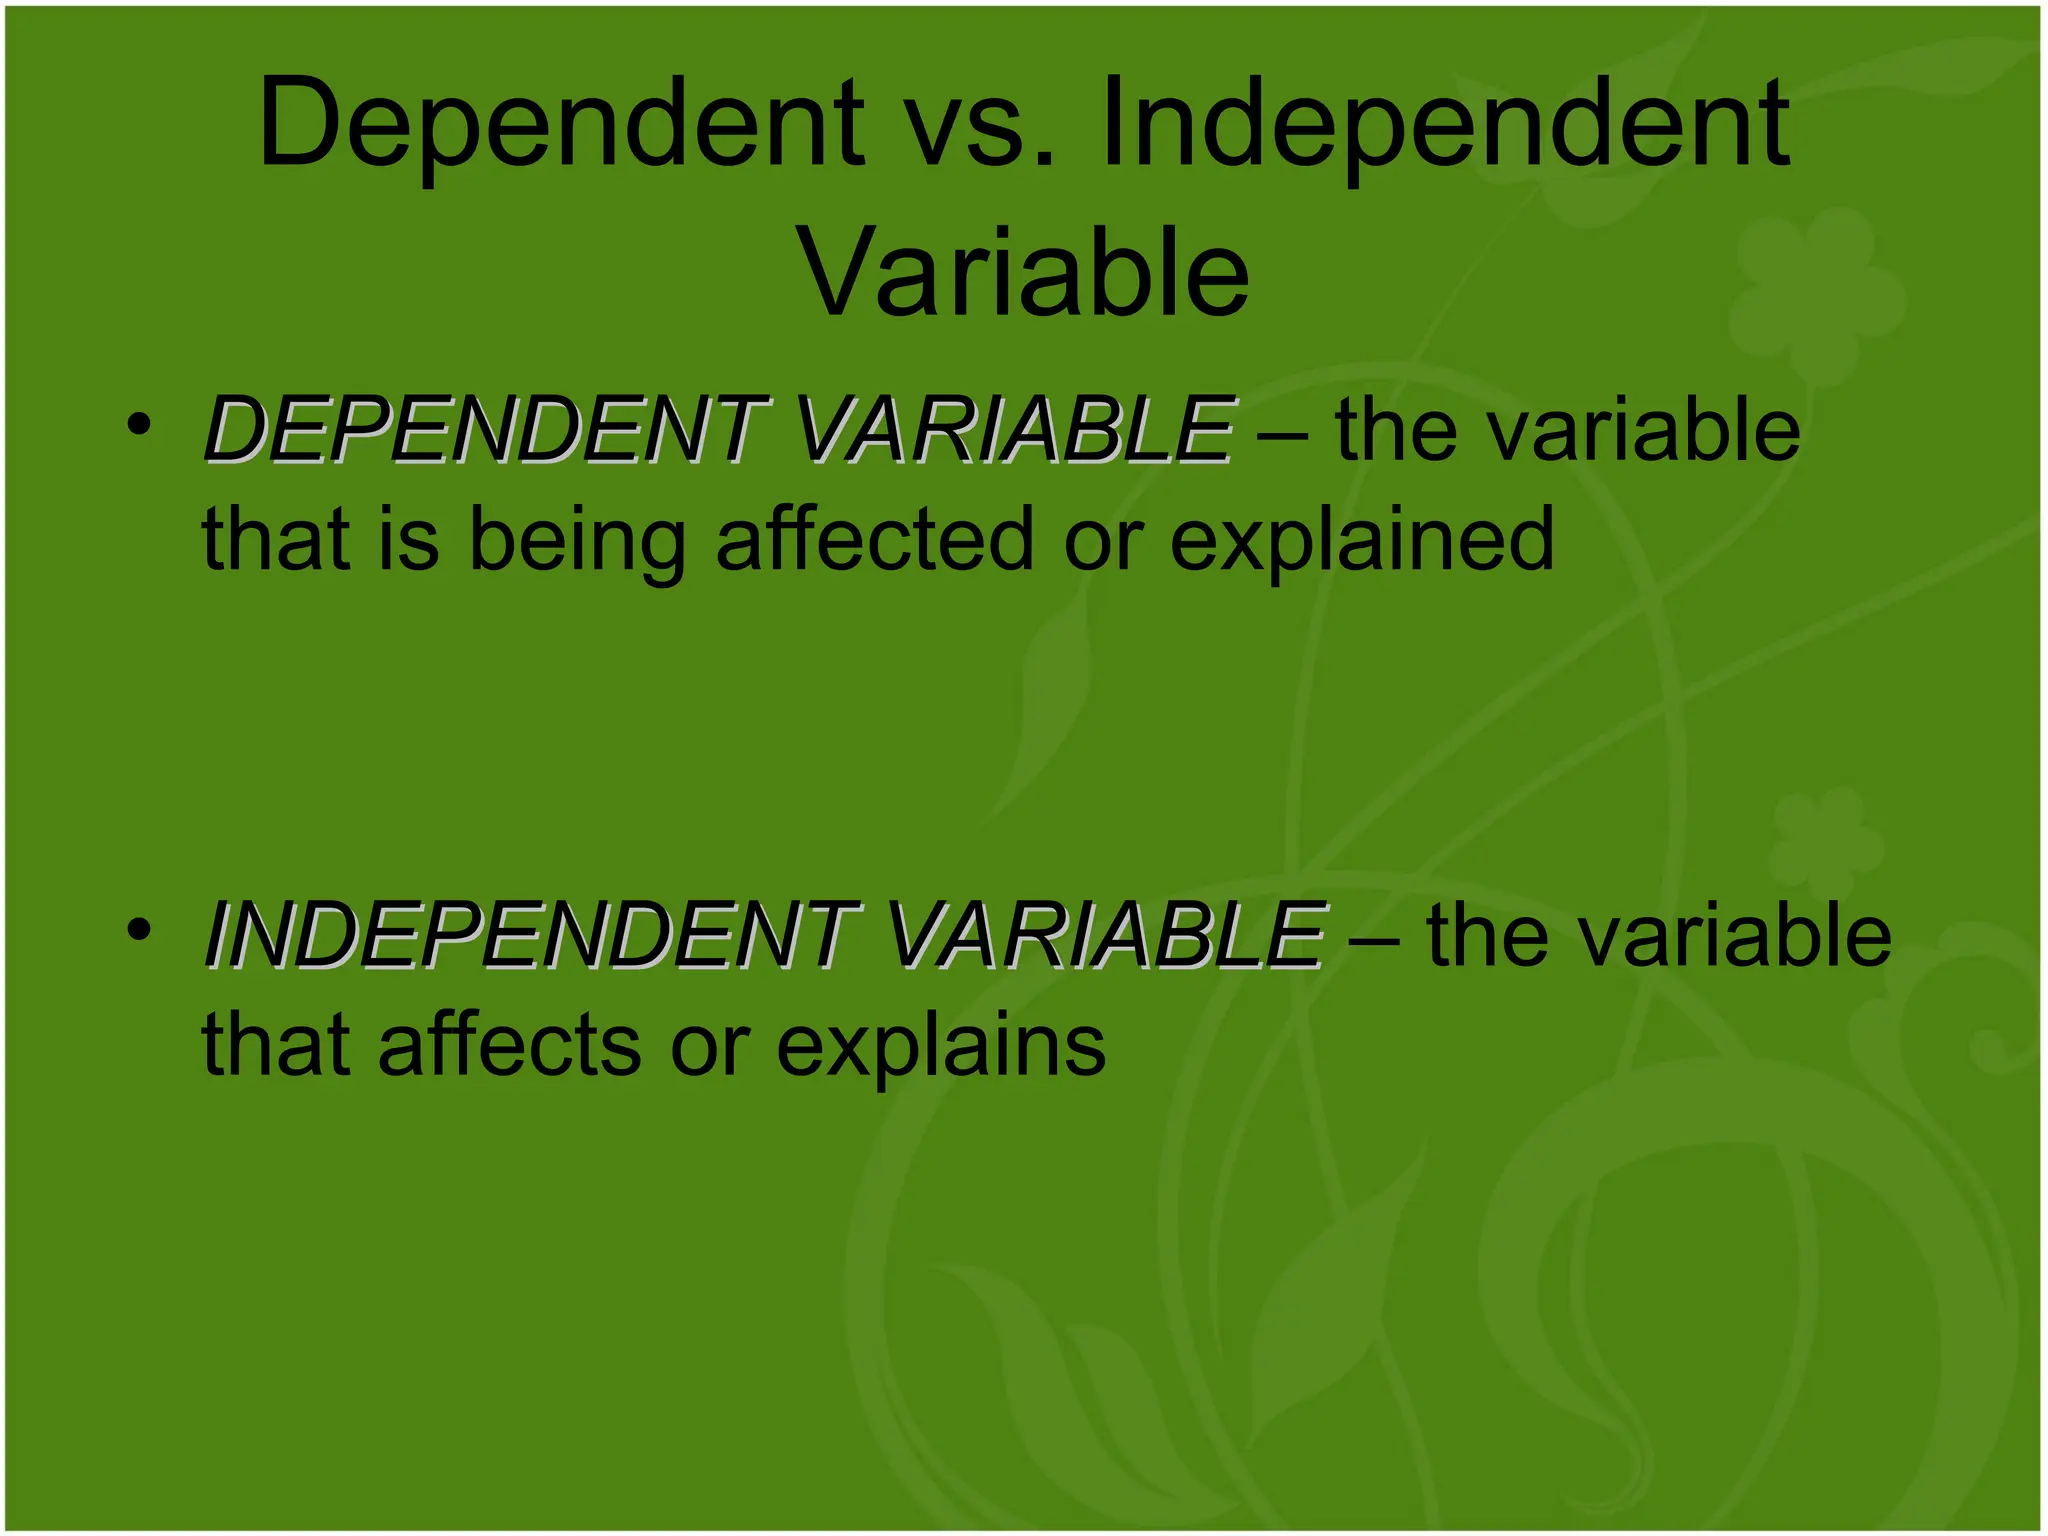
• DEPENDENT VARIABLE
DEPENDENTVARIABLE – the variable
that is being affected or explained
• INDEPENDENT VARIABLE
INDEPENDENT VARIABLE – the variable
that affects or explains
Dependent vs. Independent
Variable
13.
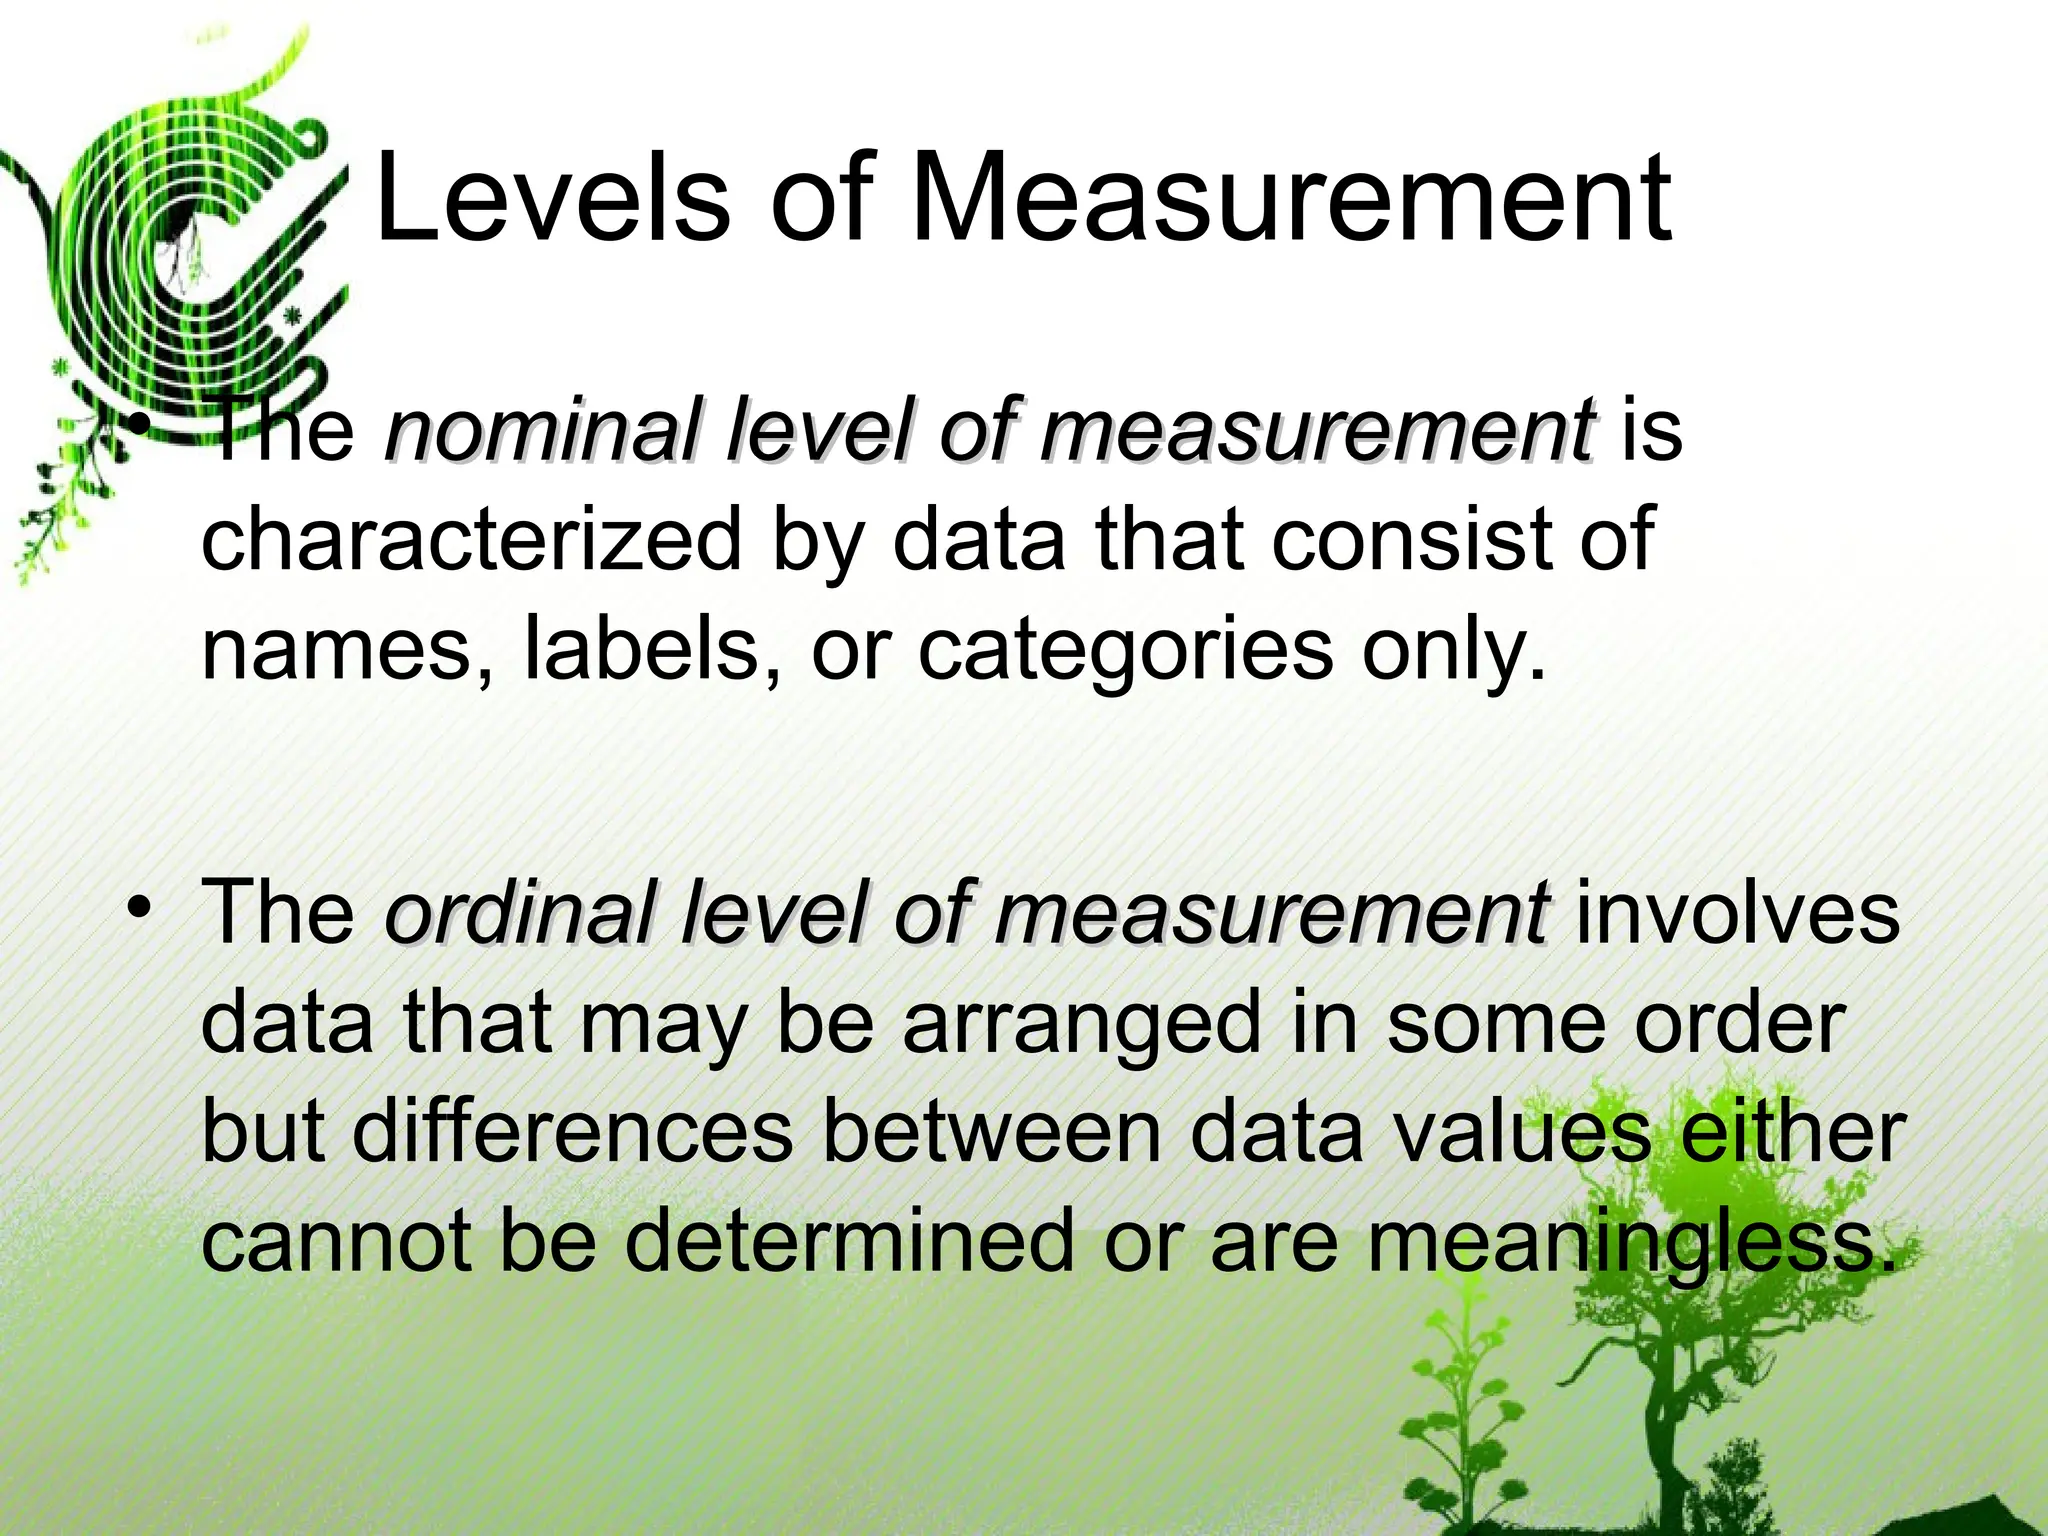
• The nominallevel of measurement
nominal level of measurement is
characterized by data that consist of
names, labels, or categories only.
• The ordinal level of measurement
ordinal level of measurement involves
data that may be arranged in some order
but differences between data values either
cannot be determined or are meaningless.
Levels of Measurement
14.
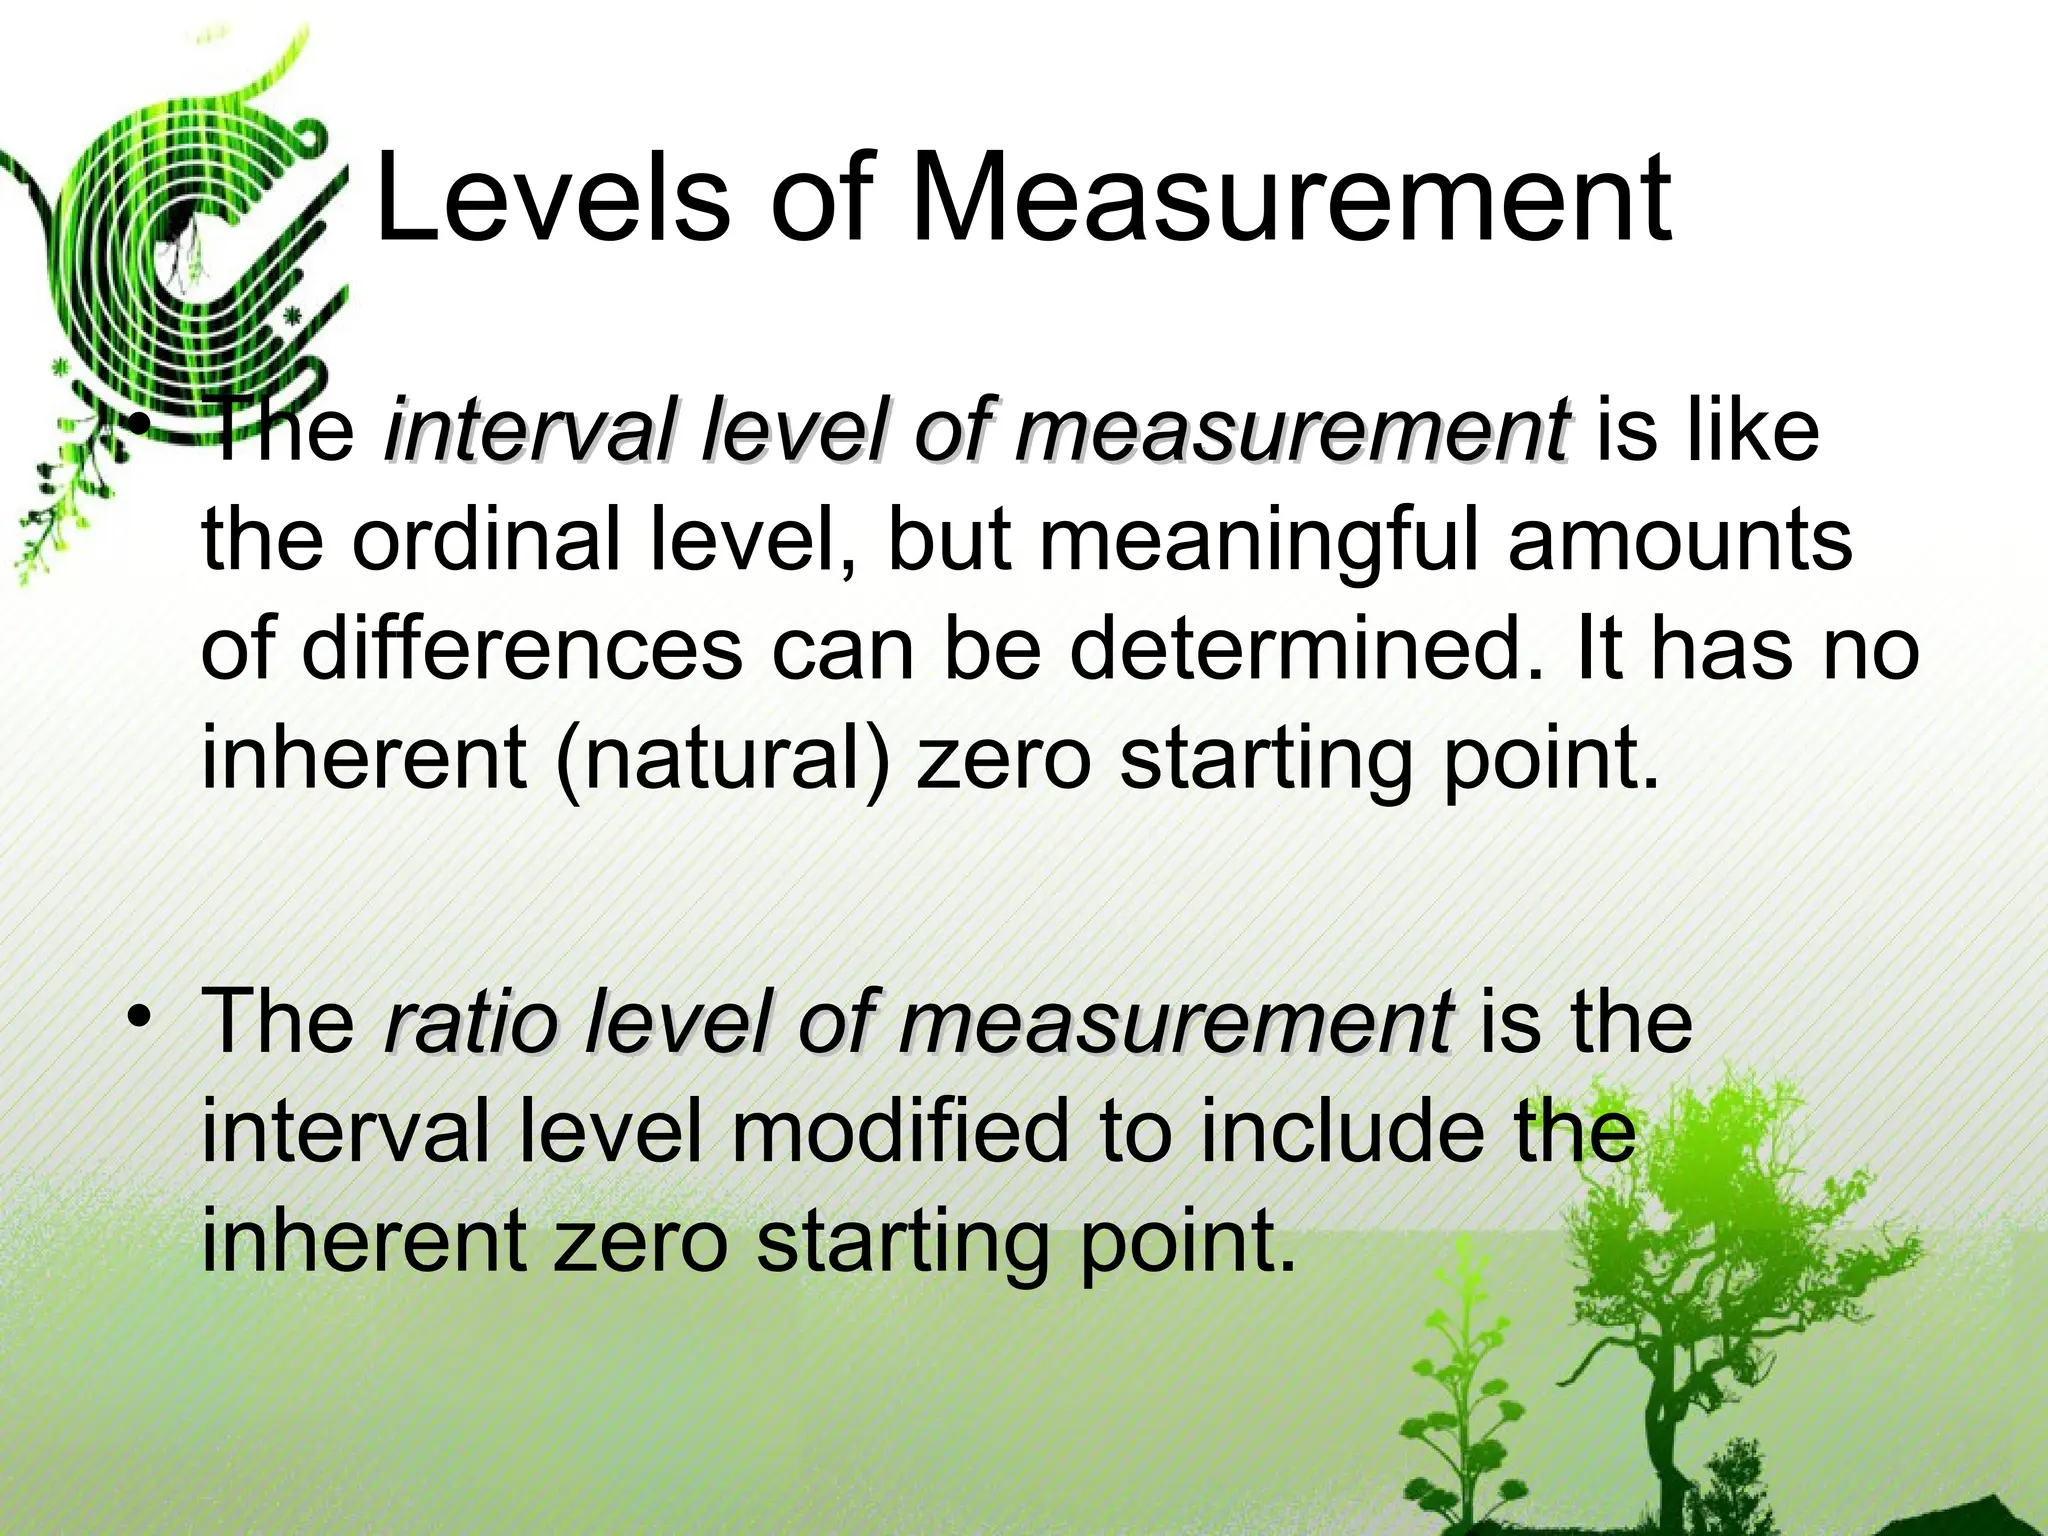
• The intervallevel of measurement
interval level of measurement is like
the ordinal level, but meaningful amounts
of differences can be determined. It has no
inherent (natural) zero starting point.
• The ratio level of measurement
ratio level of measurement is the
interval level modified to include the
inherent zero starting point.
Levels of Measurement
15.
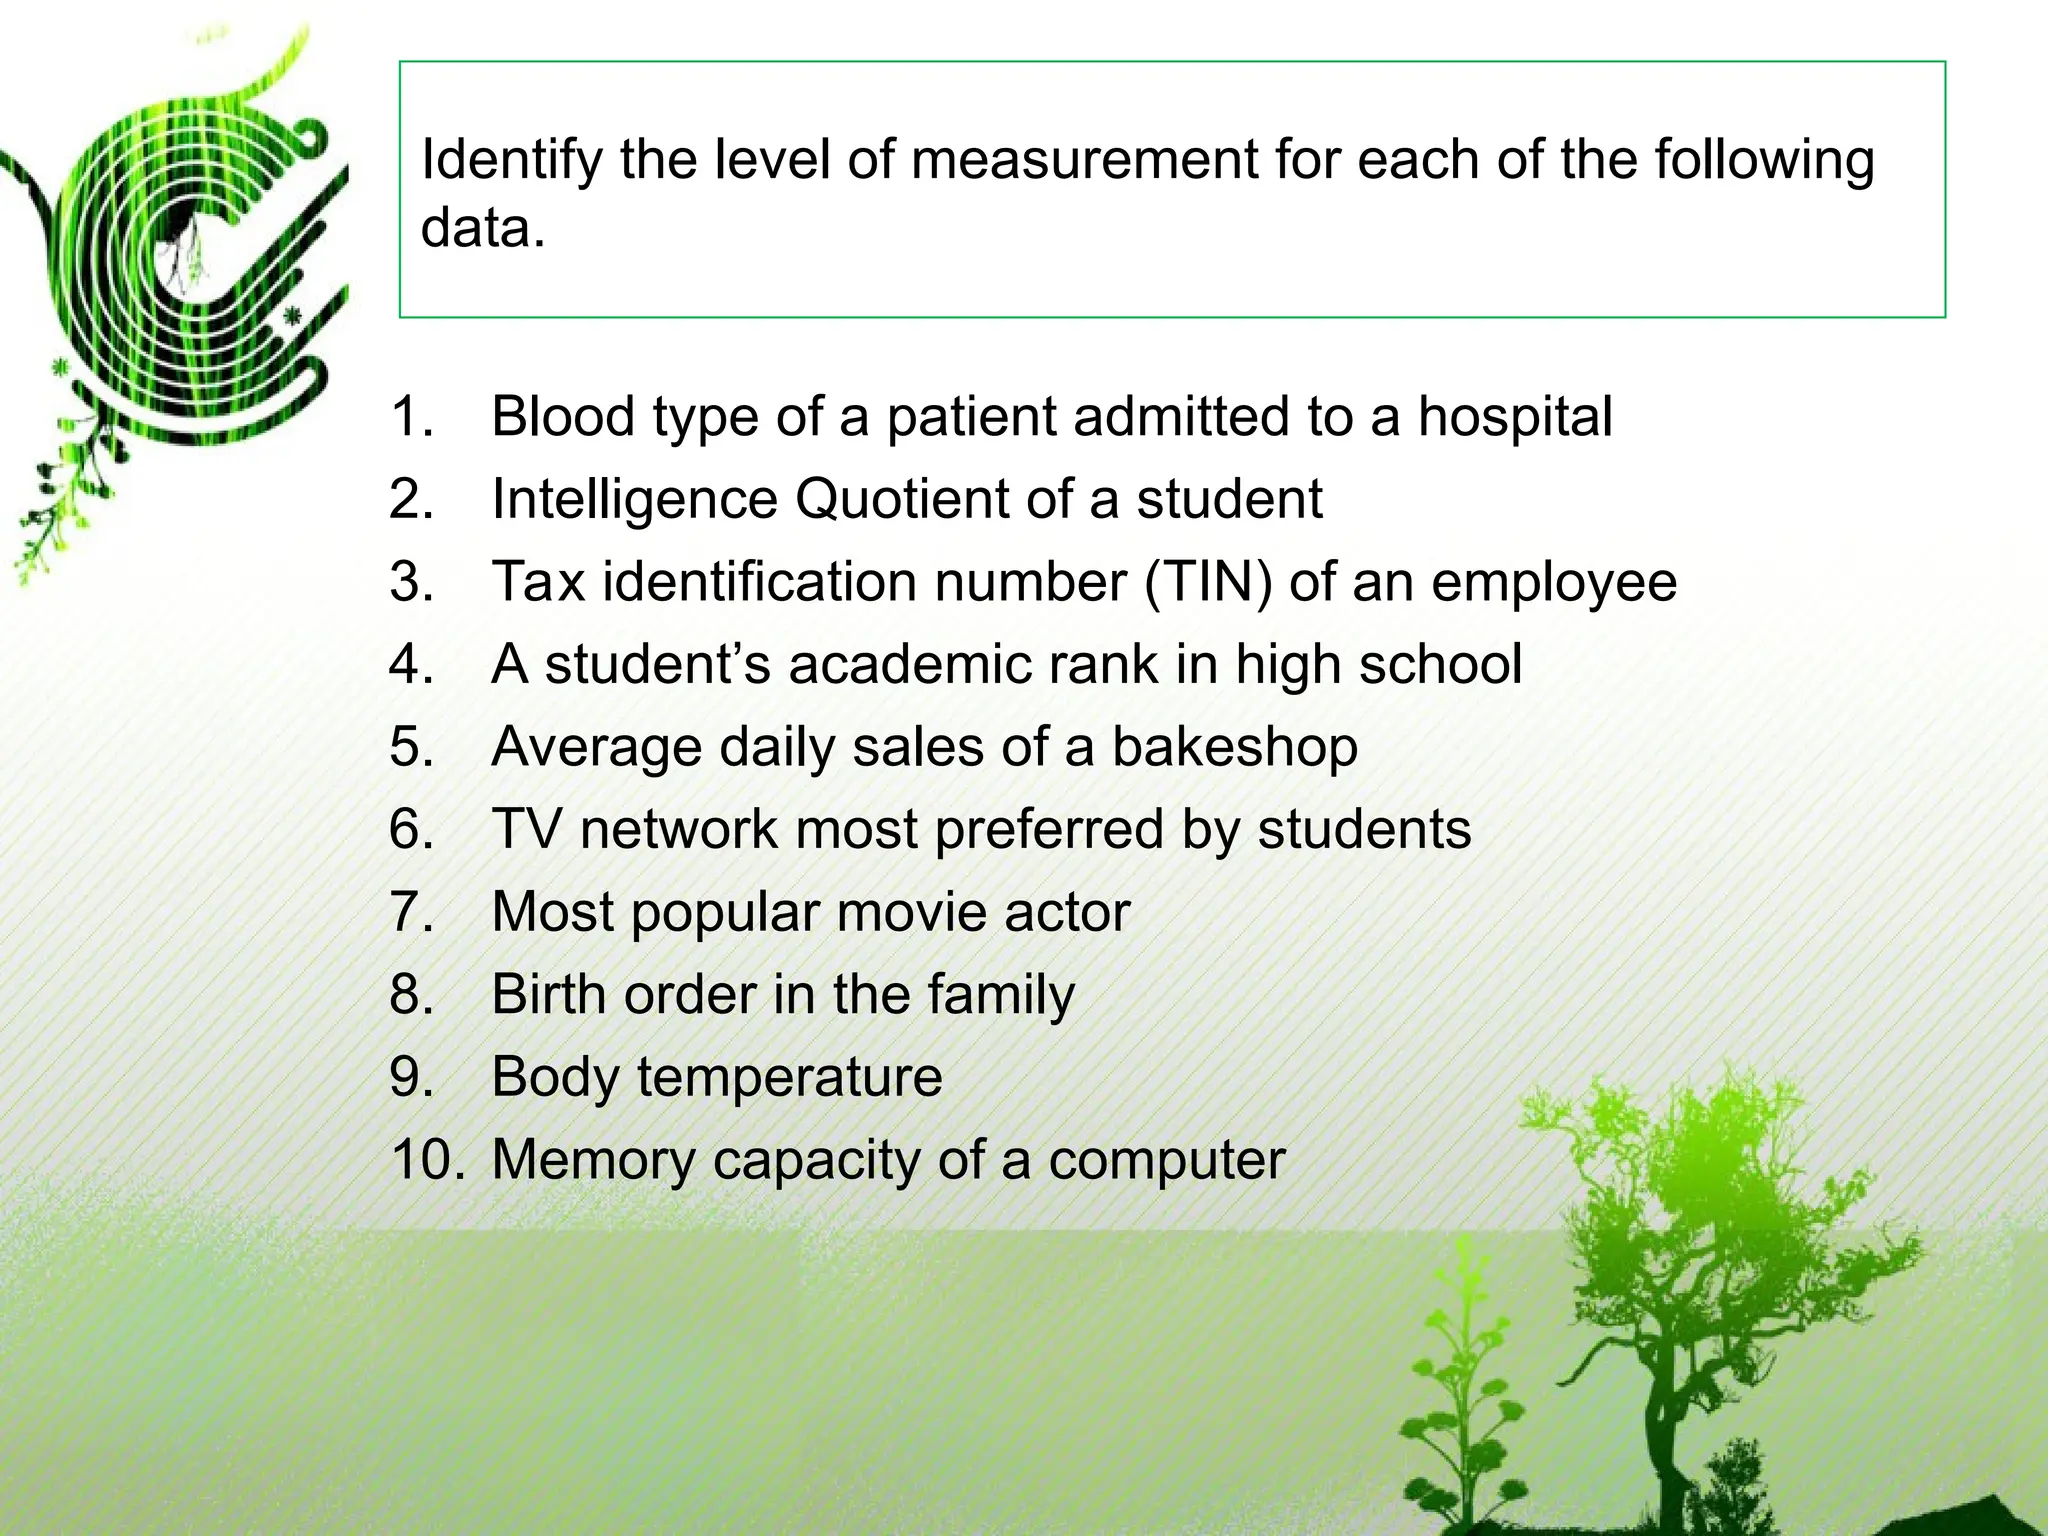
1. Blood typeof a patient admitted to a hospital
2. Intelligence Quotient of a student
3. Tax identification number (TIN) of an employee
4. A student’s academic rank in high school
5. Average daily sales of a bakeshop
6. TV network most preferred by students
7. Most popular movie actor
8. Birth order in the family
9. Body temperature
10. Memory capacity of a computer
Identify the level of measurement for each of the following
data.
16.
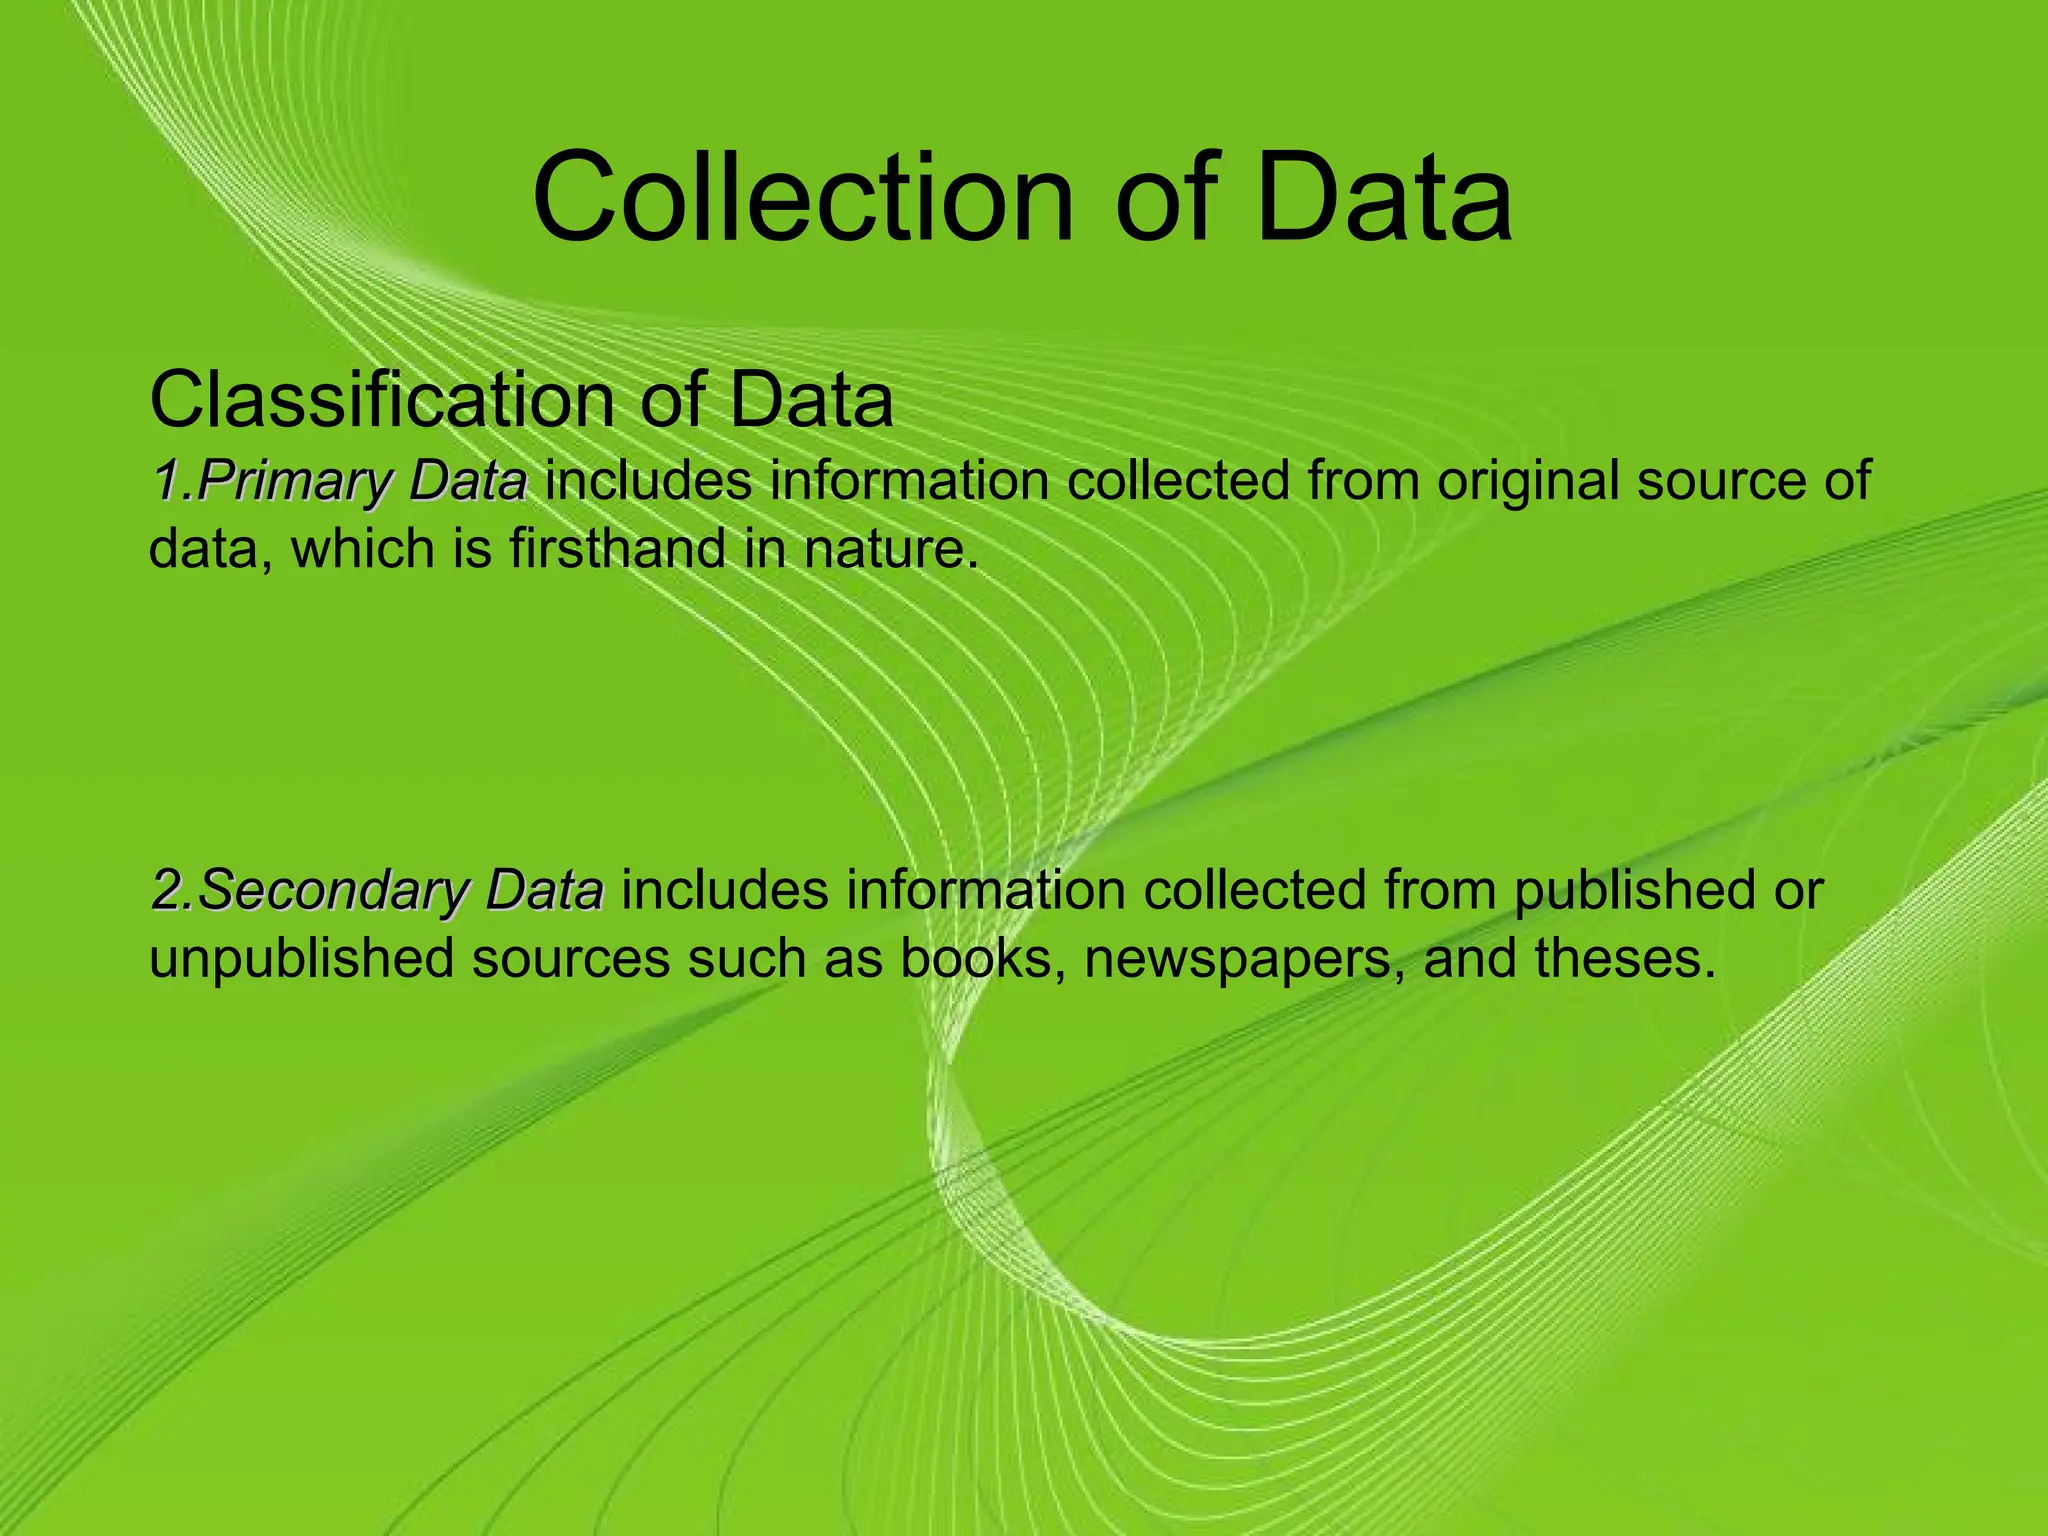
Collection of Data
Classificationof Data
1.
1.Primary Data
Primary Data includes information collected from original source of
data, which is firsthand in nature.
2.
2.Secondary Data
Secondary Data includes information collected from published or
unpublished sources such as books, newspapers, and theses.
17.
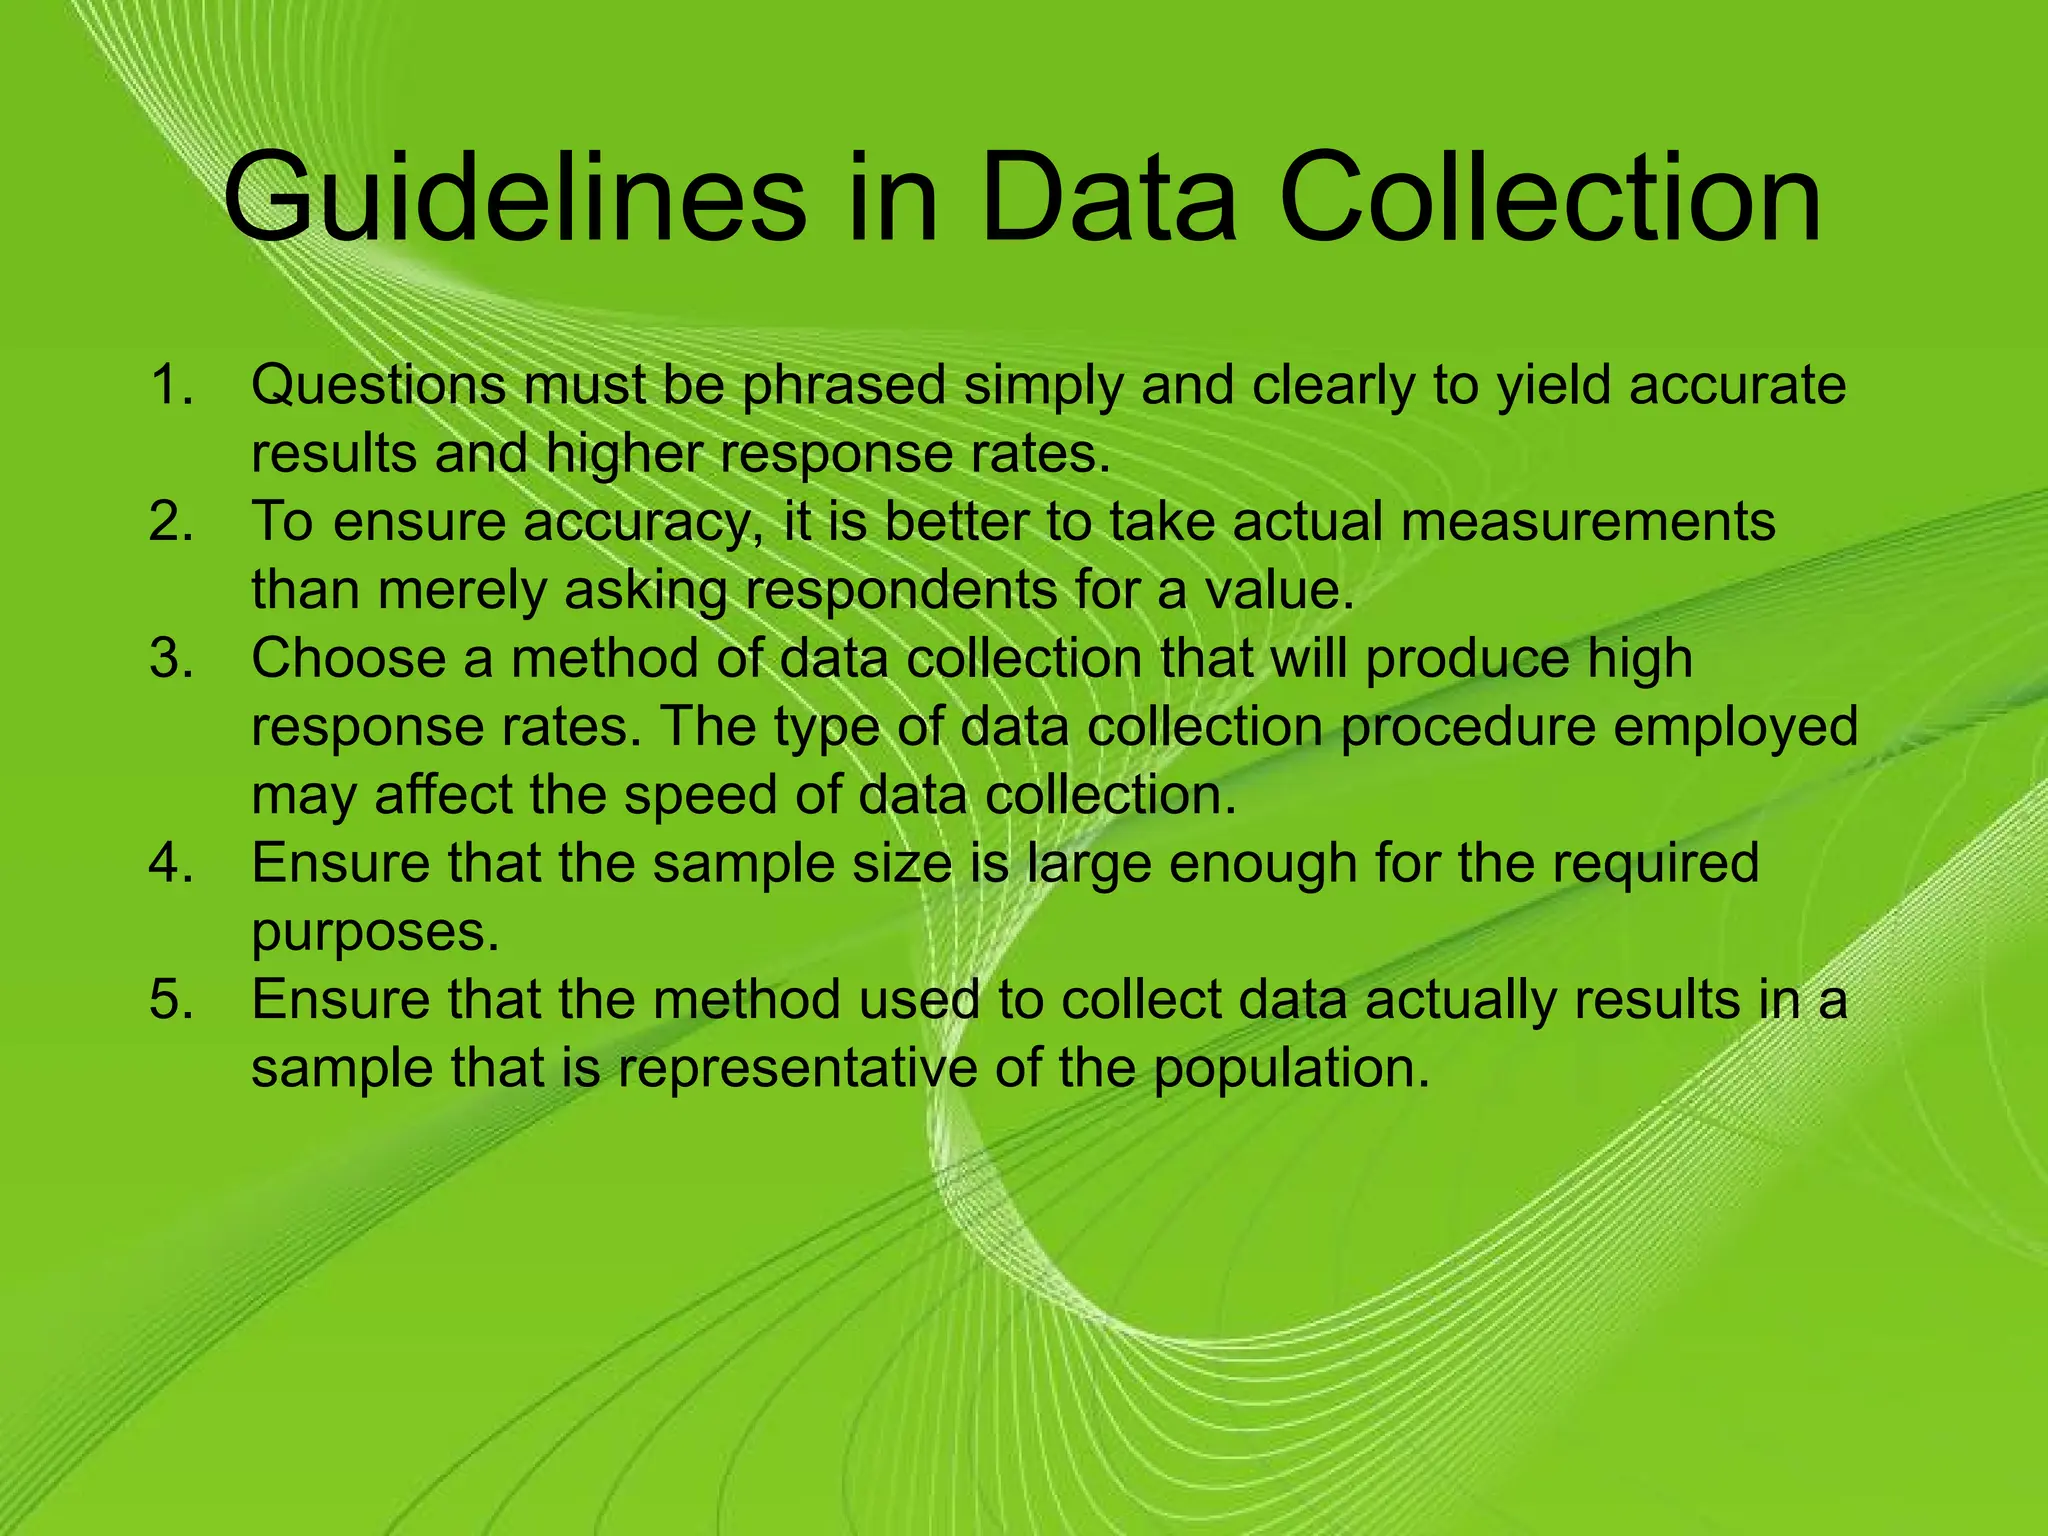
Guidelines in DataCollection
1. Questions must be phrased simply and clearly to yield accurate
results and higher response rates.
2. To ensure accuracy, it is better to take actual measurements
than merely asking respondents for a value.
3. Choose a method of data collection that will produce high
response rates. The type of data collection procedure employed
may affect the speed of data collection.
4. Ensure that the sample size is large enough for the required
purposes.
5. Ensure that the method used to collect data actually results in a
sample that is representative of the population.
18.
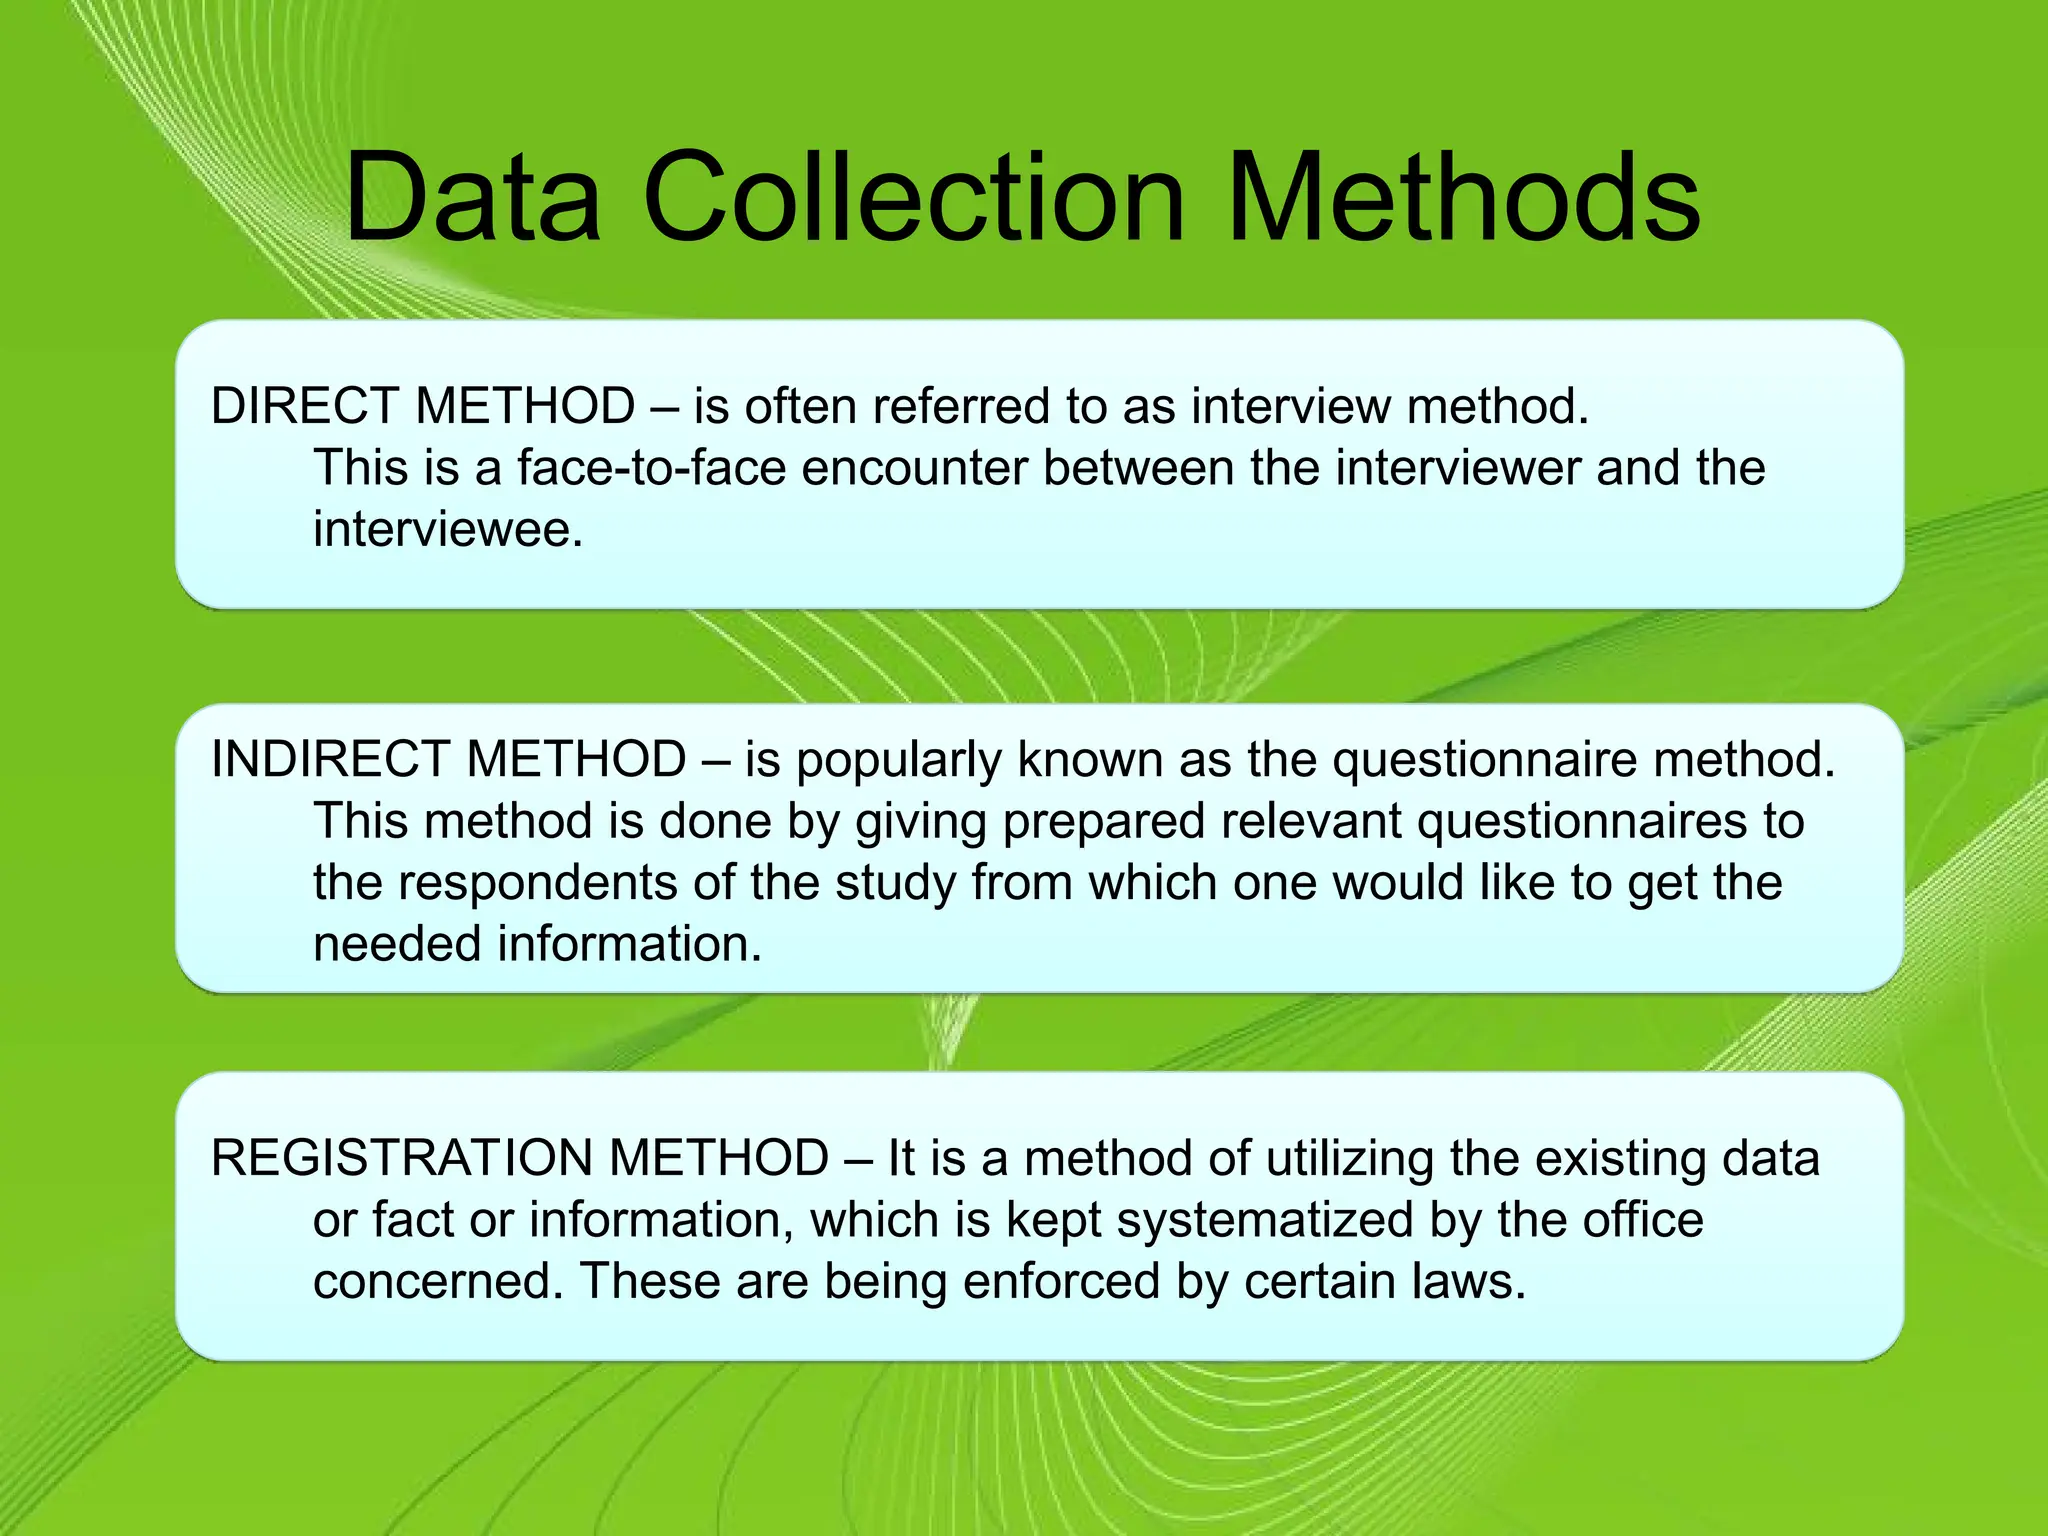
Data Collection Methods
DIRECTMETHOD – is often referred to as interview method.
This is a face-to-face encounter between the interviewer and the
interviewee.
INDIRECT METHOD – is popularly known as the questionnaire method.
This method is done by giving prepared relevant questionnaires to
the respondents of the study from which one would like to get the
needed information.
REGISTRATION METHOD – It is a method of utilizing the existing data
or fact or information, which is kept systematized by the office
concerned. These are being enforced by certain laws.
19.
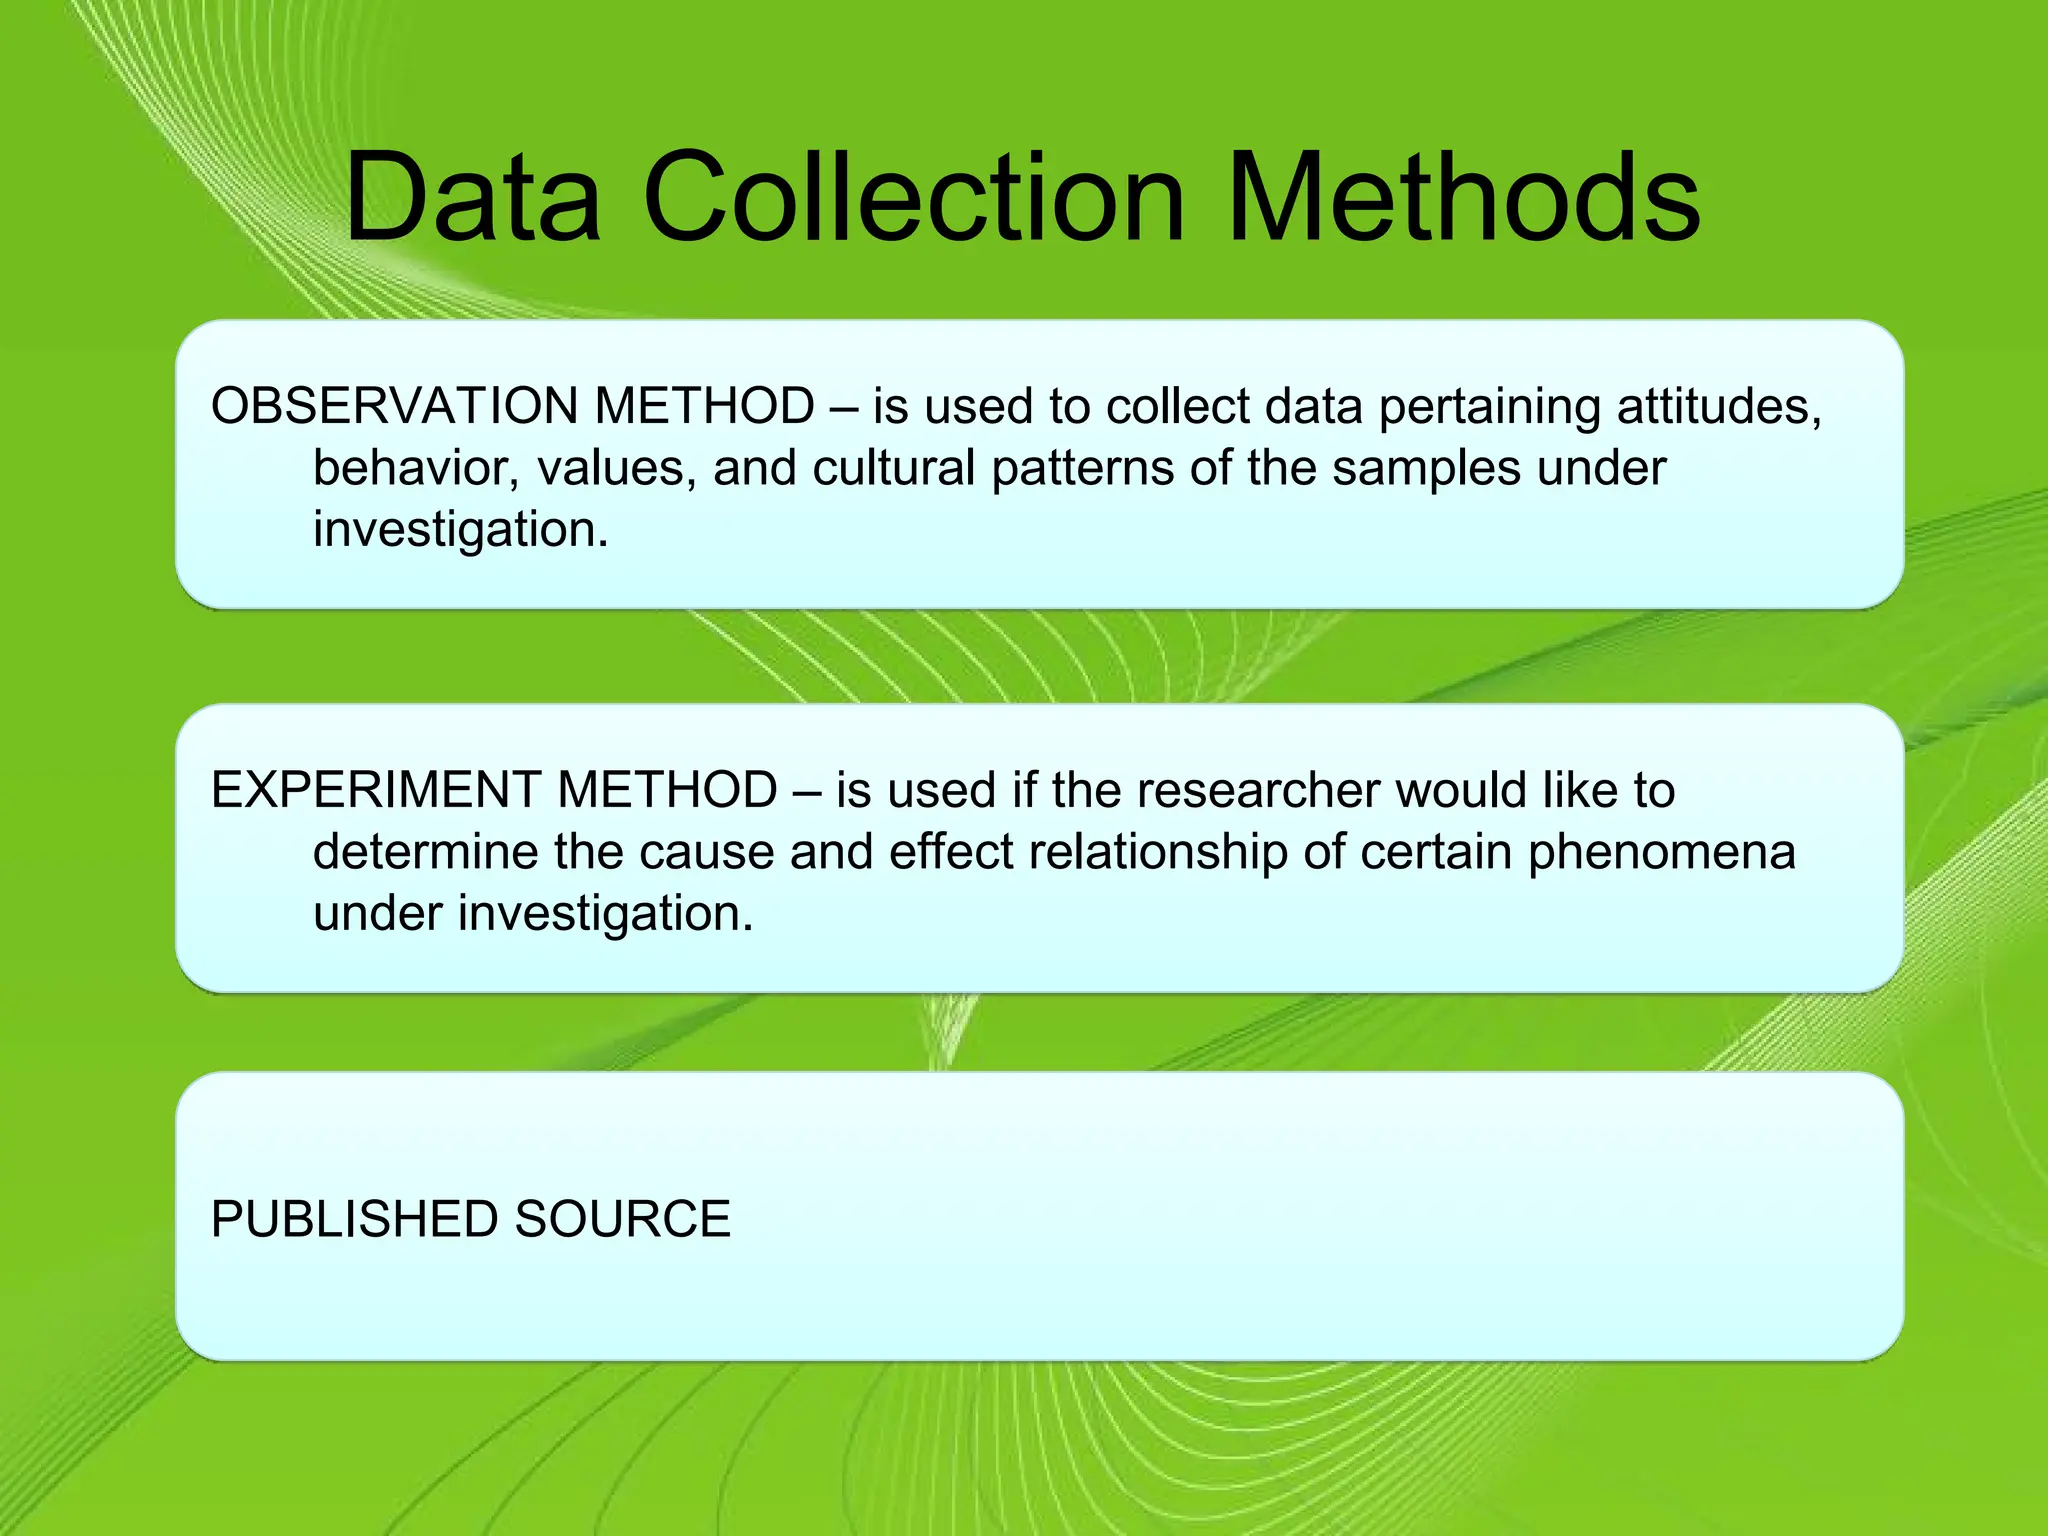
Data Collection Methods
OBSERVATIONMETHOD – is used to collect data pertaining attitudes,
behavior, values, and cultural patterns of the samples under
investigation.
EXPERIMENT METHOD – is used if the researcher would like to
determine the cause and effect relationship of certain phenomena
under investigation.
PUBLISHED SOURCE
20.
Data Collection Methods
1.Direct Method or Interview
2. Indirect Method or Questionnaire
3. Published Source
4. Experimentation
5. Observation
6. Registration
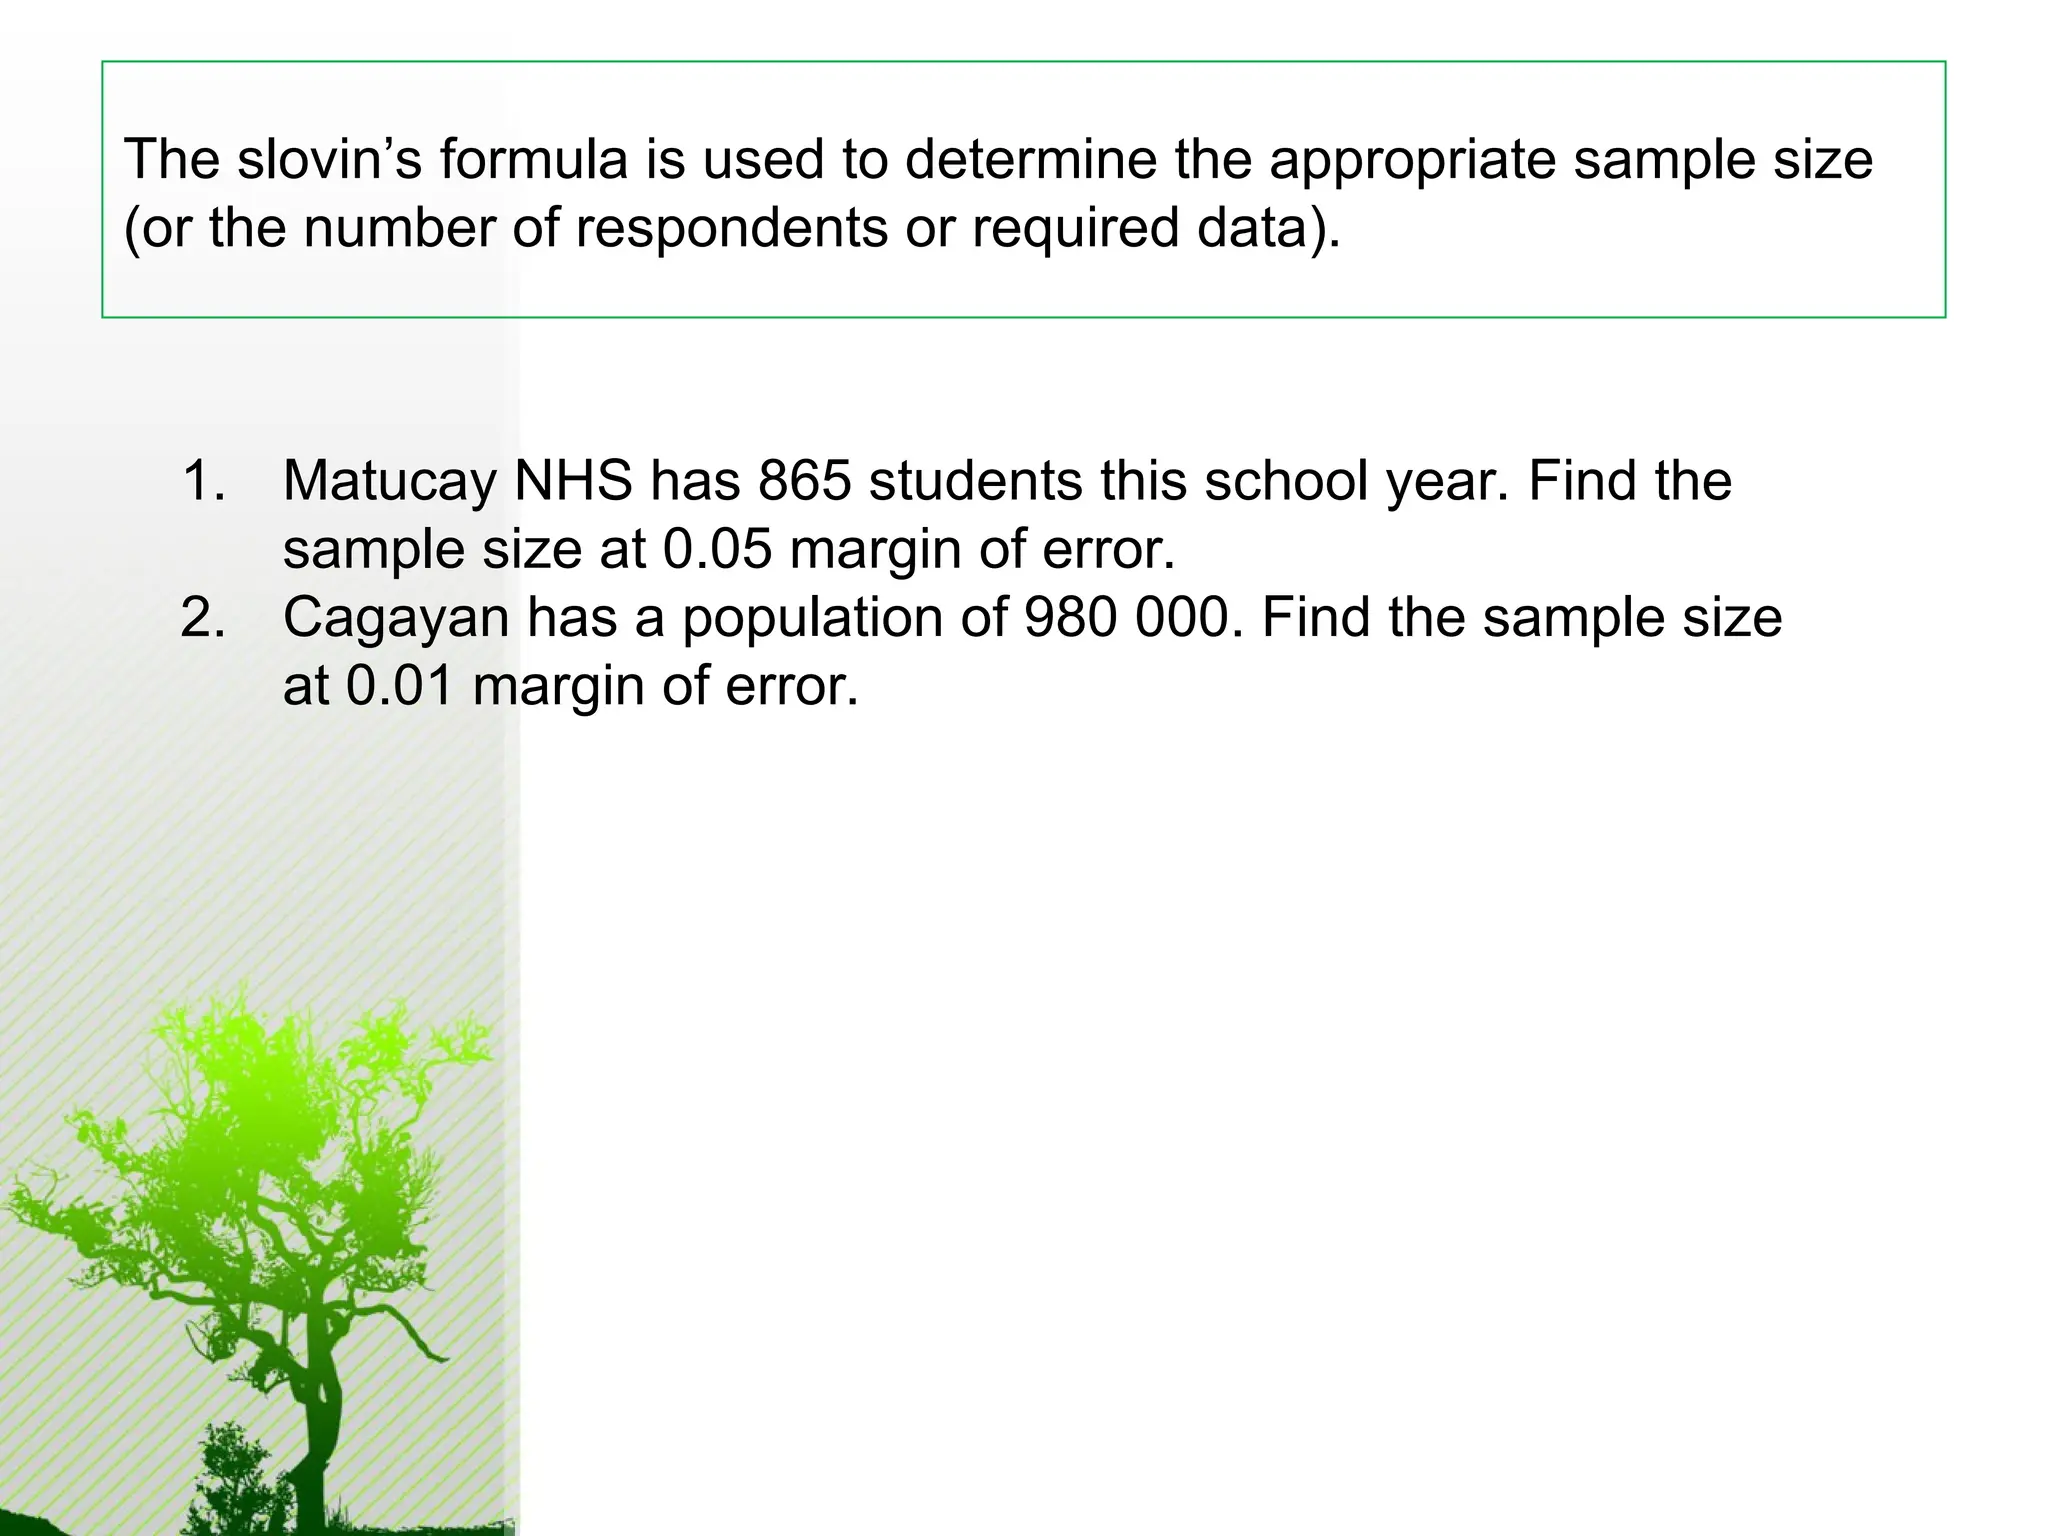
The slovin’s formulais used to determine the appropriate sample size
(or the number of respondents or required data).
1. Matucay NHS has 865 students this school year. Find the
sample size at 0.05 margin of error.
2. Cagayan has a population of 980 000. Find the sample size
at 0.01 margin of error.
23.
• is theprocess of careful selection of
members of a population to study and
make generalizations about a population.
Sampling
• is amethod of sampling where
each member of the population
has an equal chance of being
selected as a part of the sample.
• The most common techniques are
by drawing lots, using printed
tables of random numbers or using
numbers generated by computers.
Simple Random Sampling
26.
• is amethod of sampling where
each sample is taken by selecting
a member of a population on a
periodic interval.
• Choose an starting point and then
select every kth element (such as
every 3rd
) element in the
population.
Systematic Sampling
27.
• is amethod of sampling where
the population is divided into
homogeneous subgroups called
strata
strata and then a simple random
sample is taken from each of the
subgroups.
Stratified Random Sampling
28.
• Divide thepopulation area into
sections (or clusters) and
randomly select a few of those
sections, and finally, choose all
the members from the selected
sections.
Cluster Sampling
29.
• Is anon-random sampling of
choosing samples which is based
on a certain criteria and rules laid
down by the researcher.
Purposive Sampling
30.
• A non-randomsampling in which
the researcher limits the number
of his samples based on the
required number of the subject
under investigation.
Quota Sampling
31.
• is anon-probability sampling
procedure where the members of
the sample are determined based
on convenient availability,
proximity or accessibility to the
researcher.
Convenience Sampling
32.
• is anon-probability sampling
method where a member of the
sample is chosen through referral
of the other members of the
sample.
Snowball Sampling
33.
• is amethod of non-probability
sampling where the members of
the sample are selected based on
the typical, most frequent
observation or modal cases.
Modal Instance Sampling
34.
1. A reporterwho wishes to
interview five senators writes the
name of each senator on a
separate cards, and then draws
five names.
2. A market researcher obtains a
sample data from people who
chose to respond to an online
survey posted on the company’s
website.
Identify the type of sampling used in each statement.
35.
3. A programdirector gathers
information from all students
belonging to each of the five classes
selected randomly from a total of 20
classes.
4. A telemarketer sets the company’s
computerized dialing system to
contact every 40th
person listed in the
telephone directory.
Identify the type of sampling used in each statement.
36.
5. A marketingofficer mailed a
survey to a total of 300 members
of a fitness club. The sample
included 100 members randomly
selected from each membership
classifications, such as full
membership, lifetime associate
membership and yearly
membership.
Identify the type of sampling used in each statement.
37.
6. An actressis preparing for the
role of a young female who has
recovered from a severe drug
addiction. She decided to get
information from people who
have been in such a case. The
actress looked for a reliable
person who can refer her to
somebody who has recovered
from the same addiction.
Identify the type of sampling used in each statement.
38.
7. A realestate agent is looking for
possible buyers of a condominium
unit located at a business district in a
certain city. He went to a mall and
distributed flyers to those whom he
thinks can afford the condominium
unit’s high cost. He identified possible
buyers based on their physical
appearance and manner of dressing.
8. An engineer selects every 50th
item
from the assembly line for careful
testing and analysis.
Identify the type of sampling used in each statement.
39.
9. A JohnHopkins University researcher
surveys all cardiac patients in each of
30 randomly selected hospitals.
10. A General Motors researcher has
partitioned all registered cars into
categories of subcompact, compact,
mid-size, intermediate and full-size.
He is surveying 200 randomly
selected car owners from each
category.
Identify the type of sampling used in each statement.
40.
Methods of DataOrganization
1.
1. Textual Method
Textual Method (paragraph form) – important
characteristics of the data are given emphasis.
2.
2. Tabular Method
Tabular Method (frequency distribution table or
FDT) – shows the groupings of the data into
number of classes (intervals).
3.
3. Graphical Method
Graphical Method (chart) – visual representation
of the frequency distribution..
Presentation of Data
41.
Textual Method (ParagraphForm)
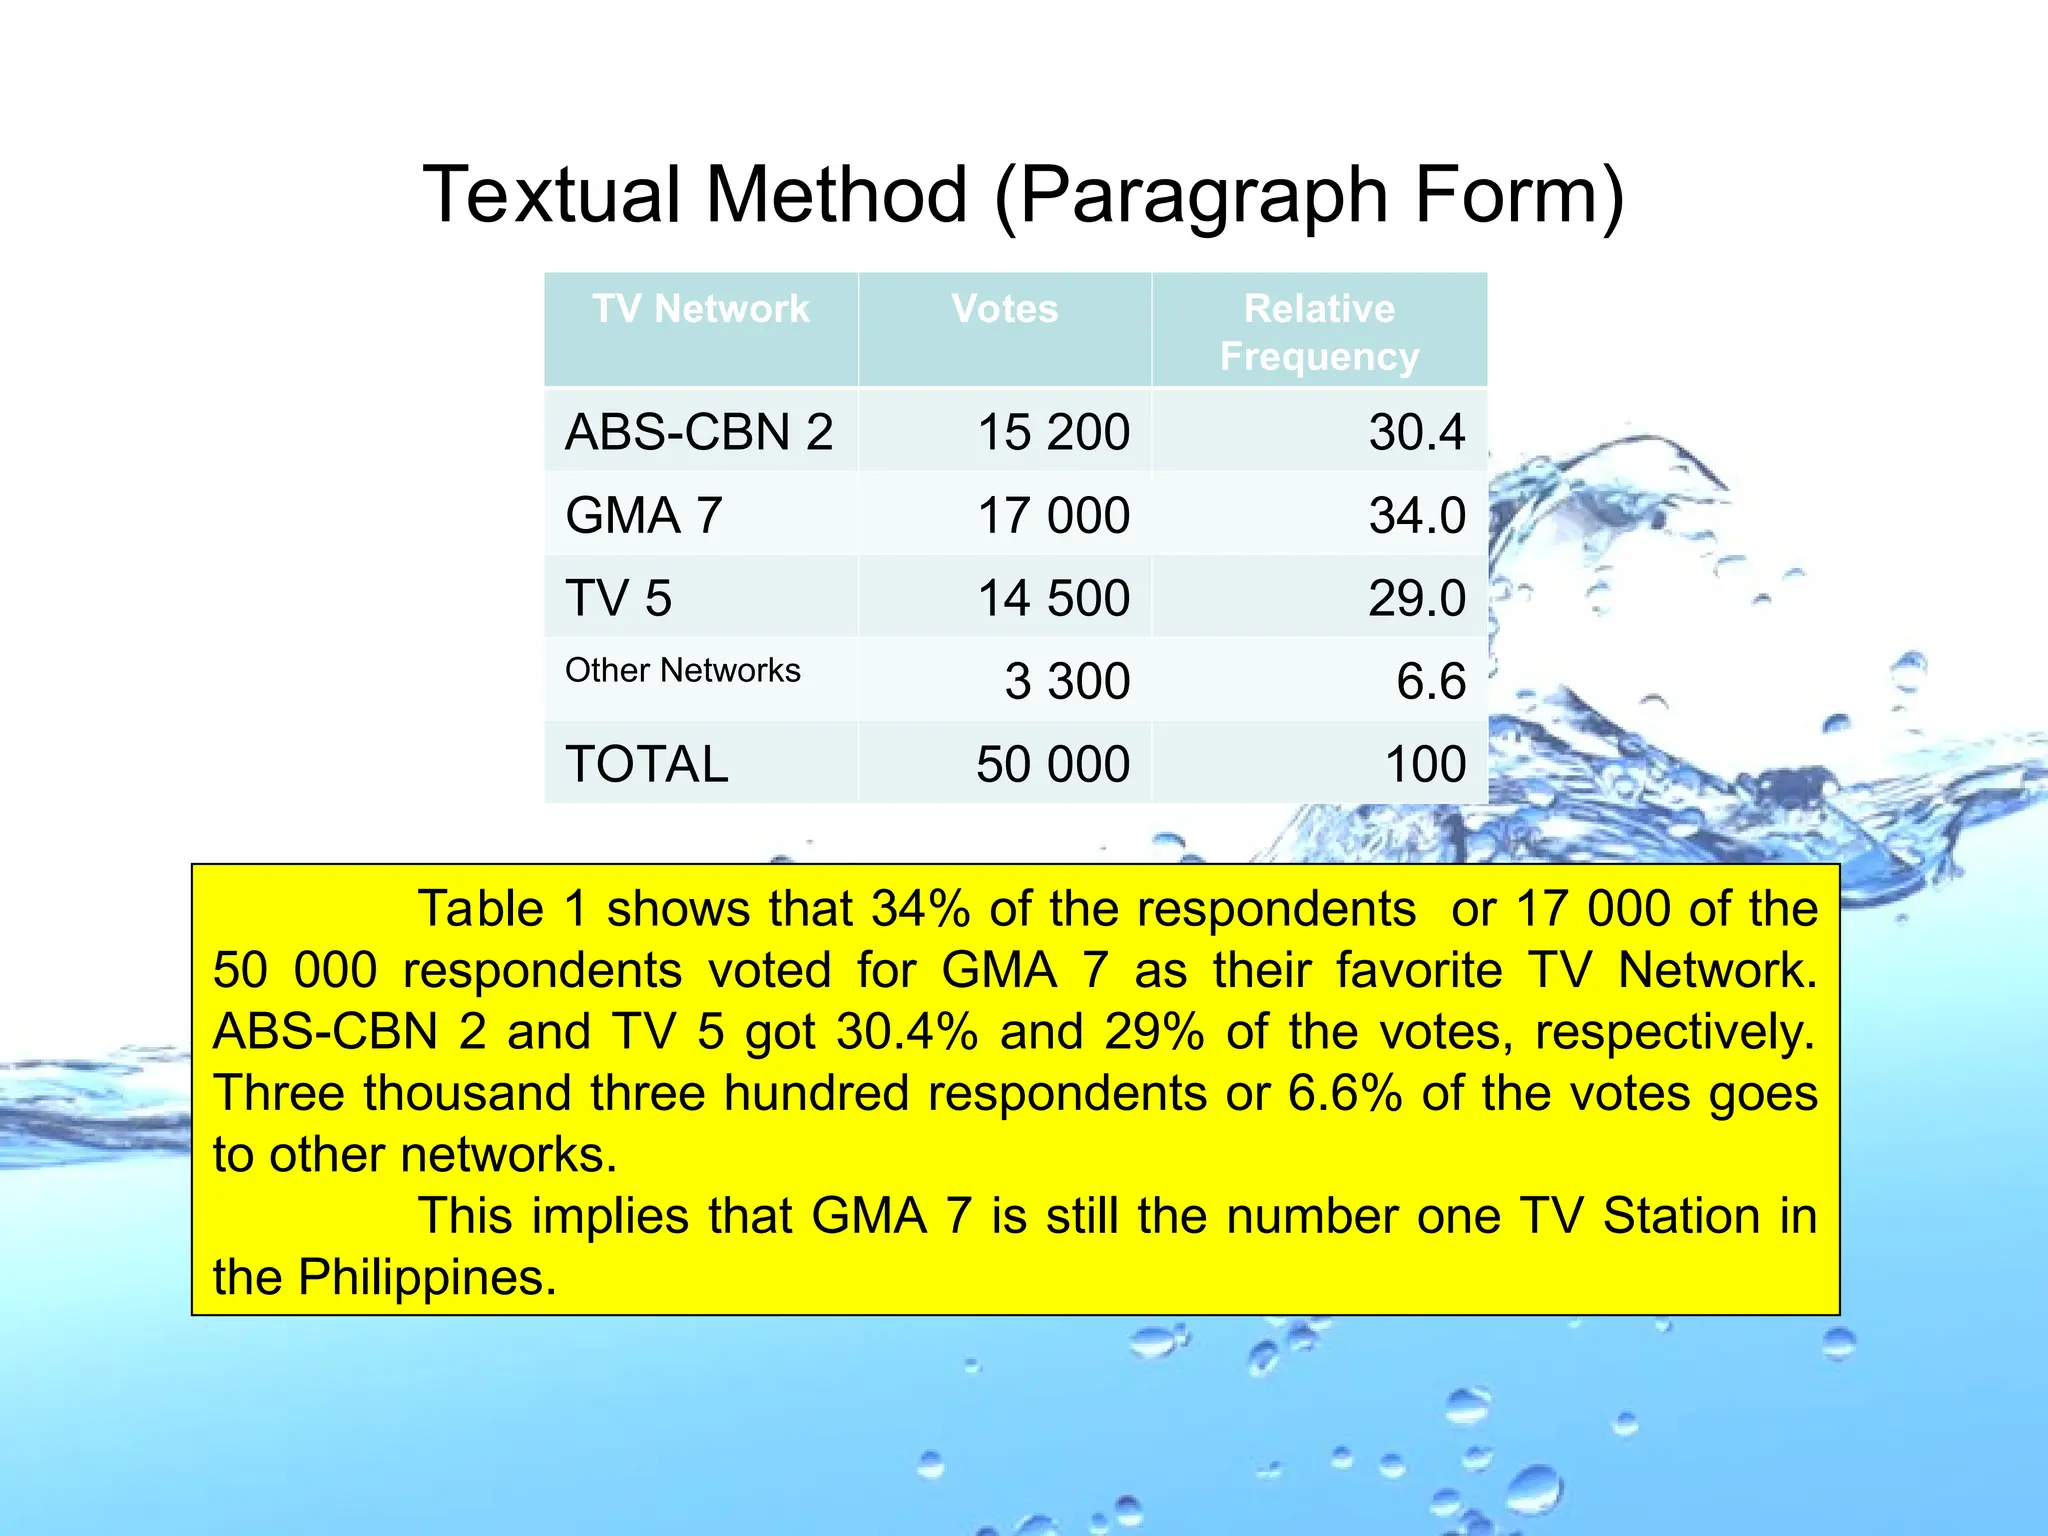
TV Network Votes Relative
Frequency
ABS-CBN 2 15 200 30.4
GMA 7 17 000 34.0
TV 5 14 500 29.0
Other Networks 3 300 6.6
TOTAL 50 000 100
Table 1 shows that 34% of the respondents or 17 000 of the
50 000 respondents voted for GMA 7 as their favorite TV Network.
ABS-CBN 2 and TV 5 got 30.4% and 29% of the votes, respectively.
Three thousand three hundred respondents or 6.6% of the votes goes
to other networks.
This implies that GMA 7 is still the number one TV Station in
the Philippines.
42.
Lists data values(either individually or
by groups of intervals) along with their
corresponding frequencies or counts
Frequency Distribution Table
43.
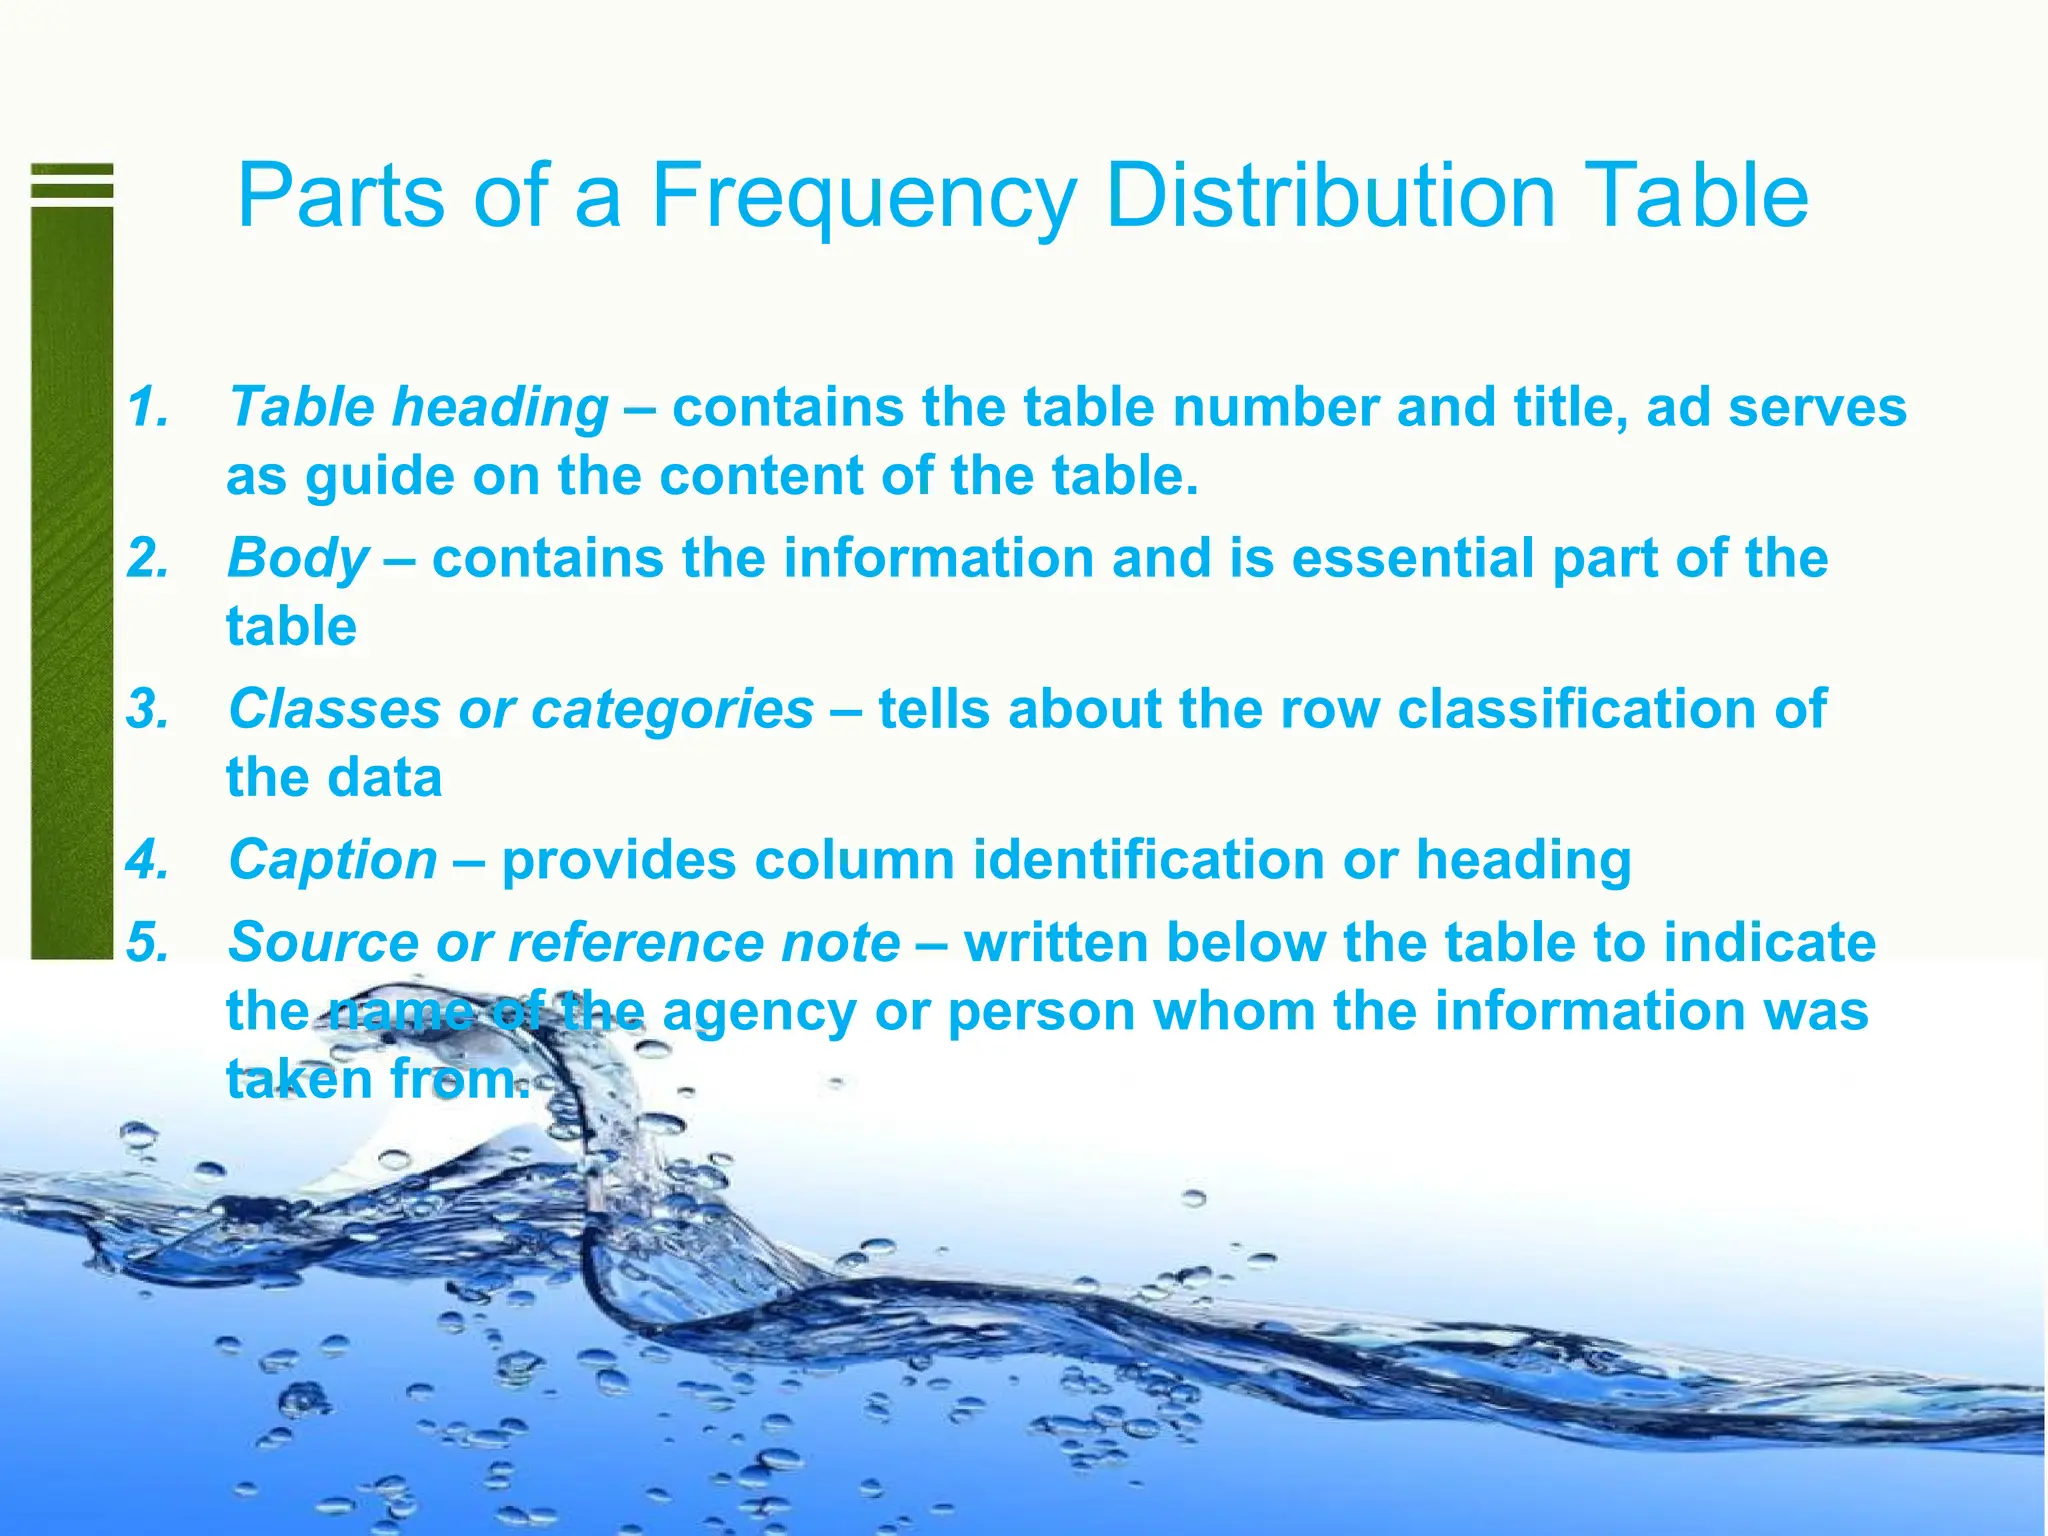
1. Table heading– contains the table number and title, ad serves
as guide on the content of the table.
2. Body – contains the information and is essential part of the
table
3. Classes or categories – tells about the row classification of
the data
4. Caption – provides column identification or heading
5. Source or reference note – written below the table to indicate
the name of the agency or person whom the information was
taken from.
Parts of a Frequency Distribution Table
44.
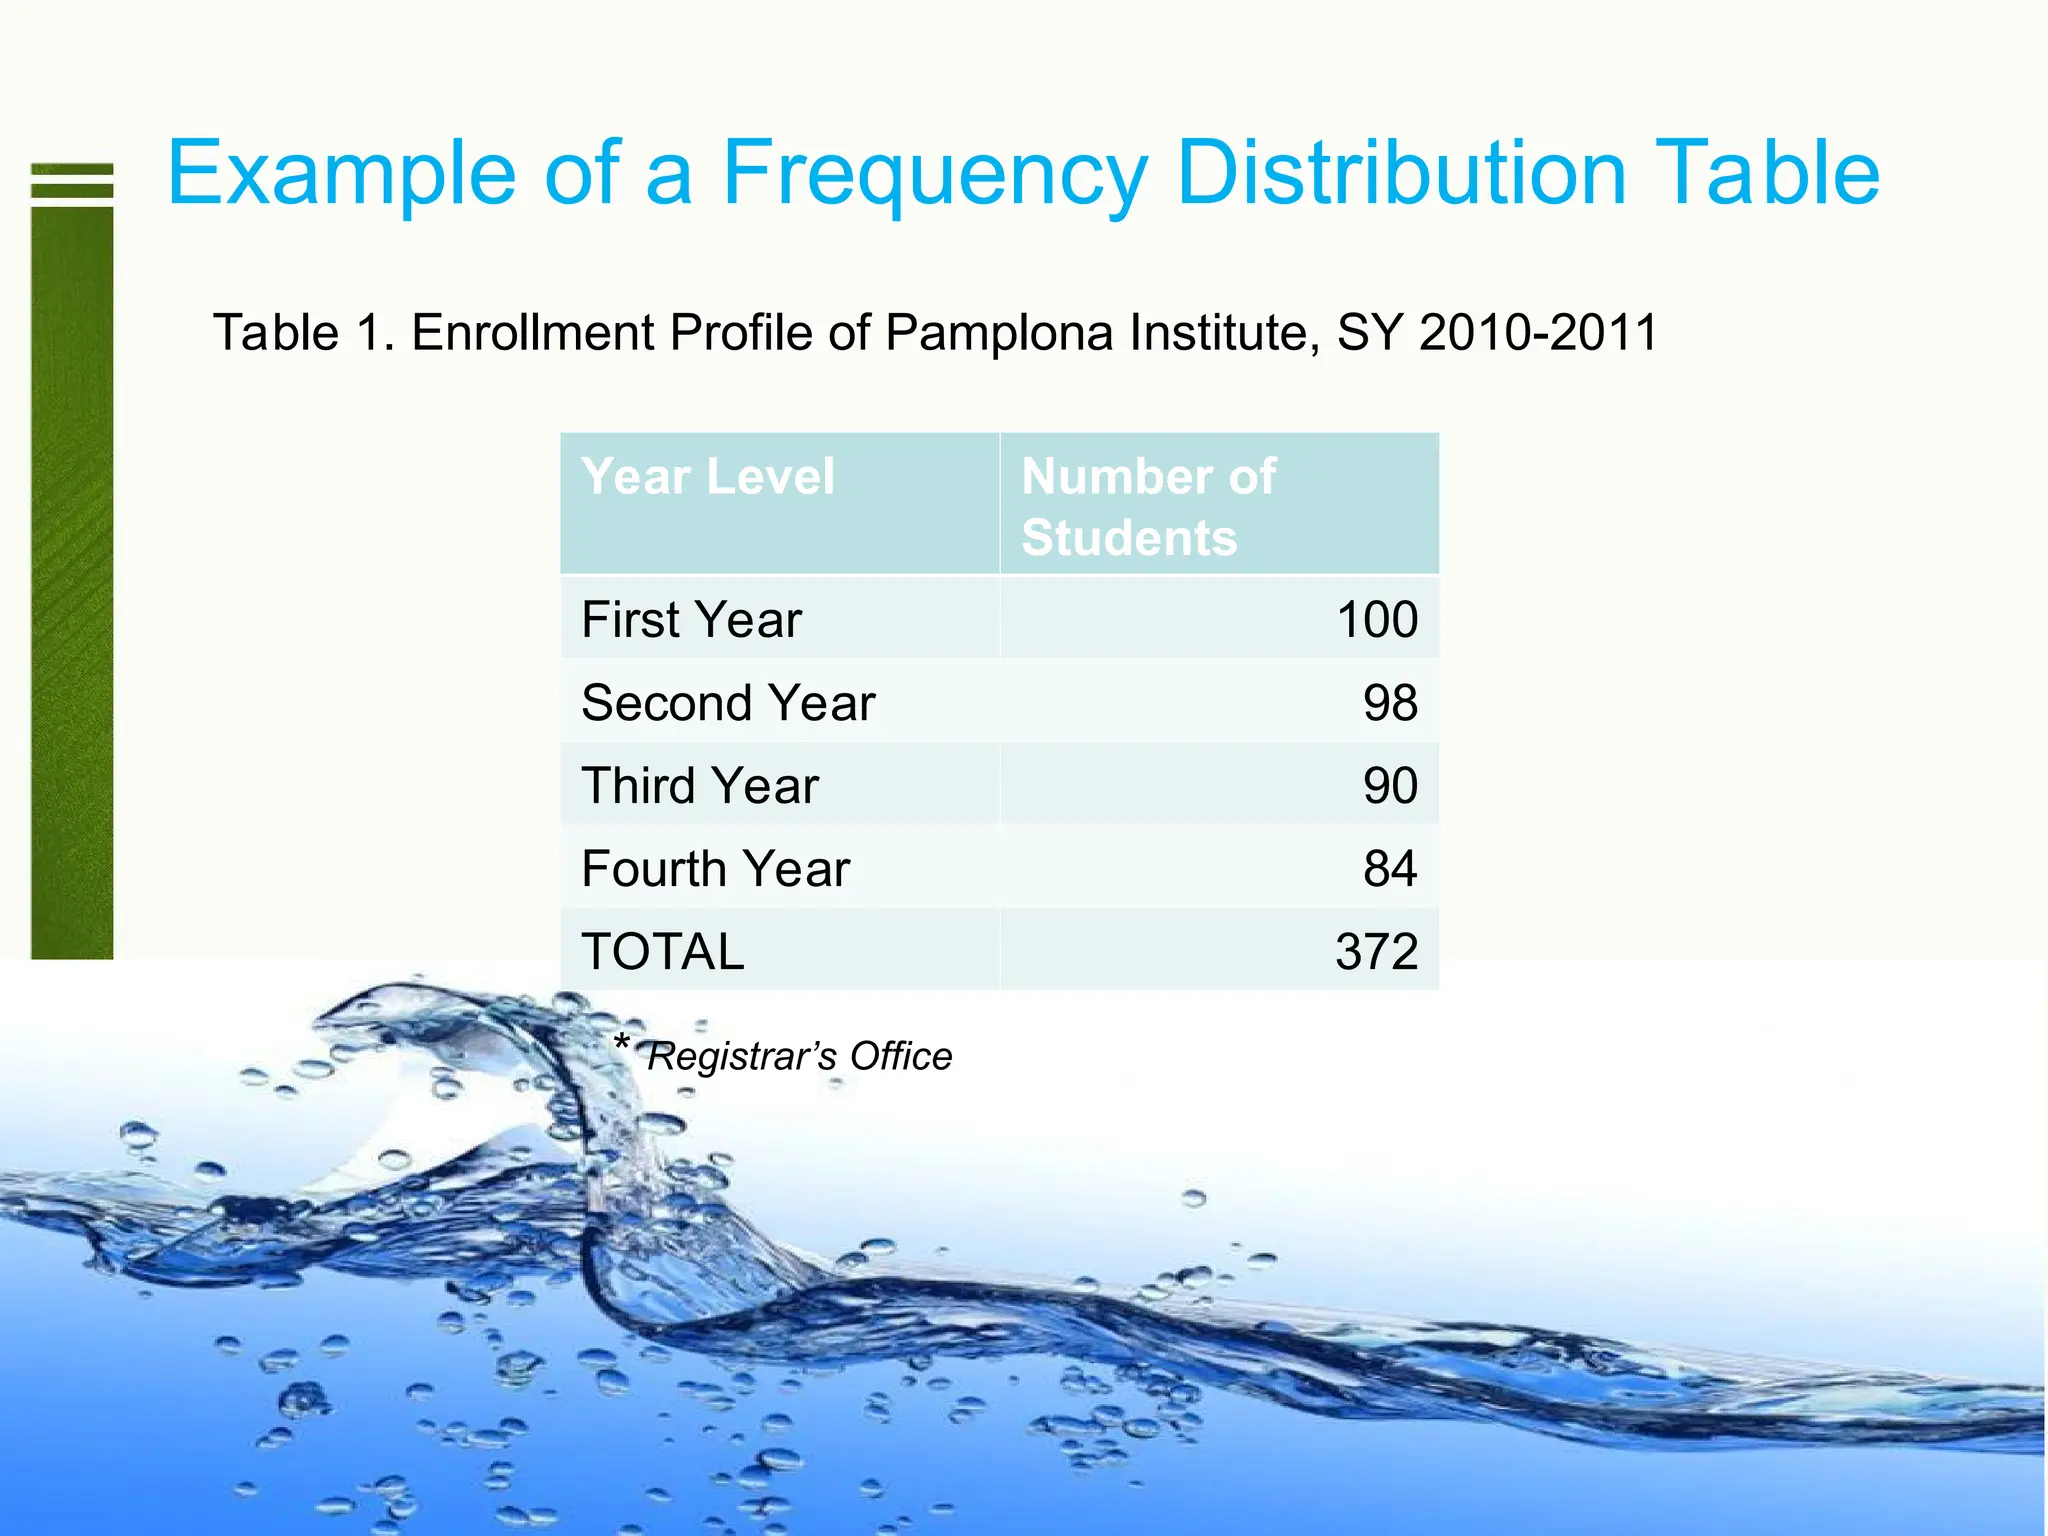
Example of aFrequency Distribution Table
Table 1. Enrollment Profile of Pamplona Institute, SY 2010-2011
Year Level Number of
Students
First Year 100
Second Year 98
Third Year 90
Fourth Year 84
TOTAL 372
* Registrar’s Office
45.
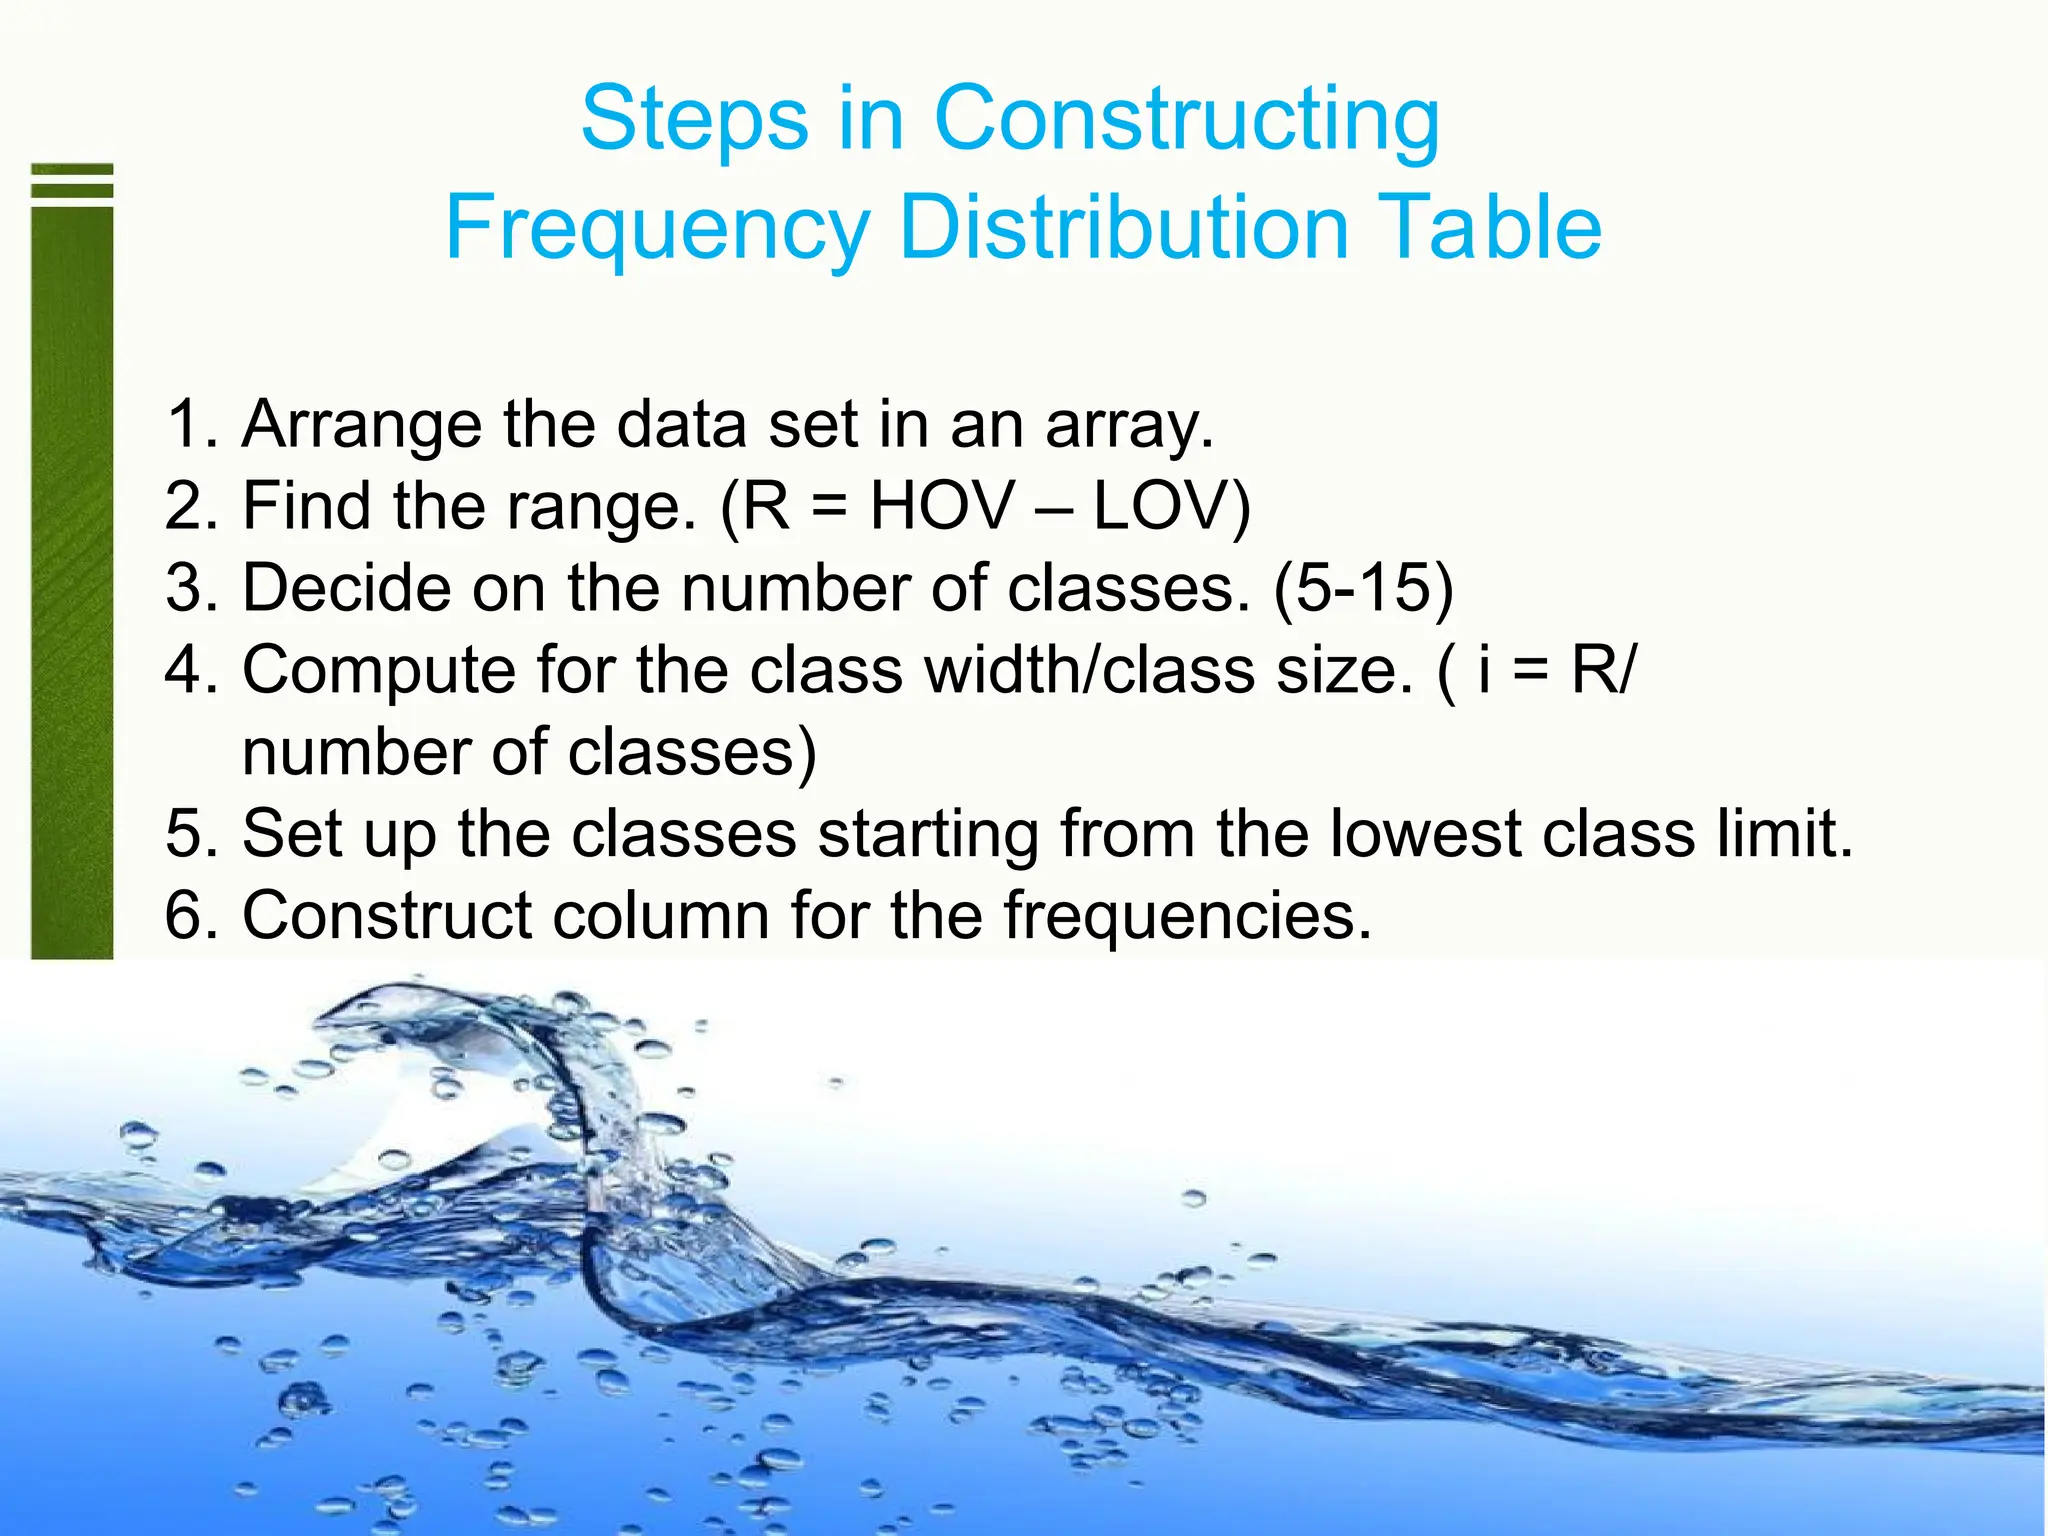
Steps in Constructing
FrequencyDistribution Table
1. Arrange the data set in an array.
2. Find the range. (R = HOV – LOV)
3. Decide on the number of classes. (5-15)
4. Compute for the class width/class size. ( i = R/
number of classes)
5. Set up the classes starting from the lowest class limit.
6. Construct column for the frequencies.
46.
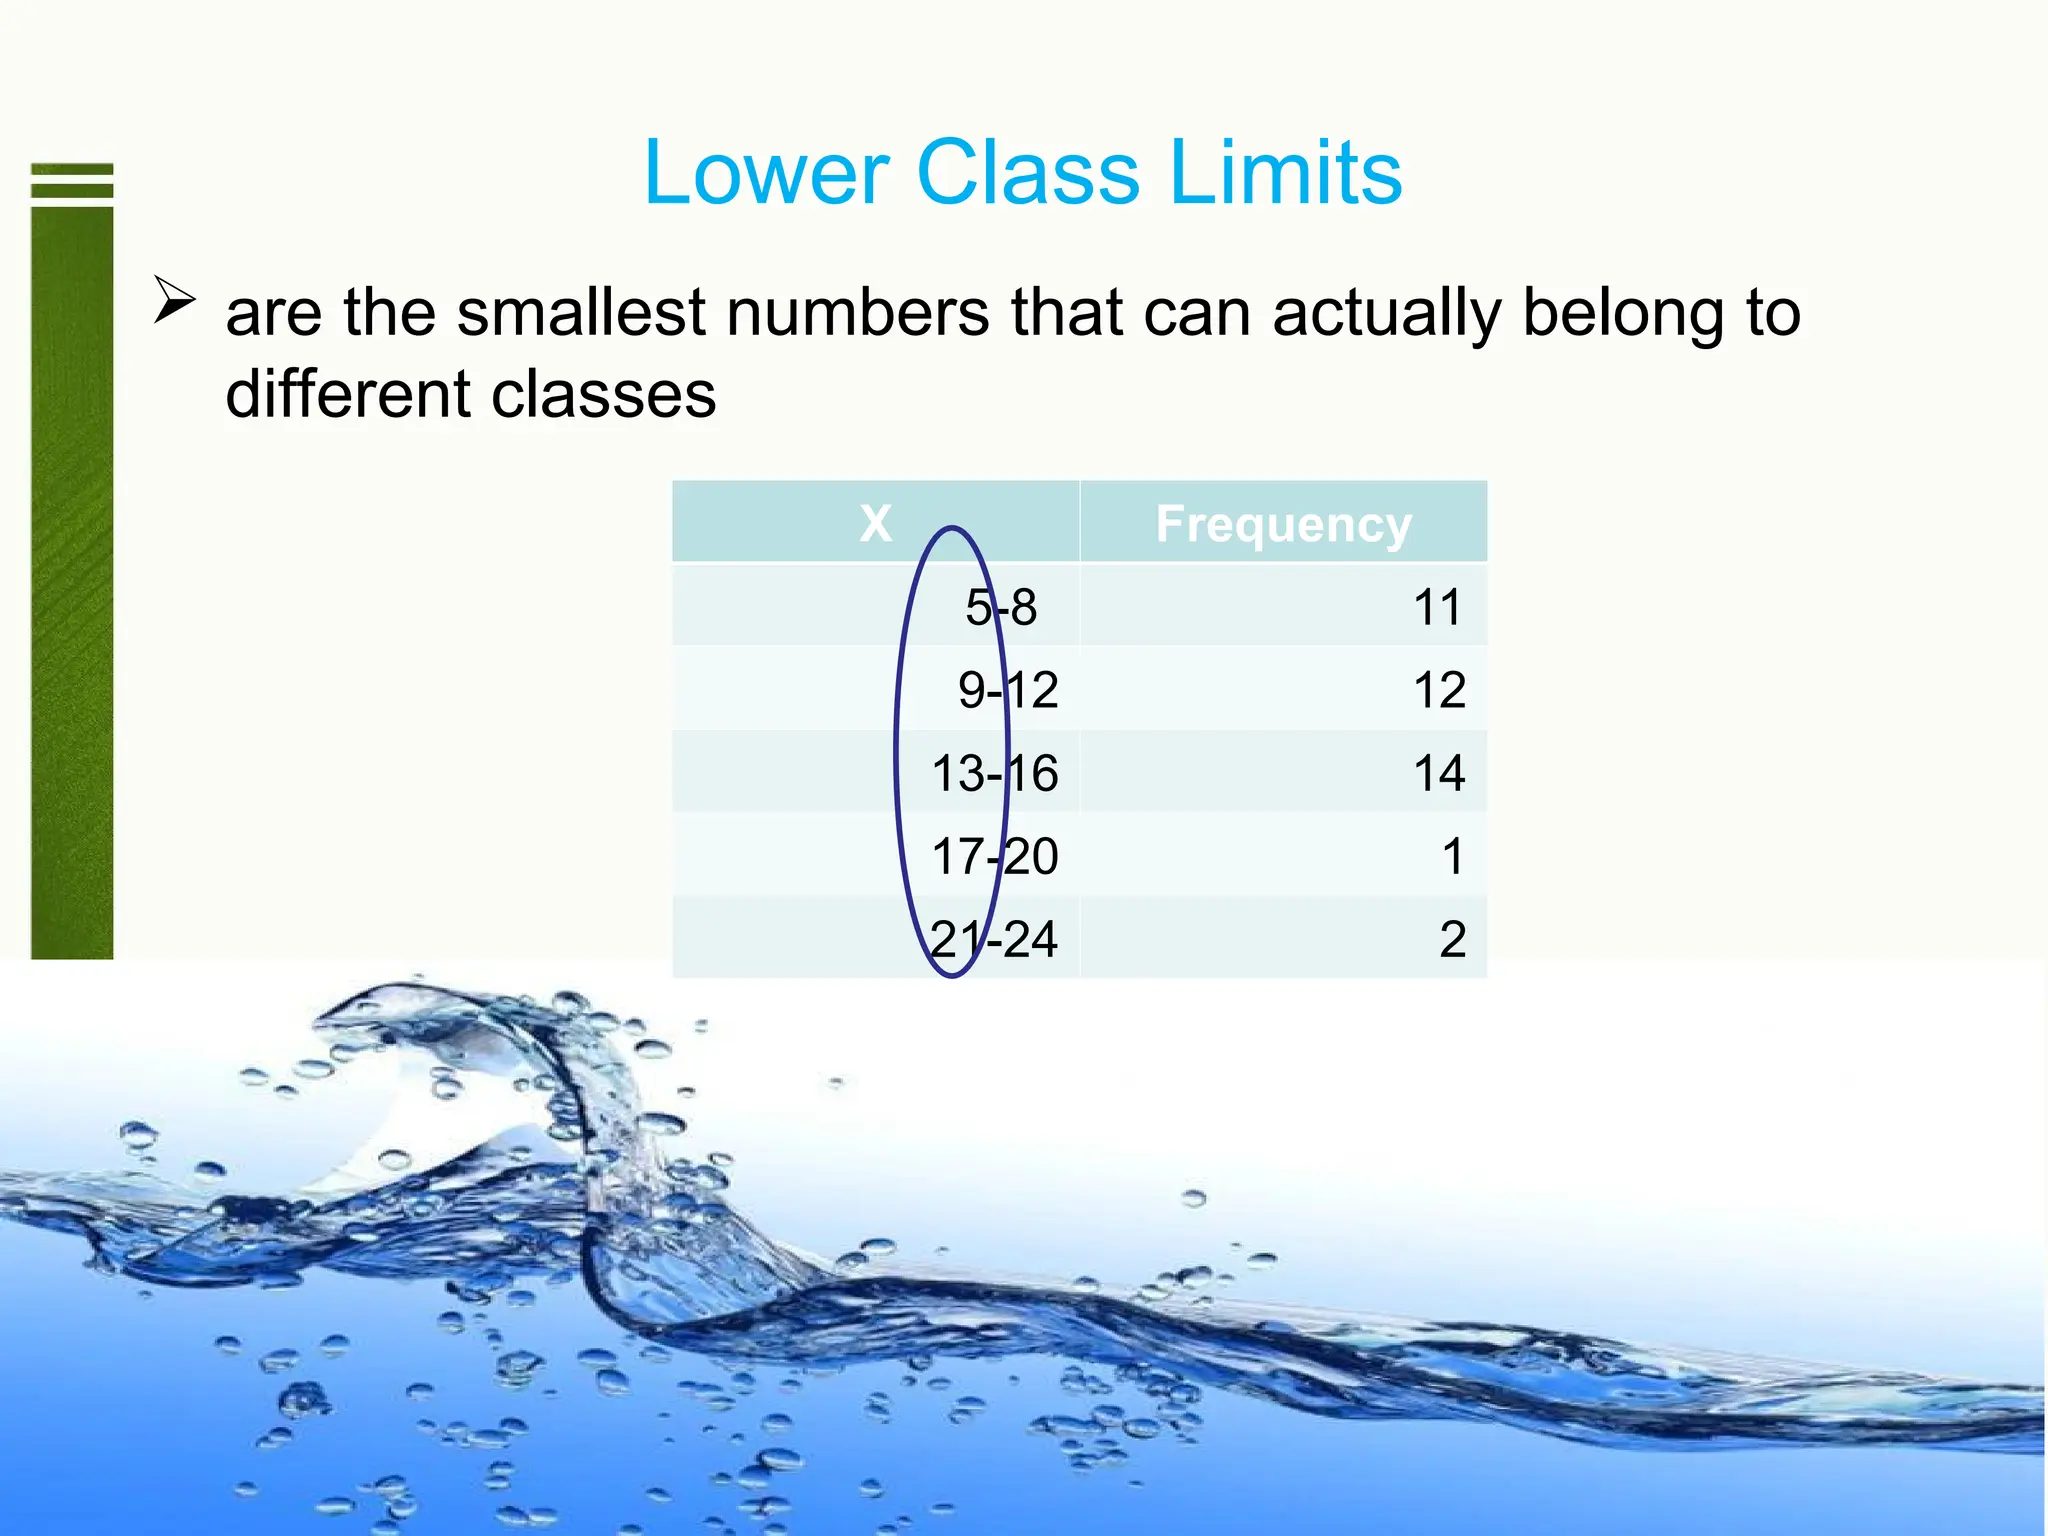
Lower Class Limits
are the smallest numbers that can actually belong to
different classes
X Frequency
5-8 11
9-12 12
13-16 14
17-20 1
21-24 2
47.
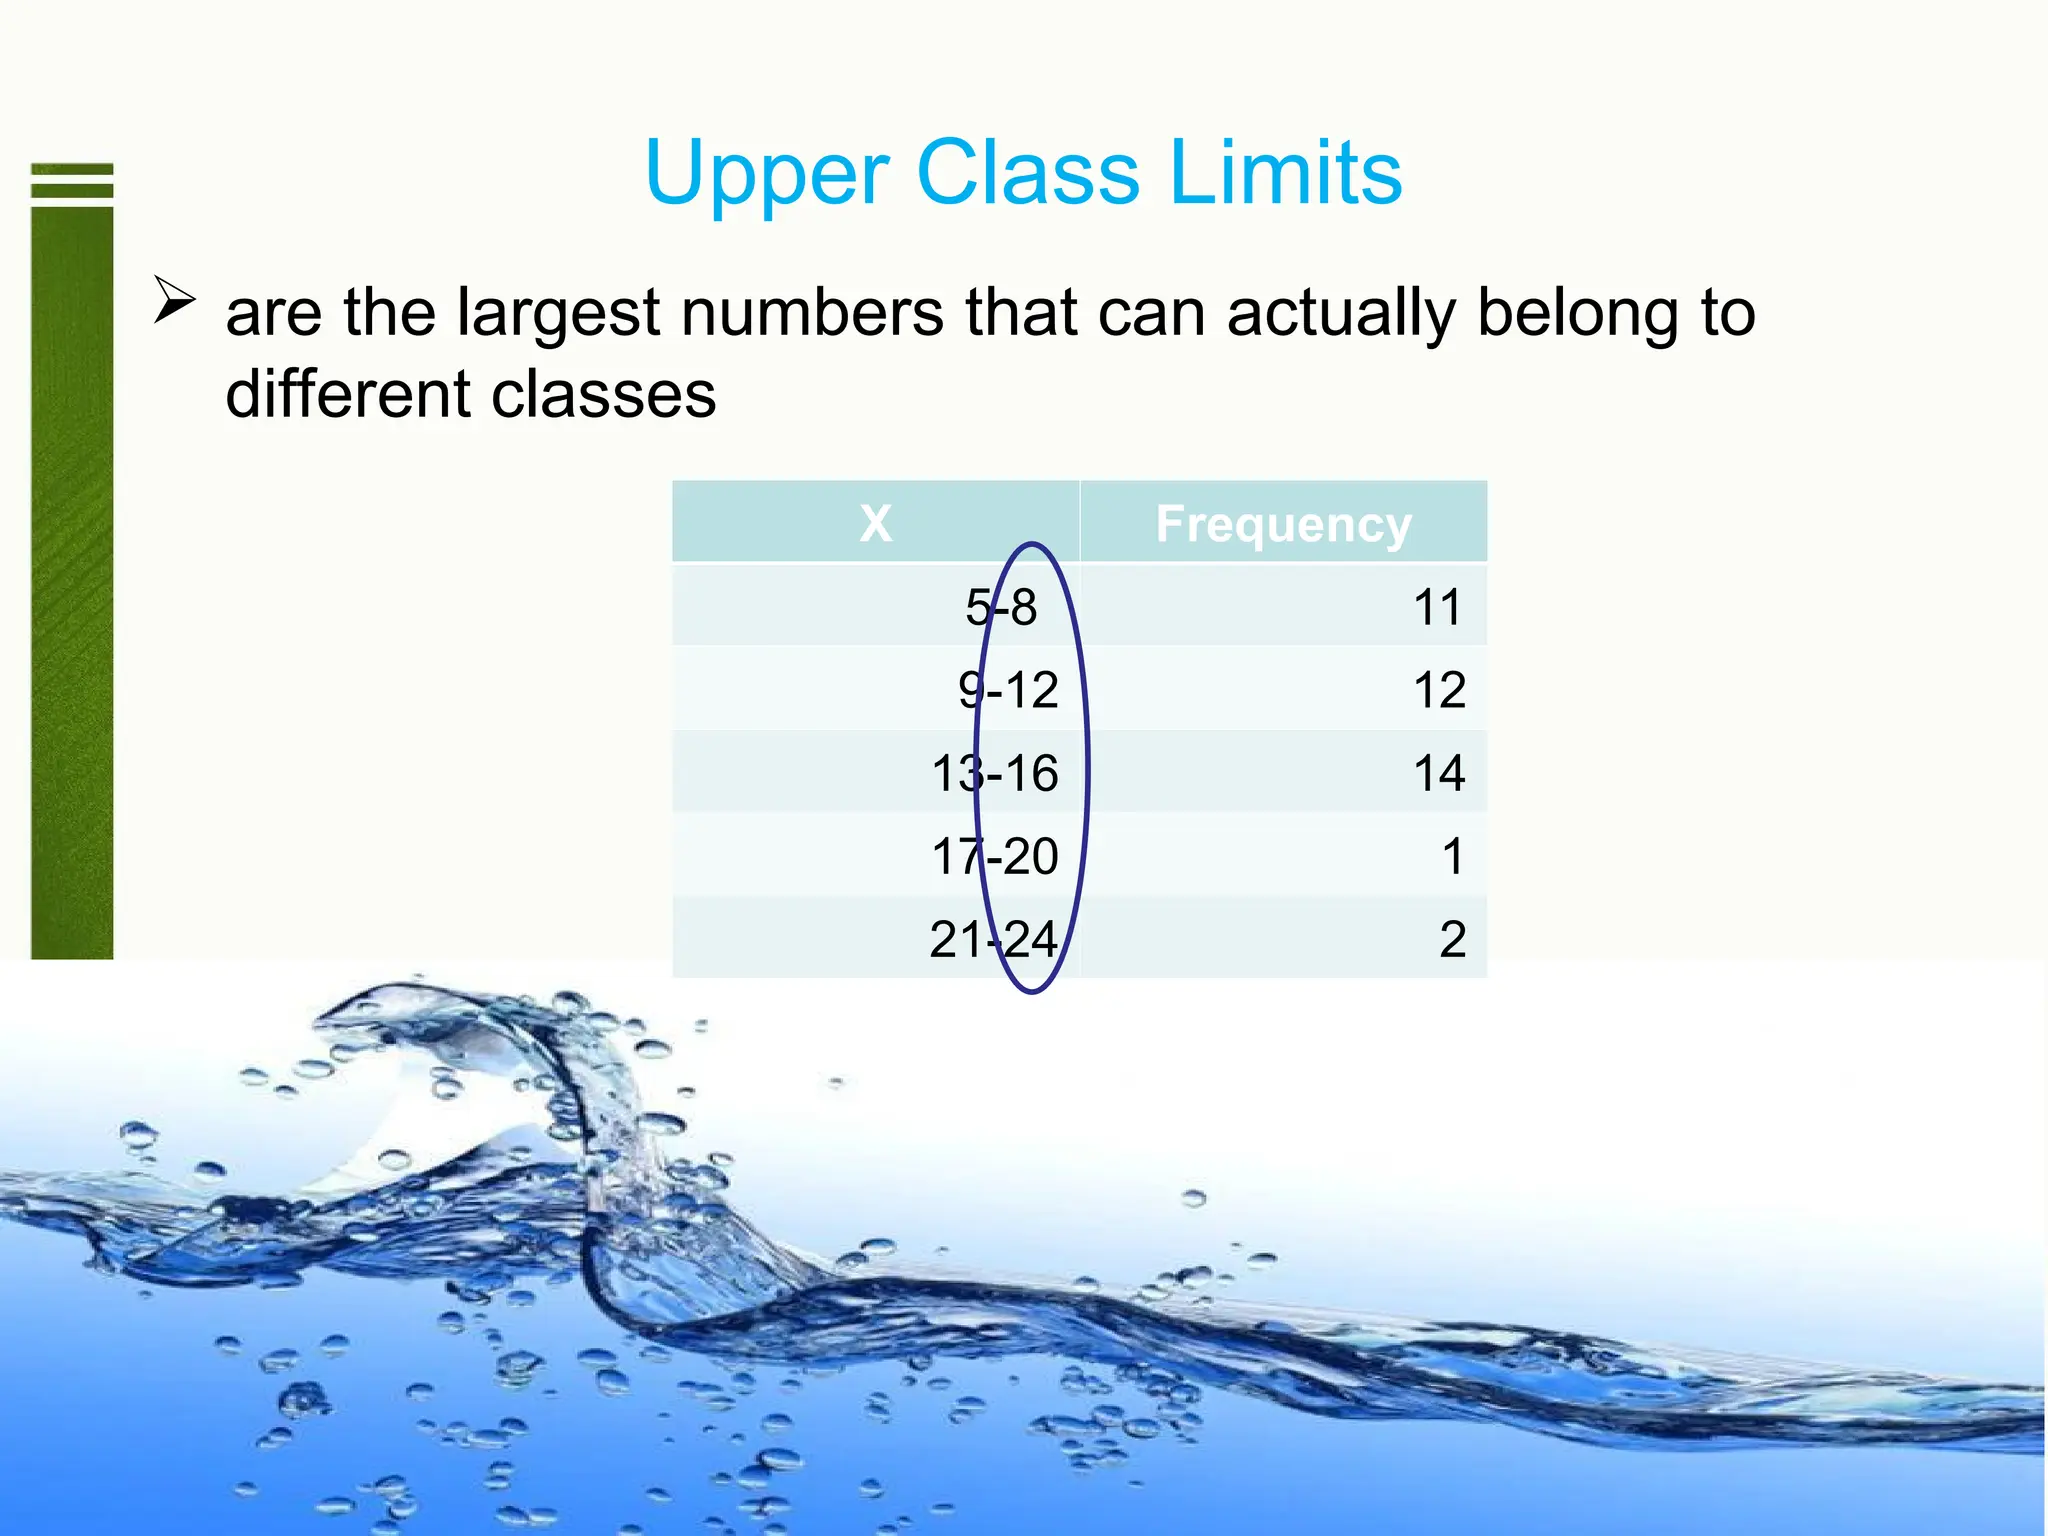
Upper Class Limits
are the largest numbers that can actually belong to
different classes
X Frequency
5-8 11
9-12 12
13-16 14
17-20 1
21-24 2
48.
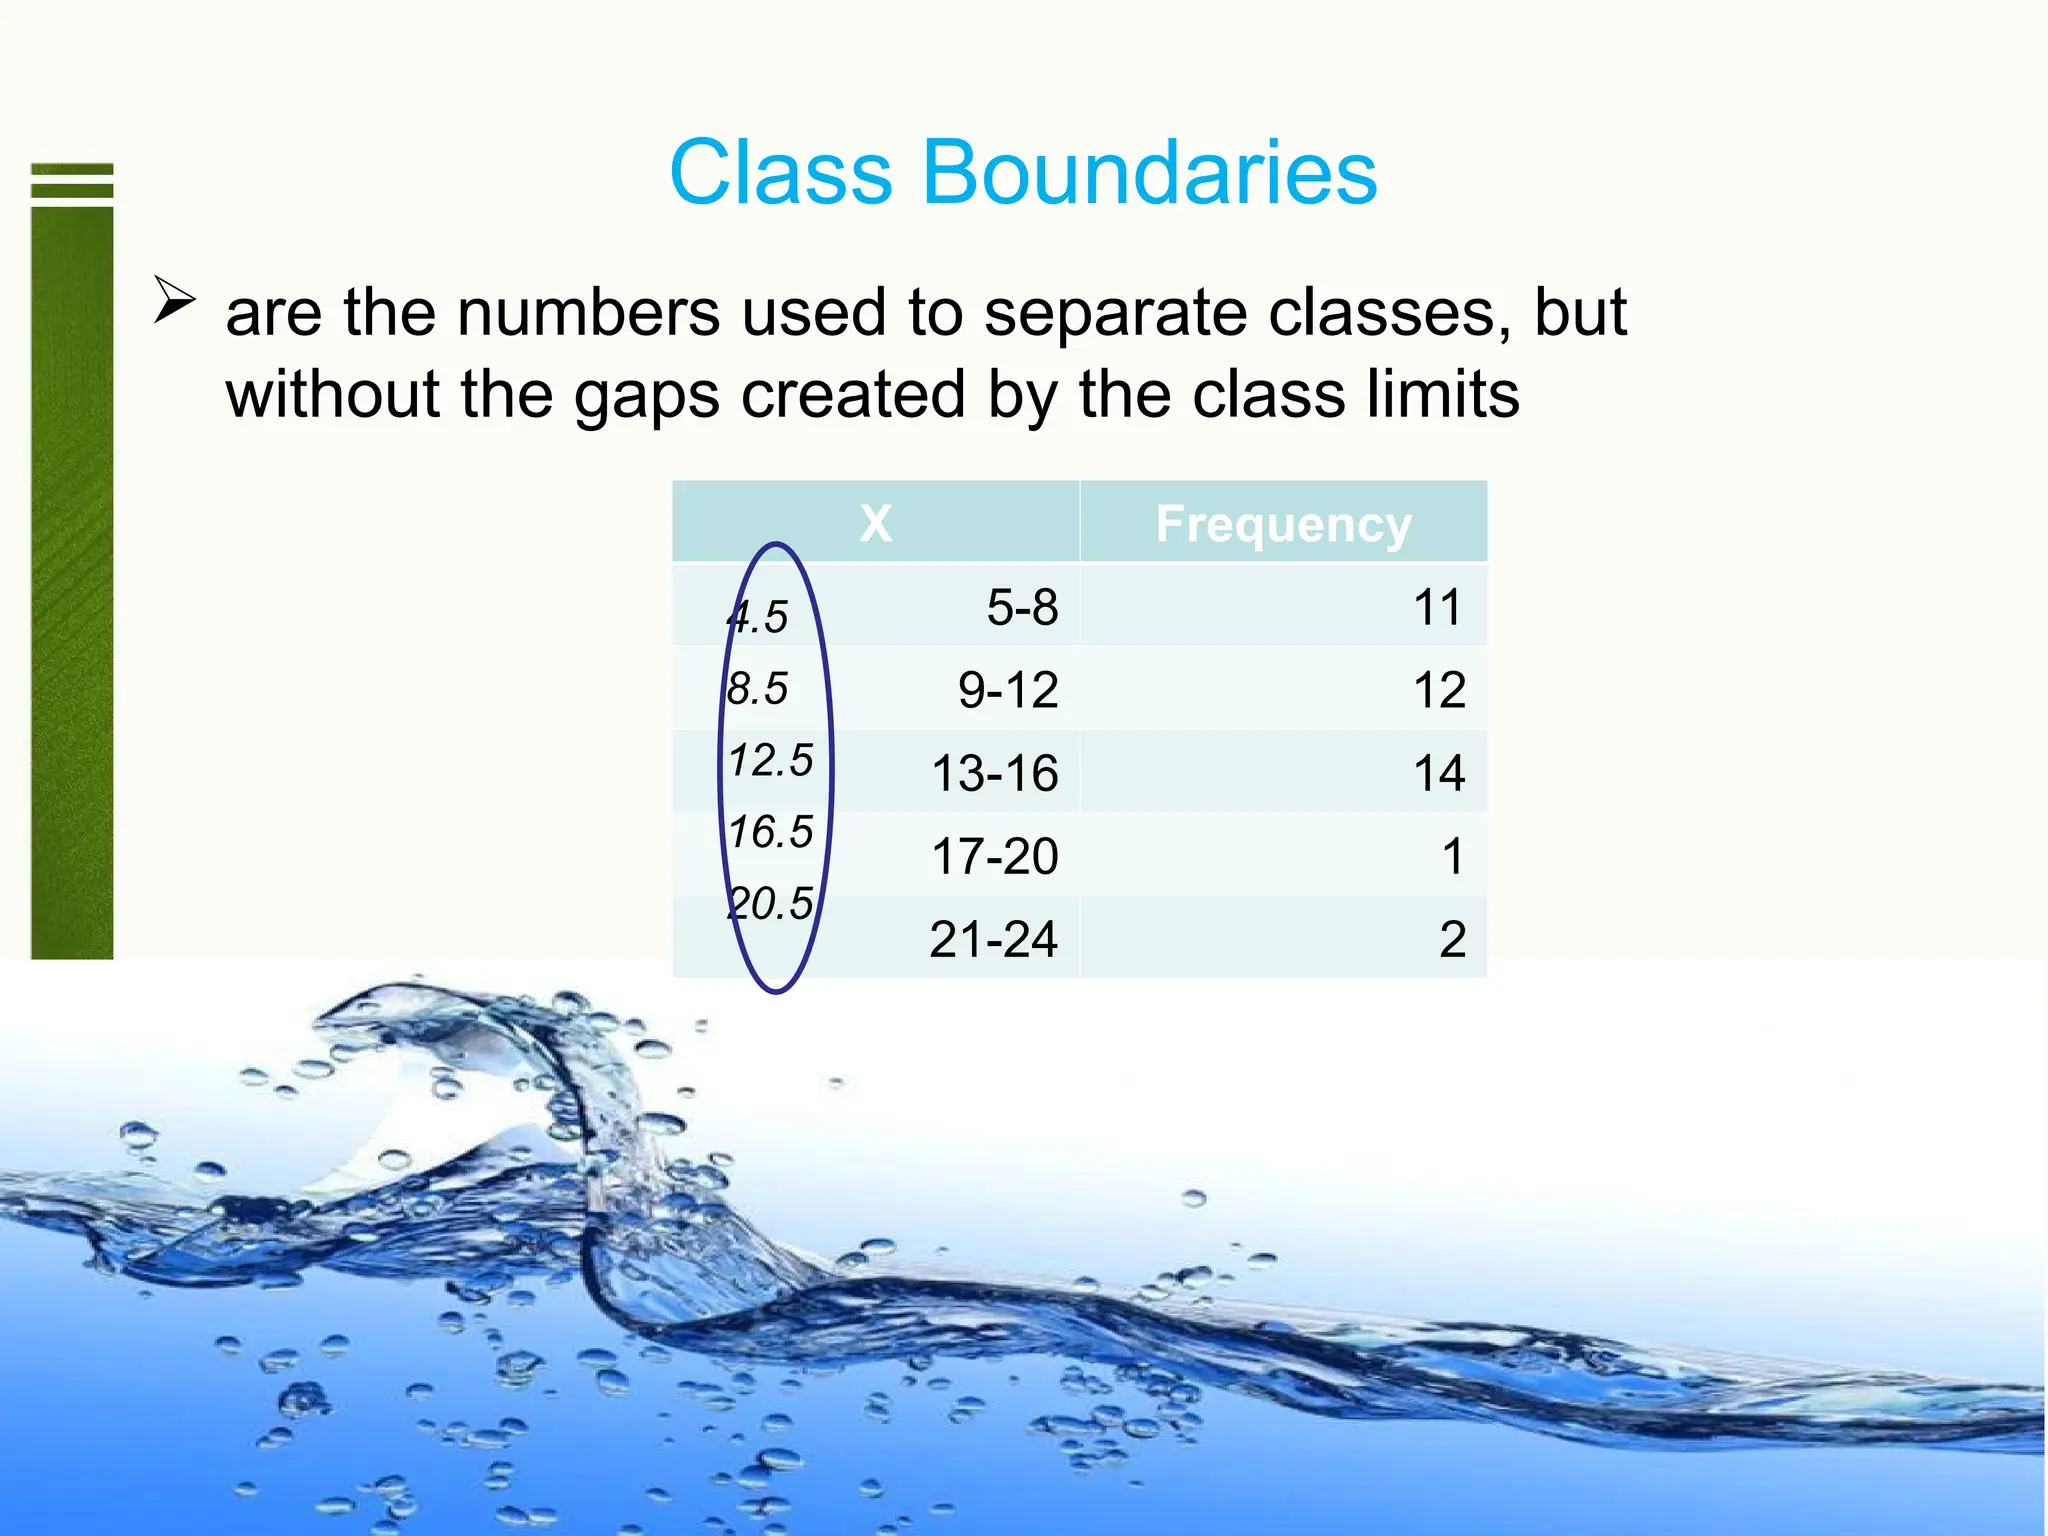
Class Boundaries
arethe numbers used to separate classes, but
without the gaps created by the class limits
X Frequency
5-8 11
9-12 12
13-16 14
17-20 1
21-24 2
4.5
8.5
12.5
16.5
20.5
49.
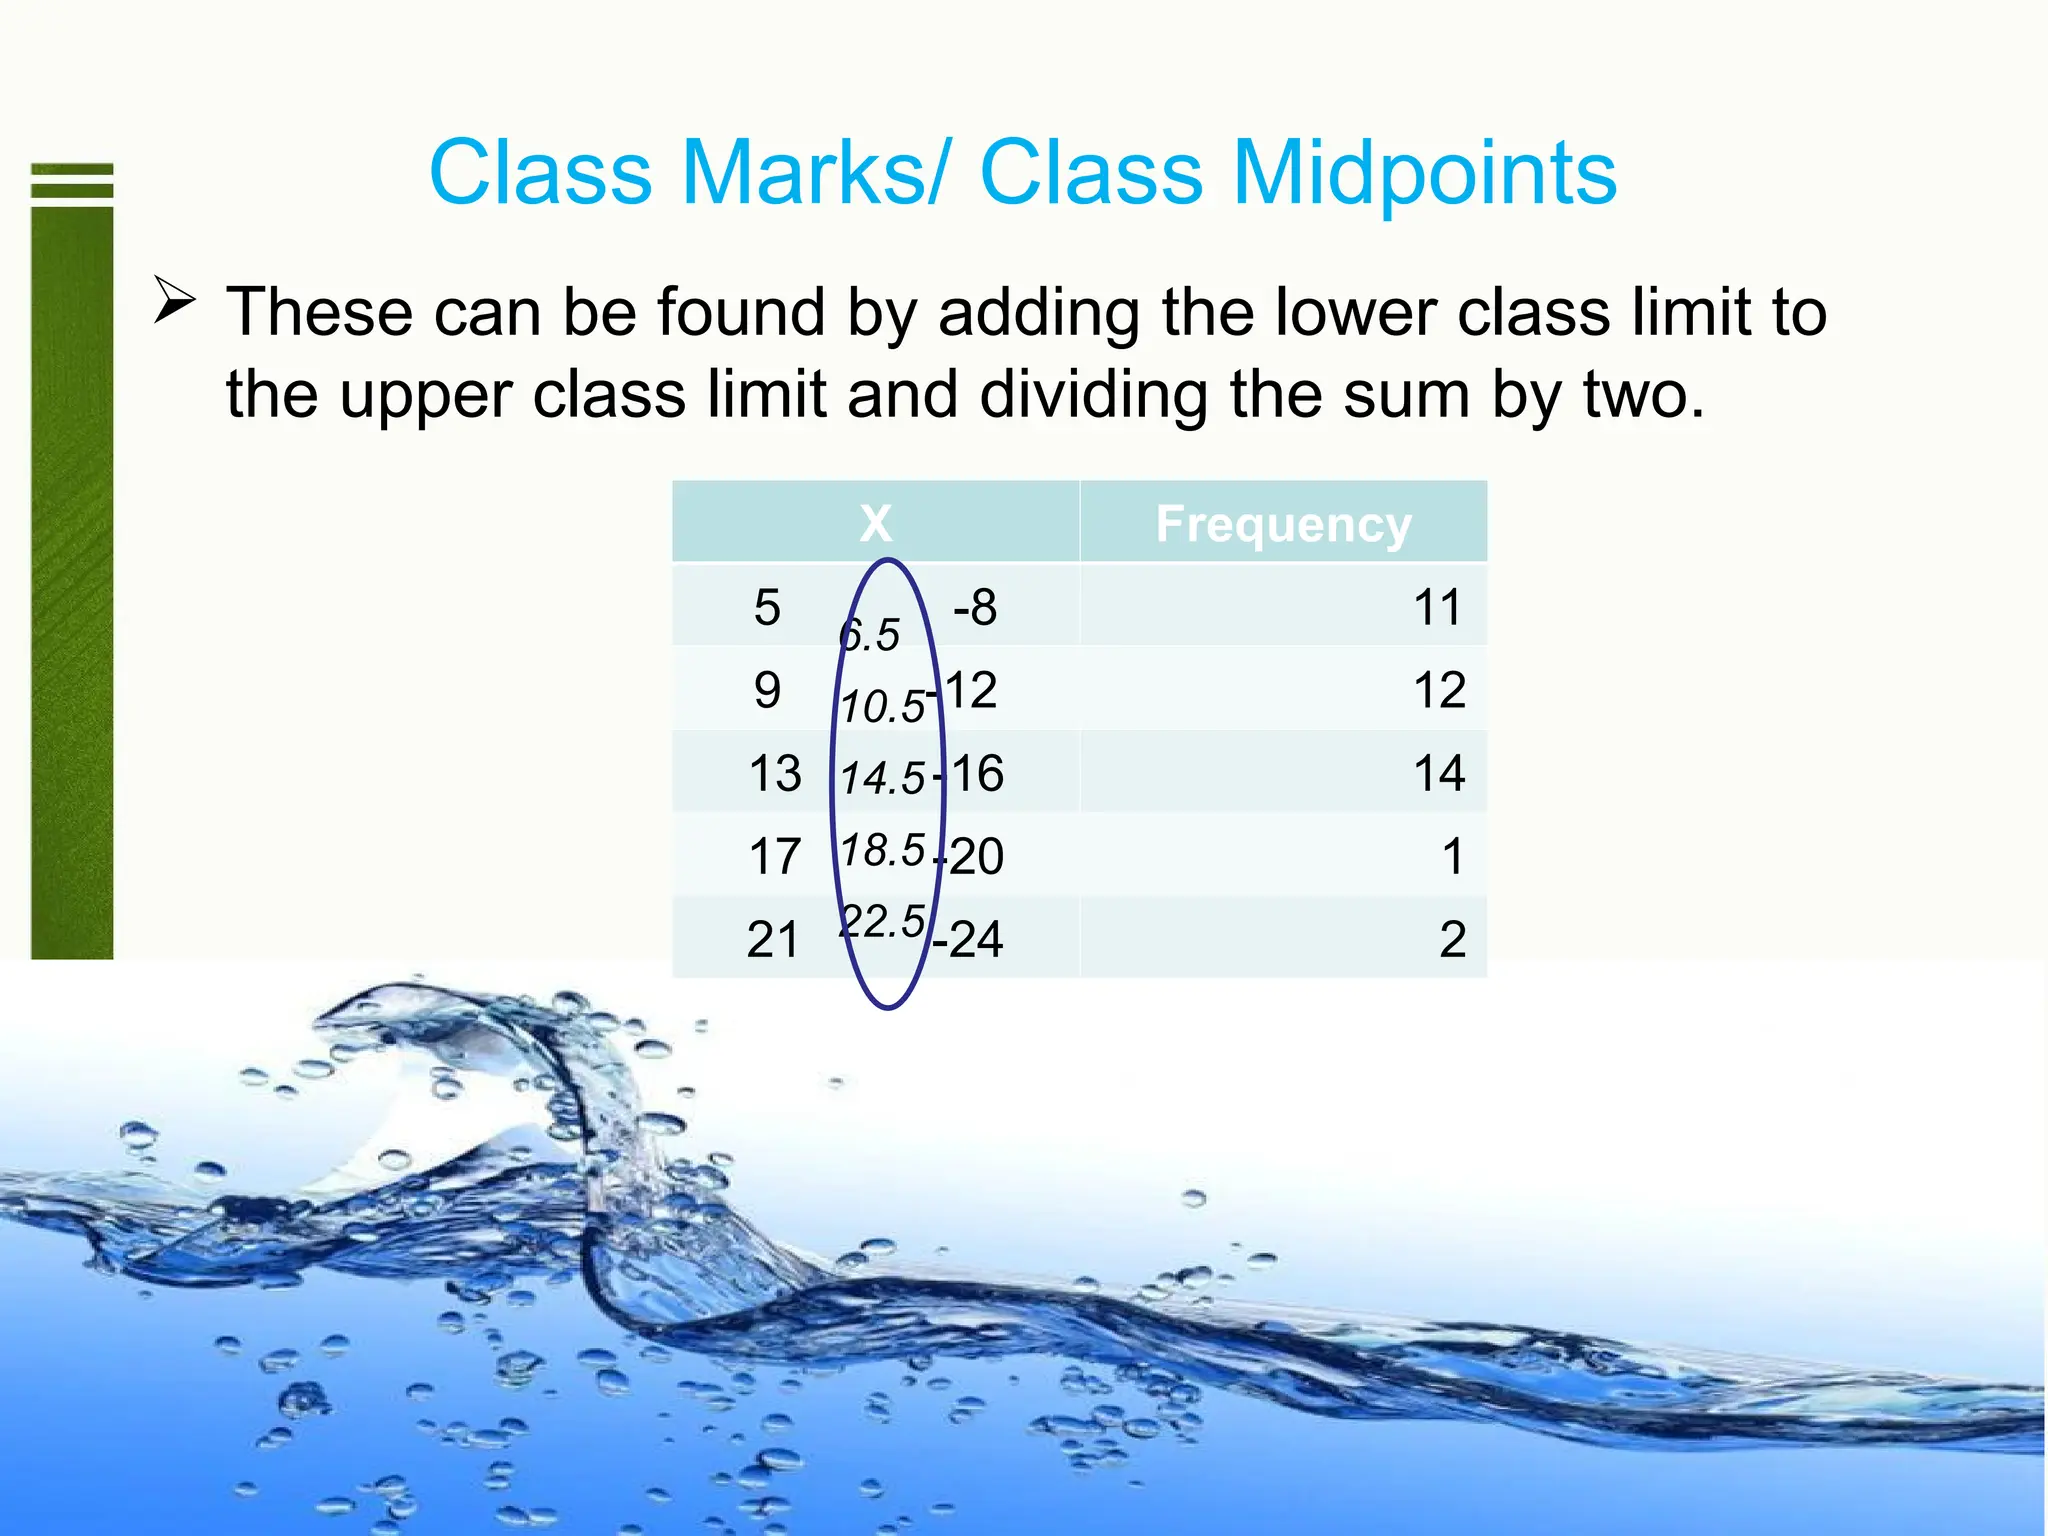
Class Marks/ ClassMidpoints
These can be found by adding the lower class limit to
the upper class limit and dividing the sum by two.
X Frequency
5 -8 11
9 -12 12
13 -16 14
17 -20 1
21 -24 2
6.5
10.5
14.5
18.5
22.5
50.
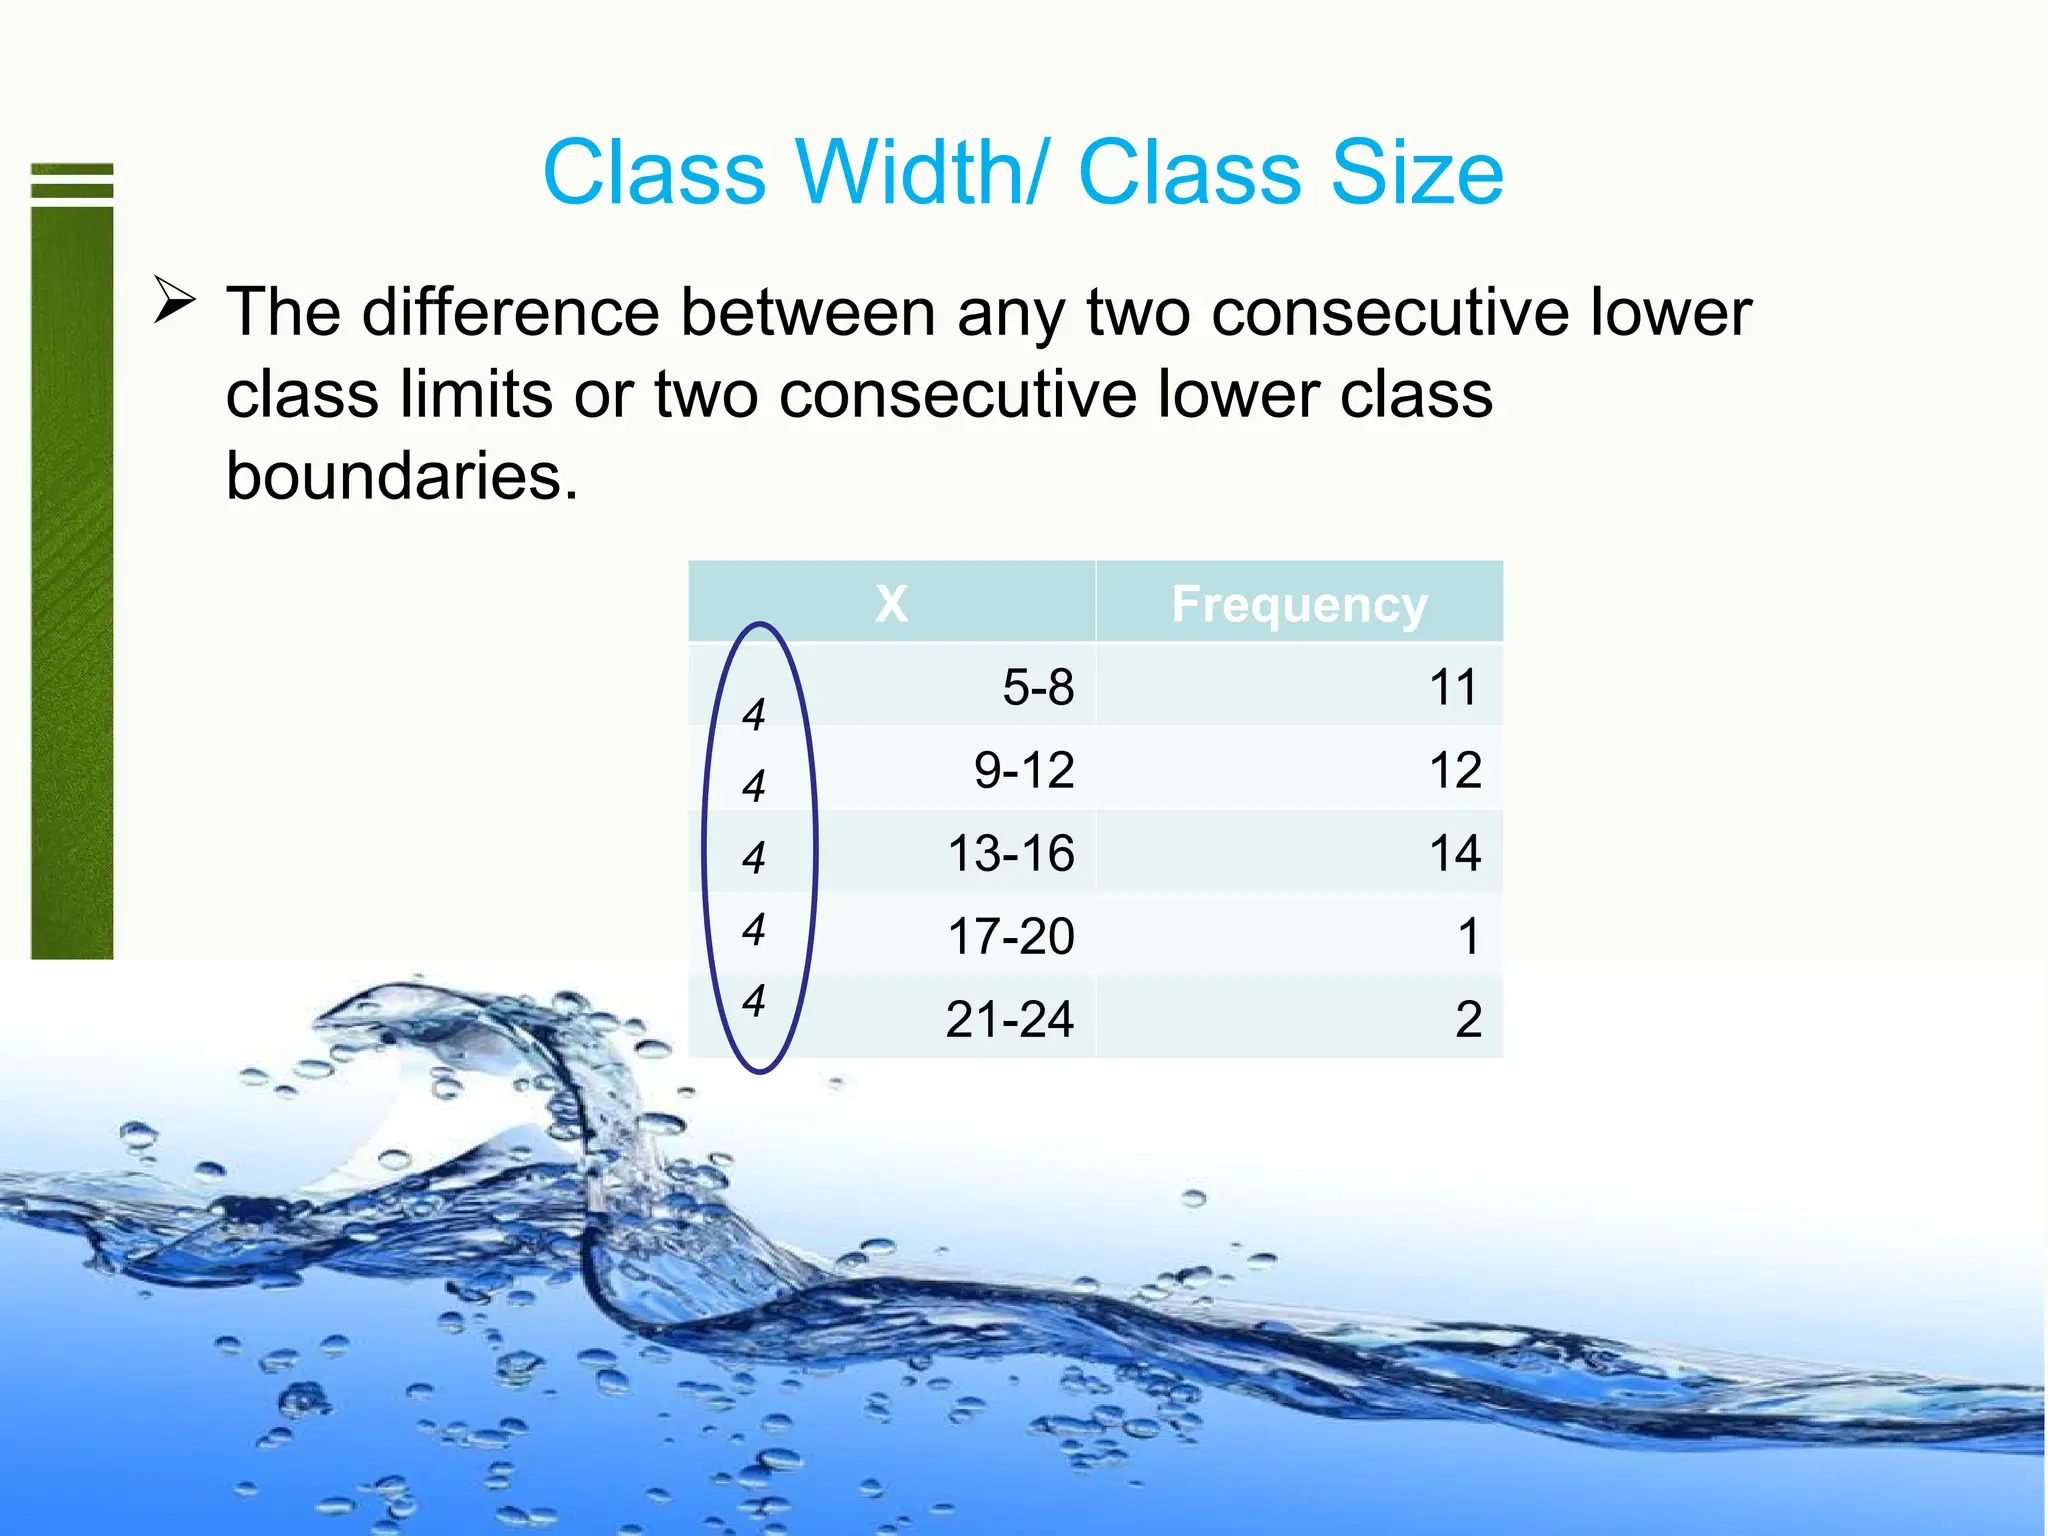
Class Width/ ClassSize
The difference between any two consecutive lower
class limits or two consecutive lower class
boundaries.
X Frequency
5-8 11
9-12 12
13-16 14
17-20 1
21-24 2
4
4
4
4
4
51.
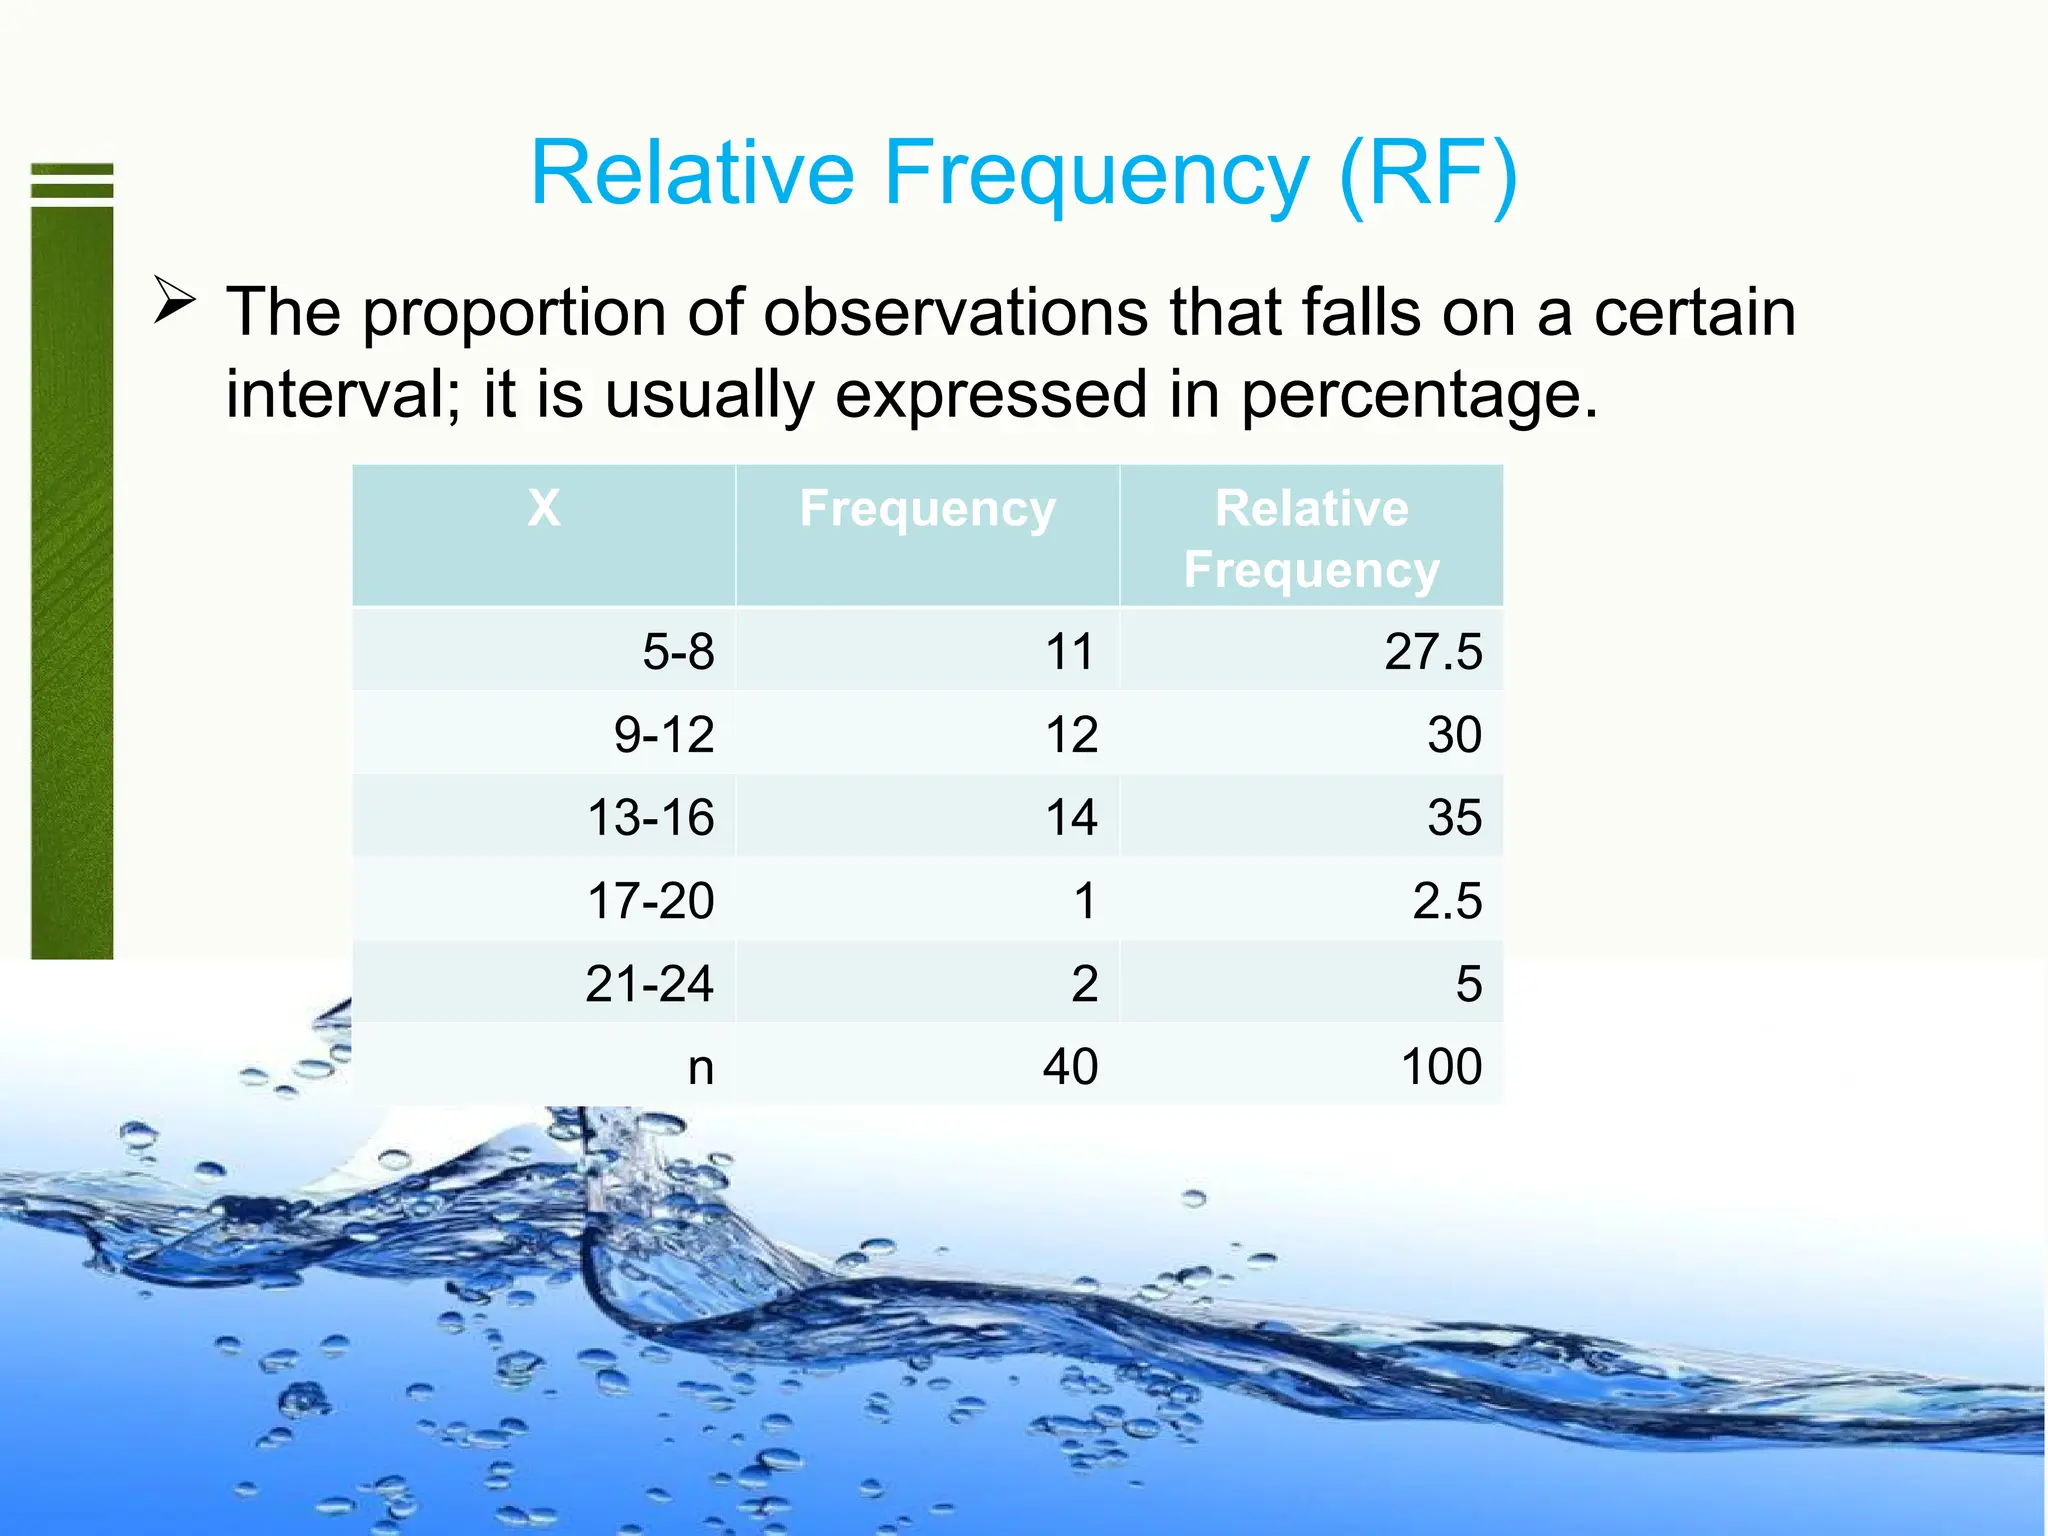
Relative Frequency (RF)
The proportion of observations that falls on a certain
interval; it is usually expressed in percentage.
X Frequency Relative
Frequency
5-8 11 27.5
9-12 12 30
13-16 14 35
17-20 1 2.5
21-24 2 5
n 40 100
52.
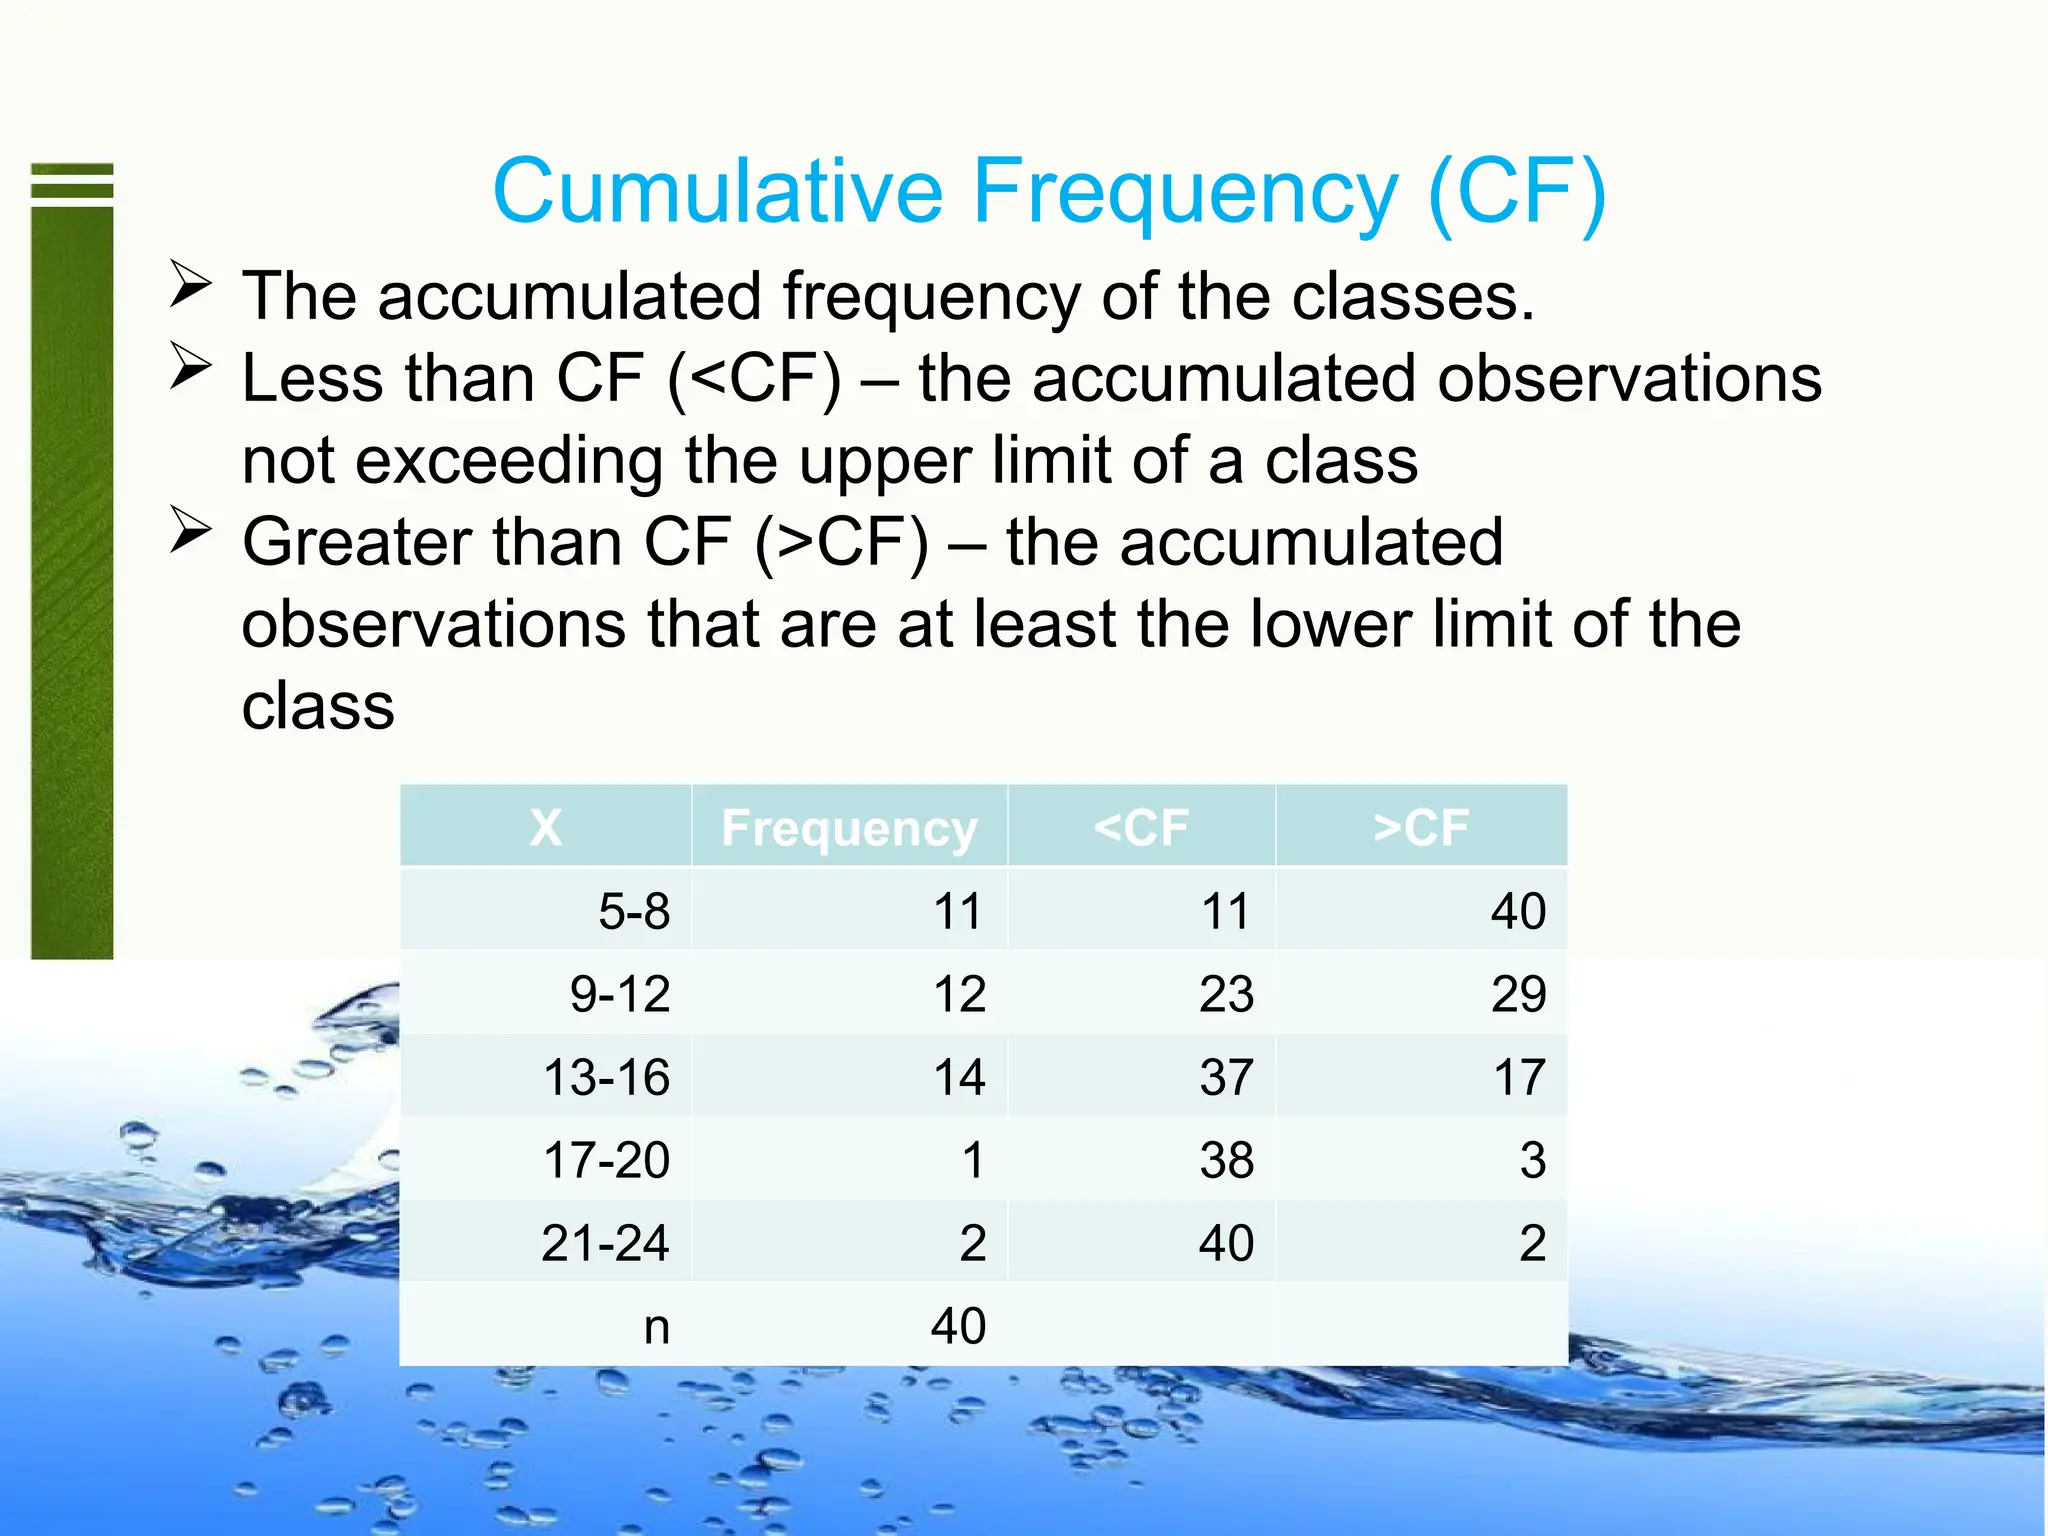
Cumulative Frequency (CF)
The accumulated frequency of the classes.
Less than CF (<CF) – the accumulated observations
not exceeding the upper limit of a class
Greater than CF (>CF) – the accumulated
observations that are at least the lower limit of the
class
X Frequency <CF >CF
5-8 11 11 40
9-12 12 23 29
13-16 14 37 17
17-20 1 38 3
21-24 2 40 2
n 40
53.
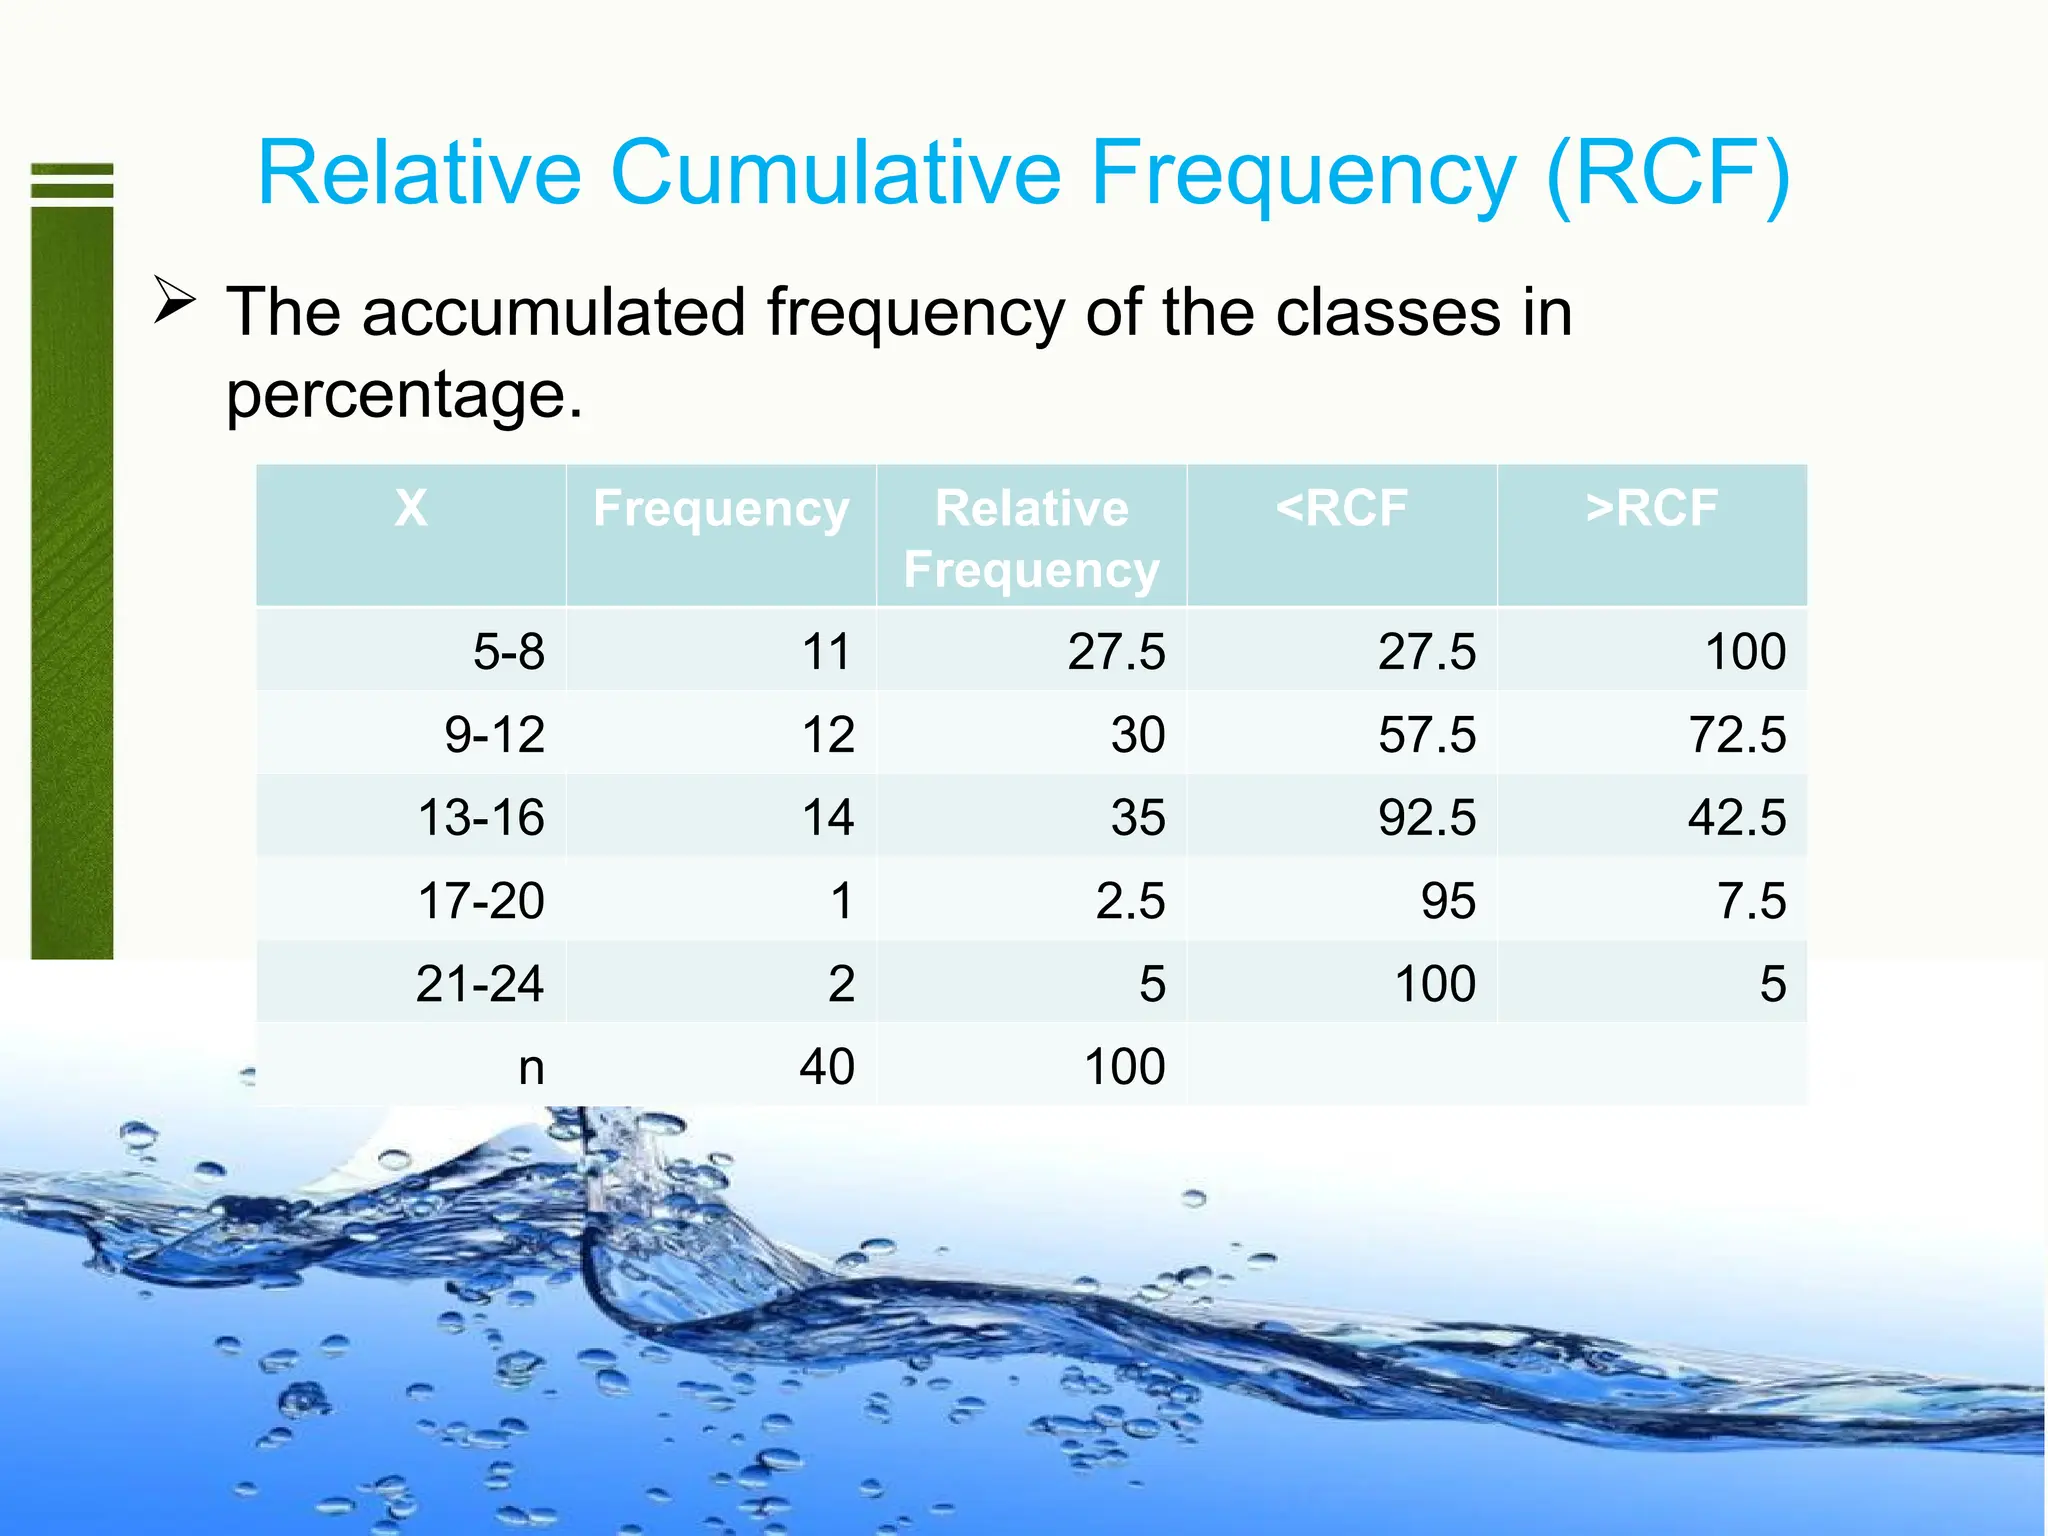
Relative Cumulative Frequency(RCF)
The accumulated frequency of the classes in
percentage.
X Frequency Relative
Frequency
<RCF >RCF
5-8 11 27.5 27.5 100
9-12 12 30 57.5 72.5
13-16 14 35 92.5 42.5
17-20 1 2.5 95 7.5
21-24 2 5 100 5
n 40 100
54.
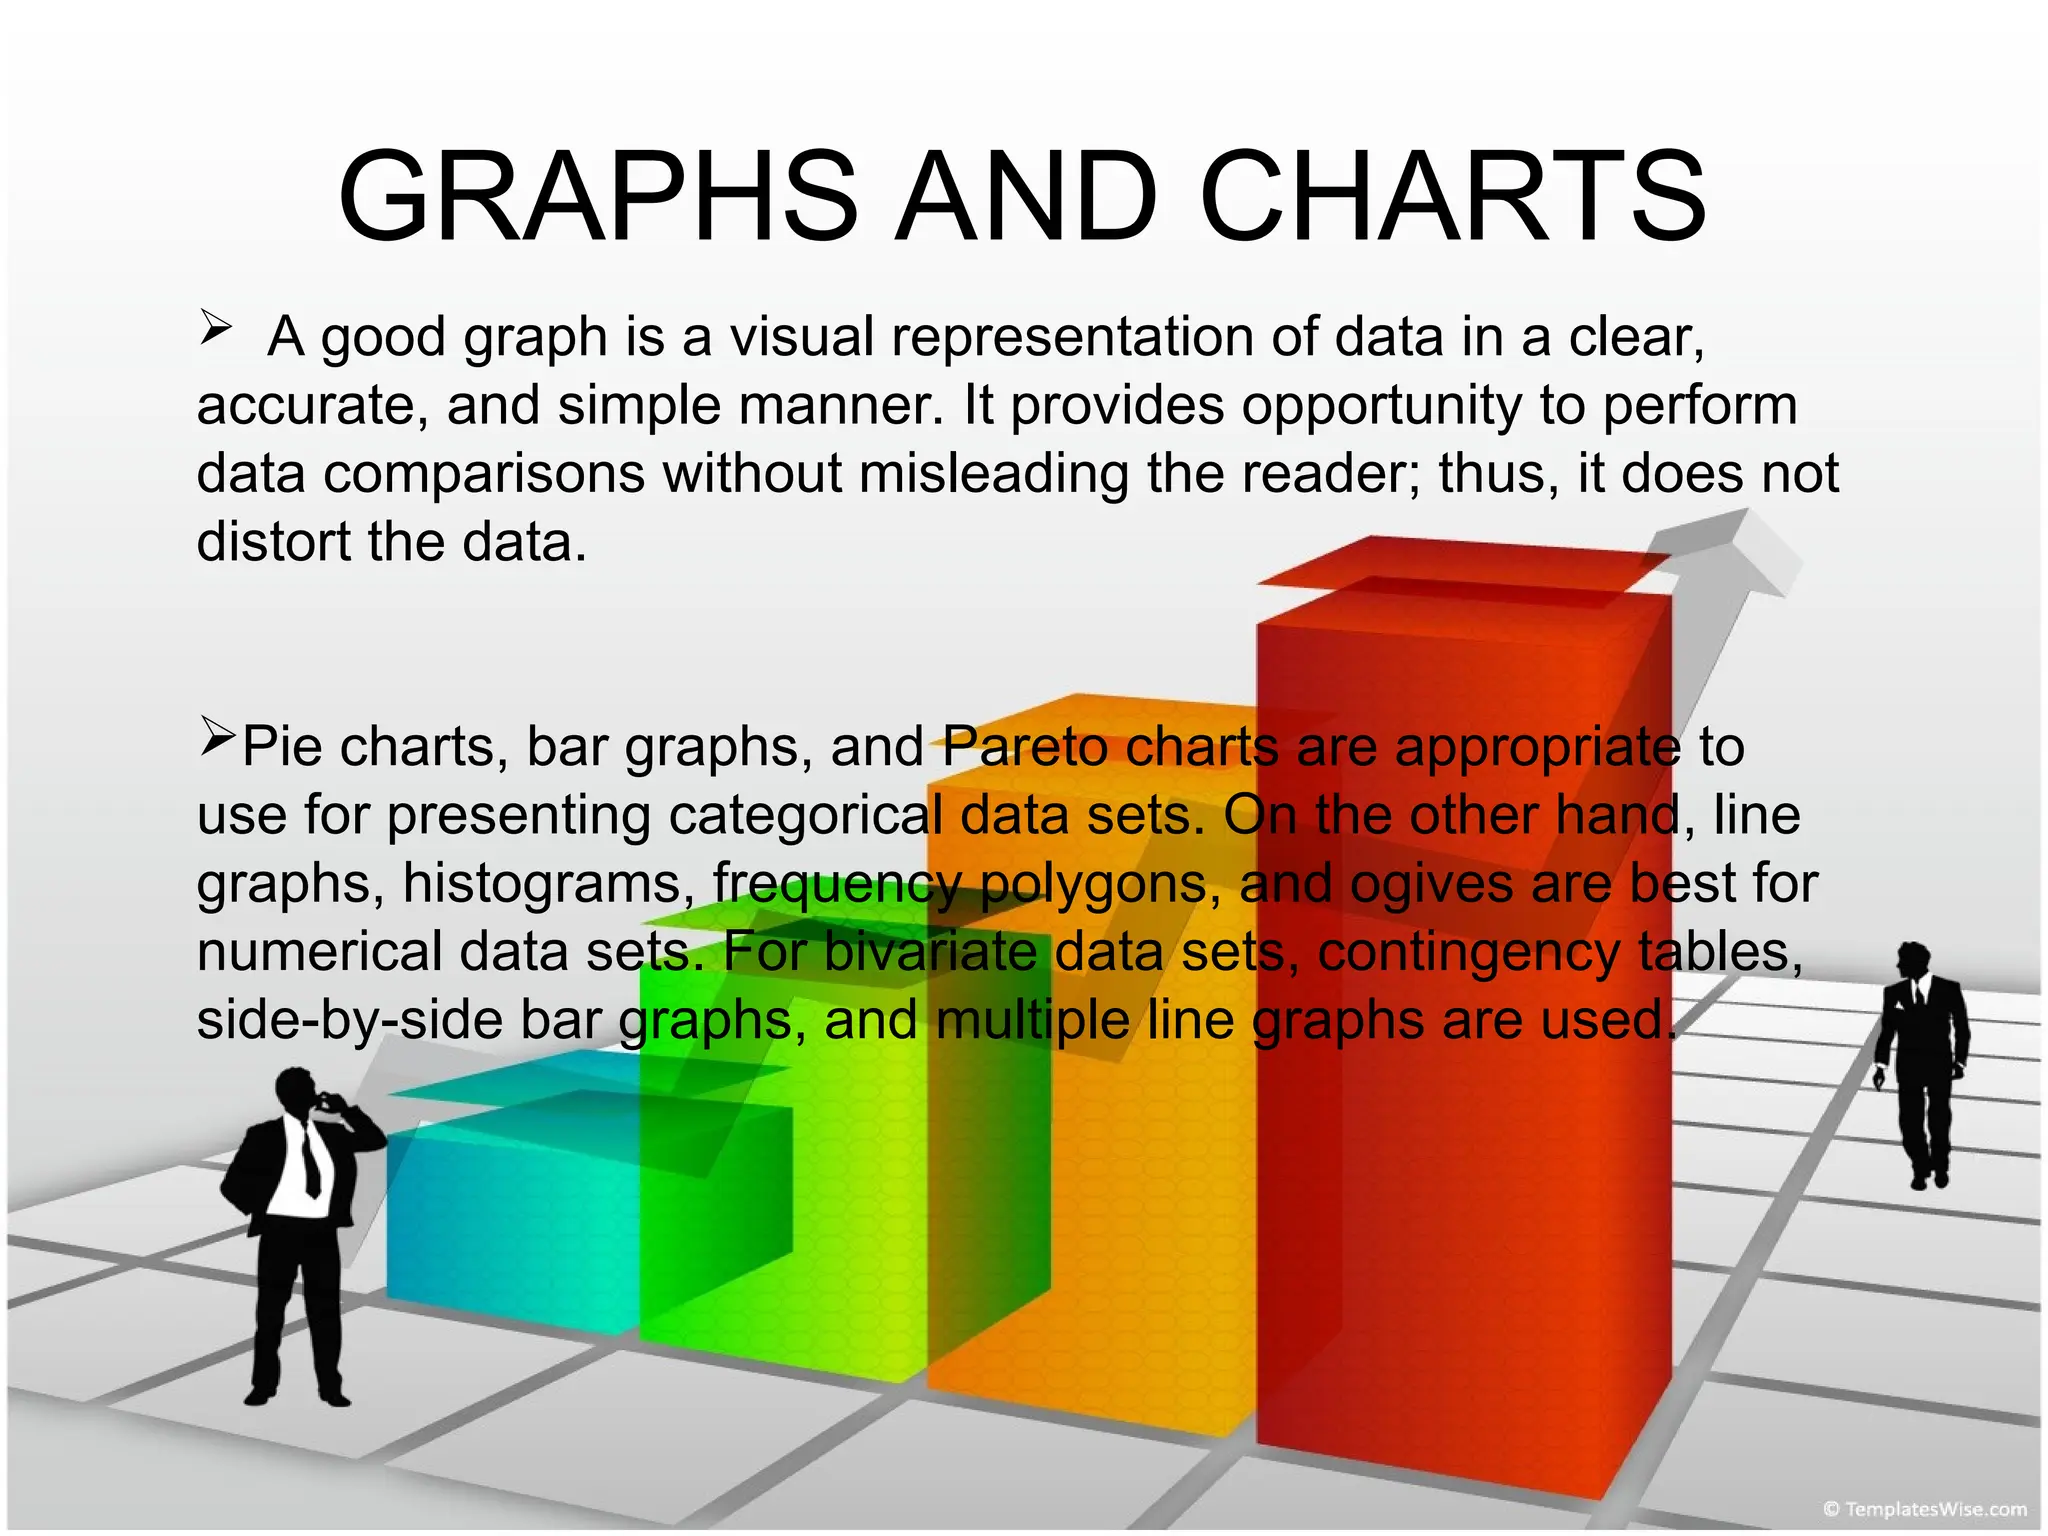
GRAPHS AND CHARTS
A good graph is a visual representation of data in a clear,
accurate, and simple manner. It provides opportunity to perform
data comparisons without misleading the reader; thus, it does not
distort the data.
Pie charts, bar graphs, and Pareto charts are appropriate to
use for presenting categorical data sets. On the other hand, line
graphs, histograms, frequency polygons, and ogives are best for
numerical data sets. For bivariate data sets, contingency tables,
side-by-side bar graphs, and multiple line graphs are used.
55.
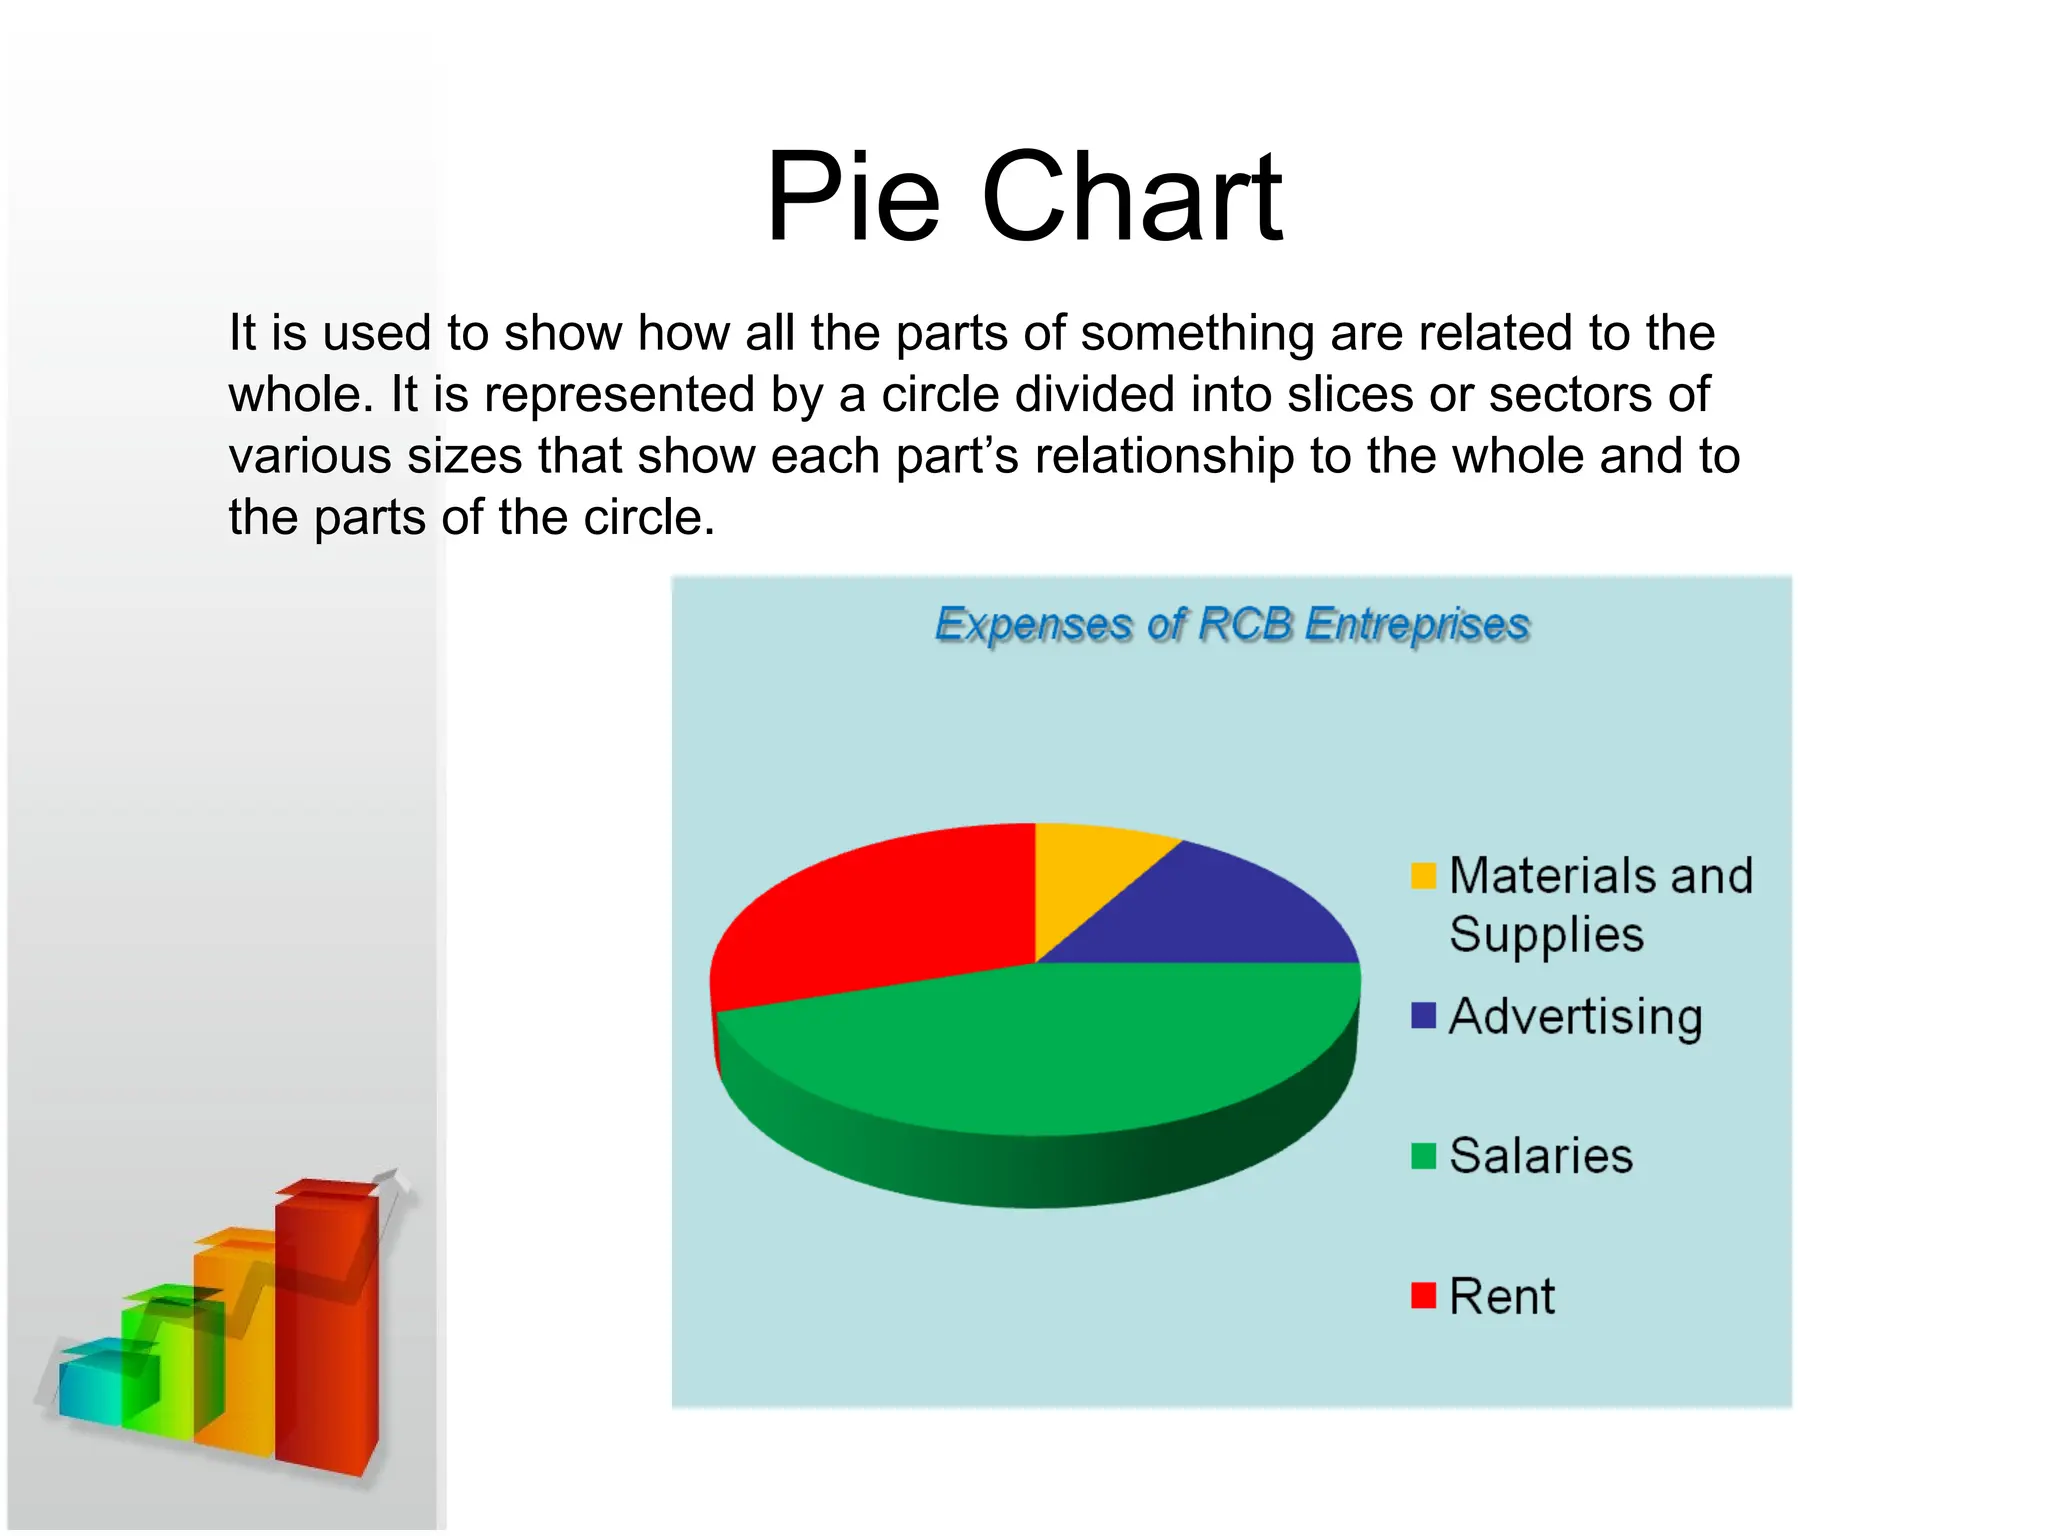
Pie Chart
It isused to show how all the parts of something are related to the
whole. It is represented by a circle divided into slices or sectors of
various sizes that show each part’s relationship to the whole and to
the parts of the circle.
56.
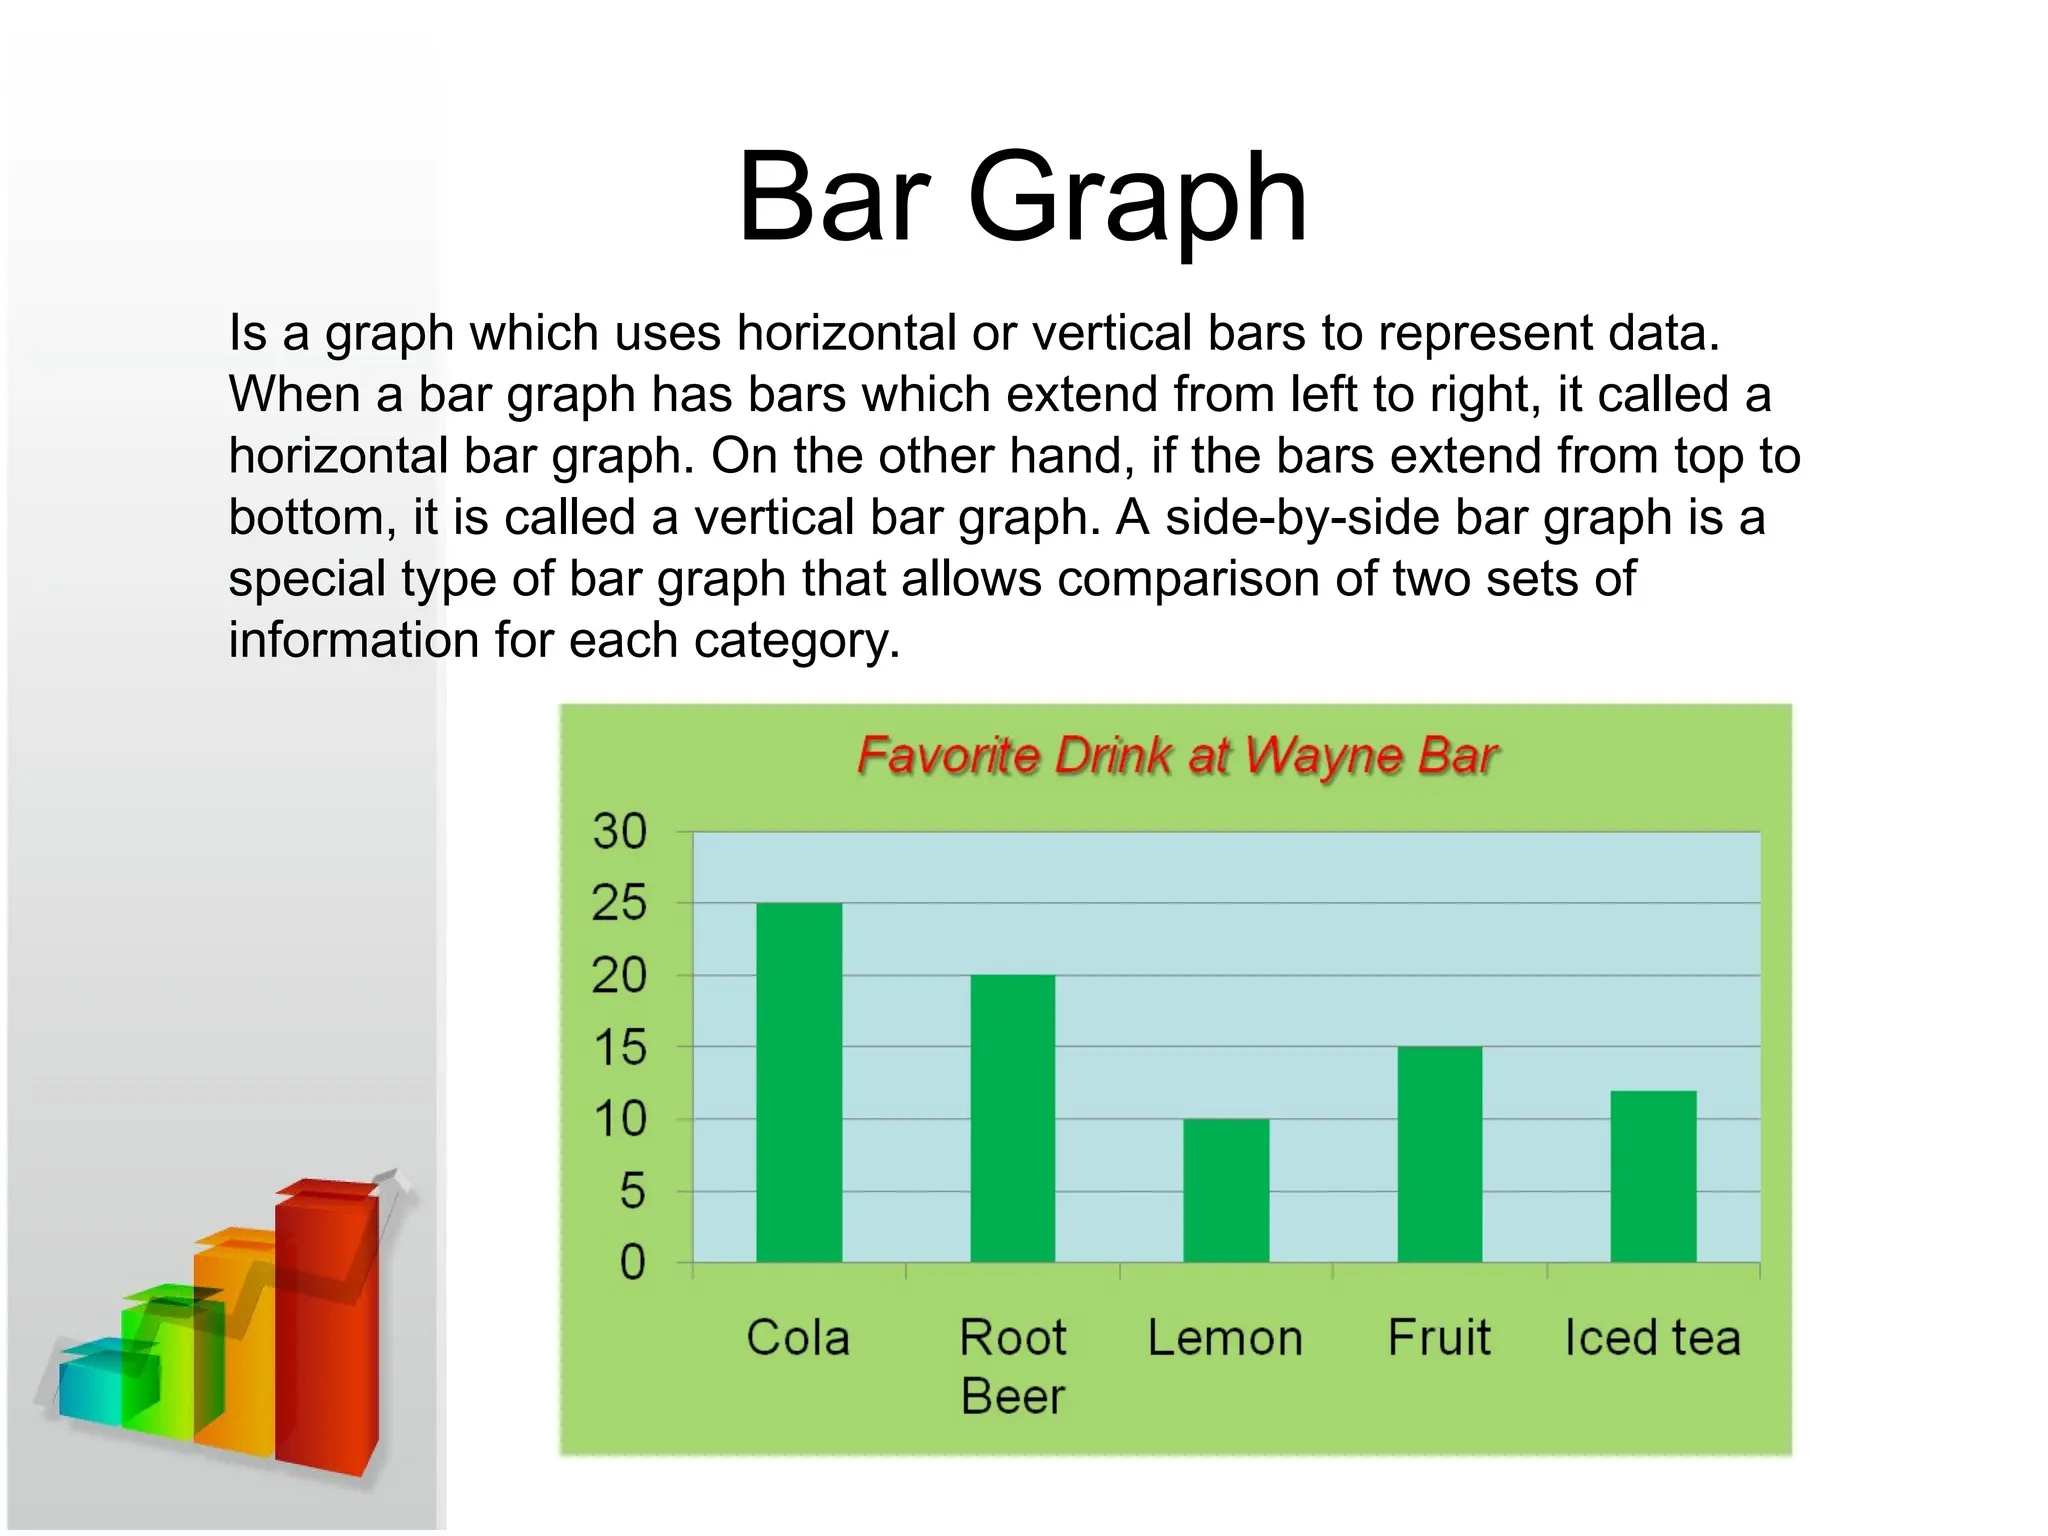
Bar Graph
Is agraph which uses horizontal or vertical bars to represent data.
When a bar graph has bars which extend from left to right, it called a
horizontal bar graph. On the other hand, if the bars extend from top to
bottom, it is called a vertical bar graph. A side-by-side bar graph is a
special type of bar graph that allows comparison of two sets of
information for each category.
57.
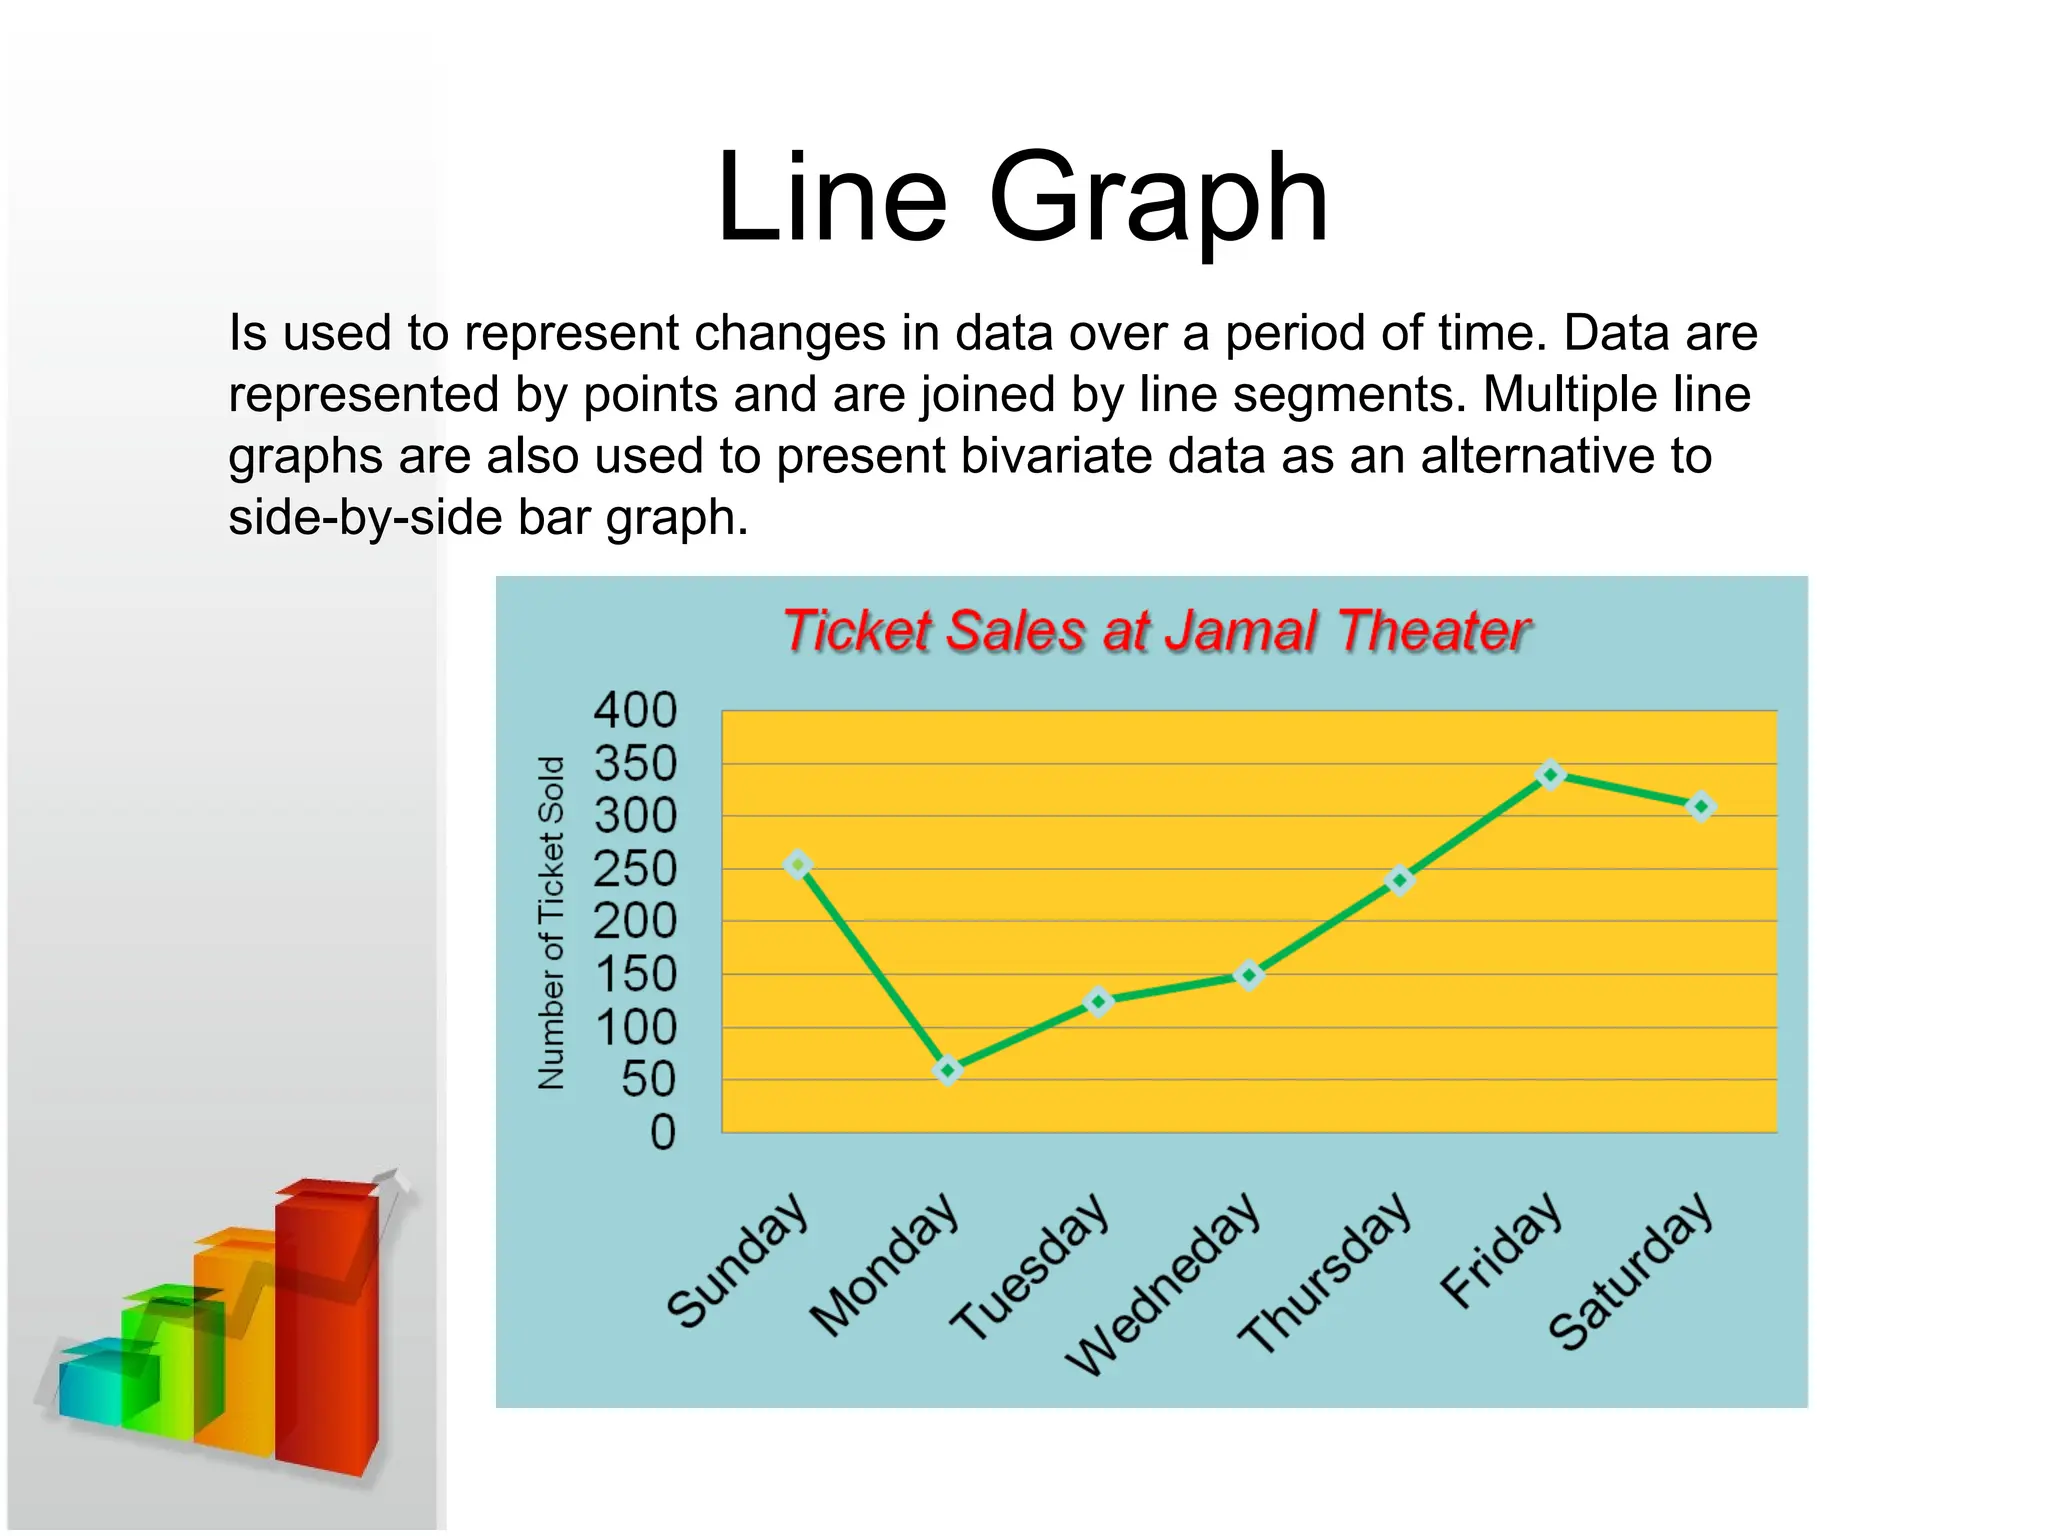
Line Graph
Is usedto represent changes in data over a period of time. Data are
represented by points and are joined by line segments. Multiple line
graphs are also used to present bivariate data as an alternative to
side-by-side bar graph.
58.
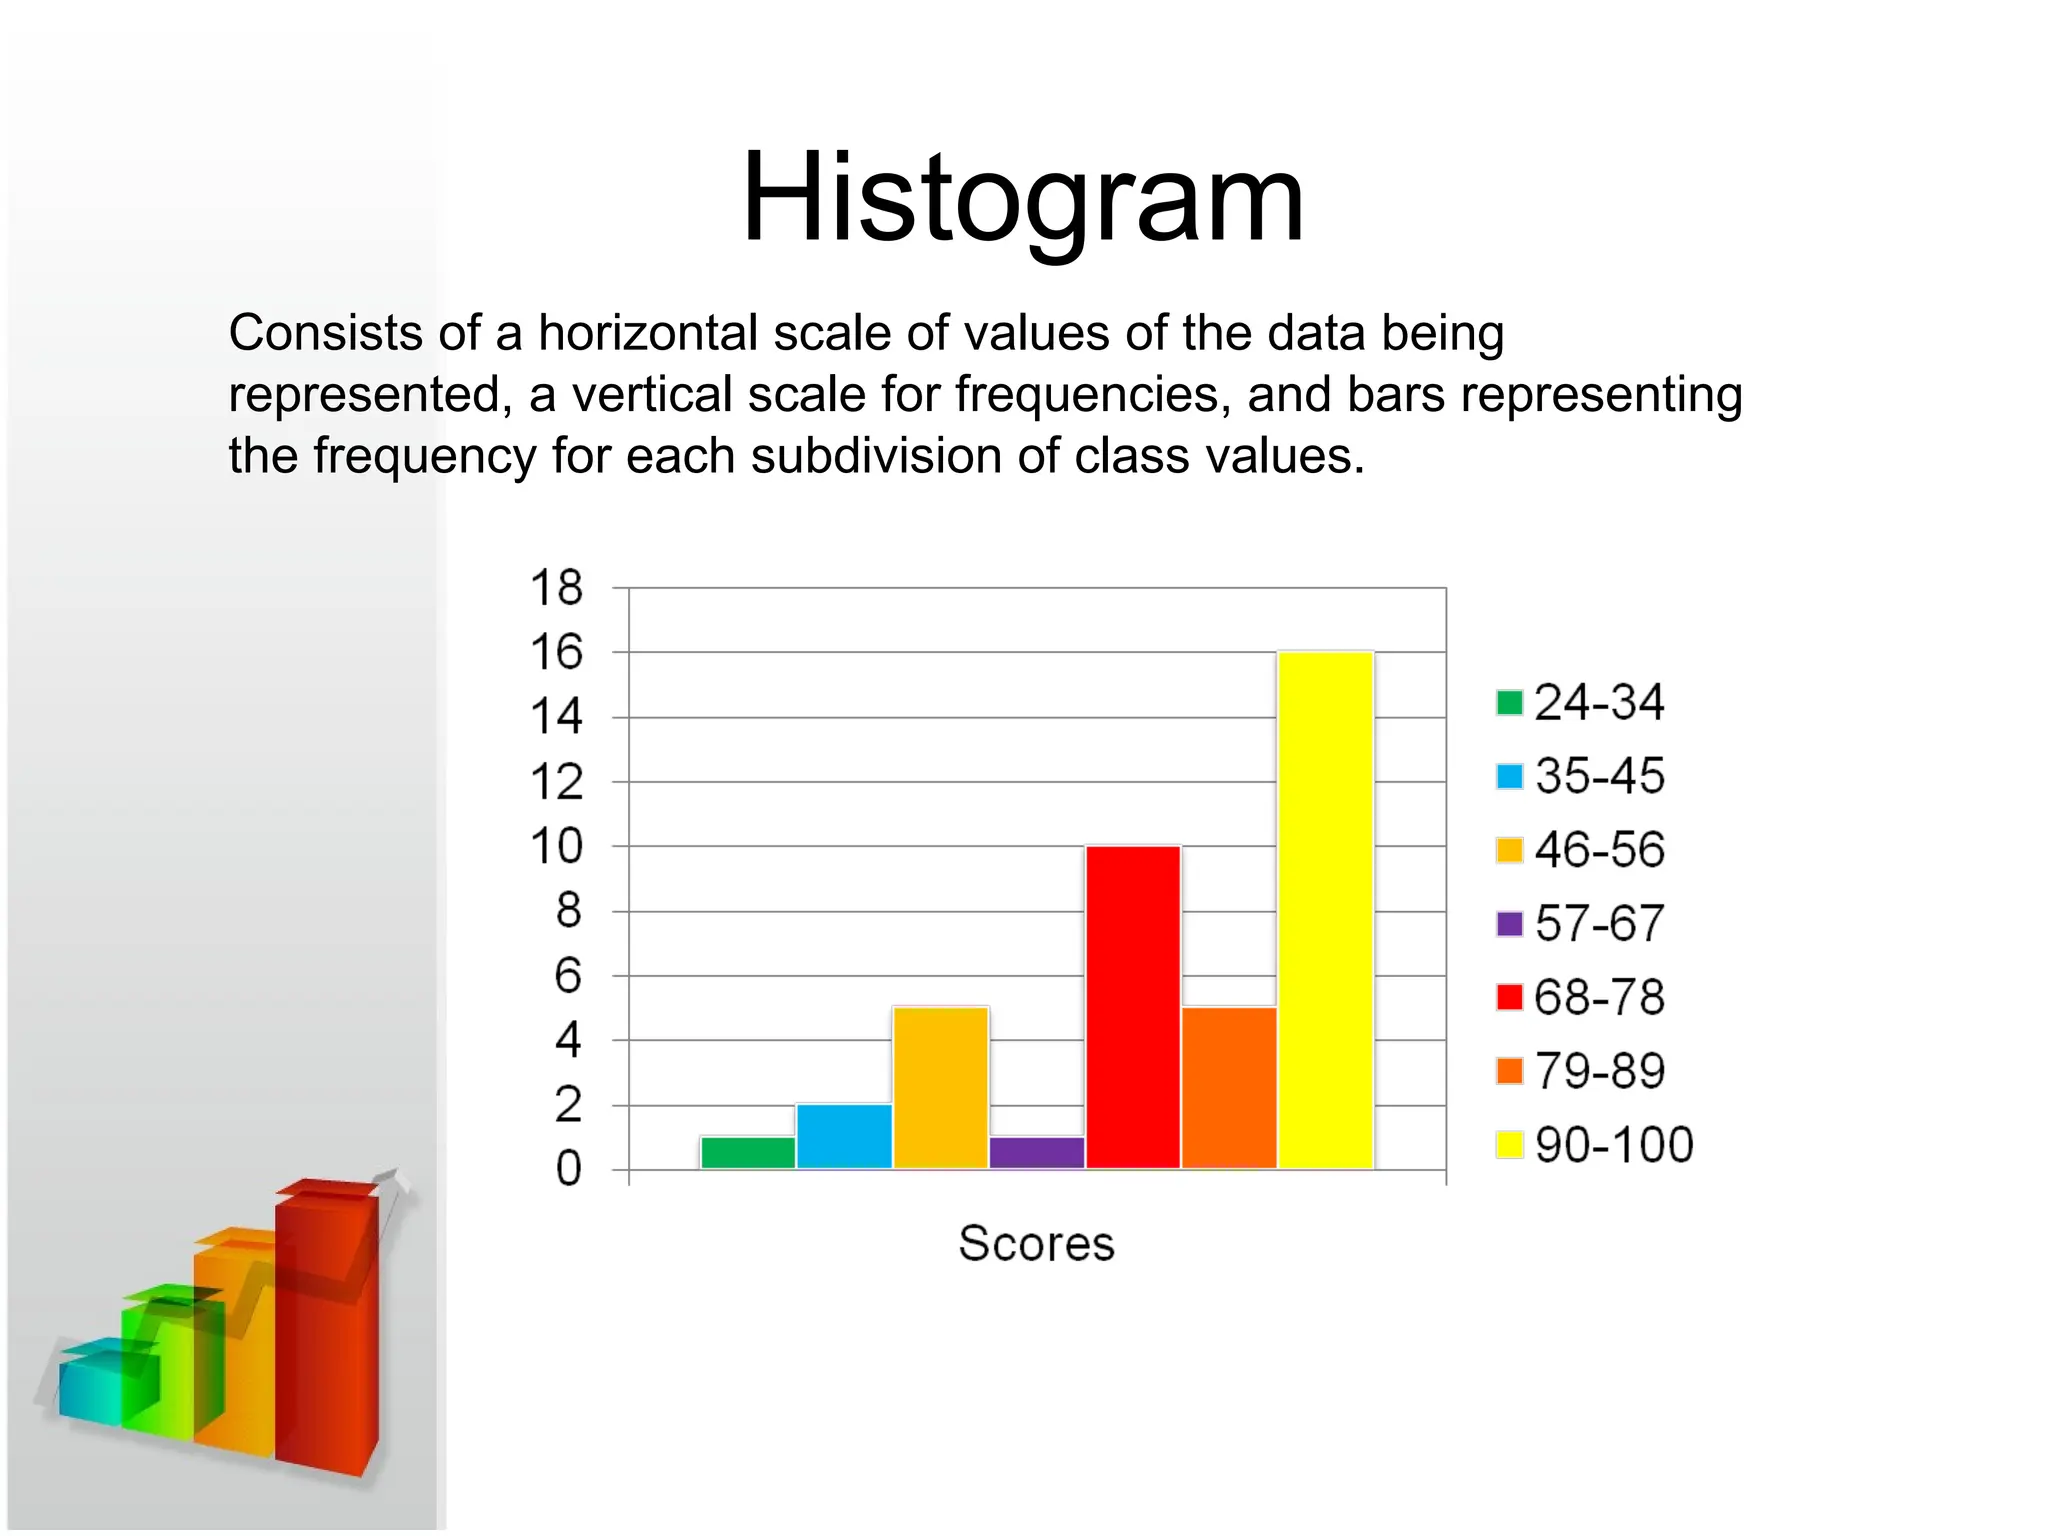
Histogram
Consists of ahorizontal scale of values of the data being
represented, a vertical scale for frequencies, and bars representing
the frequency for each subdivision of class values.
59.
Pareto Chart
Is abar graph for categorical data with bars arranged in descending
order of frequencies.
60.
Ogive
Is a graphin which a point is plotted above each class boundary at a
height equal to the cumulative frequency corresponding to that
boundary.
61.
Frequency Polygon
Is aline graph constructed by plotting the class marks at a height
equal to the frequency corresponding to that class mark. The points
are connected to form the polygon.
62.
Contingency Table
Or across-classification table is used to simultaneously present data
of at least two variables (usually categorical).
TESTS of Hypothesis
Hypothesis
Hypothesis
Astatement or tentative theory which aims
to explain facts about the real world.
An educated guess
It is subject for testing. If it is found to be
statistically true, it is accepted. Otherwise,
it gets rejected.
68.
Kinds of Hypotheses
1.NullHypothesis (Ho)
1.Null Hypothesis (Ho)
It serves as the working hypothesis.
It is that which one hopes to accept or reject.
It must always express the idea of no significant
difference.
2. Alternative Hypothesis (Ha)
2. Alternative Hypothesis (Ha)
It generally represents the hypothetical statement that
the researcher wants to prove.
69.
Types of AlternativeHypotheses (Ha)
1. Directional Hypothesis
1. Directional Hypothesis
Expresses direction
One-tailed
Uses order relation of “greater than” or “less than”
2. Non-directional Hypothesis
2. Non-directional Hypothesis
Does not express direction
Two-tailed
Uses the “not equal to”
70.
Type I andType II Errors
A Type I error
Type I error is the mistake of rejecting the null
hypothesis when it is true.
The symbol α
α (alpha) is used to represent the probability
of a type I error.
A Type II error
Type II error is the mistake of failing to reject the null
hypothesis when it is false.
The symbol β
β (beta) is used to represent the probability
of a type II error.
71.
Level of Significance
The probability of making Type I error or alpha error in a
test is called the significance level
significance level of the test. The
significance level of a test is the maximum value of the
probability of rejecting the null hypothesis (Ho) when in
fact it is true.
72.
Critical Value
Acritical value
critical value is any value that separates the critical
region (where we reject the null hypothesis) from the
values of the test statistic that do not lead to rejection of
the null hypothesis, the sampling distribution that
applies, and the significance level α.
73.
P-Value
The P-value
P-value(probability value) is the probability of
getting a value of the test statistic that is at least as
extreme as the one representing the sample data,
assuming that the null hypothesis is true. The null
hypothesis is rejected if the P-value is very small, such
as 0.05 or less.
74.
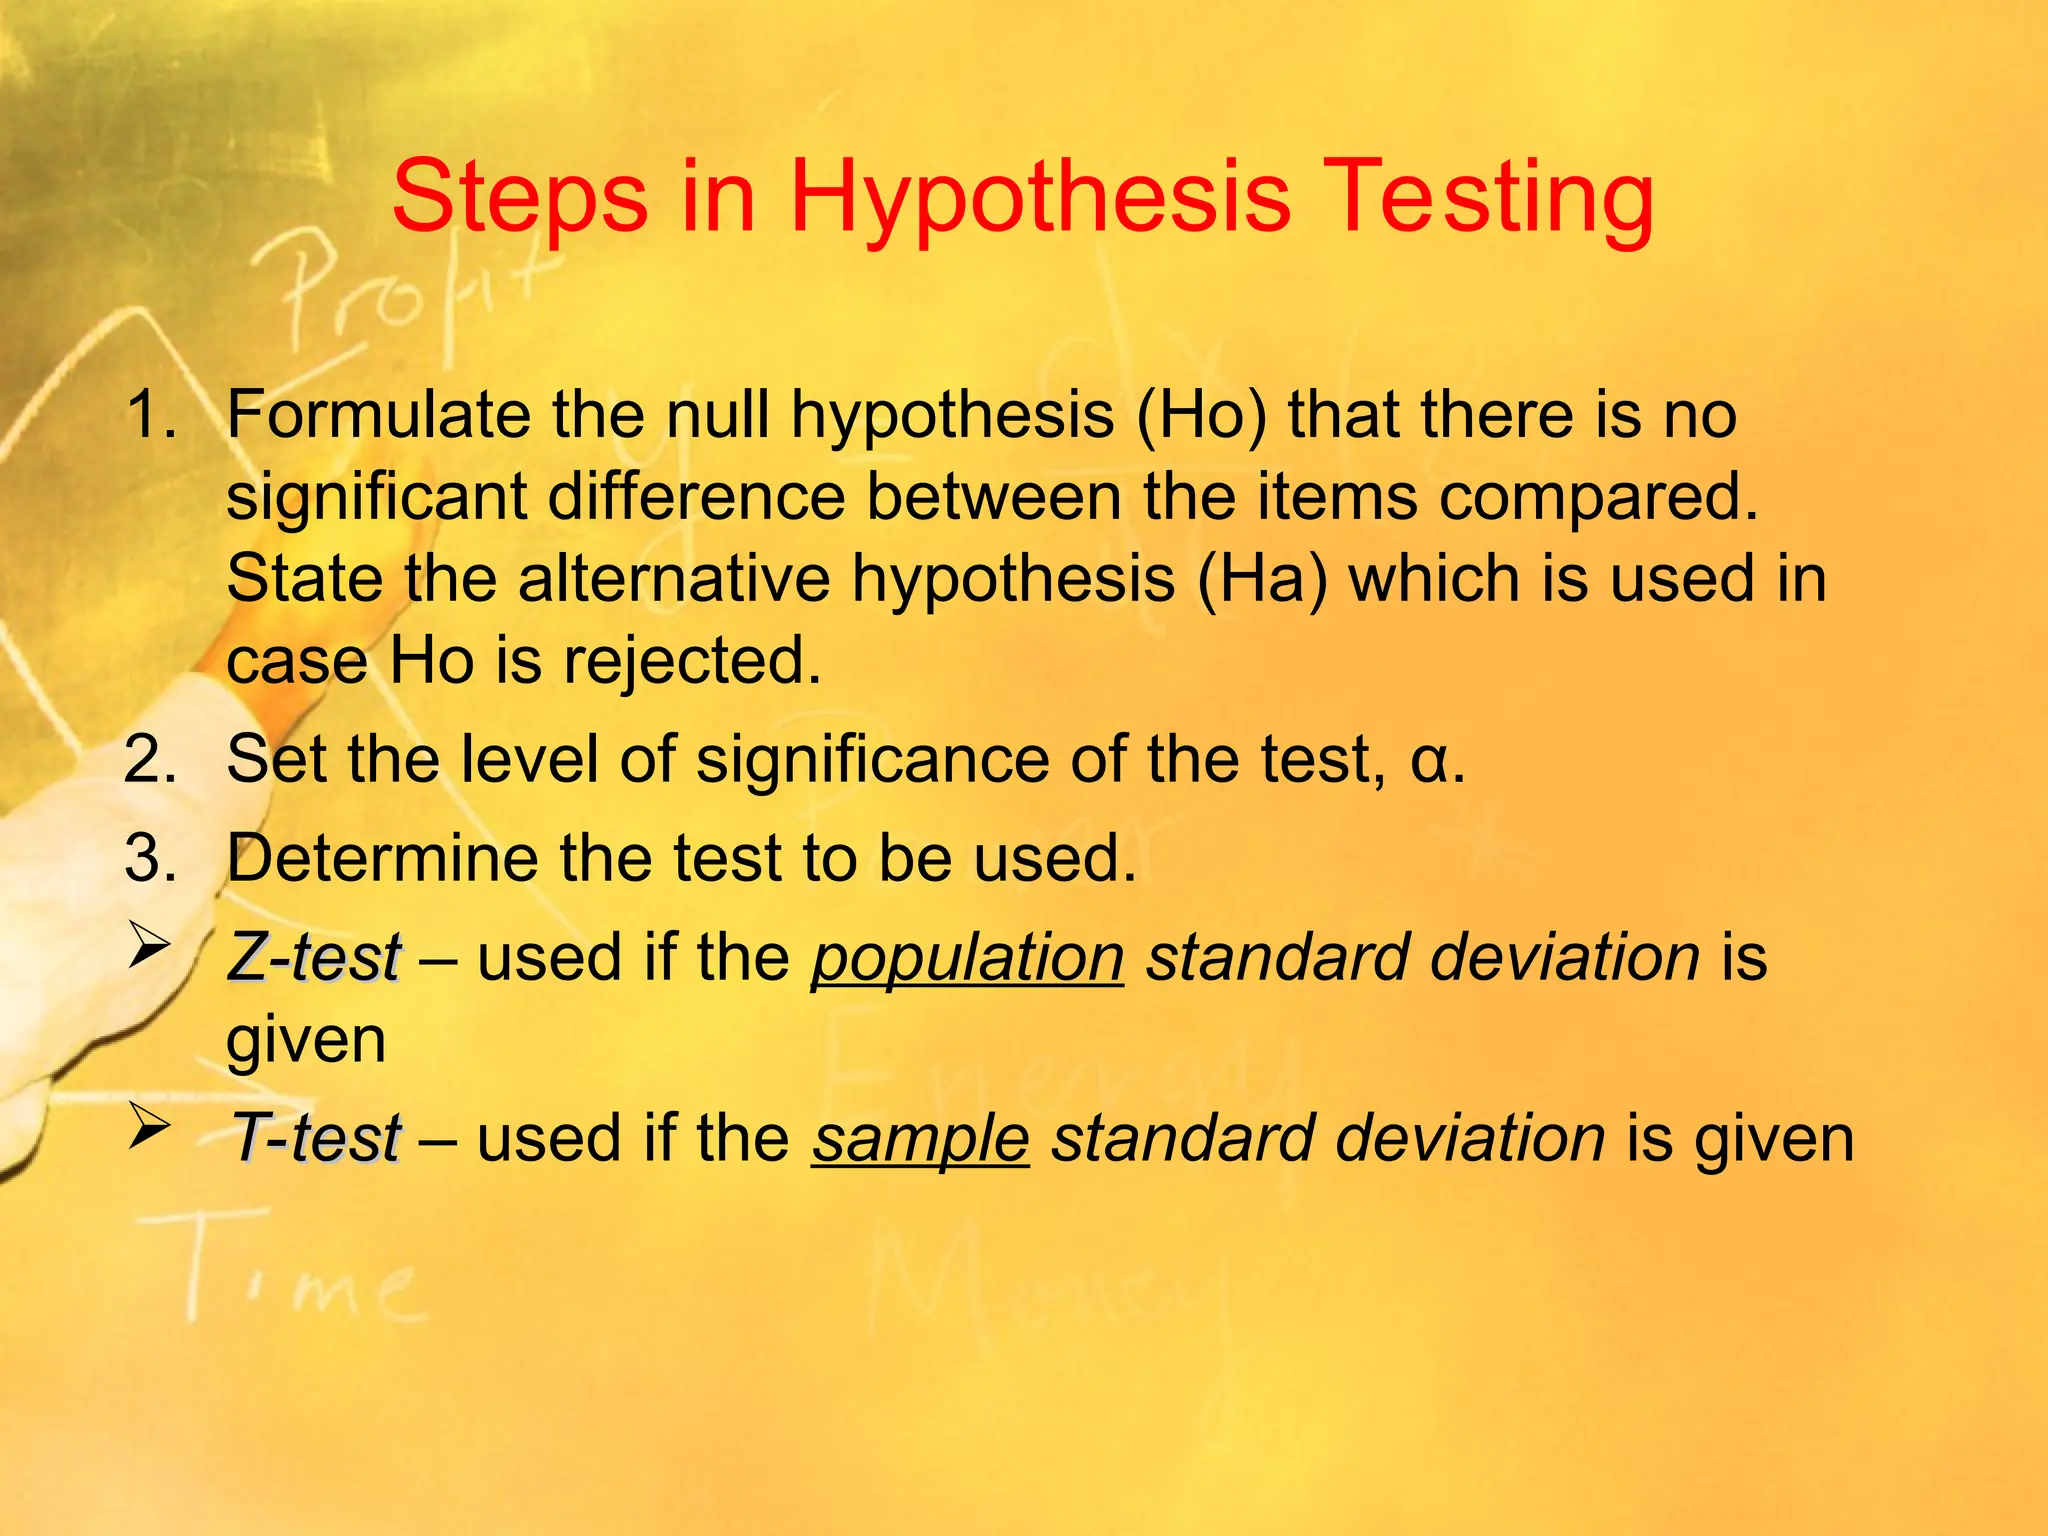
Steps in HypothesisTesting
1. Formulate the null hypothesis (Ho) that there is no
significant difference between the items compared.
State the alternative hypothesis (Ha) which is used in
case Ho is rejected.
2. Set the level of significance of the test, α.
3. Determine the test to be used.
Z-test
Z-test – used if the population standard deviation is
given
T-test
T-test – used if the sample standard deviation is given
75.
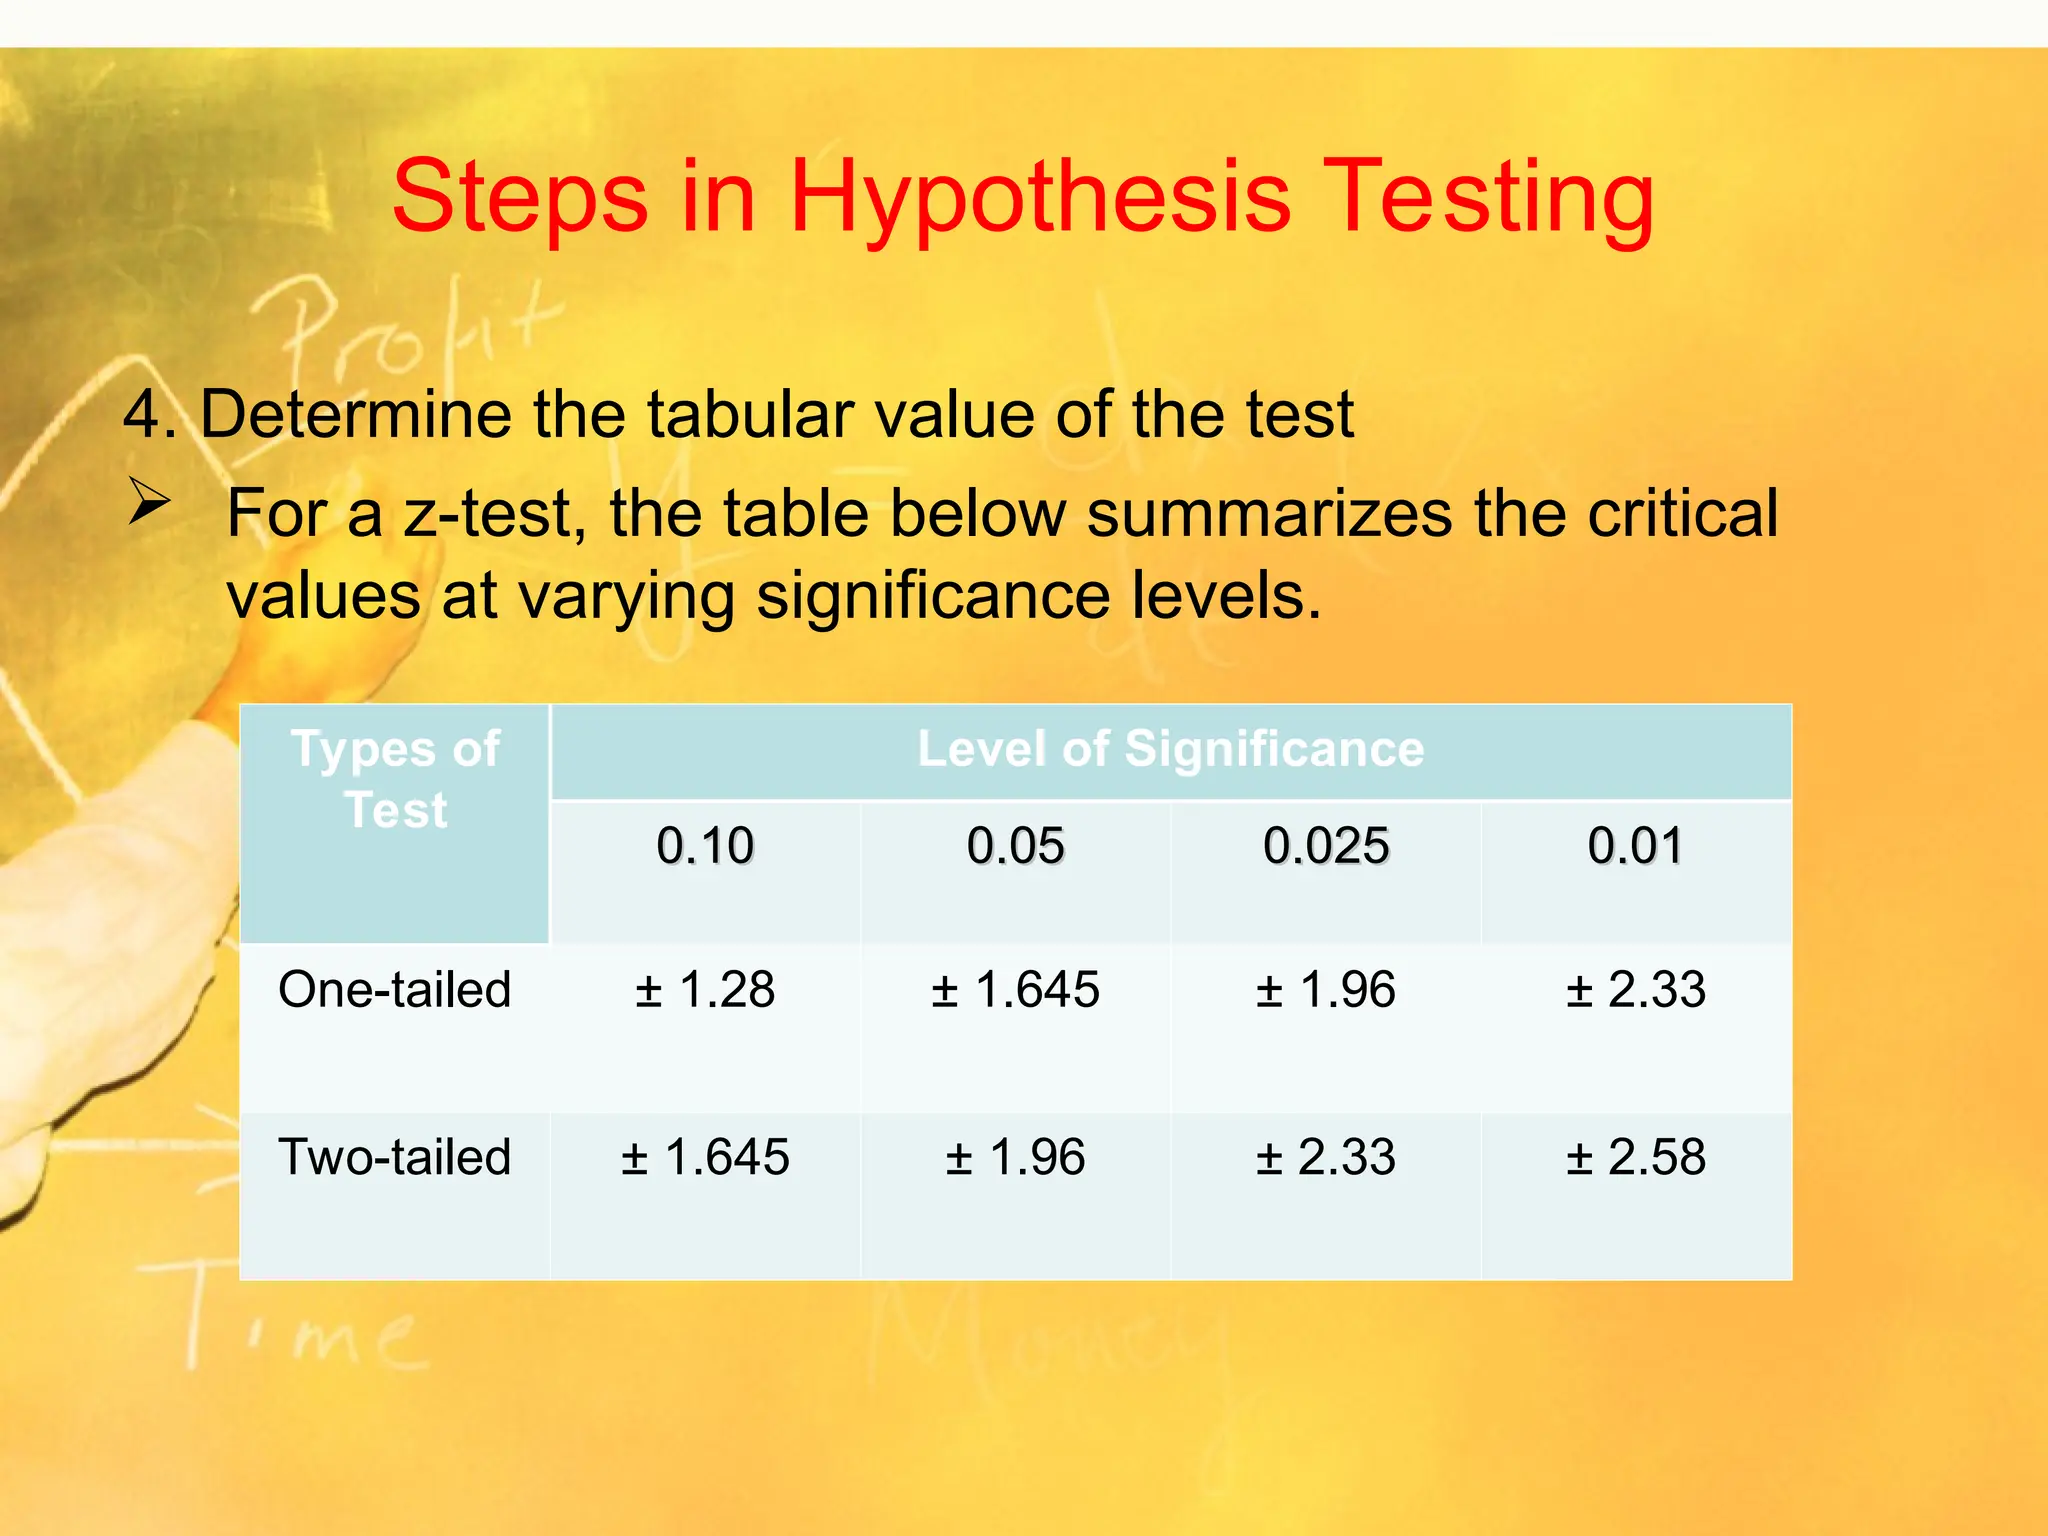
Steps in HypothesisTesting
4. Determine the tabular value of the test
For a z-test, the table below summarizes the critical
values at varying significance levels.
Types of
Test
Level of Significance
0.10
0.10 0.05
0.05 0.025
0.025 0.01
0.01
One-tailed ± 1.28 ± 1.645 ± 1.96 ± 2.33
Two-tailed ± 1.645 ± 1.96 ± 2.33 ± 2.58
76.
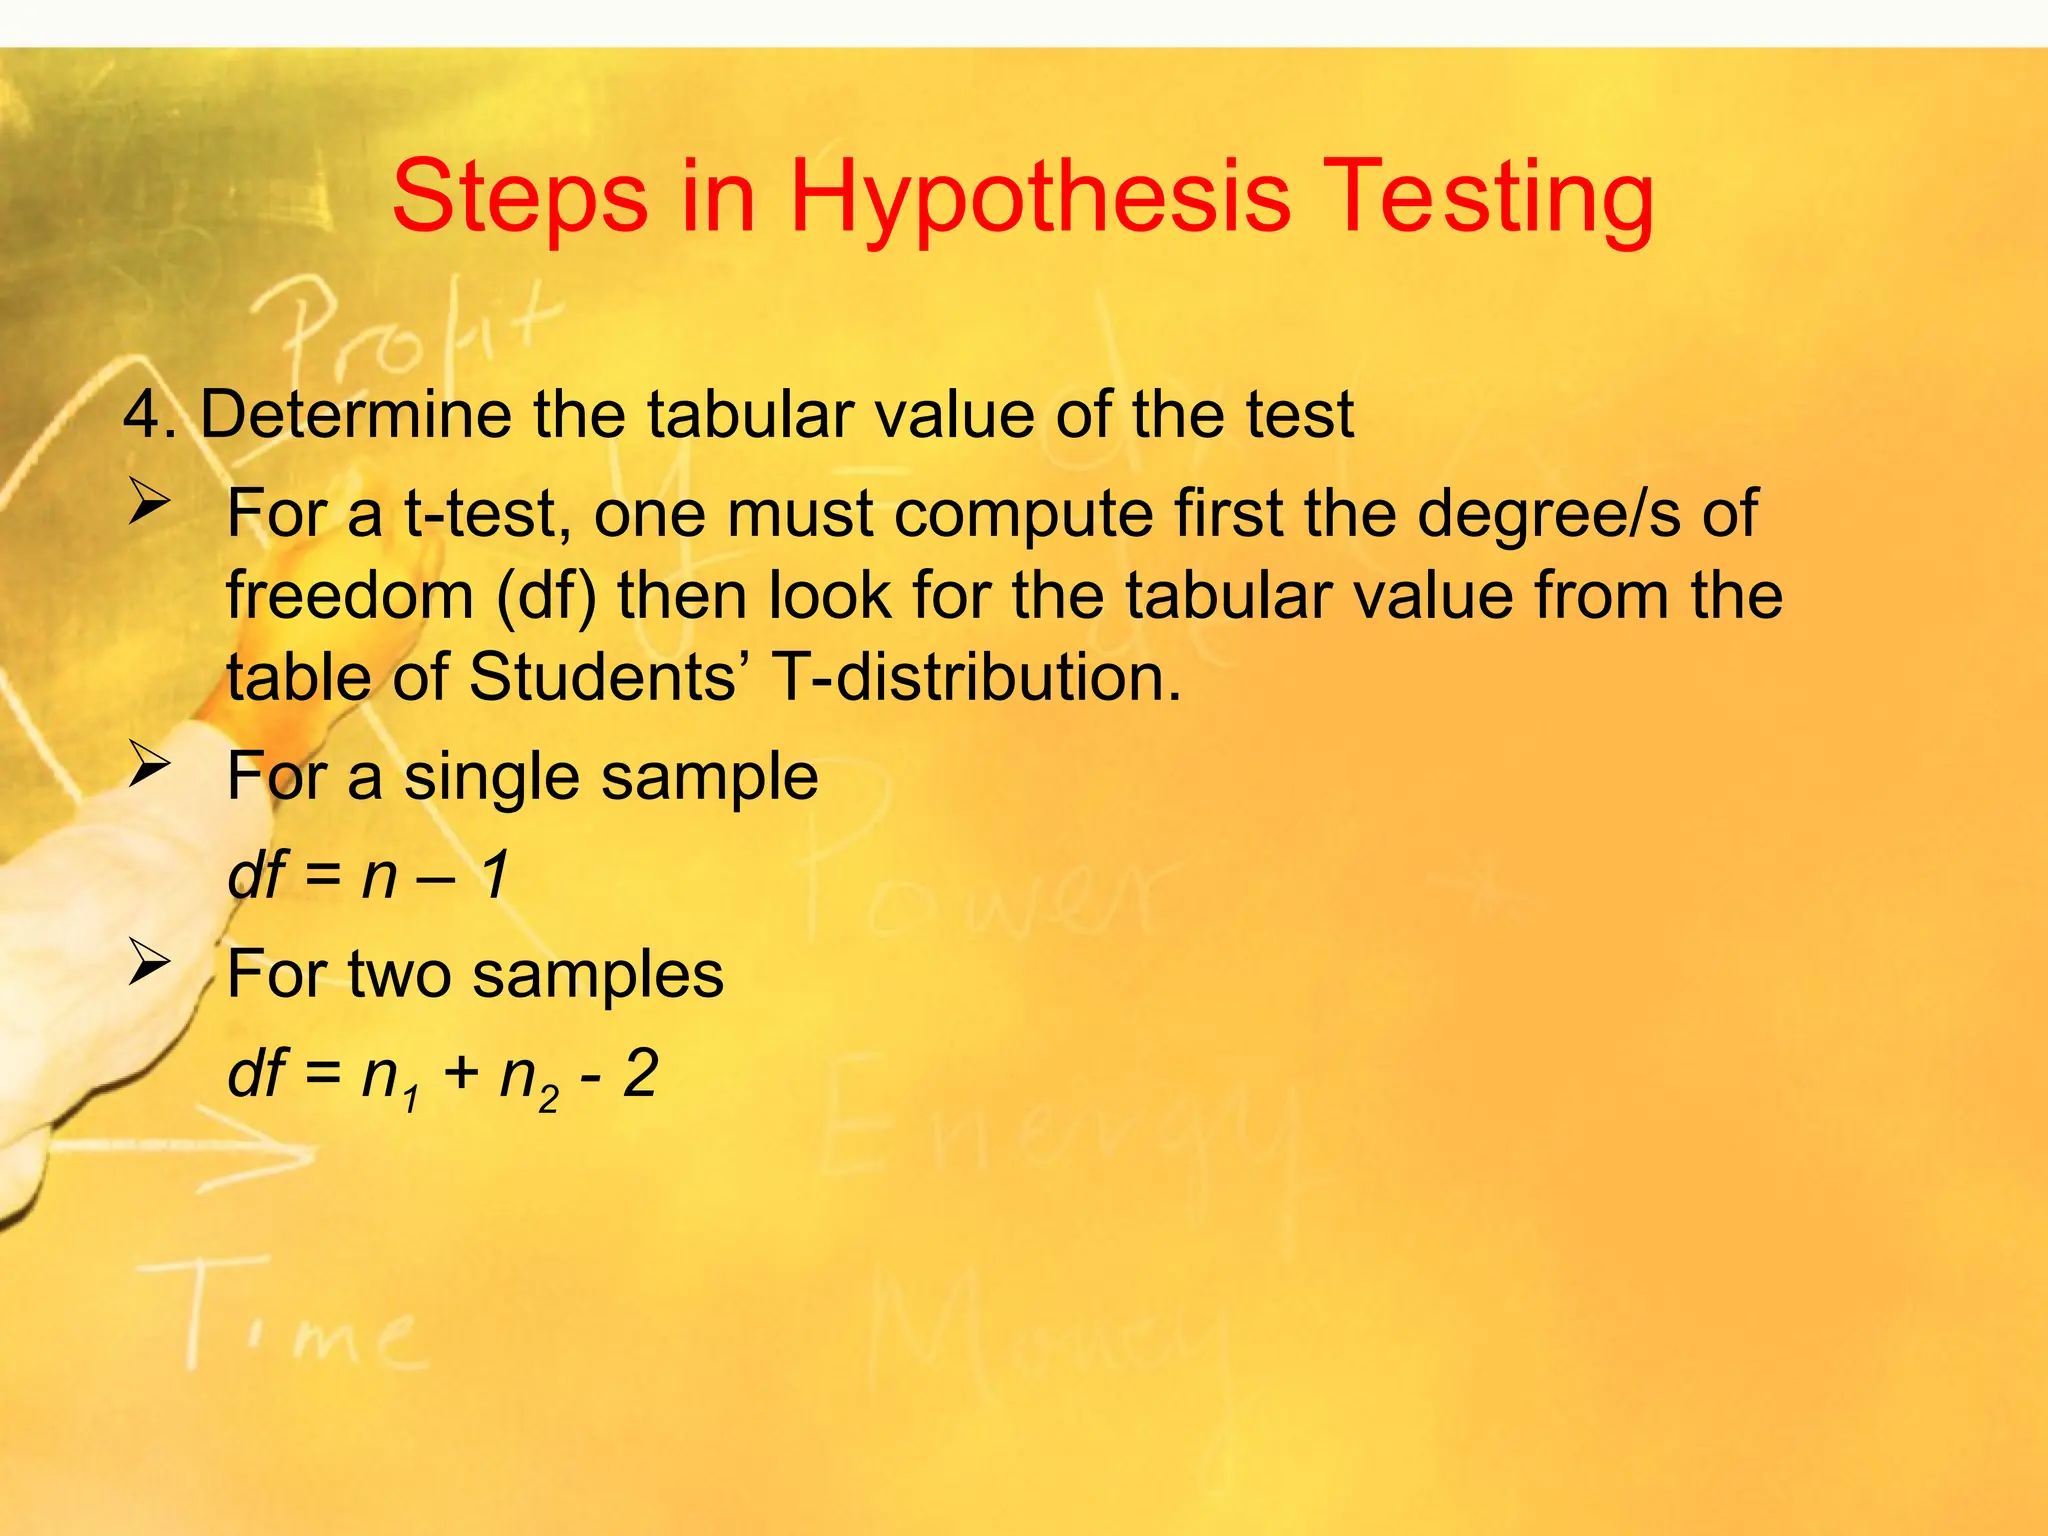
Steps in HypothesisTesting
4. Determine the tabular value of the test
For a t-test, one must compute first the degree/s of
freedom (df) then look for the tabular value from the
table of Students’ T-distribution.
For a single sample
df = n – 1
For two samples
df = n1 + n2 - 2
77.
Steps in HypothesisTesting
5. Compute for z or t as needed. Vary your solutions using
the formulas:
For z-test
i. Sample mean compared with a population mean
ii. Comparing two sample means
iii. Comparing two sample proportions
For t-test
i. Sample mean compared with a population mean
ii. Comparing two sample means
78.
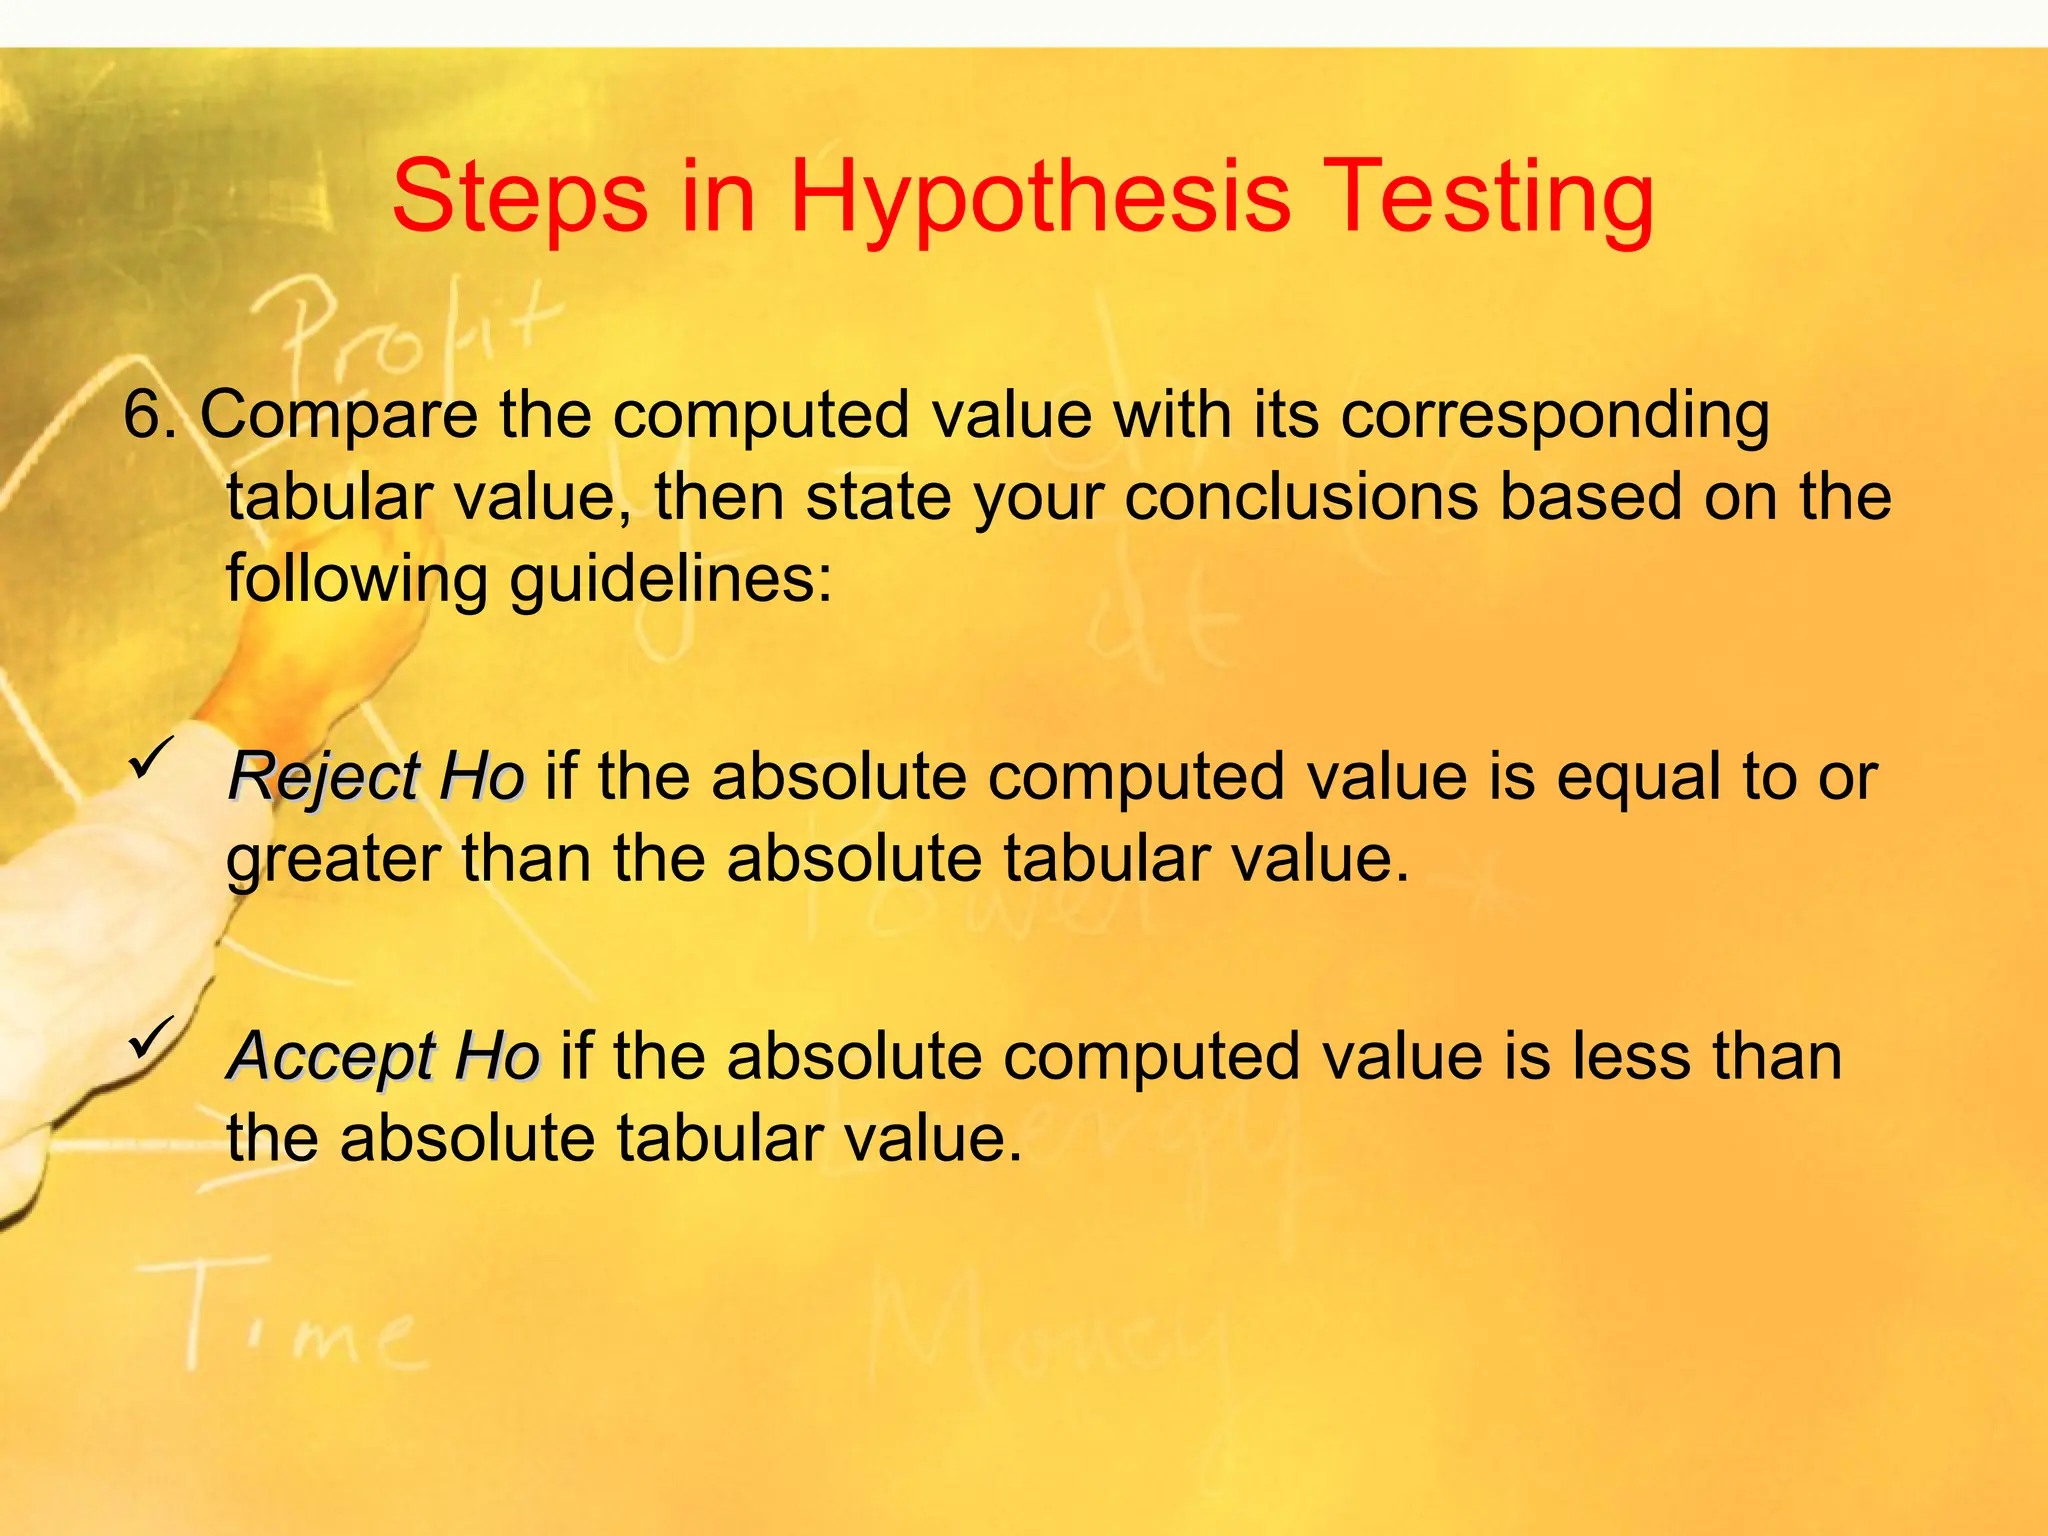
Steps in HypothesisTesting
6. Compare the computed value with its corresponding
tabular value, then state your conclusions based on the
following guidelines:
Reject Ho
Reject Ho if the absolute computed value is equal to or
greater than the absolute tabular value.
Accept Ho
Accept Ho if the absolute computed value is less than
the absolute tabular value.
79.
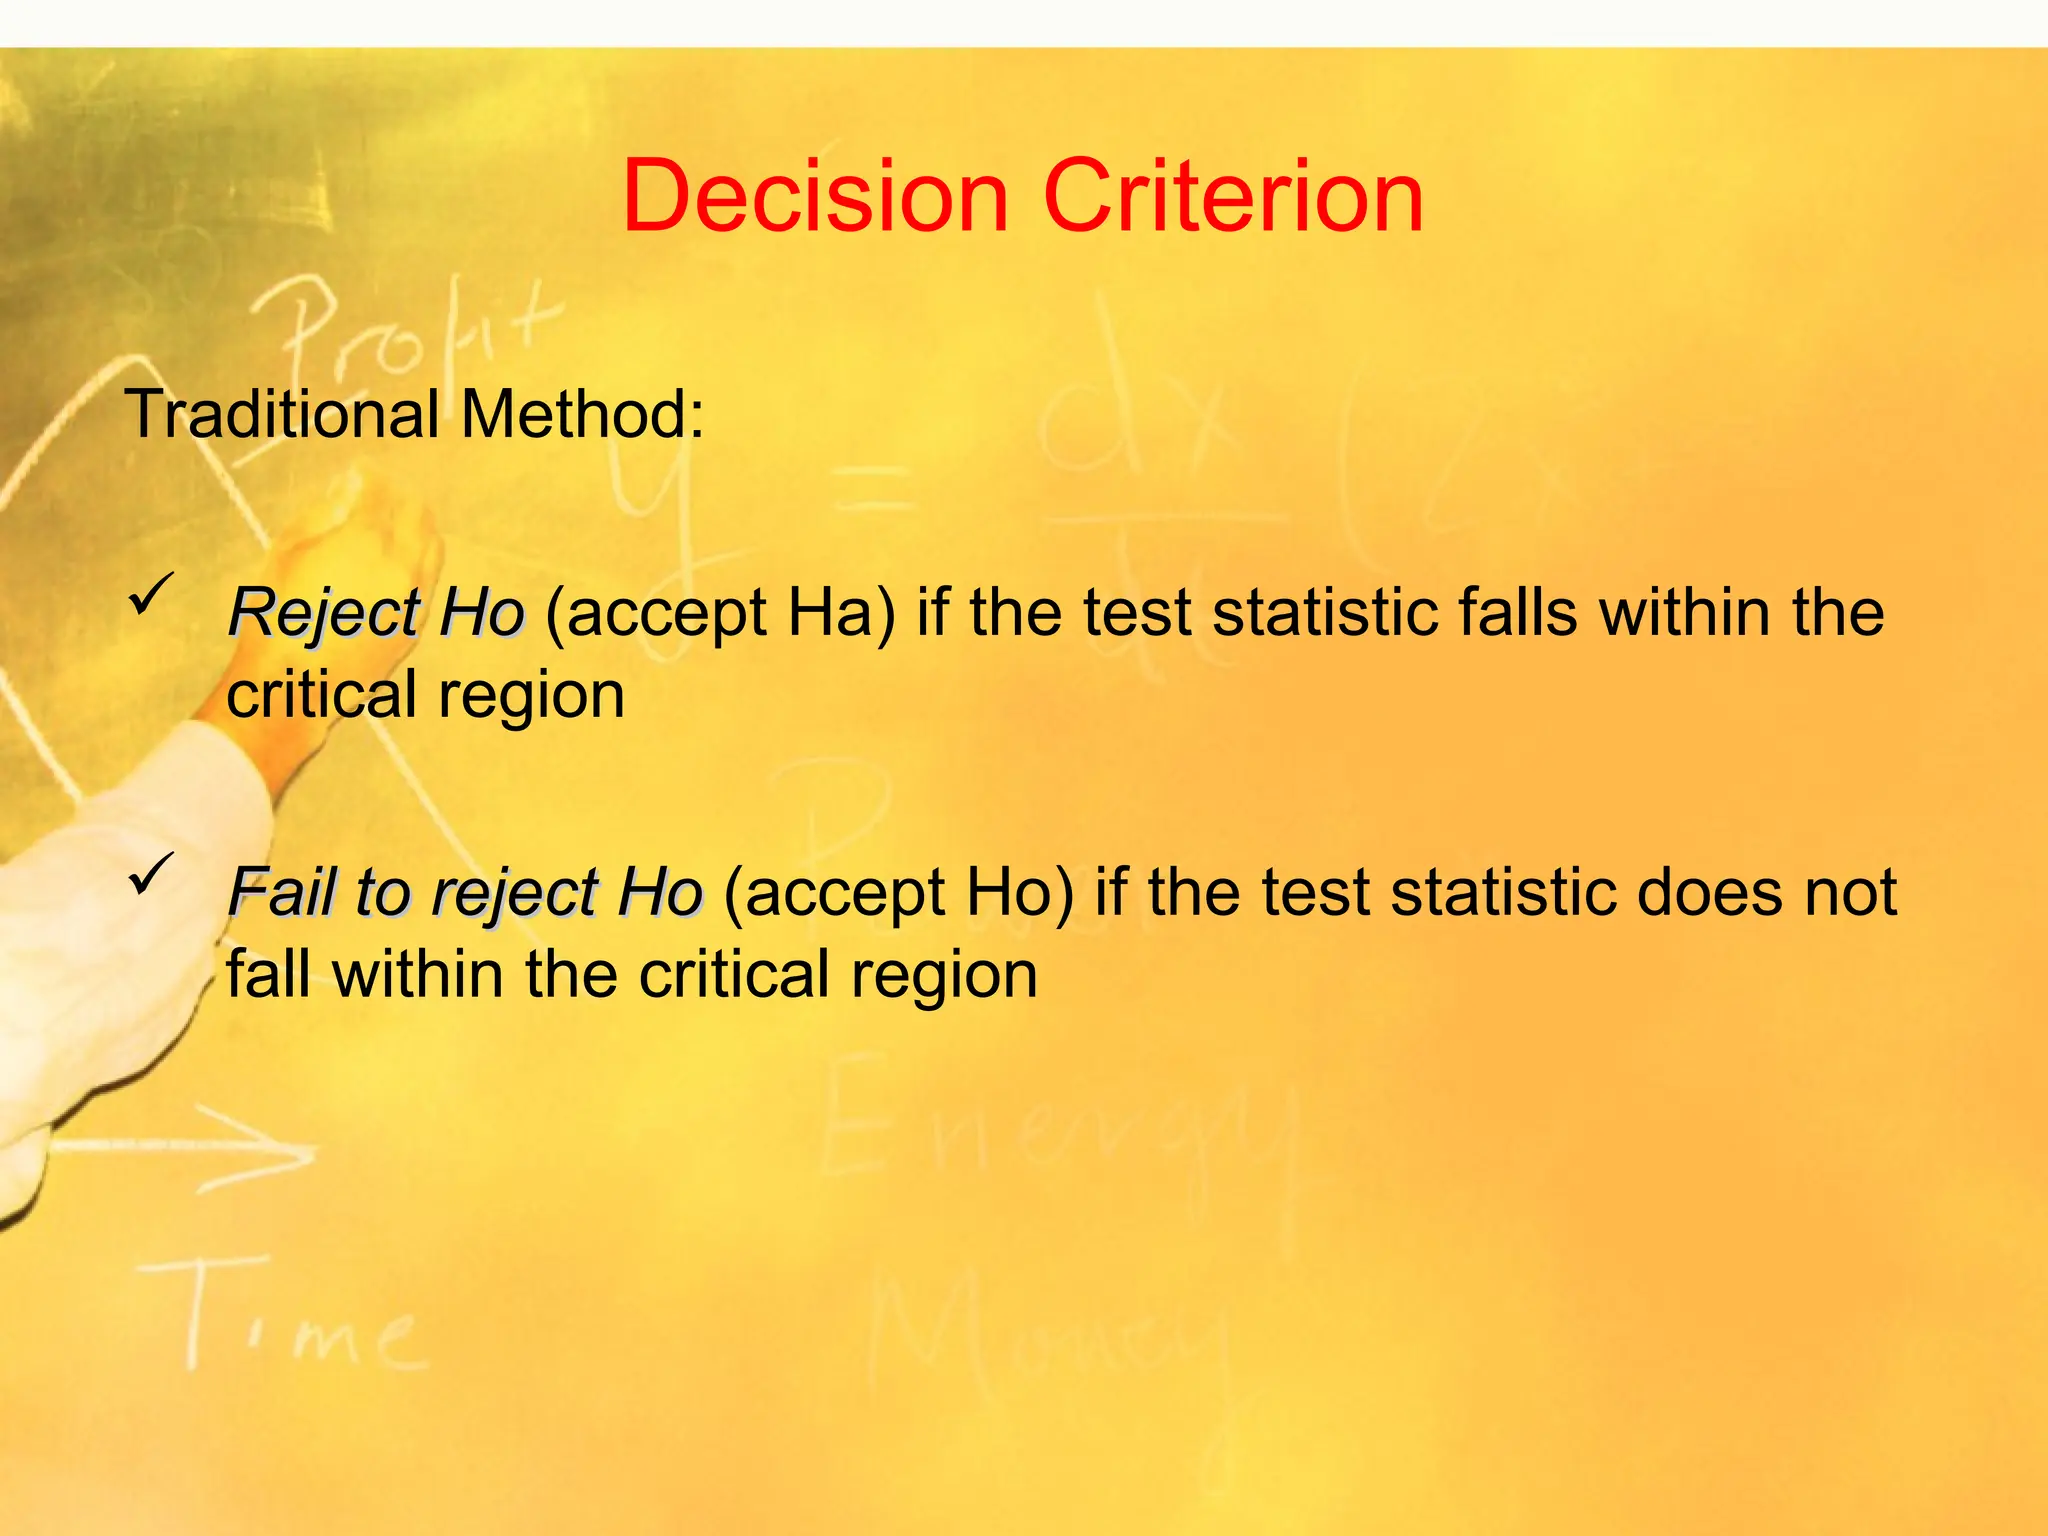
Decision Criterion
Traditional Method:
Reject Ho
Reject Ho (accept Ha) if the test statistic falls within the
critical region
Fail to reject Ho
Fail to reject Ho (accept Ho) if the test statistic does not
fall within the critical region
80.
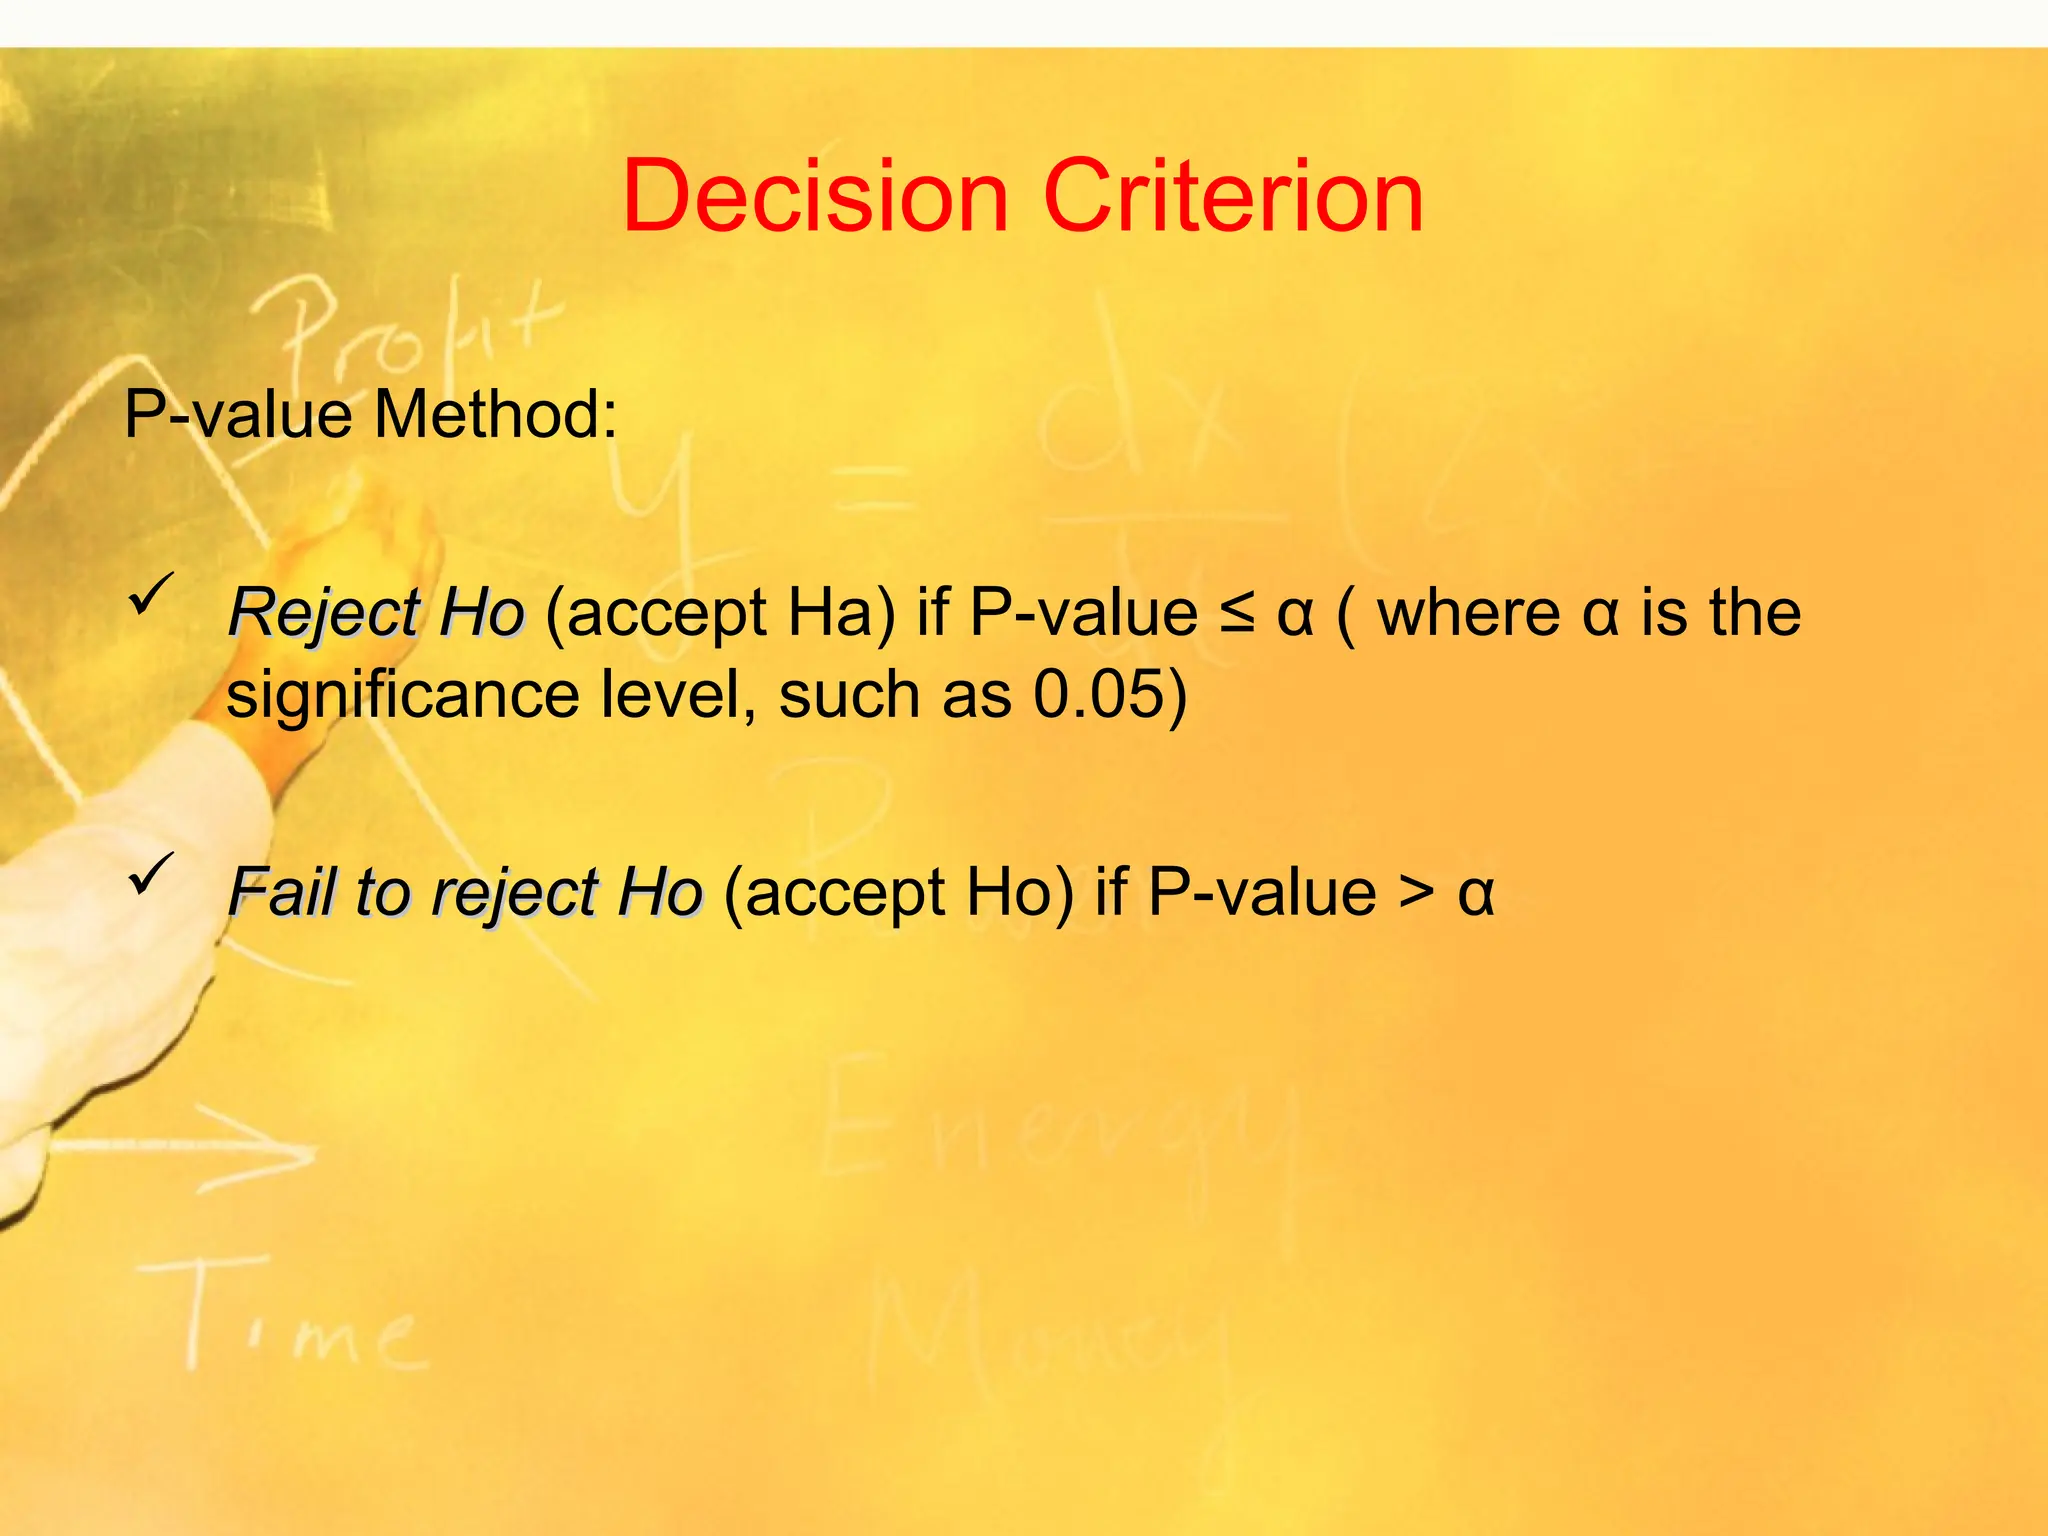
Decision Criterion
P-value Method:
Reject Ho
Reject Ho (accept Ha) if P-value ≤ α ( where α is the
significance level, such as 0.05)
Fail to reject Ho
Fail to reject Ho (accept Ho) if P-value > α


![BASIC CONCEPTS in STAT 1 [Autosaved].pptx](https://cdn.slidesharecdn.com/ss_thumbnails/basicconceptsinstat1autosaved-221027115944-55c11ebb-thumbnail.jpg?width=640&height=640&fit=bounds)


