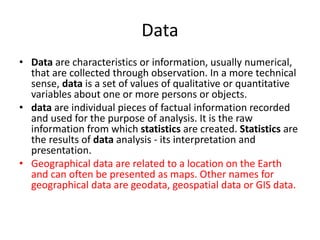
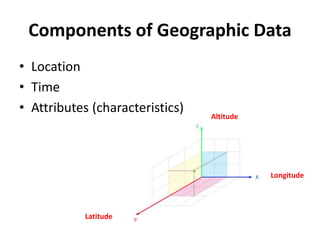
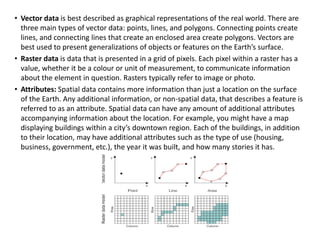
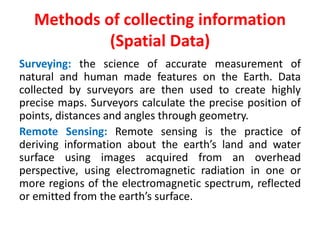
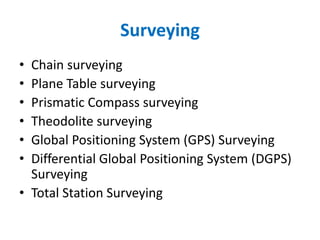
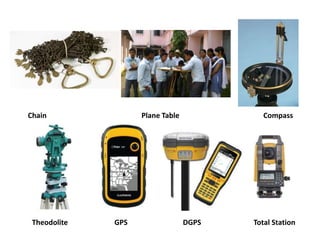
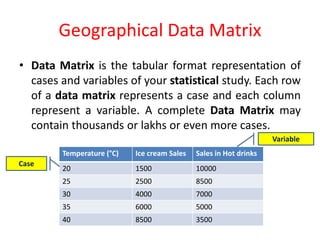
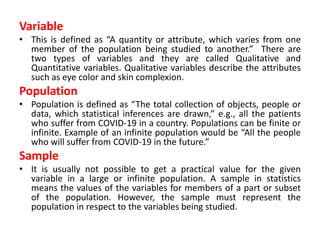
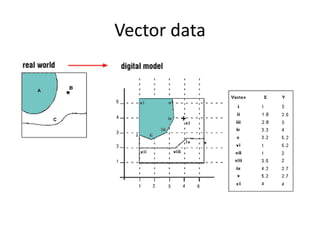
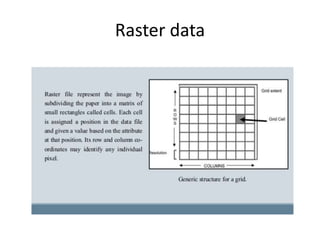
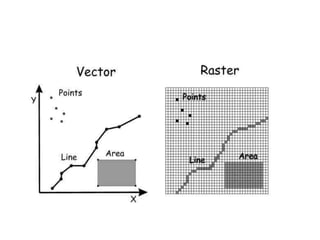
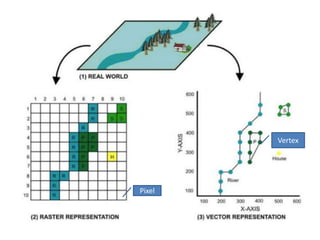
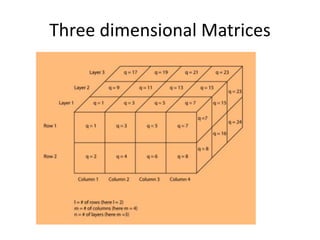
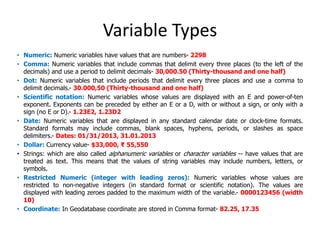
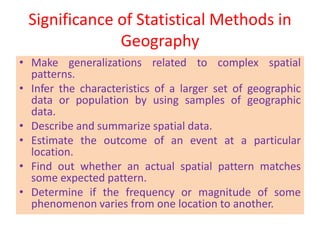
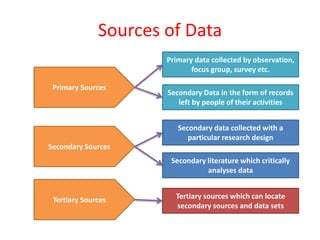
SlideShare a Scribd company logo
STATISTICAL METHODS IN
GEOGRAPHY
Dr. Manoj Kumar Meher
Kalahandi University
meher.manoj@gmail.com
Data
• Data are characteristics or information, usually numerical,
that are collected through observation. In a more technical
sense, data is a set of values of qualitative or quantitative
variables about one or more persons or objects.
• data are individual pieces of factual information recorded
and used for the purpose of analysis. It is the raw
information from which statistics are created. Statistics are
the results of data analysis - its interpretation and
presentation.
• Geographical data are related to a location on the Earth
and can often be presented as maps. Other names for
geographical data are geodata, geospatial data or GIS data.
Components of Geographic Data
• Location
• Time
• Attributes (characteristics)
Longitude
Latitude
Altitude
Characteristics of Geographic Data
• 1. Geographic data varies spatially:
• 2. Geographic data represents attributes of
features: eg Name, year etc
• 3. Temporal variation:
• 4. Data sets can be discrete or continuous:
Geographic space is continuous however, the geographic data which is
represented in GIS can be discrete or continuous. A data set is called discrete,
if no observations are possible to make between two observations at given
point of time.
• 5. Projected data of large areas may have
distortions: Map projection and shape of the earth
• 6. Spatial Auto correlation: GIS method for better use
Nature of Geographical Data
Classification by scaling & dimension
After Rabinson
Types of geographic data
• Two kinds of data are usually associated
with geographic features: spatial and non-
spatial data.
• Spatial data refers to the shape, size and
location of the feature.
• Non- spatial data refers to other attributes
associated with the feature such as name,
length, area, volume, population, soil type, etc
.
• Vector data is best described as graphical representations of the real world. There are
three main types of vector data: points, lines, and polygons. Connecting points create
lines, and connecting lines that create an enclosed area create polygons. Vectors are
best used to present generalizations of objects or features on the Earth’s surface.
• Raster data is data that is presented in a grid of pixels. Each pixel within a raster has a
value, whether it be a colour or unit of measurement, to communicate information
about the element in question. Rasters typically refer to image or photo.
• Attributes: Spatial data contains more information than just a location on the surface
of the Earth. Any additional information, or non-spatial data, that describes a feature is
referred to as an attribute. Spatial data can have any amount of additional attributes
accompanying information about the location. For example, you might have a map
displaying buildings within a city’s downtown region. Each of the buildings, in addition
to their location, may have additional attributes such as the type of use (housing,
business, government, etc.), the year it was built, and how many stories it has.
Nature of geographic data
• Geographical Phenomena
• Spatial autocorrelation and space
• Spatial Sampling
• Spatial interpolation
• Uncertainty of geographical data
Geographical Phenomena
• The First Law of Geography, formulated by
Waldo Tobler, states that everything
• is related to everything else, but near things
are more related than distant things.
Spatial Autocorrelation
• Spatial autocorrelation is the formal property that measures the degree to
which
• near and distant things are related.
• Positive spatial autocorrelation occurs when features that are similar in
location
• are also similar in attributes. Negative spatial autocorrelation occurs when
• features that are close together in space are dissimilar in attributes. Zero
• autocorrelation occurs when attributes are independent of location.
Spatial Sampling
• The quest to represent the complex real world requires us to
abstract, or sample, events and occurrences. For many purposes,
geographic data are only as good as the sampling scheme used to
create them.
• You can think of sampling as the process of selecting points from
a continuous field or, if the field has been digitized as a mosaic of
objects, of selecting some of these objects while discarding
others.
• Classical statistics often emphasizes the importance of
randomness in sound sample design. The purest form, simple
random sampling, is well known: each element is assigned a
unique number, and a specified number of elements are selected
using a random number generator. In the case of a spatial sample
from continuous space, x,y coordinates might be randomly
sampled within the range of x and y values. Because each
randomly selected element has a known probability of selection,
it is possible to make robust and defensible generalizations to the
population from which the sample was drawn.
Spatial Interpolation
• Spatial interpolation is the
process of filling in the gaps
between sample observations. It
requires an understanding of the
attenuating effect of distance
between sample observations
and selection of an appropriate
interpolation function. This
concept focuses on principles
that are used to describe effects
over distance.
Uncertainty of geographical data
• The length of coast line problem
• Uncertainty in the conception of geographical
phenomena
• Uncertainty in the measurement &
representation of geographical phenomena
• Uncertainty in the analysis of geographical
phenomena
Methods of data collection
There are two methods of collecting data.
1. Quantitative Data Collection
2. Qualitative Data Collection
• Quantitative data collection methods rely on random
sampling and structured data collection instruments,
that fit diverse experiences, into predetermined
response categories. They produce results that are easy
to summarize, compare, and generalize.
• Qualitative data collection methods are exploratory in
nature and are mainly concerned with gaining insights
and understanding on underlying reasons and
motivations. Qualitative methods are often regarded as
providing rich data about real life people and situations
and being more able to make sense of behaviour and
to understand behaviour within its wider context.
However, qualitative research is often criticised for
lacking generalizability, being too reliant on the
subjective interpretations of researchers and being
incapable of replication by subsequent researchers.
Followings are the few methods of collecting
information (Non-Spatial Data)
• Questionnaires
• Interviews
• Direct observations
• Documents and other materials
• Focus group interviews
• Case-studies
• Diaries
• Critical incidents
• Portfolios
Questionnaires
This was the main data collection method used in this research. Questionnaires are a popular means of collecting
data. But the designing is difficult because it often requires many re-writes before finalization. The most important
issue related to data collection is choosing the most appropriate information or evidence to answer the author’s
questions. To plan data collection the author had to think about the questions to be answered and information
sources available. Also it had to think how these data could be organized, interpreted and then reported to various
audiences before finalizing the questionnaires.
advantages of questionnaires.
• Can be used as a method in its own right or as a basis for interviewing
• or a telephone survey
• Can be posted, e-mailed or faxed
• Can cover the large number of people and organization
• Wide geographical coverage
• Relatively cheap
• No prior arrangements are needed
• Avoid embarrassment on the part of the respondent
• No interviewer bias
• Possible anonymity of respondent
disadvantages
• of questionnaires. They are, designing problem, question have to be relatively
• simple, time delay whilst waiting for responses to be returned, assume no literacy
• problems, no control over who completes it, and problems with incomplete
• questionnaires. The targeted group of people had to be selected carefully to avoid
• such disadvantages.
Interviews
Interviewing is a great way to learn detailed information from a single individual or small
number of individuals. This is a main data collection method used in the research. It is
very useful when someone wants to gain expert opinions on the subject or talk to
someone knowledgeable about a topic.
• Type of Interviews
• 1.Face to face Interview, 2. Phone Interview, 3. Email Interviews, 4. Chat/Messaging
Interviews
When conducting interviews the author adhered to the following rules.
• • Carefully selected the questions asked.
• • Started interview with some small talks
• • Brought extra recording device (another video recorder)
• • Author paid more attention while the interviews were going on
• • Came to the interview prepared
• • Did not pester or push the officer. The author was interviewing and if he/she did not
talk about an issue, author respected and did not push them
• At the interview time author was rigid with his questions
• • Did not allow the officer to get off the topic and asked follow up questions to
redirect the conversation to the subject.
Direct observations
• Author was able to make direct observations
when the EPF offices, in various stations were
visited. Certain participants were quite helpful
in providing an in- depth understanding to the
author by arranging visits to their offices. This
allowed the author to gather certain
information of how the systems behave in the
real office environment.
Documents and other materials
• The author was able to collect some
important data from various offices as a
secondary data collection mechanism. These
data were gathered from various forms,
internal circulars, memos and departmental
instructions of various offices visited by the
author.
Focus group interviews
• A focus group discussion involves gathering people from similar.
backgrounds or experiences together to discuss a specific topic of.
interest. It is a form of qualitative research where questions are.
asked about their perceptions attitudes, beliefs, opinion or ideas.
• Write down your goals. Before you can start gathering participants,
it's important to understand why you're organising the focus group.
• 1. Define your target audience. 2. Find a venue. 3. Recruit
participants. 4. Design the questions. 5. Moderate the group. 6.
Analyse.
• Write down your goals. Before you can start gathering participants,
it's important to understand why you're organising the focus group.
Case-studies
• “The case study method of data collection is a
technique by which individual factor whether it
be an institution or just an episode in the life of
an individual or a group is analysed in its
relationship to any other in the group.” Thus, a
fairly exhaustive study of a person (as to what he
does and has done, what he thinks he does and
had done and what he expects to do and says he
ought to do) or group is called a life or case
history. Burgess has used the words “the social
microscope” for the case study method.”
Diaries
• A diary study is a research method used to
collect qualitative data about user behaviors,
activities, and experiences over time. In a
diary study, data is self-reported
by participants longitudinally — that is, over
an extended period of time that can range
from a few days to even a month or longer.
Critical incidents
• The critical incident technique (CIT) is
a research method in which
the research participant is asked to recall and
describe a time when a behavior, action, or
occurrence impacted (either positively or
negatively) a specified outcome (for example,
the accomplishment of a given task)
Portfolios
Portfolio is an assessment method that monitors
the growth and development. Unlike
most assessments, portfolio assessment can
contain many different forms of assessments as
it is a collection different individuals . A portfolio
assessment is sometimes followed by an
oral assessment.
Methods of collecting information
(Spatial Data)
Surveying: the science of accurate measurement of
natural and human made features on the Earth. Data
collected by surveyors are then used to create highly
precise maps. Surveyors calculate the precise position of
points, distances and angles through geometry.
Remote Sensing: Remote sensing is the practice of
deriving information about the earth’s land and water
surface using images acquired from an overhead
perspective, using electromagnetic radiation in one or
more regions of the electromagnetic spectrum, reflected
or emitted from the earth’s surface.
Surveying
• Chain surveying
• Plane Table surveying
• Prismatic Compass surveying
• Theodolite surveying
• Global Positioning System (GPS) Surveying
• Differential Global Positioning System (DGPS)
Surveying
• Total Station Surveying
Chain Plane Table Compass
Theodolite GPS DGPS Total Station
Remote Sensing
• Airborne
• Satellite based
Geographical Data Matrix
• Data Matrix is the tabular format representation of
cases and variables of your statistical study. Each row
of a data matrix represents a case and each column
represent a variable. A complete Data Matrix may
contain thousands or lakhs or even more cases.
Temperature (°C) Ice cream Sales Sales in Hot drinks
20 1500 10000
25 2500 8500
30 4000 7000
35 6000 5000
40 8500 3500
Case
Variable
Variable
• This is defined as “A quantity or attribute, which varies from one
member of the population being studied to another.” There are
two types of variables and they are called Qualitative and
Quantitative variables. Qualitative variables describe the attributes
such as eye color and skin complexion.
Population
• Population is defined as “The total collection of objects, people or
data, which statistical inferences are drawn,” e.g., all the patients
who suffer from COVID-19 in a country. Populations can be finite or
infinite. Example of an infinite population would be “All the people
who will suffer from COVID-19 in the future.”
Sample
• It is usually not possible to get a practical value for the given
variable in a large or infinite population. A sample in statistics
means the values of the variables for members of a part or subset
of the population. However, the sample must represent the
population in respect to the variables being studied.
Vector data
Raster data
Pixel
Vertex
Three dimensional Matrices
Variable Types
• Numeric: Numeric variables have values that are numbers- 2298
• Comma: Numeric variables that include commas that delimit every three places (to the left of the
decimals) and use a period to delimit decimals- 30,000.50 (Thirty-thousand and one half)
• Dot: Numeric variables that include periods that delimit every three places and use a comma to
delimit decimals.- 30.000,50 (Thirty-thousand and one half)
• Scientific notation: Numeric variables whose values are displayed with an E and power-of-ten
exponent. Exponents can be preceded by either an E or a D, with or without a sign, or only with a
sign (no E or D).- 1.23E2, 1.23D2
• Date: Numeric variables that are displayed in any standard calendar date or clock-time formats.
Standard formats may include commas, blank spaces, hyphens, periods, or slashes as space
delimiters.- Dates: 01/31/2013, 31.01.2013
• Dollar: Currency value- $33,000, ₹ 55,550
• Strings: which are also called alphanumeric variables or character variables -- have values that are
treated as text. This means that the values of string variables may include numbers, letters, or
symbols.
• Restricted Numeric (integer with leading zeros): Numeric variables whose values are
restricted to non-negative integers (in standard format or scientific notation). The values are
displayed with leading zeroes padded to the maximum width of the variable.- 0000123456 (width
10)
• Coordinate: In Geodatabase coordinate are stored in Comma format- 82.25, 17.35
Significance of Statistical Methods in
Geography
• Make generalizations related to complex spatial
patterns.
• Infer the characteristics of a larger set of geographic
data or population by using samples of geographic
data.
• Describe and summarize spatial data.
• Estimate the outcome of an event at a particular
location.
• Find out whether an actual spatial pattern matches
some expected pattern.
• Determine if the frequency or magnitude of some
phenomenon varies from one location to another.
Sources of Data
Primary data collected by observation,
focus group, survey etc.
Secondary Data in the form of records
left by people of their activities
Secondary data collected with a
particular research design
Secondary literature which critically
analyses data
Tertiary sources which can locate
secondary sources and data sets
Primary Sources
Secondary Sources
Tertiary Sources
• Primary data: Information obtain first hand by
the researcher on the variable of interest for
the specific purpose of the study.
Example: Survey, focus group discussion, personal
interview etc..)
• Secondary data: Information gathered from
sources already existing.
Example: Governments publication, company records,
web sites, media etc…
Spatial Data Sources (Secondary)
• Maps (survey of India, Geological survey of India, National
Thematic Mapping Organisation etc..)
• Drawings (sketch or engineering)
• Aerial photograph
• Satellite imagery
• CAD data based
• Government & commercial spatial (GIS) data
bases
• Paper records and documents
GIS data for India
Name Description
Geo-Platform of ISRO
Bhuvan - an Indian Geo-platform of ISRO by National
Remote Sensing Centre (NRSC).
Open Data Archive Bhuvan - GIS - Open Data Archive from NRSC.
List of Data Sources: https://en.wikipedia.org/wiki/List_of_GIS_data_sources#Global
Non- spatial data Sources (Secondary)
• Census of India (population, animal, tiger, bird etc…)
• National Sample Survey Organisation (NSSO)
• Statistical Abstract
• Government & commercial attributes (GIS) data bases
• Periodical books & Journals
• University Research Organisations
• Annual Reports
• Diaries
• News Media (prints & electronic)
“Thank
You”

More Related Content

What's hot

Definition,meaning, scope,approach, and aim of urban-geography
Definition,meaning, scope,approach, and aim of urban-geographyDefinition,meaning, scope,approach, and aim of urban-geography
Definition,meaning, scope,approach, and aim of urban-geography
Kamrul Islam Karim
 
Definition, nature and scope of population geography
Definition, nature and scope of population geographyDefinition, nature and scope of population geography
Definition, nature and scope of population geography
Banaras Hindu University, Varanasi
 
Geomorpholgy: NATURE AND SCOPE
Geomorpholgy: NATURE AND SCOPEGeomorpholgy: NATURE AND SCOPE
Geomorpholgy: NATURE AND SCOPE
Apoorva Mathur
 
Geomorophology presentation
Geomorophology presentationGeomorophology presentation
Geomorophology presentation
Nigatu G-medhin
 
Behavioral perspective in geography
Behavioral perspective in geographyBehavioral perspective in geography
Behavioral perspective in geography
Banaras Hindu University, Varanasi
 
Cycle of erosion, davis and penk
Cycle of erosion, davis and penkCycle of erosion, davis and penk
Cycle of erosion, davis and penk
RajithK
 
Cartography
CartographyCartography
Cartography
Pramoda Raj
 
Definition and scope of settlement geography
Definition and scope of settlement geographyDefinition and scope of settlement geography
Definition and scope of settlement geography
marguburrahaman
 
Geo referencing by Mashhood Arif
Geo referencing by Mashhood ArifGeo referencing by Mashhood Arif
Geo referencing by Mashhood Arif
KU Leuven
 
Map projection
Map projection Map projection
Map projection
Pramoda Raj
 
Land use and land cover classification
Land use and land cover classification Land use and land cover classification
Land use and land cover classification
Calcutta University
 
Types of-maps - part 2
Types of-maps - part 2Types of-maps - part 2
Types of-maps - part 2
Vineesh V Vineeshvc
 
History of cartography
History of cartographyHistory of cartography
Statistics for Geography and Environmental Science: an introductory lecture c...
Statistics for Geography and Environmental Science:an introductory lecture c...Statistics for Geography and Environmental Science:an introductory lecture c...
Statistics for Geography and Environmental Science: an introductory lecture c...
Rich Harris
 
Morphogenetic region-Geomorhology Chapter
Morphogenetic region-Geomorhology ChapterMorphogenetic region-Geomorhology Chapter
Morphogenetic region-Geomorhology Chapter
Kaium Chowdhury
 
POPULATION GEOGRAPHY vs. DEMOGRAPHY
POPULATION GEOGRAPHY vs. DEMOGRAPHYPOPULATION GEOGRAPHY vs. DEMOGRAPHY
POPULATION GEOGRAPHY vs. DEMOGRAPHY
Arghyadeep Saha
 
Mean centre of population
Mean centre of populationMean centre of population
Mean centre of population
Arindam Sarkar
 
Map projection
Map projectionMap projection
Map projection
kaslinsas
 

What's hot (20)

Definition,meaning, scope,approach, and aim of urban-geography
Definition,meaning, scope,approach, and aim of urban-geographyDefinition,meaning, scope,approach, and aim of urban-geography
Definition,meaning, scope,approach, and aim of urban-geography
 
Definition, nature and scope of population geography
Definition, nature and scope of population geographyDefinition, nature and scope of population geography
Definition, nature and scope of population geography
 
Geomorpholgy: NATURE AND SCOPE
Geomorpholgy: NATURE AND SCOPEGeomorpholgy: NATURE AND SCOPE
Geomorpholgy: NATURE AND SCOPE
 
Geomorophology presentation
Geomorophology presentationGeomorophology presentation
Geomorophology presentation
 
Behavioral perspective in geography
Behavioral perspective in geographyBehavioral perspective in geography
Behavioral perspective in geography
 
Cycle of erosion, davis and penk
Cycle of erosion, davis and penkCycle of erosion, davis and penk
Cycle of erosion, davis and penk
 
Cartography
CartographyCartography
Cartography
 
Definition and scope of settlement geography
Definition and scope of settlement geographyDefinition and scope of settlement geography
Definition and scope of settlement geography
 
Geo referencing by Mashhood Arif
Geo referencing by Mashhood ArifGeo referencing by Mashhood Arif
Geo referencing by Mashhood Arif
 
Map projection
Map projection Map projection
Map projection
 
Land use and land cover classification
Land use and land cover classification Land use and land cover classification
Land use and land cover classification
 
Types of-maps - part 2
Types of-maps - part 2Types of-maps - part 2
Types of-maps - part 2
 
History of cartography
History of cartographyHistory of cartography
History of cartography
 
Statistics for Geography and Environmental Science: an introductory lecture c...
Statistics for Geography and Environmental Science:an introductory lecture c...Statistics for Geography and Environmental Science:an introductory lecture c...
Statistics for Geography and Environmental Science: an introductory lecture c...
 
Morphogenetic region-Geomorhology Chapter
Morphogenetic region-Geomorhology ChapterMorphogenetic region-Geomorhology Chapter
Morphogenetic region-Geomorhology Chapter
 
Cartography
CartographyCartography
Cartography
 
POPULATION GEOGRAPHY vs. DEMOGRAPHY
POPULATION GEOGRAPHY vs. DEMOGRAPHYPOPULATION GEOGRAPHY vs. DEMOGRAPHY
POPULATION GEOGRAPHY vs. DEMOGRAPHY
 
Mean centre of population
Mean centre of populationMean centre of population
Mean centre of population
 
Themating maping
Themating mapingThemating maping
Themating maping
 
Map projection
Map projectionMap projection
Map projection
 

Similar to STATISTICAL METHODS IN GEOGRAPHY

Methods of data collection
Methods of data collectionMethods of data collection
Methods of data collection
Don Bosco College Sulthan Bathery
 
Intro to statistics
Intro to statisticsIntro to statistics
Intro to statisticsUlster BOCES
 
introduction to statistics
introduction to statisticsintroduction to statistics
introduction to statistics
AbeeraIlyasAssistant
 
Data and data collection procedures
Data and data collection proceduresData and data collection procedures
Data and data collection procedures
Diana Ashandy Pool Antonio
 
SEMINAR Presentation ppt.pptx
SEMINAR Presentation ppt.pptxSEMINAR Presentation ppt.pptx
SEMINAR Presentation ppt.pptx
WageYado
 
SEMINAR Presentation ppt.pptx
SEMINAR Presentation ppt.pptxSEMINAR Presentation ppt.pptx
SEMINAR Presentation ppt.pptx
WageYado
 
Exploring Data (1).pptx
Exploring Data (1).pptxExploring Data (1).pptx
Exploring Data (1).pptx
gina458018
 
Research instruments
Research instruments Research instruments
Research instruments
zain khan
 
Data Collection Preparation
Data Collection PreparationData Collection Preparation
Data Collection Preparation
Business Student
 
Biostatistics
BiostatisticsBiostatistics
Biostatistics
anju mathew
 
INTRODUCTION TO DATA COLLECTION INSTRUMENTS (DCIs)
INTRODUCTION TO DATA COLLECTION INSTRUMENTS (DCIs)INTRODUCTION TO DATA COLLECTION INSTRUMENTS (DCIs)
INTRODUCTION TO DATA COLLECTION INSTRUMENTS (DCIs)
Auver2012
 
Unit 4 editing and coding (2)
Unit 4 editing and coding (2)Unit 4 editing and coding (2)
Unit 4 editing and coding (2)
kalailakshmi
 
RESPONSE SURFACE METHODOLOGY.pptx
RESPONSE SURFACE METHODOLOGY.pptxRESPONSE SURFACE METHODOLOGY.pptx
RESPONSE SURFACE METHODOLOGY.pptx
SreeLatha49
 
Survey
SurveySurvey
Survey
Arun SP
 
Data Collection Methods.pptx
Data Collection Methods.pptxData Collection Methods.pptx
Data Collection Methods.pptx
ssuser6199b7
 
Introduction to Data Analysis for Nurse Researchers
Introduction to Data Analysis for Nurse ResearchersIntroduction to Data Analysis for Nurse Researchers
Introduction to Data Analysis for Nurse Researchers
Rupa Verma
 
Review presentation for Orientation 2014
Review presentation for Orientation 2014Review presentation for Orientation 2014
Review presentation for Orientation 2014
DUSPviz
 
Data collection instruments (2)
Data collection instruments (2)Data collection instruments (2)
Data collection instruments (2)
pesantez666
 
Data Collection Instruments.
Data Collection Instruments.Data Collection Instruments.
Data Collection Instruments.
Auver2012
 

Similar to STATISTICAL METHODS IN GEOGRAPHY (20)

Methods of data collection
Methods of data collectionMethods of data collection
Methods of data collection
 
Methods of data collection
Methods of data collectionMethods of data collection
Methods of data collection
 
Intro to statistics
Intro to statisticsIntro to statistics
Intro to statistics
 
introduction to statistics
introduction to statisticsintroduction to statistics
introduction to statistics
 
Data and data collection procedures
Data and data collection proceduresData and data collection procedures
Data and data collection procedures
 
SEMINAR Presentation ppt.pptx
SEMINAR Presentation ppt.pptxSEMINAR Presentation ppt.pptx
SEMINAR Presentation ppt.pptx
 
SEMINAR Presentation ppt.pptx
SEMINAR Presentation ppt.pptxSEMINAR Presentation ppt.pptx
SEMINAR Presentation ppt.pptx
 
Exploring Data (1).pptx
Exploring Data (1).pptxExploring Data (1).pptx
Exploring Data (1).pptx
 
Research instruments
Research instruments Research instruments
Research instruments
 
Data Collection Preparation
Data Collection PreparationData Collection Preparation
Data Collection Preparation
 
Biostatistics
BiostatisticsBiostatistics
Biostatistics
 
INTRODUCTION TO DATA COLLECTION INSTRUMENTS (DCIs)
INTRODUCTION TO DATA COLLECTION INSTRUMENTS (DCIs)INTRODUCTION TO DATA COLLECTION INSTRUMENTS (DCIs)
INTRODUCTION TO DATA COLLECTION INSTRUMENTS (DCIs)
 
Unit 4 editing and coding (2)
Unit 4 editing and coding (2)Unit 4 editing and coding (2)
Unit 4 editing and coding (2)
 
RESPONSE SURFACE METHODOLOGY.pptx
RESPONSE SURFACE METHODOLOGY.pptxRESPONSE SURFACE METHODOLOGY.pptx
RESPONSE SURFACE METHODOLOGY.pptx
 
Survey
SurveySurvey
Survey
 
Data Collection Methods.pptx
Data Collection Methods.pptxData Collection Methods.pptx
Data Collection Methods.pptx
 
Introduction to Data Analysis for Nurse Researchers
Introduction to Data Analysis for Nurse ResearchersIntroduction to Data Analysis for Nurse Researchers
Introduction to Data Analysis for Nurse Researchers
 
Review presentation for Orientation 2014
Review presentation for Orientation 2014Review presentation for Orientation 2014
Review presentation for Orientation 2014
 
Data collection instruments (2)
Data collection instruments (2)Data collection instruments (2)
Data collection instruments (2)
 
Data Collection Instruments.
Data Collection Instruments.Data Collection Instruments.
Data Collection Instruments.
 

Recently uploaded

Chatty Kathy - UNC Bootcamp Final Project Presentation - Final Version - 5.23...
Chatty Kathy - UNC Bootcamp Final Project Presentation - Final Version - 5.23...Chatty Kathy - UNC Bootcamp Final Project Presentation - Final Version - 5.23...
Chatty Kathy - UNC Bootcamp Final Project Presentation - Final Version - 5.23...
John Andrews
 
Opendatabay - Open Data Marketplace.pptx
Opendatabay - Open Data Marketplace.pptxOpendatabay - Open Data Marketplace.pptx
Opendatabay - Open Data Marketplace.pptx
Opendatabay
 
一比一原版(IIT毕业证)伊利诺伊理工大学毕业证成绩单
一比一原版(IIT毕业证)伊利诺伊理工大学毕业证成绩单一比一原版(IIT毕业证)伊利诺伊理工大学毕业证成绩单
一比一原版(IIT毕业证)伊利诺伊理工大学毕业证成绩单
ewymefz
 
一比一原版(UniSA毕业证书)南澳大学毕业证如何办理
一比一原版(UniSA毕业证书)南澳大学毕业证如何办理一比一原版(UniSA毕业证书)南澳大学毕业证如何办理
一比一原版(UniSA毕业证书)南澳大学毕业证如何办理
slg6lamcq
 
一比一原版(UVic毕业证)维多利亚大学毕业证成绩单
一比一原版(UVic毕业证)维多利亚大学毕业证成绩单一比一原版(UVic毕业证)维多利亚大学毕业证成绩单
一比一原版(UVic毕业证)维多利亚大学毕业证成绩单
ukgaet
 
一比一原版(Deakin毕业证书)迪肯大学毕业证如何办理
一比一原版(Deakin毕业证书)迪肯大学毕业证如何办理一比一原版(Deakin毕业证书)迪肯大学毕业证如何办理
一比一原版(Deakin毕业证书)迪肯大学毕业证如何办理
oz8q3jxlp
 
一比一原版(UIUC毕业证)伊利诺伊大学|厄巴纳-香槟分校毕业证如何办理
一比一原版(UIUC毕业证)伊利诺伊大学|厄巴纳-香槟分校毕业证如何办理一比一原版(UIUC毕业证)伊利诺伊大学|厄巴纳-香槟分校毕业证如何办理
一比一原版(UIUC毕业证)伊利诺伊大学|厄巴纳-香槟分校毕业证如何办理
ahzuo
 
一比一原版(UofS毕业证书)萨省大学毕业证如何办理
一比一原版(UofS毕业证书)萨省大学毕业证如何办理一比一原版(UofS毕业证书)萨省大学毕业证如何办理
一比一原版(UofS毕业证书)萨省大学毕业证如何办理
v3tuleee
 
Sample_Global Non-invasive Prenatal Testing (NIPT) Market, 2019-2030.pdf
Sample_Global Non-invasive Prenatal Testing (NIPT) Market, 2019-2030.pdfSample_Global Non-invasive Prenatal Testing (NIPT) Market, 2019-2030.pdf
Sample_Global Non-invasive Prenatal Testing (NIPT) Market, 2019-2030.pdf
Linda486226
 
原版制作(Deakin毕业证书)迪肯大学毕业证学位证一模一样
原版制作(Deakin毕业证书)迪肯大学毕业证学位证一模一样原版制作(Deakin毕业证书)迪肯大学毕业证学位证一模一样
原版制作(Deakin毕业证书)迪肯大学毕业证学位证一模一样
u86oixdj
 
Data_and_Analytics_Essentials_Architect_an_Analytics_Platform.pptx
Data_and_Analytics_Essentials_Architect_an_Analytics_Platform.pptxData_and_Analytics_Essentials_Architect_an_Analytics_Platform.pptx
Data_and_Analytics_Essentials_Architect_an_Analytics_Platform.pptx
AnirbanRoy608946
 
Criminal IP - Threat Hunting Webinar.pdf
Criminal IP - Threat Hunting Webinar.pdfCriminal IP - Threat Hunting Webinar.pdf
Criminal IP - Threat Hunting Webinar.pdf
Criminal IP
 
一比一原版(NYU毕业证)纽约大学毕业证成绩单
一比一原版(NYU毕业证)纽约大学毕业证成绩单一比一原版(NYU毕业证)纽约大学毕业证成绩单
一比一原版(NYU毕业证)纽约大学毕业证成绩单
ewymefz
 
一比一原版(RUG毕业证)格罗宁根大学毕业证成绩单
一比一原版(RUG毕业证)格罗宁根大学毕业证成绩单一比一原版(RUG毕业证)格罗宁根大学毕业证成绩单
一比一原版(RUG毕业证)格罗宁根大学毕业证成绩单
vcaxypu
 
【社内勉強会資料_Octo: An Open-Source Generalist Robot Policy】
【社内勉強会資料_Octo: An Open-Source Generalist Robot Policy】【社内勉強会資料_Octo: An Open-Source Generalist Robot Policy】
【社内勉強会資料_Octo: An Open-Source Generalist Robot Policy】
NABLAS株式会社
 
一比一原版(TWU毕业证)西三一大学毕业证成绩单
一比一原版(TWU毕业证)西三一大学毕业证成绩单一比一原版(TWU毕业证)西三一大学毕业证成绩单
一比一原版(TWU毕业证)西三一大学毕业证成绩单
ocavb
 
一比一原版(UofM毕业证)明尼苏达大学毕业证成绩单
一比一原版(UofM毕业证)明尼苏达大学毕业证成绩单一比一原版(UofM毕业证)明尼苏达大学毕业证成绩单
一比一原版(UofM毕业证)明尼苏达大学毕业证成绩单
ewymefz
 
Best best suvichar in gujarati english meaning of this sentence as Silk road ...
Best best suvichar in gujarati english meaning of this sentence as Silk road ...Best best suvichar in gujarati english meaning of this sentence as Silk road ...
Best best suvichar in gujarati english meaning of this sentence as Silk road ...
AbhimanyuSinha9
 
My burning issue is homelessness K.C.M.O.
My burning issue is homelessness K.C.M.O.My burning issue is homelessness K.C.M.O.
My burning issue is homelessness K.C.M.O.
rwarrenll
 
06-04-2024 - NYC Tech Week - Discussion on Vector Databases, Unstructured Dat...
06-04-2024 - NYC Tech Week - Discussion on Vector Databases, Unstructured Dat...06-04-2024 - NYC Tech Week - Discussion on Vector Databases, Unstructured Dat...
06-04-2024 - NYC Tech Week - Discussion on Vector Databases, Unstructured Dat...
Timothy Spann
 

Recently uploaded (20)

Chatty Kathy - UNC Bootcamp Final Project Presentation - Final Version - 5.23...
Chatty Kathy - UNC Bootcamp Final Project Presentation - Final Version - 5.23...Chatty Kathy - UNC Bootcamp Final Project Presentation - Final Version - 5.23...
Chatty Kathy - UNC Bootcamp Final Project Presentation - Final Version - 5.23...
 
Opendatabay - Open Data Marketplace.pptx
Opendatabay - Open Data Marketplace.pptxOpendatabay - Open Data Marketplace.pptx
Opendatabay - Open Data Marketplace.pptx
 
一比一原版(IIT毕业证)伊利诺伊理工大学毕业证成绩单
一比一原版(IIT毕业证)伊利诺伊理工大学毕业证成绩单一比一原版(IIT毕业证)伊利诺伊理工大学毕业证成绩单
一比一原版(IIT毕业证)伊利诺伊理工大学毕业证成绩单
 
一比一原版(UniSA毕业证书)南澳大学毕业证如何办理
一比一原版(UniSA毕业证书)南澳大学毕业证如何办理一比一原版(UniSA毕业证书)南澳大学毕业证如何办理
一比一原版(UniSA毕业证书)南澳大学毕业证如何办理
 
一比一原版(UVic毕业证)维多利亚大学毕业证成绩单
一比一原版(UVic毕业证)维多利亚大学毕业证成绩单一比一原版(UVic毕业证)维多利亚大学毕业证成绩单
一比一原版(UVic毕业证)维多利亚大学毕业证成绩单
 
一比一原版(Deakin毕业证书)迪肯大学毕业证如何办理
一比一原版(Deakin毕业证书)迪肯大学毕业证如何办理一比一原版(Deakin毕业证书)迪肯大学毕业证如何办理
一比一原版(Deakin毕业证书)迪肯大学毕业证如何办理
 
一比一原版(UIUC毕业证)伊利诺伊大学|厄巴纳-香槟分校毕业证如何办理
一比一原版(UIUC毕业证)伊利诺伊大学|厄巴纳-香槟分校毕业证如何办理一比一原版(UIUC毕业证)伊利诺伊大学|厄巴纳-香槟分校毕业证如何办理
一比一原版(UIUC毕业证)伊利诺伊大学|厄巴纳-香槟分校毕业证如何办理
 
一比一原版(UofS毕业证书)萨省大学毕业证如何办理
一比一原版(UofS毕业证书)萨省大学毕业证如何办理一比一原版(UofS毕业证书)萨省大学毕业证如何办理
一比一原版(UofS毕业证书)萨省大学毕业证如何办理
 
Sample_Global Non-invasive Prenatal Testing (NIPT) Market, 2019-2030.pdf
Sample_Global Non-invasive Prenatal Testing (NIPT) Market, 2019-2030.pdfSample_Global Non-invasive Prenatal Testing (NIPT) Market, 2019-2030.pdf
Sample_Global Non-invasive Prenatal Testing (NIPT) Market, 2019-2030.pdf
 
原版制作(Deakin毕业证书)迪肯大学毕业证学位证一模一样
原版制作(Deakin毕业证书)迪肯大学毕业证学位证一模一样原版制作(Deakin毕业证书)迪肯大学毕业证学位证一模一样
原版制作(Deakin毕业证书)迪肯大学毕业证学位证一模一样
 
Data_and_Analytics_Essentials_Architect_an_Analytics_Platform.pptx
Data_and_Analytics_Essentials_Architect_an_Analytics_Platform.pptxData_and_Analytics_Essentials_Architect_an_Analytics_Platform.pptx
Data_and_Analytics_Essentials_Architect_an_Analytics_Platform.pptx
 
Criminal IP - Threat Hunting Webinar.pdf
Criminal IP - Threat Hunting Webinar.pdfCriminal IP - Threat Hunting Webinar.pdf
Criminal IP - Threat Hunting Webinar.pdf
 
一比一原版(NYU毕业证)纽约大学毕业证成绩单
一比一原版(NYU毕业证)纽约大学毕业证成绩单一比一原版(NYU毕业证)纽约大学毕业证成绩单
一比一原版(NYU毕业证)纽约大学毕业证成绩单
 
一比一原版(RUG毕业证)格罗宁根大学毕业证成绩单
一比一原版(RUG毕业证)格罗宁根大学毕业证成绩单一比一原版(RUG毕业证)格罗宁根大学毕业证成绩单
一比一原版(RUG毕业证)格罗宁根大学毕业证成绩单
 
【社内勉強会資料_Octo: An Open-Source Generalist Robot Policy】
【社内勉強会資料_Octo: An Open-Source Generalist Robot Policy】【社内勉強会資料_Octo: An Open-Source Generalist Robot Policy】
【社内勉強会資料_Octo: An Open-Source Generalist Robot Policy】
 
一比一原版(TWU毕业证)西三一大学毕业证成绩单
一比一原版(TWU毕业证)西三一大学毕业证成绩单一比一原版(TWU毕业证)西三一大学毕业证成绩单
一比一原版(TWU毕业证)西三一大学毕业证成绩单
 
一比一原版(UofM毕业证)明尼苏达大学毕业证成绩单
一比一原版(UofM毕业证)明尼苏达大学毕业证成绩单一比一原版(UofM毕业证)明尼苏达大学毕业证成绩单
一比一原版(UofM毕业证)明尼苏达大学毕业证成绩单
 
Best best suvichar in gujarati english meaning of this sentence as Silk road ...
Best best suvichar in gujarati english meaning of this sentence as Silk road ...Best best suvichar in gujarati english meaning of this sentence as Silk road ...
Best best suvichar in gujarati english meaning of this sentence as Silk road ...
 
My burning issue is homelessness K.C.M.O.
My burning issue is homelessness K.C.M.O.My burning issue is homelessness K.C.M.O.
My burning issue is homelessness K.C.M.O.
 
06-04-2024 - NYC Tech Week - Discussion on Vector Databases, Unstructured Dat...
06-04-2024 - NYC Tech Week - Discussion on Vector Databases, Unstructured Dat...06-04-2024 - NYC Tech Week - Discussion on Vector Databases, Unstructured Dat...
06-04-2024 - NYC Tech Week - Discussion on Vector Databases, Unstructured Dat...
 

STATISTICAL METHODS IN GEOGRAPHY

  • 1. STATISTICAL METHODS IN GEOGRAPHY Dr. Manoj Kumar Meher Kalahandi University meher.manoj@gmail.com
  • 2. Data • Data are characteristics or information, usually numerical, that are collected through observation. In a more technical sense, data is a set of values of qualitative or quantitative variables about one or more persons or objects. • data are individual pieces of factual information recorded and used for the purpose of analysis. It is the raw information from which statistics are created. Statistics are the results of data analysis - its interpretation and presentation. • Geographical data are related to a location on the Earth and can often be presented as maps. Other names for geographical data are geodata, geospatial data or GIS data.
  • 3. Components of Geographic Data • Location • Time • Attributes (characteristics) Longitude Latitude Altitude
  • 4. Characteristics of Geographic Data • 1. Geographic data varies spatially: • 2. Geographic data represents attributes of features: eg Name, year etc • 3. Temporal variation: • 4. Data sets can be discrete or continuous: Geographic space is continuous however, the geographic data which is represented in GIS can be discrete or continuous. A data set is called discrete, if no observations are possible to make between two observations at given point of time. • 5. Projected data of large areas may have distortions: Map projection and shape of the earth • 6. Spatial Auto correlation: GIS method for better use
  • 6. Classification by scaling & dimension After Rabinson
  • 7. Types of geographic data • Two kinds of data are usually associated with geographic features: spatial and non- spatial data. • Spatial data refers to the shape, size and location of the feature. • Non- spatial data refers to other attributes associated with the feature such as name, length, area, volume, population, soil type, etc .
  • 8. • Vector data is best described as graphical representations of the real world. There are three main types of vector data: points, lines, and polygons. Connecting points create lines, and connecting lines that create an enclosed area create polygons. Vectors are best used to present generalizations of objects or features on the Earth’s surface. • Raster data is data that is presented in a grid of pixels. Each pixel within a raster has a value, whether it be a colour or unit of measurement, to communicate information about the element in question. Rasters typically refer to image or photo. • Attributes: Spatial data contains more information than just a location on the surface of the Earth. Any additional information, or non-spatial data, that describes a feature is referred to as an attribute. Spatial data can have any amount of additional attributes accompanying information about the location. For example, you might have a map displaying buildings within a city’s downtown region. Each of the buildings, in addition to their location, may have additional attributes such as the type of use (housing, business, government, etc.), the year it was built, and how many stories it has.
  • 9. Nature of geographic data • Geographical Phenomena • Spatial autocorrelation and space • Spatial Sampling • Spatial interpolation • Uncertainty of geographical data
  • 10. Geographical Phenomena • The First Law of Geography, formulated by Waldo Tobler, states that everything • is related to everything else, but near things are more related than distant things.
  • 11. Spatial Autocorrelation • Spatial autocorrelation is the formal property that measures the degree to which • near and distant things are related. • Positive spatial autocorrelation occurs when features that are similar in location • are also similar in attributes. Negative spatial autocorrelation occurs when • features that are close together in space are dissimilar in attributes. Zero • autocorrelation occurs when attributes are independent of location.
  • 12. Spatial Sampling • The quest to represent the complex real world requires us to abstract, or sample, events and occurrences. For many purposes, geographic data are only as good as the sampling scheme used to create them. • You can think of sampling as the process of selecting points from a continuous field or, if the field has been digitized as a mosaic of objects, of selecting some of these objects while discarding others. • Classical statistics often emphasizes the importance of randomness in sound sample design. The purest form, simple random sampling, is well known: each element is assigned a unique number, and a specified number of elements are selected using a random number generator. In the case of a spatial sample from continuous space, x,y coordinates might be randomly sampled within the range of x and y values. Because each randomly selected element has a known probability of selection, it is possible to make robust and defensible generalizations to the population from which the sample was drawn.
  • 13. Spatial Interpolation • Spatial interpolation is the process of filling in the gaps between sample observations. It requires an understanding of the attenuating effect of distance between sample observations and selection of an appropriate interpolation function. This concept focuses on principles that are used to describe effects over distance.
  • 14. Uncertainty of geographical data • The length of coast line problem • Uncertainty in the conception of geographical phenomena • Uncertainty in the measurement & representation of geographical phenomena • Uncertainty in the analysis of geographical phenomena
  • 15. Methods of data collection There are two methods of collecting data. 1. Quantitative Data Collection 2. Qualitative Data Collection
  • 16. • Quantitative data collection methods rely on random sampling and structured data collection instruments, that fit diverse experiences, into predetermined response categories. They produce results that are easy to summarize, compare, and generalize. • Qualitative data collection methods are exploratory in nature and are mainly concerned with gaining insights and understanding on underlying reasons and motivations. Qualitative methods are often regarded as providing rich data about real life people and situations and being more able to make sense of behaviour and to understand behaviour within its wider context. However, qualitative research is often criticised for lacking generalizability, being too reliant on the subjective interpretations of researchers and being incapable of replication by subsequent researchers.
  • 17. Followings are the few methods of collecting information (Non-Spatial Data) • Questionnaires • Interviews • Direct observations • Documents and other materials • Focus group interviews • Case-studies • Diaries • Critical incidents • Portfolios
  • 18. Questionnaires This was the main data collection method used in this research. Questionnaires are a popular means of collecting data. But the designing is difficult because it often requires many re-writes before finalization. The most important issue related to data collection is choosing the most appropriate information or evidence to answer the author’s questions. To plan data collection the author had to think about the questions to be answered and information sources available. Also it had to think how these data could be organized, interpreted and then reported to various audiences before finalizing the questionnaires. advantages of questionnaires. • Can be used as a method in its own right or as a basis for interviewing • or a telephone survey • Can be posted, e-mailed or faxed • Can cover the large number of people and organization • Wide geographical coverage • Relatively cheap • No prior arrangements are needed • Avoid embarrassment on the part of the respondent • No interviewer bias • Possible anonymity of respondent disadvantages • of questionnaires. They are, designing problem, question have to be relatively • simple, time delay whilst waiting for responses to be returned, assume no literacy • problems, no control over who completes it, and problems with incomplete • questionnaires. The targeted group of people had to be selected carefully to avoid • such disadvantages.
  • 19. Interviews Interviewing is a great way to learn detailed information from a single individual or small number of individuals. This is a main data collection method used in the research. It is very useful when someone wants to gain expert opinions on the subject or talk to someone knowledgeable about a topic. • Type of Interviews • 1.Face to face Interview, 2. Phone Interview, 3. Email Interviews, 4. Chat/Messaging Interviews When conducting interviews the author adhered to the following rules. • • Carefully selected the questions asked. • • Started interview with some small talks • • Brought extra recording device (another video recorder) • • Author paid more attention while the interviews were going on • • Came to the interview prepared • • Did not pester or push the officer. The author was interviewing and if he/she did not talk about an issue, author respected and did not push them • At the interview time author was rigid with his questions • • Did not allow the officer to get off the topic and asked follow up questions to redirect the conversation to the subject.
  • 20. Direct observations • Author was able to make direct observations when the EPF offices, in various stations were visited. Certain participants were quite helpful in providing an in- depth understanding to the author by arranging visits to their offices. This allowed the author to gather certain information of how the systems behave in the real office environment.
  • 21. Documents and other materials • The author was able to collect some important data from various offices as a secondary data collection mechanism. These data were gathered from various forms, internal circulars, memos and departmental instructions of various offices visited by the author.
  • 22. Focus group interviews • A focus group discussion involves gathering people from similar. backgrounds or experiences together to discuss a specific topic of. interest. It is a form of qualitative research where questions are. asked about their perceptions attitudes, beliefs, opinion or ideas. • Write down your goals. Before you can start gathering participants, it's important to understand why you're organising the focus group. • 1. Define your target audience. 2. Find a venue. 3. Recruit participants. 4. Design the questions. 5. Moderate the group. 6. Analyse. • Write down your goals. Before you can start gathering participants, it's important to understand why you're organising the focus group.
  • 23. Case-studies • “The case study method of data collection is a technique by which individual factor whether it be an institution or just an episode in the life of an individual or a group is analysed in its relationship to any other in the group.” Thus, a fairly exhaustive study of a person (as to what he does and has done, what he thinks he does and had done and what he expects to do and says he ought to do) or group is called a life or case history. Burgess has used the words “the social microscope” for the case study method.”
  • 24. Diaries • A diary study is a research method used to collect qualitative data about user behaviors, activities, and experiences over time. In a diary study, data is self-reported by participants longitudinally — that is, over an extended period of time that can range from a few days to even a month or longer.
  • 25. Critical incidents • The critical incident technique (CIT) is a research method in which the research participant is asked to recall and describe a time when a behavior, action, or occurrence impacted (either positively or negatively) a specified outcome (for example, the accomplishment of a given task)
  • 26. Portfolios Portfolio is an assessment method that monitors the growth and development. Unlike most assessments, portfolio assessment can contain many different forms of assessments as it is a collection different individuals . A portfolio assessment is sometimes followed by an oral assessment.
  • 27. Methods of collecting information (Spatial Data) Surveying: the science of accurate measurement of natural and human made features on the Earth. Data collected by surveyors are then used to create highly precise maps. Surveyors calculate the precise position of points, distances and angles through geometry. Remote Sensing: Remote sensing is the practice of deriving information about the earth’s land and water surface using images acquired from an overhead perspective, using electromagnetic radiation in one or more regions of the electromagnetic spectrum, reflected or emitted from the earth’s surface.
  • 28. Surveying • Chain surveying • Plane Table surveying • Prismatic Compass surveying • Theodolite surveying • Global Positioning System (GPS) Surveying • Differential Global Positioning System (DGPS) Surveying • Total Station Surveying
  • 29. Chain Plane Table Compass Theodolite GPS DGPS Total Station
  • 31. Geographical Data Matrix • Data Matrix is the tabular format representation of cases and variables of your statistical study. Each row of a data matrix represents a case and each column represent a variable. A complete Data Matrix may contain thousands or lakhs or even more cases. Temperature (°C) Ice cream Sales Sales in Hot drinks 20 1500 10000 25 2500 8500 30 4000 7000 35 6000 5000 40 8500 3500 Case Variable
  • 32. Variable • This is defined as “A quantity or attribute, which varies from one member of the population being studied to another.” There are two types of variables and they are called Qualitative and Quantitative variables. Qualitative variables describe the attributes such as eye color and skin complexion. Population • Population is defined as “The total collection of objects, people or data, which statistical inferences are drawn,” e.g., all the patients who suffer from COVID-19 in a country. Populations can be finite or infinite. Example of an infinite population would be “All the people who will suffer from COVID-19 in the future.” Sample • It is usually not possible to get a practical value for the given variable in a large or infinite population. A sample in statistics means the values of the variables for members of a part or subset of the population. However, the sample must represent the population in respect to the variables being studied.
  • 35.
  • 38. Variable Types • Numeric: Numeric variables have values that are numbers- 2298 • Comma: Numeric variables that include commas that delimit every three places (to the left of the decimals) and use a period to delimit decimals- 30,000.50 (Thirty-thousand and one half) • Dot: Numeric variables that include periods that delimit every three places and use a comma to delimit decimals.- 30.000,50 (Thirty-thousand and one half) • Scientific notation: Numeric variables whose values are displayed with an E and power-of-ten exponent. Exponents can be preceded by either an E or a D, with or without a sign, or only with a sign (no E or D).- 1.23E2, 1.23D2 • Date: Numeric variables that are displayed in any standard calendar date or clock-time formats. Standard formats may include commas, blank spaces, hyphens, periods, or slashes as space delimiters.- Dates: 01/31/2013, 31.01.2013 • Dollar: Currency value- $33,000, ₹ 55,550 • Strings: which are also called alphanumeric variables or character variables -- have values that are treated as text. This means that the values of string variables may include numbers, letters, or symbols. • Restricted Numeric (integer with leading zeros): Numeric variables whose values are restricted to non-negative integers (in standard format or scientific notation). The values are displayed with leading zeroes padded to the maximum width of the variable.- 0000123456 (width 10) • Coordinate: In Geodatabase coordinate are stored in Comma format- 82.25, 17.35
  • 39. Significance of Statistical Methods in Geography • Make generalizations related to complex spatial patterns. • Infer the characteristics of a larger set of geographic data or population by using samples of geographic data. • Describe and summarize spatial data. • Estimate the outcome of an event at a particular location. • Find out whether an actual spatial pattern matches some expected pattern. • Determine if the frequency or magnitude of some phenomenon varies from one location to another.
  • 40. Sources of Data Primary data collected by observation, focus group, survey etc. Secondary Data in the form of records left by people of their activities Secondary data collected with a particular research design Secondary literature which critically analyses data Tertiary sources which can locate secondary sources and data sets Primary Sources Secondary Sources Tertiary Sources
  • 41. • Primary data: Information obtain first hand by the researcher on the variable of interest for the specific purpose of the study. Example: Survey, focus group discussion, personal interview etc..) • Secondary data: Information gathered from sources already existing. Example: Governments publication, company records, web sites, media etc…
  • 42. Spatial Data Sources (Secondary) • Maps (survey of India, Geological survey of India, National Thematic Mapping Organisation etc..) • Drawings (sketch or engineering) • Aerial photograph • Satellite imagery • CAD data based • Government & commercial spatial (GIS) data bases • Paper records and documents
  • 43. GIS data for India Name Description Geo-Platform of ISRO Bhuvan - an Indian Geo-platform of ISRO by National Remote Sensing Centre (NRSC). Open Data Archive Bhuvan - GIS - Open Data Archive from NRSC. List of Data Sources: https://en.wikipedia.org/wiki/List_of_GIS_data_sources#Global
  • 44. Non- spatial data Sources (Secondary) • Census of India (population, animal, tiger, bird etc…) • National Sample Survey Organisation (NSSO) • Statistical Abstract • Government & commercial attributes (GIS) data bases • Periodical books & Journals • University Research Organisations • Annual Reports • Diaries • News Media (prints & electronic)