Dr. Khoe YaoTung, MSc.Ed, M.Ed.
Sampling • A sample provides a set of data values
of a random variable, drawn from all
such possible values, the parent
population. (subgroup obtained from
population)
• Sampling frame is the representation
of the items available to be sampled.
• Sampling fraction is the proportion
of the available items that are actually
sampled.
• A parent population, often just called
the population, is described in term of
its parameters, such as its mean,
and variance .
• A value derived from a sample is
written in Roman letters: mean and
variance,
3.
Consideration to take
sample
Arethe data relevant?
Not just take data which easily obtained
Are the data likely to biased?
Bias is systematic error, to estimate the
mean time of young women running 100
meter, and did so by timing member of a
hockey team, result would be biased.
Does the method of collection distorts
the data?
Question inviting, the question yes
Is the right person collecting the data?
Is the sample large enough?
Is the sampling procedure appropriate in
the circumstances
Selected names from the telephone
directory will exclude those who do not
have telephone.
Dr. Khoe Yao Tung, MSc.Ed, M.Ed.
4.
PROBABILITY / RANDOMSAMPLING
In probability sampling each member of the universe has a known chance
of being selected for the sample. The main probability sampling methods
are the following
1. Simple Random Sampling
It is of two types:
Lottery Method
The elements or the items of the universe numbered or written on
separate slips and then it is drawn till we get the required sample size.
Random NumberTable
Here each member of the population is assigned a number and from
some random point of the table of random numbers the random
numbers are read out and items are selected till we get enough needed
sample size.
5.
Dr. Khoe YaoTung, MSc.Ed, M.Ed.
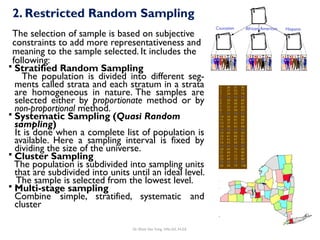
2. Restricted Random Sampling
The selection of sample is based on subjective
constraints to add more representativeness and
meaning to the sample selected. It includes the
following:
Stratified Random Sampling
The population is divided into different seg-
ments called strata and each stratum in a strata
are homogeneous in nature. The samples are
selected either by proportionate method or by
non-proportional method.
Systematic Sampling (Quasi Random
sampling)
It is done when a complete list of population is
available. Here a sampling interval is fixed by
dividing the size of the universe.
Cluster Sampling
The population is subdivided into sampling units
that are subdivided into units until an ideal level.
The sample is selected from the lowest level.
Multi-stage sampling
Combine simple, stratified, systematic and
cluster
6.
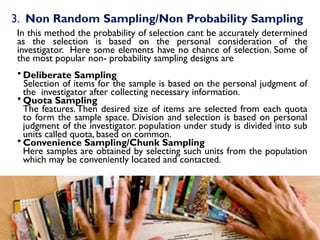
3. Non RandomSampling/Non Probability Sampling
In this method the probability of selection cant be accurately determined
as the selection is based on the personal consideration of the
investigator. Here some elements have no chance of selection. Some of
the most popular non- probability sampling designs are
Deliberate Sampling
Selection of items for the sample is based on the personal judgment of
the investigator after collecting necessary information.
Quota Sampling
The features.Then desired size of items are selected from each quota
to form the sample space. Division and selection is based on personal
judgment of the investigator. population under study is divided into sub
units called quota, based on common.
Convenience Sampling/Chunk Sampling
Here samples are obtained by selecting such units from the population
which may be conveniently located and contacted.
7.
Estimates
When sample statisticsare used to estimate the parent population
parameter they are called estimates.
There are essentially two reasons why you might wish to take a
sample:
• To estimate the value of the parameter of the parent population
• To conduct a hypothesis test
An estimates of a parameter derived from sample data will in
general differ from its true value.The difference is called the
sampling error.
Sampling is use to gather data about the population in order to
make an inference (estimate) that can be generalized to the
population.
Dr. Khoe Yao Tung, MSc.Ed, M.Ed.
8.
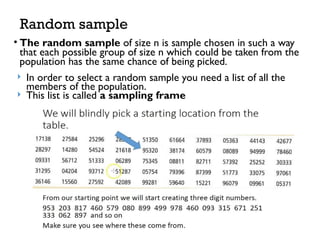
Random sample
• Therandom sample of size n is sample chosen in such a way
that each possible group of size n which could be taken from the
population has the same chance of being picked.
In order to select a random sample you need a list of all the
members of the population.
This list is called a sampling frame
9.
Dr. Khoe YaoTung, MSc.Ed, M.Ed.
Central Limit Theorem (CLT)
The Central Limit Theorem
describes the relationship between
the sampling distribution of sample
means and the population that the
samples are taken from.
• Fact:
If the population is normally
distributed, then the sampling
distribution of x is normally
distributed for any sample size n.
“The beauty of the theorem thus lies in its
simplicity.”
10.
Central Limit Theorem(CLT)
1. The Distribution of Sample Means
Approaches a Normal Distribution: If we
take a large number of random samples
from any population, regardless of the
original distribution of the population.This
applies as long as the sample size is large
enough (usually n ≥ 30).
2. Population Mean:The mean of the sample
means distribution will be equal to the
mean of the original population ( ).This
μ
means that the sample means tend to be a
good estimate of the population mean.
Dr. Khoe Yao Tung, MSc.Ed, M.Ed.
11.
Central Limit Theorem(CLT)
3. Population and SampleVariance:The
variance of the distribution of sample
means is the population variance
divided by the sample size ( ²/n
σ ).This
means that as the sample size
increases, the variance of the sample
means decreases, and the results get
closer to the true value of the
population mean.
4. The Normal Distribution Becomes
Clearer with Larger Sample Sizes:The
larger the sample size (n), the closer
the distribution of sample means gets
to a normal distribution. In this case,
"large" generally means a sample size
of around 30 or more, but for heavily
skewed distributions, a larger sample
size may be required.
Dr. Khoe Yao Tung, MSc.Ed, M.Ed.
12.
Dr. Khoe YaoTung, MSc.Ed, M.Ed.
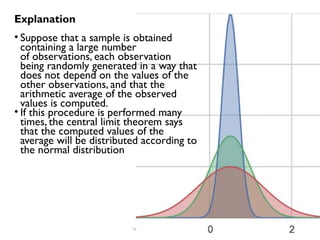
Explanation
• Suppose that a sample is obtained
containing a large number
of observations, each observation
being randomly generated in a way that
does not depend on the values of the
other observations, and that the
arithmetic average of the observed
values is computed.
• If this procedure is performed many
times, the central limit theorem says
that the computed values of the
average will be distributed according to
the normal distribution
13.
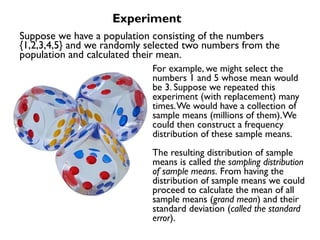
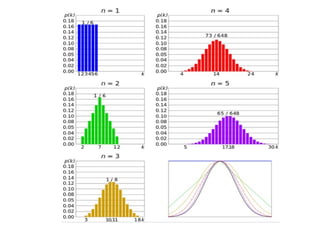
For example, wemight select the
numbers 1 and 5 whose mean would
be 3. Suppose we repeated this
experiment (with replacement) many
times.We would have a collection of
sample means (millions of them).We
could then construct a frequency
distribution of these sample means.
The resulting distribution of sample
means is called the sampling distribution
of sample means. From having the
distribution of sample means we could
proceed to calculate the mean of all
sample means (grand mean) and their
standard deviation (called the standard
error).
Experiment
Suppose we have a population consisting of the numbers
{1,2,3,4,5} and we randomly selected two numbers from the
population and calculated their mean.
14.
Dr. Khoe YaoTung, MSc.Ed, M.Ed.
The Central Limit Theorem predicts
that regardless of the distribution of
the parent population:
1.The mean of the sample population of
means is always equal to the mean of
the parent population from which the
population samples were drawn.
2. The standard deviation (standard
error) of the sample population of
means is always equal to the standard
deviation of the parent population
divided by the square root of the
sample size (n).
15.
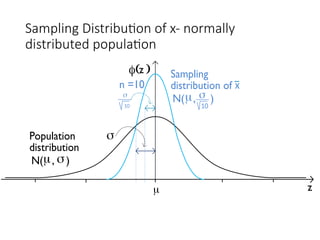
Sampling Distribution ofx- normally
distributed population
m
f( )
z
z
Population
distribution
N( , )
m s
Sampling
distribution of
N( , )
m s
10
x
n =10
s
10
s
16.
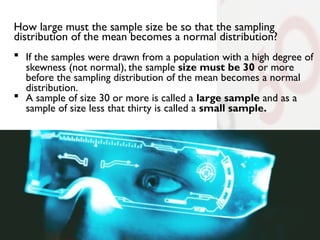
How large mustthe sample size be so that the sampling
distribution of the mean becomes a normal distribution?
If the samples were drawn from a population with a high degree of
skewness (not normal), the sample size must be 30 or more
before the sampling distribution of the mean becomes a normal
distribution.
A sample of size 30 or more is called a large sample and as a
sample of size less that thirty is called a small sample.
18.
Dr. Khoe YaoTung, MSc.Ed, M.Ed.
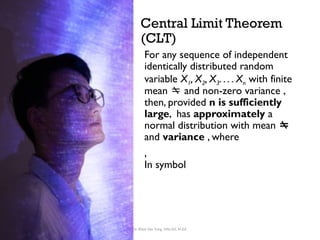
Central Limit Theorem
(CLT)
For any sequence of independent
identically distributed random
variable X1, X2, X3. . . . Xn with finite
mean and non-zero variance ,
then, provided n is sufficiently
large, has approximately a
normal distribution with mean
and variance , where
,
In symbol
19.
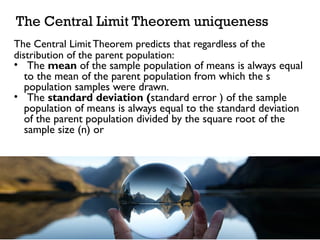
The Central LimitTheorem predicts that regardless of the
distribution of the parent population:
• The mean of the sample population of means is always equal
to the mean of the parent population from which the s
population samples were drawn.
• The standard deviation (standard error ) of the sample
population of means is always equal to the standard deviation
of the parent population divided by the square root of the
sample size (n) or
The Central Limit Theorem uniqueness
20.
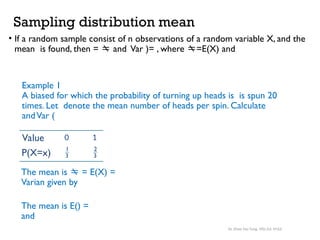
Sampling distribution mean
•If a random sample consist of n observations of a random variable X, and the
mean is found, then = and Var )= , where =E(X) and
Example 1
A biased for which the probability of turning up heads is is spun 20
times. Let denote the mean number of heads per spin. Calculate
andVar (
Value
P(X=x) 1
3
2
3
0 1
The mean is = E(X) =
Varian given by
The mean is E() =
and
Dr. Khoe Yao Tung, MSc.Ed, M.Ed.
21.
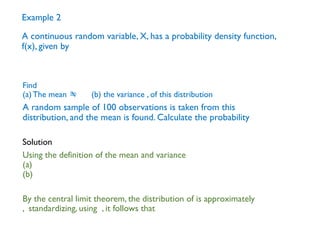
Example 2
A continuousrandom variable, X, has a probability density function,
f(x), given by
A random sample of 100 observations is taken from this
distribution, and the mean is found. Calculate the probability
Find
(a)The mean (b) the variance , of this distribution
Using the definition of the mean and variance
(a)
(b)
By the central limit theorem, the distribution of is approximately
, standardizing, using , it follows that
Solution
22.
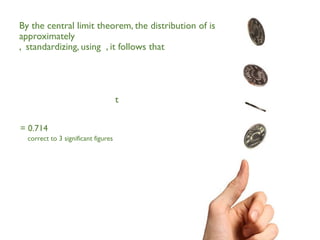
By the centrallimit theorem, the distribution of is
approximately
, standardizing, using , it follows that
t
= 0.714
correct to 3 significant figures
23.
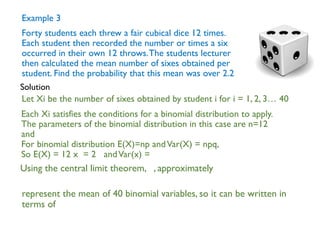
Example 3
Forty studentseach threw a fair cubical dice 12 times.
Each student then recorded the number or times a six
occurred in their own 12 throws.The students lecturer
then calculated the mean number of sixes obtained per
student. Find the probability that this mean was over 2.2
Each Xi satisfies the conditions for a binomial distribution to apply.
The parameters of the binomial distribution in this case are n=12
and
For binomial distribution E(X)=np andVar(X) = npq,
So E(X) = 12 x = 2 andVar(x) =
Let Xi be the number of sixes obtained by student i for i = 1, 2, 3… 40
Solution
represent the mean of 40 binomial variables, so it can be written in
terms of
Using the central limit theorem, , approximately
24.
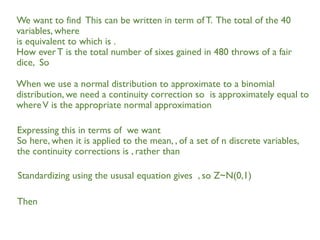
We want tofind This can be written in term ofT. The total of the 40
variables, where
is equivalent to which is .
How everT is the total number of sixes gained in 480 throws of a fair
dice, So
When we use a normal distribution to approximate to a binomial
distribution, we need a continuity correction so is approximately equal to
whereV is the appropriate normal approximation
Expressing this in terms of we want
So here, when it is applied to the mean, , of a set of n discrete variables,
the continuity corrections is , rather than
Standardizing using the ususal equation gives , so Z~N(0,1)
Then
25.
Dr. Khoe YaoTung, MSc.Ed, M.Ed.
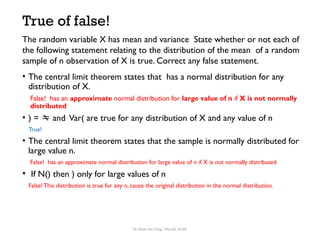
True of false!
• The central limit theorem states that has a normal distribution for any
distribution of X.
False! has an approximate normal distribution for large value of n if X is not normally
distributed
• ) = and Var( are true for any distribution of X and any value of n
True!
• The central limit theorem states that the sample is normally distributed for
large value n.
False! has an approximate normal distribution for large value of n if X is not normally distributed
• If N() then ) only for large values of n
False! This distribution is true for any n, cause the original distribution in the normal distribution.
The random variable X has mean and variance State whether or not each of
the following statement relating to the distribution of the mean of a random
sample of n observation of X is true. Correct any false statement.
26.
Dr. Khoe YaoTung, MSc.Ed, M.Ed.
Who is discovered t student distribution
• William Sealy Gosset (1876–1937) Gosset was known by his pen
name ‘Student’. Because he was prohibited by his employer — the
Guinness brewery — from using his real name, Gosset published
under the pseudonym “A. Student”.
• He is famous for developing the t-distribution, which applies when
performing hypothesis tests on means from small samples using
the estimated standard deviation. His contribution gave birth to
the ubiquitous t-test.
27.
Dr. Khoe YaoTung, MSc.Ed, M.Ed.
If you don’t believe in random
sampling, the next time you have
blood test, tell the doctor to take it
all.
AC Nielsen Jr.