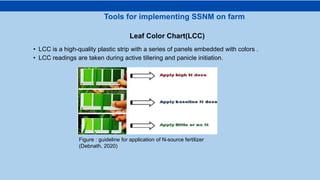
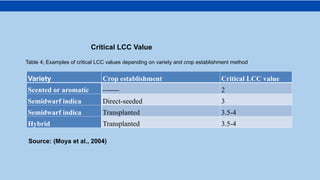
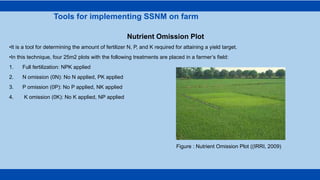
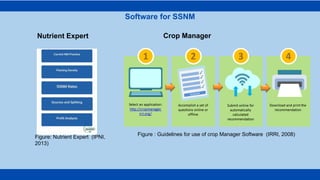
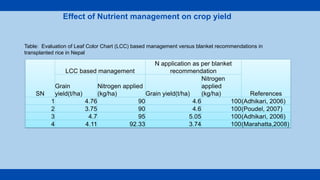
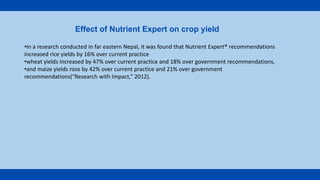
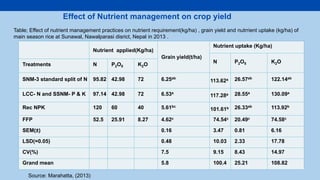
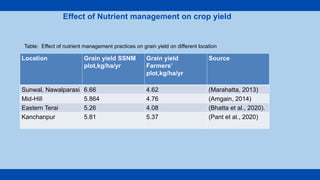
A Term Paper Presentation on:
Site Specific Nutrient Management for Rice Production
Submitted To:
Prof. Shrawan Kumar Sah, PhD
Department of Agronomy
Faculty of Agriculture
Agriculture and Forestry University
Agriculture and Forestry University (AFU)
Faculty of Agriculture
Rampur, Chitwan
Submitted By:
Goma Joshi
WS-02M- 2022
M.Sc. Ag(Agronomy)
1st Semester
Overview
Site Specific Nutrient Management
Conclusion and Way Forward
Introduction
01
02
03
04
11
Objective
Materials and methods
05 Features
06 Principles of SSNM
09
Approaches of SSNM
07
08 Tools for implementing SSNM
Software for implementing SSNM
10 Effect of Nutrient Management
12 References
• The present national yield of rice is 3.39t/ha (AITC, 2023) which is far below
the potential yield of 9.08t/ha (Regmi, 2003).
• The blanket nutrient recommendation applied to large areas of small-scale
farming systems falls short of meeting crop nutrient requirements (Buresh
& Christian, 2007).
• Site-specific nutrient management (SSNM) is the technique that seeks for
more specific application of fertilizers and resources.
• This presentation summarizes the concept of SSNM with its tools and
guidelines for improved nutrient management in crop production.
Introduction
Feeding
crop
needs!
Figure: The need for nutrient
input (IRRI, 2009)
• To review on the theoretical perspective of Site Specific Nutrient Management(SSNM) for rice
production
Objectives
Board Objective
Specific Objectives
• To have in-depth knowledge of SSNM for rice production
• To understand the approaches and principles of SSNM
• To identify the tools and software for implementing SSNM in farmers' field
• Data Collection: Secondary Sources
Adapted three phase
• Exploration Phase
• Interpretation Phase
• Communication phase
Materials and Methods
Site Specific Nutrient Management
• Site-specific nutrient management (SSNM) is a plant-based approach that provides principles that
can be used everywhere (Richards et al., 2016).
• Site-specific nutrient management is the dynamic,field-specific management of nutrients in a
particular cropping season to optimize the supply and demand of nutrients .( Dobermann & White,
1998).
• This technique aims to enable farmers to adjust fertilizer use dynamically.
• With SSNM, plant-essential nutrients are supplied as and when required to ensure the feeding of
the crop to meet its nutrient needs optimally.
1. Optimal utilization of indigenous nutrient sources such as crop residues.
2. The application of nitrogen (N), phosphorus (P), and potassium (K) fertilizer is
tailored to the crop's location and season using :
a) the leaf color chart
b) nitrogen omission plots.
3. Local randomization is used for the application of zinc, sulfur, and micronutrients.
4. Choosing the most cost-effective combination of available fertilizer sources.
5. Integration with other Integrated Crop Management(ICM) practices (IRRI, 2009;
Tiwari & Jain, 2021)
Features of SSNM
Principles of SSNM
Balanced Fertilization Based on
Crop Requirements
Need based N fertilizer
Management
Plant-based Estimation of
Soil Nutrient Supplies
Sustainable P and K Management
Increasing Profitability
Approaches of SSNM
Plant analysis based
SSNM
Soil-cum-plant analysis based
SSNM
•The crop's nutrient status is considered to be the best indicator of soil nutrient supplies as well as crop
nutrient demand (Dobermann et al., 2004).
•SSNM was initially tried for low-land rice, but it later proved beneficial to several contemporary approaches
to fertilizer recommendations.
• Dobermann et al. (2004) proposed five key steps (given below) for developing field-specific fertilizer NPK
recommendations for rice, through the basic principles;
• Selection of the yield goal,
• Assessment of crop nutrient requirement,
• Estimation of indigenous nutrient supplies,
• Computation of fertilizer nutrient rates,
• Dynamic adjustment of N rates:
Plant analysis based SSNM
Selection of the target yield or yield goal
• Target yield or yield goals are set around 75 to 8o% of the potential yield,
• Potential yield can be determined by using crop simulation models or can be estimated from the highest
yield recorded at a particular site.
• The mean simulated potential yield of improved varieties of rice is between 8.87 and 9.47t/ha in the main
season in inner Terai Nepal (Regmi, 2003).
• The target yield can also be fixed at 10-20% higher than the average yield.
Assessment of crop nutrient requirement
• The nutrient uptake requirements of a crop depend on the target yield or yield goal.
• Nutrient requirements in SSNM are estimated using the Quantitative Evaluation of the Fertility of Tropical
Soils(QUEFTS) model.
• It provides a generic approach for estimating crop nutrient requirements.
• In inner Terai and foothills of Nepal, nutritional balance is achieved with 14.70 kg N, 5.95 kg P2O5, and
17.46kg K2O per a particular yield (Regmi, 2003).
• Nutrient recommendations are calculated on the basis of plant nutrient requirement for selected
grain yield goal, an estimate of indigenous nutrient supply and the expected fertilizer recovery
efficiency(RE)
Plant analysis based SSNM
Estimation of indigenous nutrient supplies
• Can be estimated from Nutrient Omission Plot
Computation of Fertilizer Nutrient Rates
FNR=(NRx-INx)/R
Where,
FNR= Fertilizer Nutrient Recommendation(kg/ha)
NRx= Nutrient required for target yield(kg/ha)
Inx=Indigenous Nutrient Supply(kg/ha)
Rx= Recovery of nutrient in percent(%)
Rx of N= 40 to 60%, Rx of P2O5= 20-30%,Rx of K205= 40-50%
Fertilizers P and K , as computed above are applied basally at the time of sowing / planting , the N rates
and application schedules of N can be further adjusted according to crop demand using chlorophyll
meter (popularly known as SPAD) or leaf colour chart (LCC).
Plant analysis based SSNM
Dynamic adjustment of N Rates
• In this case, nutrient availability in the soil, plant nutrient demands for a higher target yield (not
less than 80% of Y max.), and recovery-efficiency (RE) of applied nutrients are considered.
• In order to ascertain desired crop growth, not limited by apparent or hidden huger of nutrients,
soil is analyzed for all macro and micronutrients well before sowing/ planting.
• Recommendations include 4 to 7 plant nutrients depending on the multi-nutrient deficiency or
nutrient inadequacy for high-yield targets.
• This approach offers more significant economic gains compared with NPK fertilizer schedules
conventionally prescribed by soil testing laboratories
Soil-cum-plant analysis based SSNM
Tools for implementing SSNM on farm
• It is widely used to optimize the timing and quantity of fertilizer to
improve crop yields.(Francis & Piekielek, 2016).
• It can detect the onset of N stress before it is visible to human eyes.
• It is based on the relationship between the amount of red light
absorbed and the amount transmitted through the leaf.
Soil Plant Analysis Development(SPAD) chlorophyll meter
Figure : Soil Plant Analysis
Development Meters (KONICA
MINOLTA, n.d.)
• LCC is a high-quality plastic strip with a series of panels embedded with colors .
• LCC readings are taken during active tillering and panicle initiation.
Tools for implementing SSNM on farm
Leaf Color Chart(LCC)
Figure : guideline for application of N-source fertilizer
(Debnath, 2020)
Source: (Moya et al., 2004)
Variety Crop establishment Critical LCC value
Scented or aromatic ------- 2
Semidwarf indica Direct-seeded 3
Semidwarf indica Transplanted 3.5-4
Hybrid Transplanted 3.5-4
Table 4; Examples of critical LCC values depending on variety and crop establishment method
Critical LCC Value
Optical Sensor
•The chlorophyll meter and LCC do not take into account photosynthetic rates or
biomass production, as well as expected yields.
•To detect N stress, optical sensors measure the reflectance from the leaves to
generate vegetative index called normalized difference vegetation index.
•It have been found to be sensitive to leaf area index, green biomass, and
photosynthetic efficiency.
Tools for implementing SSNM on farm
Nutrient Omission Plot
•It is a tool for determining the amount of fertilizer N, P, and K required for attaining a yield target.
•In this technique, four 25m2 plots with the following treatments are placed in a farmer’s field:
1. Full fertilization: NPK applied
2. N omission (0N): No N applied, PK applied
3. P omission (0P): No P applied, NK applied
4. K omission (0K): No K applied, NP applied
Figure : Nutrient Omission Plot ((IRRI, 2009)
Software for SSNM
Nutrient Expert Crop Manager
Figure: Nutrient Expert (IPNI,
2013)
Figure : Guidelines for use of crop Manager Software (IRRI, 2008)
Effect of Nutrient management on crop yield
Table: Evaluation of Leaf Color Chart (LCC) based management versus blanket recommendations in
transplanted rice in Nepal
SN
LCC based management
N application as per blanket
recommendation
References
Grain
yield(t/ha)
Nitrogen applied
(kg/ha) Grain yield(t/ha)
Nitrogen
applied
(kg/ha)
1 4.76 90 4.6 100(Adhikari, 2006)
2 3.75 90 4.6 100(Poudel, 2007)
3 4.7 95 5.05 100(Adhikari, 2006)
4 4.11 92.33 3.74 100(Marahatta,2008)
Effect of Nutrient Expert on crop yield
•In a research conducted in far eastern Nepal, it was found that Nutrient Expert® recommendations
increased rice yields by 16% over current practice
•wheat yields increased by 47% over current practice and 18% over government recommendations,
•and maize yields rose by 42% over current practice and 21% over government
recommendations(“Research with Impact,” 2012).
Nutrient applied(Kg/ha)
Grain yield(t/ha)
Nutrient uptake (Kg/ha)
N P2O5 K2O
Treatments N P2O5 K2O
SNM-3 standard split of N 95.82 42.98 72 6.25ab
113.62a 26.57ab 122.14ab
LCC- N and SSNM- P & K 97.14 42.98 72 6.53a
117.28a 28.55a 130.09a
Rec NPK 120 60 40 5.61bc
101.61b 26.33ab 113.92b
FFP 52.5 25.91 8.27 4.62c 74.54c 20.49c 74.58c
SEM(±) 0.16 3.47 0.81 6.16
LSD(=0.05) 0.48 10.03 2.33 17.78
CV(%) 7.5 9.15 8.43 14.97
Grand mean 5.8 100.4 25.21 108.82
Effect of Nutrient management on crop yield
Table; Effect of nutrient management practices on nutrient requirement(kg/ha) , grain yield and nutrrient uptake (kg/ha) of
main season rice at Sunawal, Nawalparasi disrict, Nepal in 2013 .
Source: Marahatta, (2013)
Location Grain yield SSNM
plot,kg/ha/yr
Grain yield
Farmers’
plot,kg/ha/yr
Source
Sunwal, Nawalparasi 6.66 4.62 (Marahatta, 2013)
Mid-Hill 5.864 4.76 (Amgain, 2014)
Eastern Terai 5.26 4.08 (Bhatta et al., 2020).
Kanchanpur 5.81 5.37 (Pant et al., 2020)
Effect of Nutrient management on crop yield
Table: Effect of nutrient management practices on grain yield on different location
Conclusion and Way Forward
•SSNM provides a method for nutrient-based crop feeding that takes into account the
inherent spatial variability.
•SSNM strategies included site and season specific knowledge of crop nureient
requirement and indigenous nutrient supplies.
•The practice increases rice yield, improve nutrient uptake and efficiencies and optimize
the profit.
•Method and researches to simplify the approach for greater adaptation.
•AITC. (2014). Agriculture and Livestock Diary 2080, Agriculture Information and Training Center (AITC),
https://aitc.gov.np/downloadsdetail/2/2019/19794382
•Buresh R.J, & Christian Witt. (2007). Site-Specific Nutrient Management. September, 1–8.
•Chlorophyll Meter SPAD-502Plus for agricultural products | KONICA MINOLTA. (n.d.). Retrieved April 24, 2023,
from https://www.konicaminolta.eu/eu-en/hardware/measuring-instruments/colour-measurement/chlorophyll-
meter/spad-502plus
•Crop Manager. (n.d.). Retrieved April 25, 2023, from http://cropmanager.irri.org/home
•Debnath, S. (2020). Chapter -5 Site Specific Nutrient Management ( SSNM ): Concept , Method and
Application in Rice for yield Sustainability. September. https://www.researchgate.net/publication/344238089
•Dobermann, A., & White, P. F. (1998). Strategies for nutrient management in irrigated and rainfed lowland rice
systems. Nutrient Cycling in Agroecosystems, 53(1), 1–18. https://doi.org/10.1023/A:1009795032575
•IRRI. (2009). SSNM Manual. Manage, 1–39.
References
•Marahatta, S. (2018). Increasing productivity of an intensive rice based system through site specific
nutrient management in Western Terai of Nepal. Journal of Agriculture and Environment, 18(May 2018),
140–150. https://doi.org/10.3126/aej.v18i0.19899
•Pant, C., Joshi, P. P., Gaire, R, & Dahal, B. (2020). Effect of Site Specific Nutrient Management
Approach In Productivity Of Spring Rice In Kanchanpur, Nepal. Malaysian Journal of Halal Research,
3(1), 24–30. https://doi.org/10.2478/mjhr-2020-0004
•Regmi, A. P. (2003). Improving The Productivity Of Rice-Wheat System Through Specific Nutrient
Management In Nepal (p. 149).
•Richards, M. B., Butterbach-bahl, K., Jat, M. L., Lipinski, B., Ortiz-Monasterio, I., & Sapkota, T. (2016).
Site-Specific Nutrient Management : Implementation guidance for policymakers and investors.
PRACTICE BRIEF Climate-Smart Agriculture, 10.
•Tiwari, R., & Jain, P. (2021). Site Specific Nutrient Management For Enhanced Nutrient-Use Efficiency.
1(12)
References
Thank You

SSNM

  • 1.
    A Term PaperPresentation on: Site Specific Nutrient Management for Rice Production Submitted To: Prof. Shrawan Kumar Sah, PhD Department of Agronomy Faculty of Agriculture Agriculture and Forestry University Agriculture and Forestry University (AFU) Faculty of Agriculture Rampur, Chitwan Submitted By: Goma Joshi WS-02M- 2022 M.Sc. Ag(Agronomy) 1st Semester
  • 2.
    Overview Site Specific NutrientManagement Conclusion and Way Forward Introduction 01 02 03 04 11 Objective Materials and methods 05 Features 06 Principles of SSNM 09 Approaches of SSNM 07 08 Tools for implementing SSNM Software for implementing SSNM 10 Effect of Nutrient Management 12 References
  • 3.
    • The presentnational yield of rice is 3.39t/ha (AITC, 2023) which is far below the potential yield of 9.08t/ha (Regmi, 2003). • The blanket nutrient recommendation applied to large areas of small-scale farming systems falls short of meeting crop nutrient requirements (Buresh & Christian, 2007). • Site-specific nutrient management (SSNM) is the technique that seeks for more specific application of fertilizers and resources. • This presentation summarizes the concept of SSNM with its tools and guidelines for improved nutrient management in crop production. Introduction Feeding crop needs! Figure: The need for nutrient input (IRRI, 2009)
  • 4.
    • To reviewon the theoretical perspective of Site Specific Nutrient Management(SSNM) for rice production Objectives Board Objective Specific Objectives • To have in-depth knowledge of SSNM for rice production • To understand the approaches and principles of SSNM • To identify the tools and software for implementing SSNM in farmers' field
  • 5.
    • Data Collection:Secondary Sources Adapted three phase • Exploration Phase • Interpretation Phase • Communication phase Materials and Methods
  • 6.
    Site Specific NutrientManagement • Site-specific nutrient management (SSNM) is a plant-based approach that provides principles that can be used everywhere (Richards et al., 2016). • Site-specific nutrient management is the dynamic,field-specific management of nutrients in a particular cropping season to optimize the supply and demand of nutrients .( Dobermann & White, 1998). • This technique aims to enable farmers to adjust fertilizer use dynamically. • With SSNM, plant-essential nutrients are supplied as and when required to ensure the feeding of the crop to meet its nutrient needs optimally.
  • 7.
    1. Optimal utilizationof indigenous nutrient sources such as crop residues. 2. The application of nitrogen (N), phosphorus (P), and potassium (K) fertilizer is tailored to the crop's location and season using : a) the leaf color chart b) nitrogen omission plots. 3. Local randomization is used for the application of zinc, sulfur, and micronutrients. 4. Choosing the most cost-effective combination of available fertilizer sources. 5. Integration with other Integrated Crop Management(ICM) practices (IRRI, 2009; Tiwari & Jain, 2021) Features of SSNM
  • 8.
    Principles of SSNM BalancedFertilization Based on Crop Requirements Need based N fertilizer Management Plant-based Estimation of Soil Nutrient Supplies Sustainable P and K Management Increasing Profitability
  • 9.
    Approaches of SSNM Plantanalysis based SSNM Soil-cum-plant analysis based SSNM
  • 10.
    •The crop's nutrientstatus is considered to be the best indicator of soil nutrient supplies as well as crop nutrient demand (Dobermann et al., 2004). •SSNM was initially tried for low-land rice, but it later proved beneficial to several contemporary approaches to fertilizer recommendations. • Dobermann et al. (2004) proposed five key steps (given below) for developing field-specific fertilizer NPK recommendations for rice, through the basic principles; • Selection of the yield goal, • Assessment of crop nutrient requirement, • Estimation of indigenous nutrient supplies, • Computation of fertilizer nutrient rates, • Dynamic adjustment of N rates: Plant analysis based SSNM
  • 11.
    Plant analysis basedSSNM Selection of the target yield or yield goal • Target yield or yield goals are set around 75 to 8o% of the potential yield, • Potential yield can be determined by using crop simulation models or can be estimated from the highest yield recorded at a particular site. • The mean simulated potential yield of improved varieties of rice is between 8.87 and 9.47t/ha in the main season in inner Terai Nepal (Regmi, 2003). • The target yield can also be fixed at 10-20% higher than the average yield. Assessment of crop nutrient requirement • The nutrient uptake requirements of a crop depend on the target yield or yield goal. • Nutrient requirements in SSNM are estimated using the Quantitative Evaluation of the Fertility of Tropical Soils(QUEFTS) model. • It provides a generic approach for estimating crop nutrient requirements. • In inner Terai and foothills of Nepal, nutritional balance is achieved with 14.70 kg N, 5.95 kg P2O5, and 17.46kg K2O per a particular yield (Regmi, 2003).
  • 12.
    • Nutrient recommendationsare calculated on the basis of plant nutrient requirement for selected grain yield goal, an estimate of indigenous nutrient supply and the expected fertilizer recovery efficiency(RE) Plant analysis based SSNM Estimation of indigenous nutrient supplies • Can be estimated from Nutrient Omission Plot Computation of Fertilizer Nutrient Rates FNR=(NRx-INx)/R Where, FNR= Fertilizer Nutrient Recommendation(kg/ha) NRx= Nutrient required for target yield(kg/ha) Inx=Indigenous Nutrient Supply(kg/ha) Rx= Recovery of nutrient in percent(%) Rx of N= 40 to 60%, Rx of P2O5= 20-30%,Rx of K205= 40-50%
  • 13.
    Fertilizers P andK , as computed above are applied basally at the time of sowing / planting , the N rates and application schedules of N can be further adjusted according to crop demand using chlorophyll meter (popularly known as SPAD) or leaf colour chart (LCC). Plant analysis based SSNM Dynamic adjustment of N Rates
  • 14.
    • In thiscase, nutrient availability in the soil, plant nutrient demands for a higher target yield (not less than 80% of Y max.), and recovery-efficiency (RE) of applied nutrients are considered. • In order to ascertain desired crop growth, not limited by apparent or hidden huger of nutrients, soil is analyzed for all macro and micronutrients well before sowing/ planting. • Recommendations include 4 to 7 plant nutrients depending on the multi-nutrient deficiency or nutrient inadequacy for high-yield targets. • This approach offers more significant economic gains compared with NPK fertilizer schedules conventionally prescribed by soil testing laboratories Soil-cum-plant analysis based SSNM
  • 15.
    Tools for implementingSSNM on farm • It is widely used to optimize the timing and quantity of fertilizer to improve crop yields.(Francis & Piekielek, 2016). • It can detect the onset of N stress before it is visible to human eyes. • It is based on the relationship between the amount of red light absorbed and the amount transmitted through the leaf. Soil Plant Analysis Development(SPAD) chlorophyll meter Figure : Soil Plant Analysis Development Meters (KONICA MINOLTA, n.d.)
  • 16.
    • LCC isa high-quality plastic strip with a series of panels embedded with colors . • LCC readings are taken during active tillering and panicle initiation. Tools for implementing SSNM on farm Leaf Color Chart(LCC) Figure : guideline for application of N-source fertilizer (Debnath, 2020)
  • 17.
    Source: (Moya etal., 2004) Variety Crop establishment Critical LCC value Scented or aromatic ------- 2 Semidwarf indica Direct-seeded 3 Semidwarf indica Transplanted 3.5-4 Hybrid Transplanted 3.5-4 Table 4; Examples of critical LCC values depending on variety and crop establishment method Critical LCC Value
  • 18.
    Optical Sensor •The chlorophyllmeter and LCC do not take into account photosynthetic rates or biomass production, as well as expected yields. •To detect N stress, optical sensors measure the reflectance from the leaves to generate vegetative index called normalized difference vegetation index. •It have been found to be sensitive to leaf area index, green biomass, and photosynthetic efficiency. Tools for implementing SSNM on farm
  • 19.
    Tools for implementingSSNM on farm Nutrient Omission Plot •It is a tool for determining the amount of fertilizer N, P, and K required for attaining a yield target. •In this technique, four 25m2 plots with the following treatments are placed in a farmer’s field: 1. Full fertilization: NPK applied 2. N omission (0N): No N applied, PK applied 3. P omission (0P): No P applied, NK applied 4. K omission (0K): No K applied, NP applied Figure : Nutrient Omission Plot ((IRRI, 2009)
  • 20.
    Software for SSNM NutrientExpert Crop Manager Figure: Nutrient Expert (IPNI, 2013) Figure : Guidelines for use of crop Manager Software (IRRI, 2008)
  • 21.
    Effect of Nutrientmanagement on crop yield Table: Evaluation of Leaf Color Chart (LCC) based management versus blanket recommendations in transplanted rice in Nepal SN LCC based management N application as per blanket recommendation References Grain yield(t/ha) Nitrogen applied (kg/ha) Grain yield(t/ha) Nitrogen applied (kg/ha) 1 4.76 90 4.6 100(Adhikari, 2006) 2 3.75 90 4.6 100(Poudel, 2007) 3 4.7 95 5.05 100(Adhikari, 2006) 4 4.11 92.33 3.74 100(Marahatta,2008)
  • 22.
    Effect of NutrientExpert on crop yield •In a research conducted in far eastern Nepal, it was found that Nutrient Expert® recommendations increased rice yields by 16% over current practice •wheat yields increased by 47% over current practice and 18% over government recommendations, •and maize yields rose by 42% over current practice and 21% over government recommendations(“Research with Impact,” 2012).
  • 23.
    Nutrient applied(Kg/ha) Grain yield(t/ha) Nutrientuptake (Kg/ha) N P2O5 K2O Treatments N P2O5 K2O SNM-3 standard split of N 95.82 42.98 72 6.25ab 113.62a 26.57ab 122.14ab LCC- N and SSNM- P & K 97.14 42.98 72 6.53a 117.28a 28.55a 130.09a Rec NPK 120 60 40 5.61bc 101.61b 26.33ab 113.92b FFP 52.5 25.91 8.27 4.62c 74.54c 20.49c 74.58c SEM(±) 0.16 3.47 0.81 6.16 LSD(=0.05) 0.48 10.03 2.33 17.78 CV(%) 7.5 9.15 8.43 14.97 Grand mean 5.8 100.4 25.21 108.82 Effect of Nutrient management on crop yield Table; Effect of nutrient management practices on nutrient requirement(kg/ha) , grain yield and nutrrient uptake (kg/ha) of main season rice at Sunawal, Nawalparasi disrict, Nepal in 2013 . Source: Marahatta, (2013)
  • 24.
    Location Grain yieldSSNM plot,kg/ha/yr Grain yield Farmers’ plot,kg/ha/yr Source Sunwal, Nawalparasi 6.66 4.62 (Marahatta, 2013) Mid-Hill 5.864 4.76 (Amgain, 2014) Eastern Terai 5.26 4.08 (Bhatta et al., 2020). Kanchanpur 5.81 5.37 (Pant et al., 2020) Effect of Nutrient management on crop yield Table: Effect of nutrient management practices on grain yield on different location
  • 25.
    Conclusion and WayForward •SSNM provides a method for nutrient-based crop feeding that takes into account the inherent spatial variability. •SSNM strategies included site and season specific knowledge of crop nureient requirement and indigenous nutrient supplies. •The practice increases rice yield, improve nutrient uptake and efficiencies and optimize the profit. •Method and researches to simplify the approach for greater adaptation.
  • 26.
    •AITC. (2014). Agricultureand Livestock Diary 2080, Agriculture Information and Training Center (AITC), https://aitc.gov.np/downloadsdetail/2/2019/19794382 •Buresh R.J, & Christian Witt. (2007). Site-Specific Nutrient Management. September, 1–8. •Chlorophyll Meter SPAD-502Plus for agricultural products | KONICA MINOLTA. (n.d.). Retrieved April 24, 2023, from https://www.konicaminolta.eu/eu-en/hardware/measuring-instruments/colour-measurement/chlorophyll- meter/spad-502plus •Crop Manager. (n.d.). Retrieved April 25, 2023, from http://cropmanager.irri.org/home •Debnath, S. (2020). Chapter -5 Site Specific Nutrient Management ( SSNM ): Concept , Method and Application in Rice for yield Sustainability. September. https://www.researchgate.net/publication/344238089 •Dobermann, A., & White, P. F. (1998). Strategies for nutrient management in irrigated and rainfed lowland rice systems. Nutrient Cycling in Agroecosystems, 53(1), 1–18. https://doi.org/10.1023/A:1009795032575 •IRRI. (2009). SSNM Manual. Manage, 1–39. References
  • 27.
    •Marahatta, S. (2018).Increasing productivity of an intensive rice based system through site specific nutrient management in Western Terai of Nepal. Journal of Agriculture and Environment, 18(May 2018), 140–150. https://doi.org/10.3126/aej.v18i0.19899 •Pant, C., Joshi, P. P., Gaire, R, & Dahal, B. (2020). Effect of Site Specific Nutrient Management Approach In Productivity Of Spring Rice In Kanchanpur, Nepal. Malaysian Journal of Halal Research, 3(1), 24–30. https://doi.org/10.2478/mjhr-2020-0004 •Regmi, A. P. (2003). Improving The Productivity Of Rice-Wheat System Through Specific Nutrient Management In Nepal (p. 149). •Richards, M. B., Butterbach-bahl, K., Jat, M. L., Lipinski, B., Ortiz-Monasterio, I., & Sapkota, T. (2016). Site-Specific Nutrient Management : Implementation guidance for policymakers and investors. PRACTICE BRIEF Climate-Smart Agriculture, 10. •Tiwari, R., & Jain, P. (2021). Site Specific Nutrient Management For Enhanced Nutrient-Use Efficiency. 1(12) References
  • 28.