This lecture discusses soil fertility management in Tamil Nadu, India. It introduces Dr. B. Ramamoorthy, a prominent soil scientist. It then discusses several approaches to determining soil fertility and fertilizer recommendations, including nutrient budgeting, nutrient indexing, targeted yield approaches, percentage yield sufficiency concepts, and the development of a decision support system (DSS) for integrated fertilizer recommendations. The DSS helps generate site-specific recommendations based on factors like soil type, crop, and water quality. Long-term experiments show that the DSS approach maintains soil nutrients and improves yields compared to blanket recommendations.


![Ramamoorthy et al. (1967)
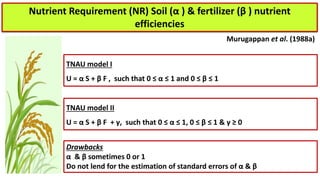
Nutrient Requirement (NR) Soil (α ) & fertilizer (β ) nutrient
efficiencies
U = f (S, F)
U = α S + β F
NR = U / Y (or) U = NR Y
NR Y = α S + β F
NR = U / Y, α = U0/S0, β = [UF – (α SF)] / F
F = 1/ β [ NR Y - α S ]
Drawbacks
α > 1, β > 1
Does not lend for the estimation of standard errors of α & β](https://image.slidesharecdn.com/ramamoorthymemorialfinal1ppt-230114161822-b6932be4/85/Ramamoorthy-memorial-final-1ppt-pptx-22-320.jpg)