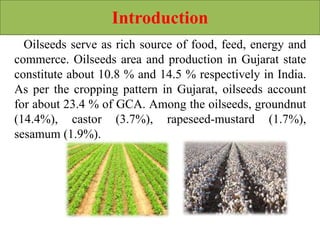
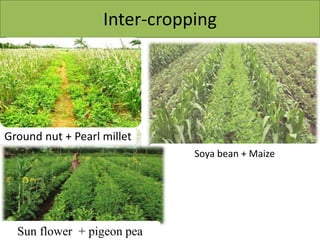
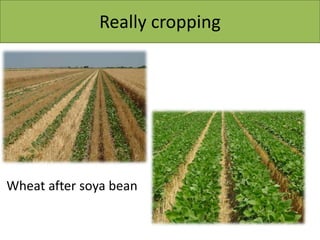
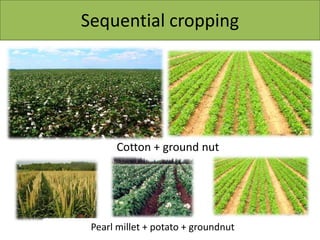
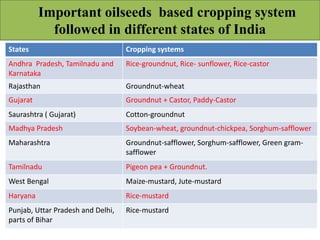
OILSEED BASE CROPPING
SYSTEAMS
SUBMITTED TO: SUBMITTED BY:
Dr. H. M. VIRADIA JOSHI JIGARKUMAR R.
Associate Professor 2nd Sem. M.sc.(Agri.)
Dept. of Agronomy Reg.No-2010114038
N.M.C.A., N.A.U. Dept. of Agronomy
NAVSARI – 396 450 N.M.C.A., N.A.U.
NAVSARI- 396 45
Introduction
Oilseeds serve as rich source of food, feed, energy and
commerce. Oilseeds area and production in Gujarat state
constitute about 10.8 % and 14.5 % respectively in India.
As per the cropping pattern in Gujarat, oilseeds account
for about 23.4 % of GCA. Among the oilseeds, groundnut
(14.4%), castor (3.7%), rapeseed-mustard (1.7%),
sesamum (1.9%).
Soil fertility management is a set of agricultural
practices adopted to local conditions to maximize
the efficiency of nutrient and improve
agricultural productivity. Due to prolonged
cultivation of crops with recommended dose of
inorganic fertilizers alone, the productivity of
soil has gone down and time has come to
supplement to inorganic fertilizers with organics
and micro-nutrients to sustain the fertility and
productivity of the soils (Behera et al., 2007).
Keeping this in view it is essential to find out
proper fertility management and suitable oilseed
based cropping system for sustainable
production.
Area (ha), production ( tonnes) and productivity (kg/ha) of total
oilseeds during 2010-11 in major producing states
State Area (ha) Production (tonnes) Productivity
(kg/ha)
M.P 75,34,400 92,76,000 1231
Rajasthan 49,12,200 63,64,600 1296
Maharashtra 38,06,000 50,86,800 1337
Gujarat 24,52,000 27,05,000 1103
Andhra Pradesh 19,45,000 16,51,100 849
Karnataka 14,22,000 9,19,600 647
U.P 11,47,000 10,30,500 898
Haryana 580,200 9,93,100 1712
West bangle 732,100 8,50,700 1162
Tamilnadu 388,500 8,16,900 2103
India 2,64,84,400 3,09,41,200 1168
APEDA
What is cropping system?
 cropping system It is an important component of
a farming system. It represents cropping pattern
used on a farm and their interaction with farm
resources, other farm enterprises and available
technology which determine their make up.
• Cropping pattern: The proportion of area
undervarious cropsat appoint of time in a unit
area. It indicates the yearly sequence and spatial
arrangement of cropsand following an area.
Inter-cropping
Ground nut + Pearl millet
Soya bean + Maize
Sun flower + pigeon pea
Really cropping
Wheat after soya bean
Sequential cropping
Cotton + ground nut
Pearl millet + potato + groundnut
Ratoon cropping
Important oilseeds based cropping system
followed in different states of India
States Cropping systems
Andhra Pradesh, Tamilnadu and
Karnataka
Rice-groundnut, Rice- sunflower, Rice-castor
Rajasthan Groundnut-wheat
Gujarat Groundnut + Castor, Paddy-Castor
Saurashtra ( Gujarat) Cotton-groundnut
Madhya Pradesh Soybean-wheat, groundnut-chickpea, Sorghum-safflower
Maharashtra Groundnut-safflower, Sorghum-safflower, Green gram-
safflower
Tamilnadu Pigeon pea + Groundnut.
West Bengal Maize-mustard, Jute-mustard
Haryana Rice-mustard
Punjab, Uttar Pradesh and Delhi,
parts of Bihar
Rice-mustard
Objectives of cropping system :
• Maximizing system productivity on annual basis
• Utilization of resources with higher efficiency by
considering various interactions and direct,
residual and cumulative effect in soil-plant-
environment system
• Intensive input use in relation to quality of
environment
• Sustainability of farm resources and environment
in long term perspective.
Benefits of cropping systems :
• Maintain and enhance soil fertility. Some crops are
soil exhausting while others help restore soil fertility.
• Enhance crop growth. Crops may provide mutual
benefits to each other.
• Minimize spread of disease.
• Control weeds. Crops planted at different times of the
year have different weed species associated with
them.
• Inhibits pest and insect growth.
• Increase soil cover.
• Use resource more efficiently.
• Reduce risk for crop failure.
• Improve food and financial security.
Table: Nutrient uptake in some cropping
systems involving oilseeds
Cropping system (t/ha) Nutrient uptake (kg/ha)
N P2O5 K2O total
Sorghum (3.6)- Groundnut (2.2) 216 74 184 471
Maize (3.0)-Mustard (2.0) 127 70 177 374
Cotton (2.0)- Sunflower (1.8) 203 90 376 669
Soybean( 1.5)-potato (26.0)-wheat (4.0) 305 177 345 827
Sorghum ( 4.0)-Sunflower (1.5)-Groundnut (2.0) 301 121 385 807
Rice (4.8)-Rice (5.7)-Groundnut (2.0) 316 153 369 838
Rice (4.7)-Rice (5.6)-Sesame (0.7) 243 131 354 728
Fodder Sorghum (18.9)-Potato (29.0) Sunflower (1.8) 296 121 481 898
Maize (2.8)-Potato (29.0) Sunflower (1.8) 296 110 479 885
Soybean (1.9)- wheat (4.8) 252 100 267 619
Sunflower (1.6)-Groundnut (3.4) 294 97 304 700
Groundnut productivity different states
Table:1 Effect of nutrient management practices on yield and yield attributes of
soybean and wheat under soybean – wheat cropping system
Treatment Soybean Wheat
Seed Yield
(t/ha
Stover yield
(t/ha)
Pl. Height
(cm)
Seed Yield
(t/ha
Straw Yield
(t/ha)
Pl. Height
(cm)
Nutrient sources
CR 5 t/ha 1.33 3.88 60.7 3.65 8.58 94.8
FYM 5 t/ha 1.42 4.03 60.9 3.73 8.70 96.2
T1+T2+Zn
5 kg/ha
1.48 4.06 62.2 3.96 9.19 98.8
CD (P=0.05 0.09 0.28 1.47 0.12 0.36 1.81
Nutrient levels
50% RDF 1.37 3.98 61.5 3.76 8.68 94.9
100% RDF 1.55 4.35 62.7 3.99 9.05 105
CD (P=0.05 0.07 0.20 0.98 0.10 0.28 1.93
CR- wheat crop residues: RDF-i.e. Soybean- 30-33-33, wheat- 120-26-33 NPK kg/ha
IARI, New Delhi Shivkumar and Ahlawat (2008)
Table:2 Effect of organic with and without fertilizers on yield of
paddy and castor under paddy-castor cropping system
Treatment Paddy Grain
yield (kg/ha)
Paddy straw
yield (kg/ha)
Castor Seed
yield (kg/ha)
Fertilizer
Control 3079 4597 948
75 % RDF 4499 6541 1186
CD (P=0.05) 356 922 288
Organics
Control 2934 5182 934
FYM @ 20 t/ha 3881 5373 1129
Sugarcane trash @ 20t/ha 3497 4918 1074
Bio compost @ 20t/ha 4591 6354 1240
Green manuring with dhaincha 4042 6017 1058
CD (P=0.05) 747 986 105
RDF- Rice- 100-30-00 NPK kg/ha
Virdia et al. (2011)RRRS,Vyara
Table:3 Effect of nutrient management practices on
yield under groundnut based cropping system .
Treatment Groundnut pod
yield ( kg/ha)
Wheat grain
yield (kg/ha)
Sole groundnut 1070 0
Groundnut-wheat (100 % RDF) 1031 2389
Groundnut-wheat (50 % RDF) 980 2293
Groundnut-wheat (50 % RDF + 5t / ha FYM) 976 2608
Groundnut-wheat –greengram (100 % RDF) 930 2595
Groundnut-wheat- greengram (50 % RDF) 973 2326
Groundnut-wheat- greengram (50 % RDF + 5t / ha
FYM)
951 2721
CD ( P=0.05) 60 _
RDF-i.e. Groundnut- 12.5-25-00, wheat- 120-60-40 NPK kg/ha
Junagadh, Gujarat Jat et al. (2011)
Table:4 Effect of long term application of fertilizer and organic manure on yield
of soybean and wheat crop under soybean-wheat cropping system
Treatments Grain yields (t/ha)
Soybean wheat
Control 1.04 1.71
50 % NPK 1.20 3.38
100 % NPK 1.53 4.74
150 % NPK 1.56 4.88
100 % NPK+HW 1.47 4.54
100 % NPK+Zn 1.48 4.68
100 % NP 1.29 4.16
100 % N 1.11 2.05
100% NPK+FYM @ 15 t/ha 1.84 5.26
100% NPK-S 1.44 4.45
CD ( P=0.05) 0.25 .064
RDF-i.e. Soybean- 20-80-20, wheat- 120-80-40 NPK kg/ha
Jabalpur (MP) Sawarkar et al. (2013)
Table:5 Effect of different sunflower based cropping system on Soil
fertility (mean data of 5 years).
Cropping sequence Soil fertility status after 5 years of
experimentation (kg/ha)
N P2O5 K2O
Initial 270 19.2 291
Sunflower- sunflower 174 12.6 283
Fallow-sunflower 252 17.8 298
Greengram- sunflower 275 19.5 320
Soybean-sunflower 282 19.6 306
Groundnut-sunflower 289 18.9 315
Setaria- sunflower 243 16.7 296
Nandyal, AP Saila and Sridhar (2005)
Table:6 Effect of various soybean- based cropping
systems on soil fertility status
Treatment Soil organic
carbon (%)
Soil available nutrients (kg/ha)
N P2O5 K2O
Initial 0.53 154.2 12.77 530
Soybean- wheat 0.71 193.2 33.45 624
Soybean-
Mustard
0.68 184.3 25.66 598
Soybean-
Chickpea
0.62 187.4 20.78 598
Soybean-
Isabgol
0.57 169.3 17.77 575
SEm ± 0.02 4.5 1.61 8
CD ( P=0.05) 0.07 13.2 4.73 23
Bhopal, MP Ramesh et al. (2009)
Table:7 Effect of integrated nutrient management on soil properties
under soybean- onion cropping system .
Treatments pH EC
(dS m-1)
organic carbon
(%)
T1: Control 8.46 0.42 0.49
T2: 50% RDF + 50% N through FYM +
micronutrients as per soil test
8.37 0.34 0.60
T3: 1/3 N Through FYM, vermicompost and
neem seed cake
8.38 0.36 0.58
T4: T3 + trap crop (sunnhemp) 8.42 0.35 0.59
T5: T3 + Handweeding + IPM 8.41 0.37 0.59
T6: 50% N through FYM + Azotobactor + PSB 8.44 0.36 .057
T7:T3 + Azotobactor + PSB 8.41 0.37 0.59
T8: 100% NPK 8.40 0.35 0.54
CD (P=0.05) NS 0.02 0.03
RDF-i.e. Soybean- 50-75-00, onion- 100-50-50 NPK kg/ha
MPKV, Rahuri Khang et al. (2011)
Table:8 Effect of different sunflower based cropping sequences on
sunflower seed equivalent yield and economics (mean data of 5 years)
Cropping sequence Sunflower seed
equivalent yield
(kg/ha
Net returns
( Rs./ha)
B:C ratio
Sunflower- sunflower 1502 11964 2.13
Fallow-sunflower 675 4843 1.92
Green gram-
sunflower
1237 8202 1.79
Soybean-sunflower 1227 7489 1.69
Groundnut-
sunflower
1545 9766 1.72
Set aria- sunflower 1555 13176 2.45
CD ( P=0.05) 186 1732 0.24
Saila and Sridhar (2005)Nandyal,AP
Conclusion:
• From the foregoing discussion, it can be
inferred that combined application of organic
sources, inorganic sources and biofertilizers in
oilseeds based cropping system are found
beneficial to increase crop productivity,
system productivity, quality and economics.
• It also helps in improves soil fertility, physico-
chemical properties and biological properties
of soil.
Thank you

Oil seed based crop

  • 2.
    OILSEED BASE CROPPING SYSTEAMS SUBMITTEDTO: SUBMITTED BY: Dr. H. M. VIRADIA JOSHI JIGARKUMAR R. Associate Professor 2nd Sem. M.sc.(Agri.) Dept. of Agronomy Reg.No-2010114038 N.M.C.A., N.A.U. Dept. of Agronomy NAVSARI – 396 450 N.M.C.A., N.A.U. NAVSARI- 396 45
  • 3.
    Introduction Oilseeds serve asrich source of food, feed, energy and commerce. Oilseeds area and production in Gujarat state constitute about 10.8 % and 14.5 % respectively in India. As per the cropping pattern in Gujarat, oilseeds account for about 23.4 % of GCA. Among the oilseeds, groundnut (14.4%), castor (3.7%), rapeseed-mustard (1.7%), sesamum (1.9%).
  • 4.
    Soil fertility managementis a set of agricultural practices adopted to local conditions to maximize the efficiency of nutrient and improve agricultural productivity. Due to prolonged cultivation of crops with recommended dose of inorganic fertilizers alone, the productivity of soil has gone down and time has come to supplement to inorganic fertilizers with organics and micro-nutrients to sustain the fertility and productivity of the soils (Behera et al., 2007). Keeping this in view it is essential to find out proper fertility management and suitable oilseed based cropping system for sustainable production.
  • 5.
    Area (ha), production( tonnes) and productivity (kg/ha) of total oilseeds during 2010-11 in major producing states State Area (ha) Production (tonnes) Productivity (kg/ha) M.P 75,34,400 92,76,000 1231 Rajasthan 49,12,200 63,64,600 1296 Maharashtra 38,06,000 50,86,800 1337 Gujarat 24,52,000 27,05,000 1103 Andhra Pradesh 19,45,000 16,51,100 849 Karnataka 14,22,000 9,19,600 647 U.P 11,47,000 10,30,500 898 Haryana 580,200 9,93,100 1712 West bangle 732,100 8,50,700 1162 Tamilnadu 388,500 8,16,900 2103 India 2,64,84,400 3,09,41,200 1168 APEDA
  • 6.
    What is croppingsystem?  cropping system It is an important component of a farming system. It represents cropping pattern used on a farm and their interaction with farm resources, other farm enterprises and available technology which determine their make up. • Cropping pattern: The proportion of area undervarious cropsat appoint of time in a unit area. It indicates the yearly sequence and spatial arrangement of cropsand following an area.
  • 7.
    Inter-cropping Ground nut +Pearl millet Soya bean + Maize Sun flower + pigeon pea
  • 8.
  • 9.
    Sequential cropping Cotton +ground nut Pearl millet + potato + groundnut
  • 10.
  • 11.
    Important oilseeds basedcropping system followed in different states of India States Cropping systems Andhra Pradesh, Tamilnadu and Karnataka Rice-groundnut, Rice- sunflower, Rice-castor Rajasthan Groundnut-wheat Gujarat Groundnut + Castor, Paddy-Castor Saurashtra ( Gujarat) Cotton-groundnut Madhya Pradesh Soybean-wheat, groundnut-chickpea, Sorghum-safflower Maharashtra Groundnut-safflower, Sorghum-safflower, Green gram- safflower Tamilnadu Pigeon pea + Groundnut. West Bengal Maize-mustard, Jute-mustard Haryana Rice-mustard Punjab, Uttar Pradesh and Delhi, parts of Bihar Rice-mustard
  • 12.
    Objectives of croppingsystem : • Maximizing system productivity on annual basis • Utilization of resources with higher efficiency by considering various interactions and direct, residual and cumulative effect in soil-plant- environment system • Intensive input use in relation to quality of environment • Sustainability of farm resources and environment in long term perspective.
  • 13.
    Benefits of croppingsystems : • Maintain and enhance soil fertility. Some crops are soil exhausting while others help restore soil fertility. • Enhance crop growth. Crops may provide mutual benefits to each other. • Minimize spread of disease. • Control weeds. Crops planted at different times of the year have different weed species associated with them. • Inhibits pest and insect growth. • Increase soil cover. • Use resource more efficiently. • Reduce risk for crop failure. • Improve food and financial security.
  • 14.
    Table: Nutrient uptakein some cropping systems involving oilseeds Cropping system (t/ha) Nutrient uptake (kg/ha) N P2O5 K2O total Sorghum (3.6)- Groundnut (2.2) 216 74 184 471 Maize (3.0)-Mustard (2.0) 127 70 177 374 Cotton (2.0)- Sunflower (1.8) 203 90 376 669 Soybean( 1.5)-potato (26.0)-wheat (4.0) 305 177 345 827 Sorghum ( 4.0)-Sunflower (1.5)-Groundnut (2.0) 301 121 385 807 Rice (4.8)-Rice (5.7)-Groundnut (2.0) 316 153 369 838 Rice (4.7)-Rice (5.6)-Sesame (0.7) 243 131 354 728 Fodder Sorghum (18.9)-Potato (29.0) Sunflower (1.8) 296 121 481 898 Maize (2.8)-Potato (29.0) Sunflower (1.8) 296 110 479 885 Soybean (1.9)- wheat (4.8) 252 100 267 619 Sunflower (1.6)-Groundnut (3.4) 294 97 304 700
  • 15.
  • 17.
    Table:1 Effect ofnutrient management practices on yield and yield attributes of soybean and wheat under soybean – wheat cropping system Treatment Soybean Wheat Seed Yield (t/ha Stover yield (t/ha) Pl. Height (cm) Seed Yield (t/ha Straw Yield (t/ha) Pl. Height (cm) Nutrient sources CR 5 t/ha 1.33 3.88 60.7 3.65 8.58 94.8 FYM 5 t/ha 1.42 4.03 60.9 3.73 8.70 96.2 T1+T2+Zn 5 kg/ha 1.48 4.06 62.2 3.96 9.19 98.8 CD (P=0.05 0.09 0.28 1.47 0.12 0.36 1.81 Nutrient levels 50% RDF 1.37 3.98 61.5 3.76 8.68 94.9 100% RDF 1.55 4.35 62.7 3.99 9.05 105 CD (P=0.05 0.07 0.20 0.98 0.10 0.28 1.93 CR- wheat crop residues: RDF-i.e. Soybean- 30-33-33, wheat- 120-26-33 NPK kg/ha IARI, New Delhi Shivkumar and Ahlawat (2008)
  • 18.
    Table:2 Effect oforganic with and without fertilizers on yield of paddy and castor under paddy-castor cropping system Treatment Paddy Grain yield (kg/ha) Paddy straw yield (kg/ha) Castor Seed yield (kg/ha) Fertilizer Control 3079 4597 948 75 % RDF 4499 6541 1186 CD (P=0.05) 356 922 288 Organics Control 2934 5182 934 FYM @ 20 t/ha 3881 5373 1129 Sugarcane trash @ 20t/ha 3497 4918 1074 Bio compost @ 20t/ha 4591 6354 1240 Green manuring with dhaincha 4042 6017 1058 CD (P=0.05) 747 986 105 RDF- Rice- 100-30-00 NPK kg/ha Virdia et al. (2011)RRRS,Vyara
  • 19.
    Table:3 Effect ofnutrient management practices on yield under groundnut based cropping system . Treatment Groundnut pod yield ( kg/ha) Wheat grain yield (kg/ha) Sole groundnut 1070 0 Groundnut-wheat (100 % RDF) 1031 2389 Groundnut-wheat (50 % RDF) 980 2293 Groundnut-wheat (50 % RDF + 5t / ha FYM) 976 2608 Groundnut-wheat –greengram (100 % RDF) 930 2595 Groundnut-wheat- greengram (50 % RDF) 973 2326 Groundnut-wheat- greengram (50 % RDF + 5t / ha FYM) 951 2721 CD ( P=0.05) 60 _ RDF-i.e. Groundnut- 12.5-25-00, wheat- 120-60-40 NPK kg/ha Junagadh, Gujarat Jat et al. (2011)
  • 20.
    Table:4 Effect oflong term application of fertilizer and organic manure on yield of soybean and wheat crop under soybean-wheat cropping system Treatments Grain yields (t/ha) Soybean wheat Control 1.04 1.71 50 % NPK 1.20 3.38 100 % NPK 1.53 4.74 150 % NPK 1.56 4.88 100 % NPK+HW 1.47 4.54 100 % NPK+Zn 1.48 4.68 100 % NP 1.29 4.16 100 % N 1.11 2.05 100% NPK+FYM @ 15 t/ha 1.84 5.26 100% NPK-S 1.44 4.45 CD ( P=0.05) 0.25 .064 RDF-i.e. Soybean- 20-80-20, wheat- 120-80-40 NPK kg/ha Jabalpur (MP) Sawarkar et al. (2013)
  • 21.
    Table:5 Effect ofdifferent sunflower based cropping system on Soil fertility (mean data of 5 years). Cropping sequence Soil fertility status after 5 years of experimentation (kg/ha) N P2O5 K2O Initial 270 19.2 291 Sunflower- sunflower 174 12.6 283 Fallow-sunflower 252 17.8 298 Greengram- sunflower 275 19.5 320 Soybean-sunflower 282 19.6 306 Groundnut-sunflower 289 18.9 315 Setaria- sunflower 243 16.7 296 Nandyal, AP Saila and Sridhar (2005)
  • 22.
    Table:6 Effect ofvarious soybean- based cropping systems on soil fertility status Treatment Soil organic carbon (%) Soil available nutrients (kg/ha) N P2O5 K2O Initial 0.53 154.2 12.77 530 Soybean- wheat 0.71 193.2 33.45 624 Soybean- Mustard 0.68 184.3 25.66 598 Soybean- Chickpea 0.62 187.4 20.78 598 Soybean- Isabgol 0.57 169.3 17.77 575 SEm ± 0.02 4.5 1.61 8 CD ( P=0.05) 0.07 13.2 4.73 23 Bhopal, MP Ramesh et al. (2009)
  • 23.
    Table:7 Effect ofintegrated nutrient management on soil properties under soybean- onion cropping system . Treatments pH EC (dS m-1) organic carbon (%) T1: Control 8.46 0.42 0.49 T2: 50% RDF + 50% N through FYM + micronutrients as per soil test 8.37 0.34 0.60 T3: 1/3 N Through FYM, vermicompost and neem seed cake 8.38 0.36 0.58 T4: T3 + trap crop (sunnhemp) 8.42 0.35 0.59 T5: T3 + Handweeding + IPM 8.41 0.37 0.59 T6: 50% N through FYM + Azotobactor + PSB 8.44 0.36 .057 T7:T3 + Azotobactor + PSB 8.41 0.37 0.59 T8: 100% NPK 8.40 0.35 0.54 CD (P=0.05) NS 0.02 0.03 RDF-i.e. Soybean- 50-75-00, onion- 100-50-50 NPK kg/ha MPKV, Rahuri Khang et al. (2011)
  • 24.
    Table:8 Effect ofdifferent sunflower based cropping sequences on sunflower seed equivalent yield and economics (mean data of 5 years) Cropping sequence Sunflower seed equivalent yield (kg/ha Net returns ( Rs./ha) B:C ratio Sunflower- sunflower 1502 11964 2.13 Fallow-sunflower 675 4843 1.92 Green gram- sunflower 1237 8202 1.79 Soybean-sunflower 1227 7489 1.69 Groundnut- sunflower 1545 9766 1.72 Set aria- sunflower 1555 13176 2.45 CD ( P=0.05) 186 1732 0.24 Saila and Sridhar (2005)Nandyal,AP
  • 25.
    Conclusion: • From theforegoing discussion, it can be inferred that combined application of organic sources, inorganic sources and biofertilizers in oilseeds based cropping system are found beneficial to increase crop productivity, system productivity, quality and economics. • It also helps in improves soil fertility, physico- chemical properties and biological properties of soil.
  • 26.