Precision Farming is a modern approach to farming that uses advanced sensors and analysis tools to boost crop yields and make better decisions. It's a global practice aimed at increasing production, saving time and effort in farming, and managing fertilizers and irrigation more efficiently.
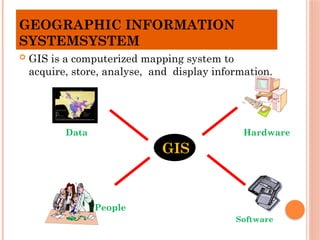
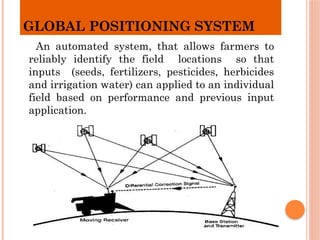
Precision farming combines remote sensing and data collection with Geographic Information Systems (GIS) and Global Positioning Systems (GPS) to enable farmers to adjust crop management to in-field variability. Farmers can control their crops with precision without compromising crop yields.
![Precision nutrient management
Precision nutrient management is a precise method of application of
nutrients, based on the variability in soil and micro-climate condition that
occur within the field. The scale of nutrient management recommendation
domains change ]from larger regions to farms, single fields or even single
parcel within a large field . It may also be referred to as site specific
nutrient management (SNNM).](https://image.slidesharecdn.com/precisionfarming-250722043521-57e93090/85/Precision-Farming-and-Importance-pptx-11-320.jpg)