
Download to read offline
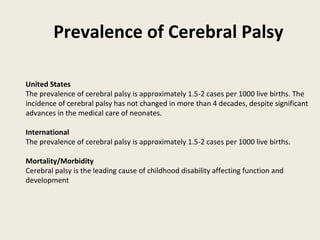
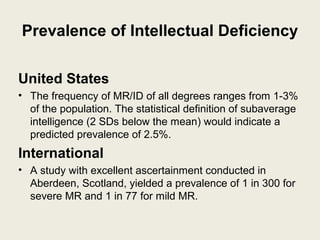
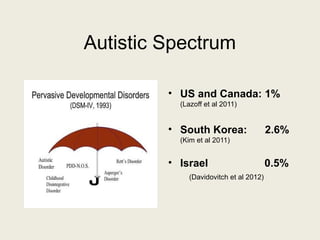


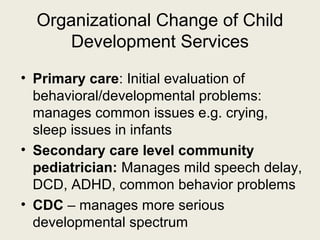
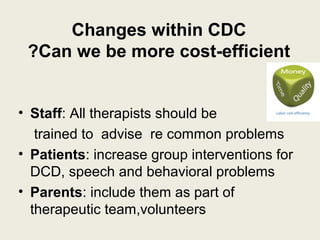
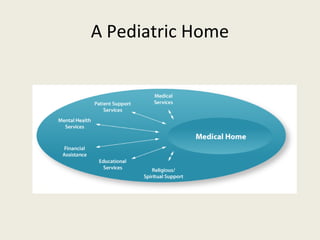
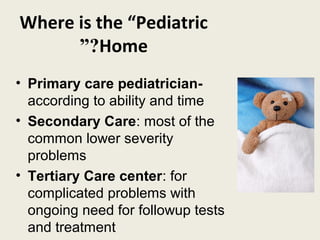

This document discusses prevalence rates for various childhood developmental, intellectual, behavioral, and learning disorders. It provides statistics on conditions such as cerebral palsy (1.5-2 per 1000 births), mild to moderate intellectual disability (1-3% of the population), autism spectrum disorders (ranging from 0.5-2.6% in different countries), and language disorders (7.4-18% in various studies). It also addresses the need for organizational changes to child development services to improve cost-efficiency and increase support for common problems through a primary care model and a proposed "Pediatric Home".


