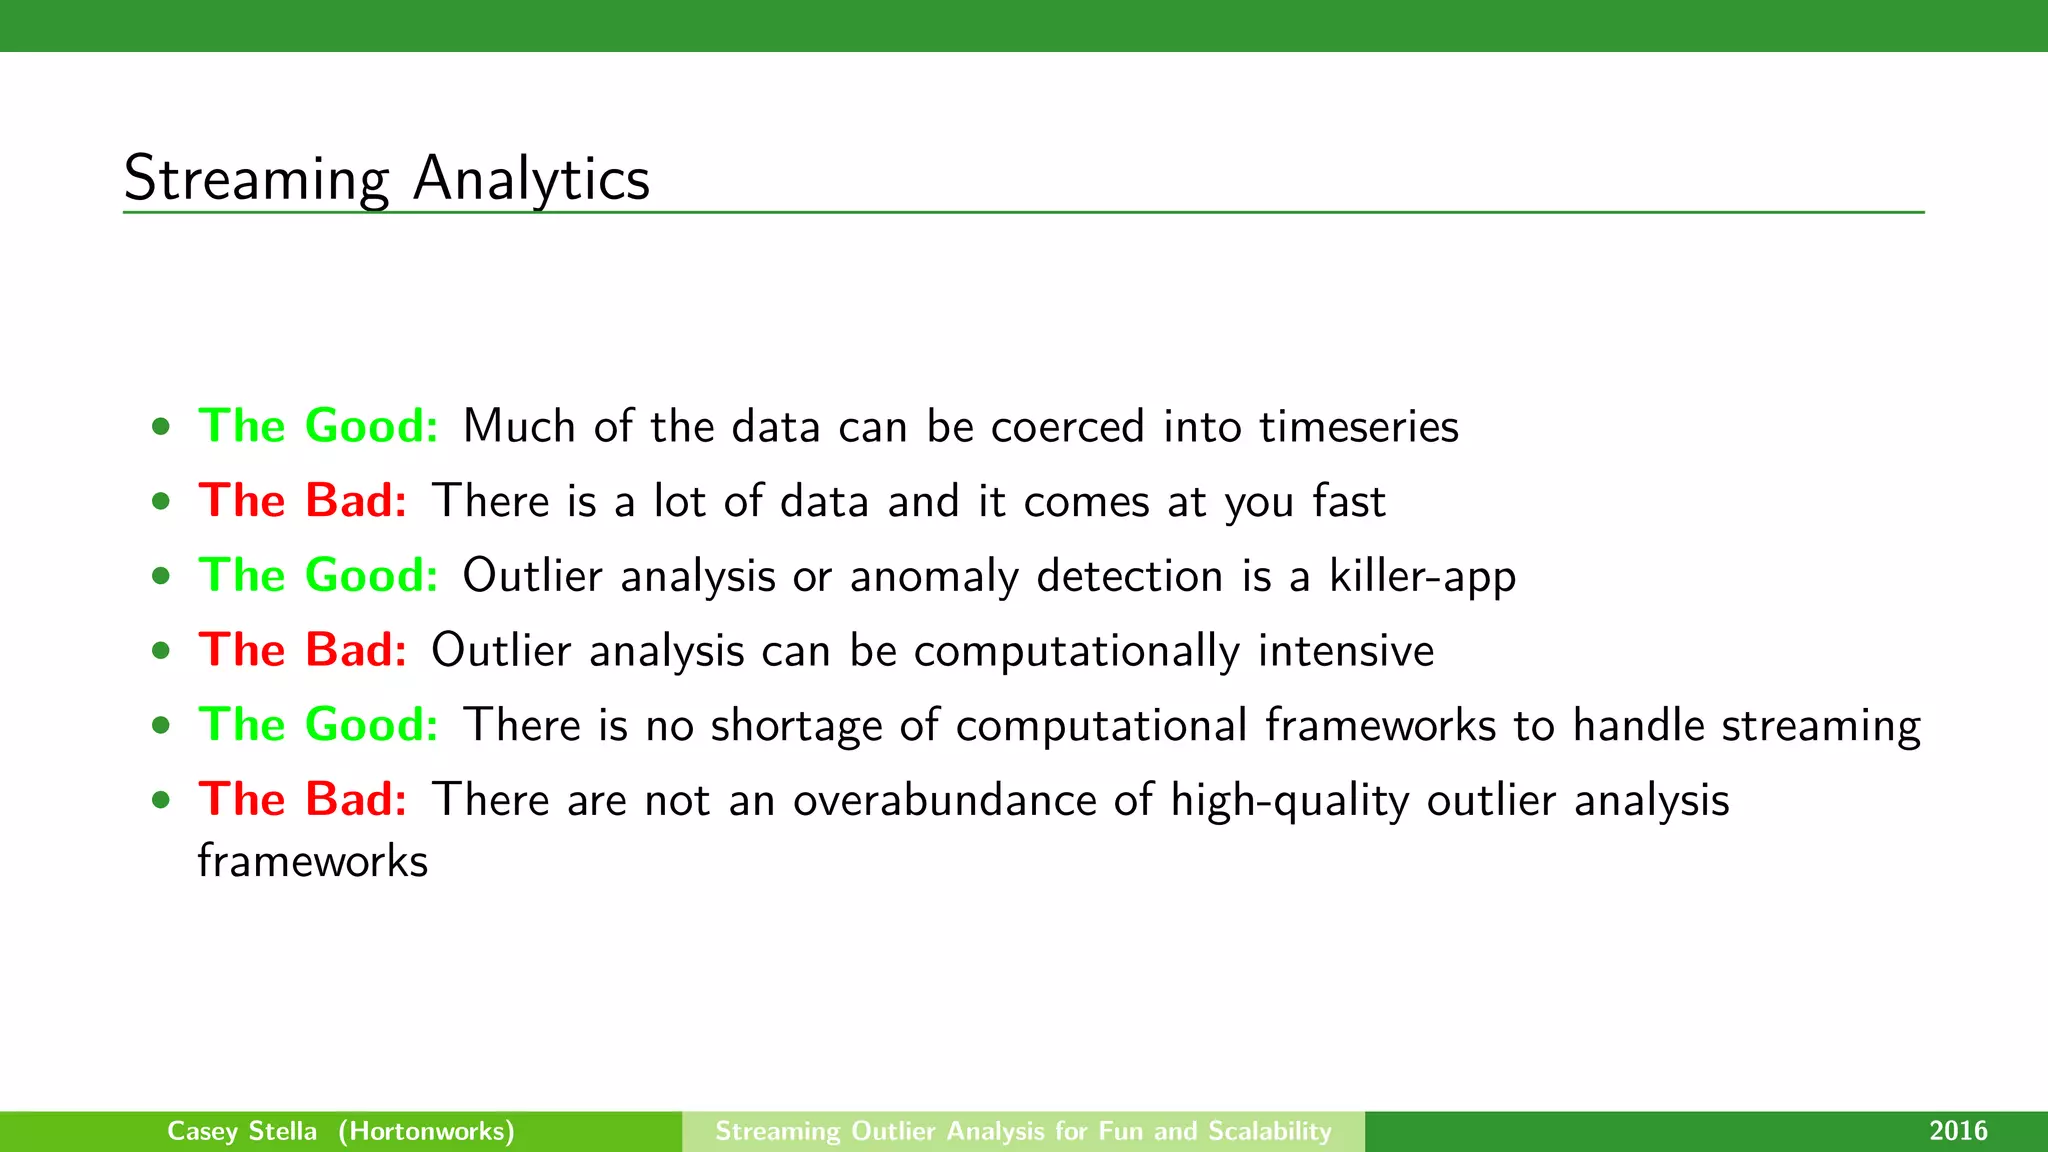
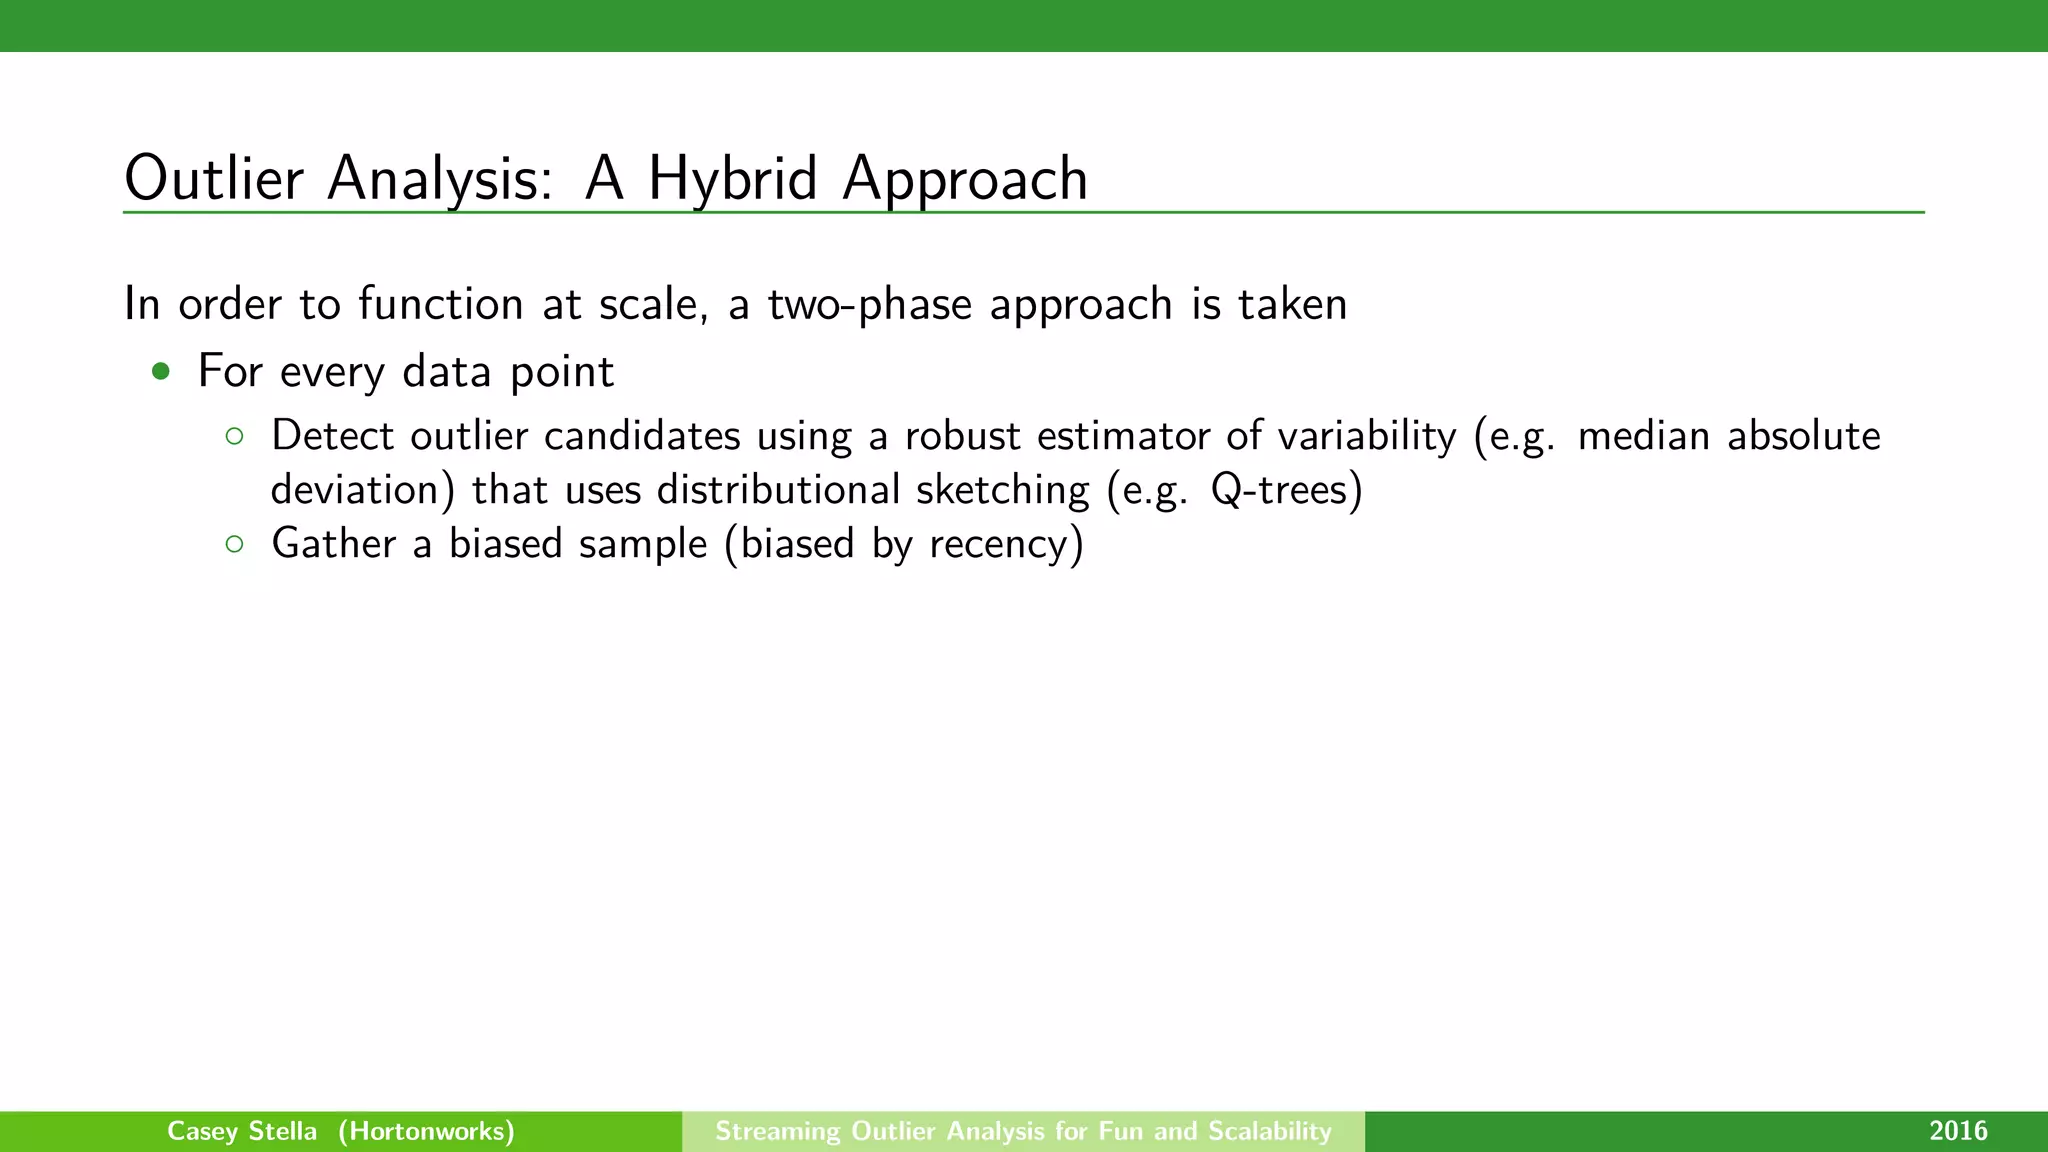
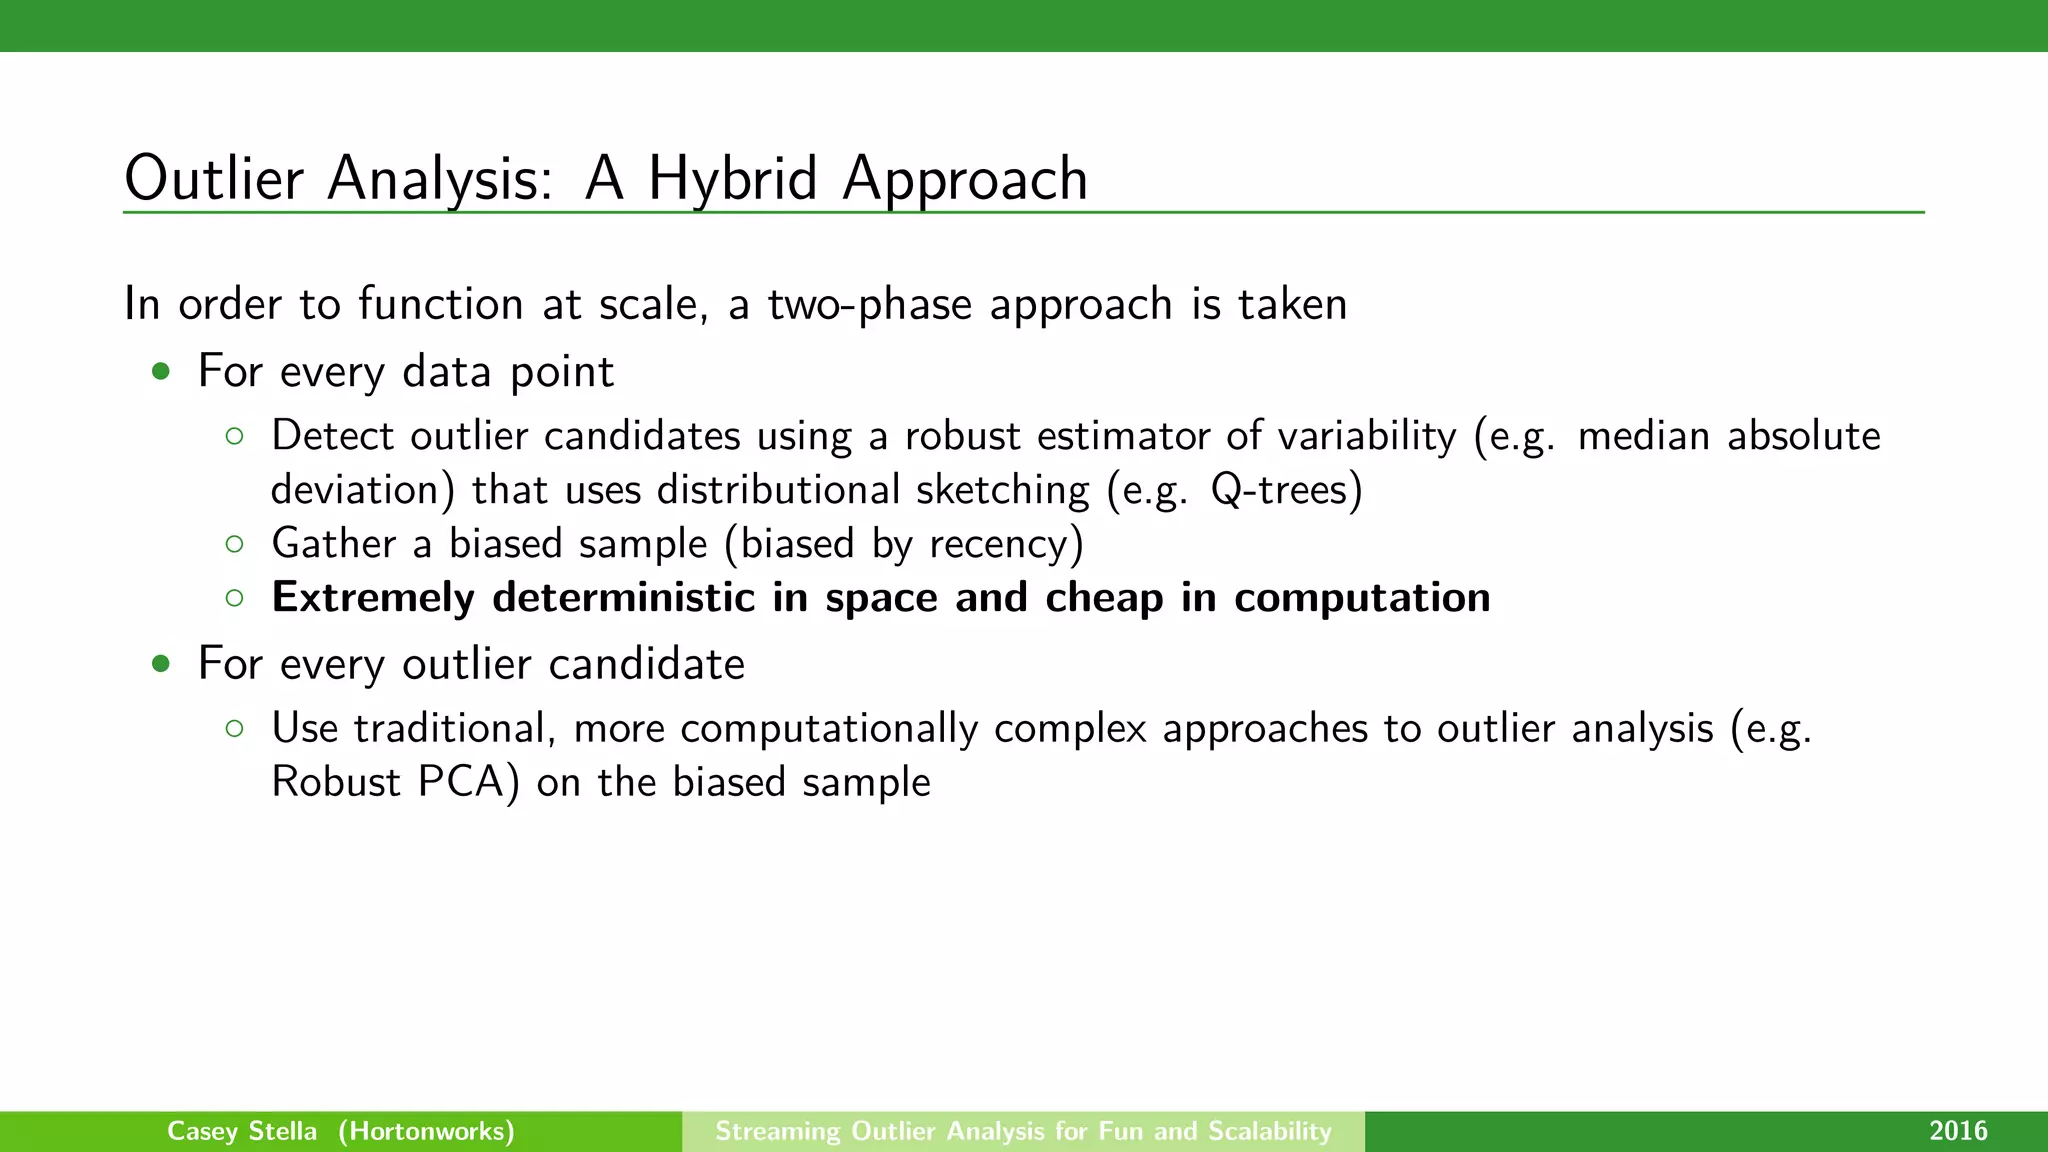
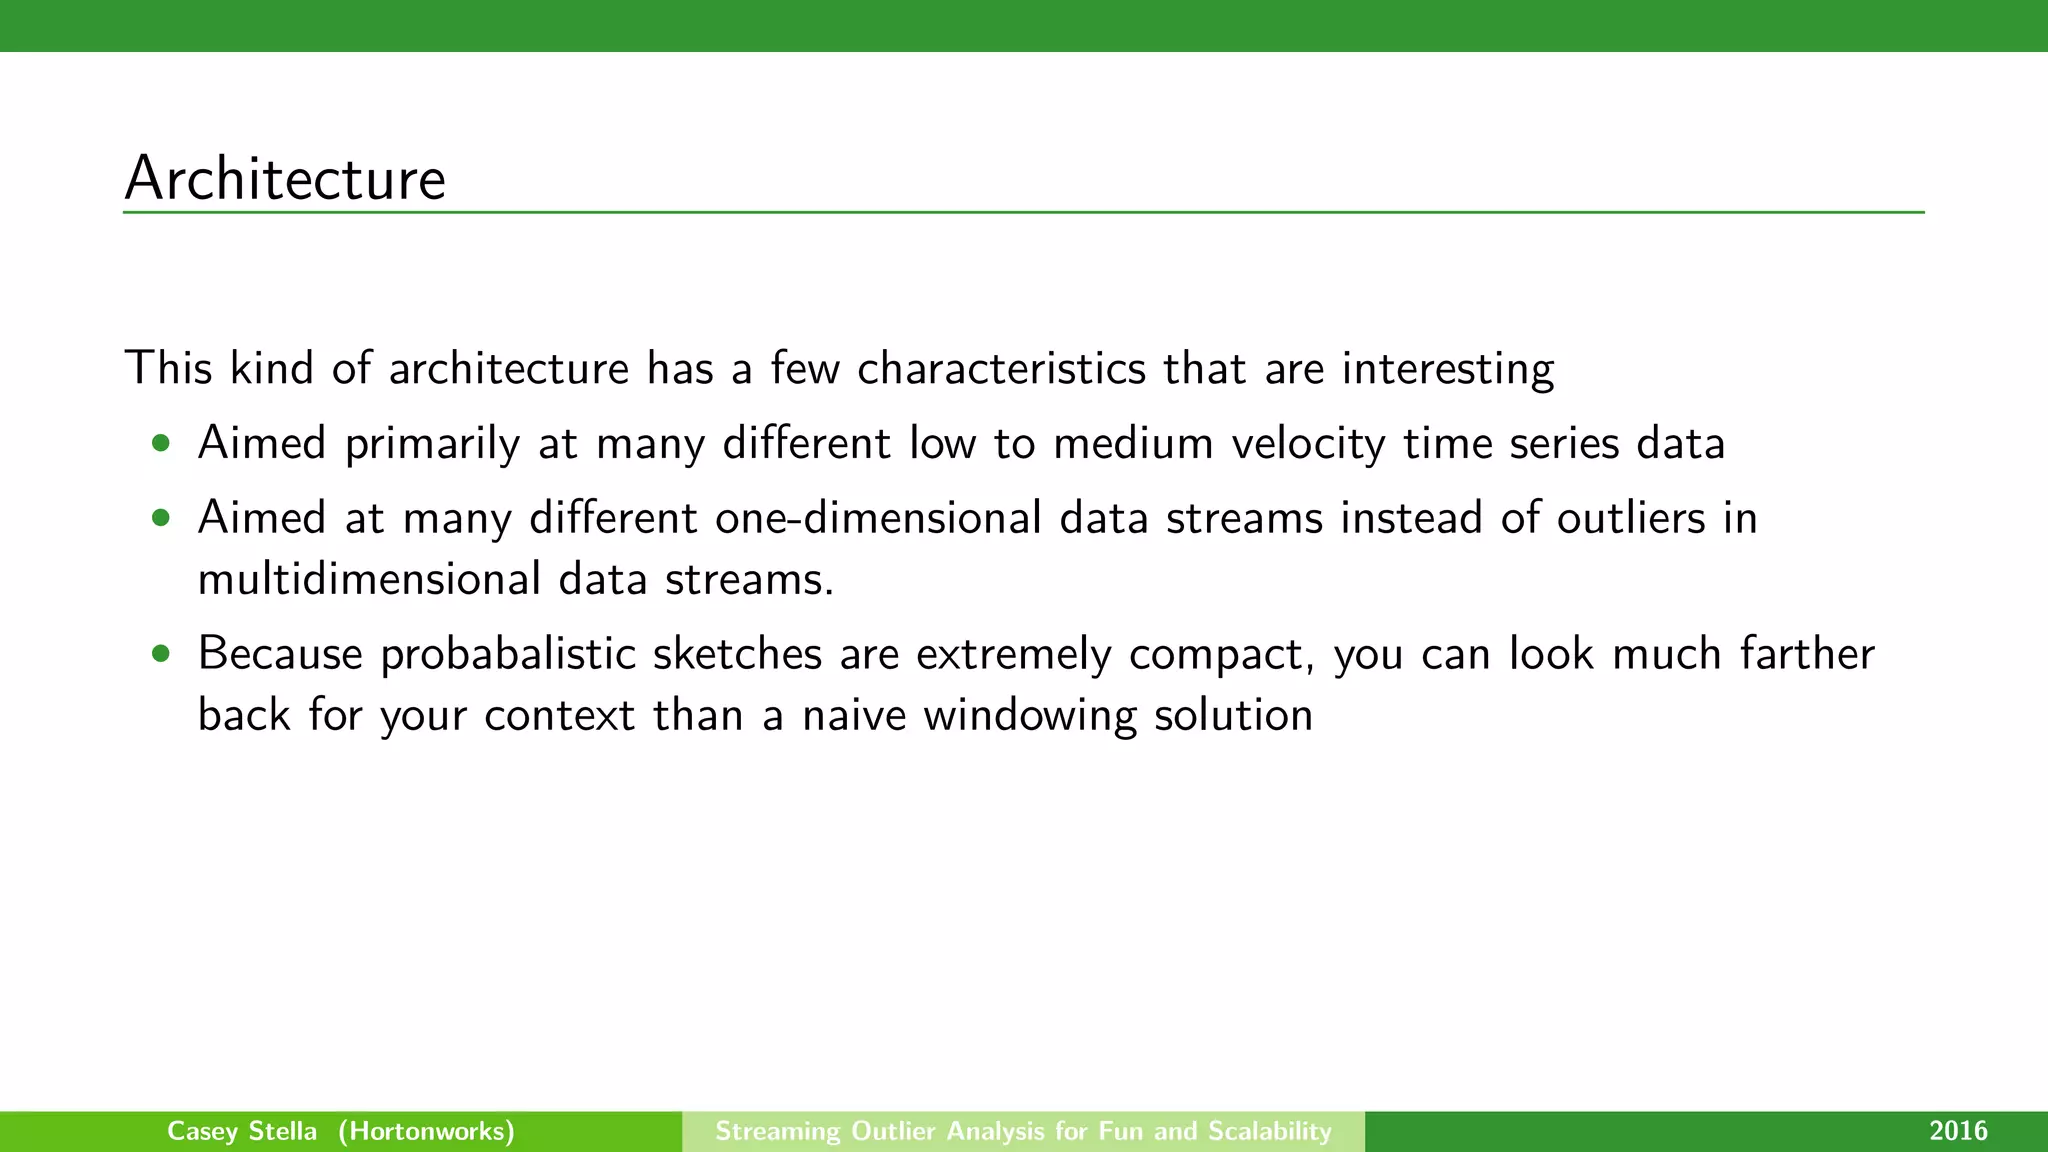
Streaming Outlier Analysis for Fun and Scalability
Casey Stella
2016
Casey Stella (Hortonworks) Streaming Outlier Analysis for Fun and Scalability 2016
Table of Contents
Streaming Analytics
Framework
Demos
Questions
Casey Stella (Hortonworks) Streaming Outlier Analysis for Fun and Scalability 2016
Introduction
Hi, I’m Casey Stella!
Casey Stella (Hortonworks) Streaming Outlier Analysis for Fun and Scalability 2016
Streaming Analytics
• The future involves non-trivial analytics done on streaming data
• It’s not just IoT
• There is a need for insights to keep pace with the velocity of your data
Casey Stella (Hortonworks) Streaming Outlier Analysis for Fun and Scalability 2016
Streaming Analytics
• The Good: Much of the data can be coerced into timeseries
Casey Stella (Hortonworks) Streaming Outlier Analysis for Fun and Scalability 2016
Streaming Analytics
• The Good: Much of the data can be coerced into timeseries
• The Bad: There is a lot of data and it comes at you fast
Casey Stella (Hortonworks) Streaming Outlier Analysis for Fun and Scalability 2016
Streaming Analytics
• The Good: Much of the data can be coerced into timeseries
• The Bad: There is a lot of data and it comes at you fast
• The Good: Outlier analysis or anomaly detection is a killer-app
Casey Stella (Hortonworks) Streaming Outlier Analysis for Fun and Scalability 2016
Streaming Analytics
• The Good: Much of the data can be coerced into timeseries
• The Bad: There is a lot of data and it comes at you fast
• The Good: Outlier analysis or anomaly detection is a killer-app
• The Bad: Outlier analysis can be computationally intensive
• The Good: There is no shortage of computational frameworks to handle streaming
• The Bad: There are not an overabundance of high-quality outlier analysis
frameworks
Casey Stella (Hortonworks) Streaming Outlier Analysis for Fun and Scalability 2016
Outlier Analysis
Outlier analysis or anomaly detection is the analytical technique by which “interesting”
points are differentiated from “normal” points. Often “interesting” implies some sort of
error or state which should be researched further.
1
http://arxiv.org/pdf/1603.00567v1.pdf
Casey Stella (Hortonworks) Streaming Outlier Analysis for Fun and Scalability 2016
Outlier Analysis
Outlier analysis or anomaly detection is the analytical technique by which “interesting”
points are differentiated from “normal” points. Often “interesting” implies some sort of
error or state which should be researched further.
Macrobase1, an outlier analysis system built for IoT by MIT and Stanford and
Cambridge Mobile Telematics, noted several properties of IoT data:
• Data produced by IoT applications often have come from some “ordinary”
distribution
• IoT anomalies are often systemic
• They are often fairly rare
1
http://arxiv.org/pdf/1603.00567v1.pdf
Casey Stella (Hortonworks) Streaming Outlier Analysis for Fun and Scalability 2016
Outlier Analysis: A Hybrid Approach
In order to function at scale, a two-phase approach is taken
• For every data point
Casey Stella (Hortonworks) Streaming Outlier Analysis for Fun and Scalability 2016
Outlier Analysis: A Hybrid Approach
In order to function at scale, a two-phase approach is taken
• For every data point
◦ Detect outlier candidates using a robust estimator of variability (e.g. median absolute
deviation) that uses distributional sketching (e.g. Q-trees)
◦ Gather a biased sample (biased by recency)
◦ Extremely deterministic in space and cheap in computation
• For every outlier candidate
◦ Use traditional, more computationally complex approaches to outlier analysis (e.g.
Robust PCA) on the biased sample
◦ Expensive computationally, but run infrequently
This becomes a data filter which can be attached to a timeseries data stream
within a distributed computational framework (i.e. Storm, Spark, Flink, NiFi)
to detect outliers.
Casey Stella (Hortonworks) Streaming Outlier Analysis for Fun and Scalability 2016
Sketchy Outlier Estimator: Median Absolute Deviation
• Median absolute deviation (or MAD) is a robust statistic
Casey Stella (Hortonworks) Streaming Outlier Analysis for Fun and Scalability 2016
Sketchy Outlier Estimator: Median Absolute Deviation
• Median absolute deviation (or MAD) is a robust statistic
◦ Robust statistics are statistics with good performance for data drawn from a wide range
of non-normally distributed probability distributions
◦ Unlike the standard mean/standard deviation combo, MAD is not sensitive to the
presence of outliers.
• The median absolute deviation is defined for a series of univariate samples X with
˜x =median(X), MAD(X)=median({∀xi ∈ X||xi − ˜x|}).
• A point is considered an outlier if its distance from the current window median,
scaled by the MAD for the previous window, is above a threshold.
tl;dr: A formal way to encode our intuition: If a point is far away from the
“central” point of our window, then it’s likely an outlier.
Casey Stella (Hortonworks) Streaming Outlier Analysis for Fun and Scalability 2016
Architecture
Casey Stella (Hortonworks) Streaming Outlier Analysis for Fun and Scalability 2016
Architecture
This kind of architecture has a few characteristics that are interesting
• Aimed primarily at many different low to medium velocity time series data
Casey Stella (Hortonworks) Streaming Outlier Analysis for Fun and Scalability 2016
Architecture
This kind of architecture has a few characteristics that are interesting
• Aimed primarily at many different low to medium velocity time series data
• Aimed at many different one-dimensional data streams instead of outliers in
multidimensional data streams.
• Because probabalistic sketches are extremely compact, you can look much farther
back for your context than a naive windowing solution
• Send outliers (lower velocity and number) and send raw time series to a TSDB
capable of handling scale. Investigate the data via a dashboard that can marry the
two into a single pane of glass.
Casey Stella (Hortonworks) Streaming Outlier Analysis for Fun and Scalability 2016
Demos
Demos
Casey Stella (Hortonworks) Streaming Outlier Analysis for Fun and Scalability 2016
Questions
Thanks for your attention! Questions?
• Code & scripts for this talk available at
http://github.com/cestella/streaming_outliers
• Find me at http://caseystella.com
• Twitter handle: @casey_stella
• Email address: cstella@hortonworks.com
Casey Stella (Hortonworks) Streaming Outlier Analysis for Fun and Scalability 2016

Spark Summit EU talk by Casey Stella

  • 1.
    Streaming Outlier Analysisfor Fun and Scalability Casey Stella 2016 Casey Stella (Hortonworks) Streaming Outlier Analysis for Fun and Scalability 2016
  • 2.
    Table of Contents StreamingAnalytics Framework Demos Questions Casey Stella (Hortonworks) Streaming Outlier Analysis for Fun and Scalability 2016
  • 3.
    Introduction Hi, I’m CaseyStella! Casey Stella (Hortonworks) Streaming Outlier Analysis for Fun and Scalability 2016
  • 4.
    Streaming Analytics • Thefuture involves non-trivial analytics done on streaming data • It’s not just IoT • There is a need for insights to keep pace with the velocity of your data Casey Stella (Hortonworks) Streaming Outlier Analysis for Fun and Scalability 2016
  • 5.
    Streaming Analytics • TheGood: Much of the data can be coerced into timeseries Casey Stella (Hortonworks) Streaming Outlier Analysis for Fun and Scalability 2016
  • 6.
    Streaming Analytics • TheGood: Much of the data can be coerced into timeseries • The Bad: There is a lot of data and it comes at you fast Casey Stella (Hortonworks) Streaming Outlier Analysis for Fun and Scalability 2016
  • 7.
    Streaming Analytics • TheGood: Much of the data can be coerced into timeseries • The Bad: There is a lot of data and it comes at you fast • The Good: Outlier analysis or anomaly detection is a killer-app Casey Stella (Hortonworks) Streaming Outlier Analysis for Fun and Scalability 2016
  • 8.
    Streaming Analytics • TheGood: Much of the data can be coerced into timeseries • The Bad: There is a lot of data and it comes at you fast • The Good: Outlier analysis or anomaly detection is a killer-app • The Bad: Outlier analysis can be computationally intensive Casey Stella (Hortonworks) Streaming Outlier Analysis for Fun and Scalability 2016
  • 9.
    Streaming Analytics • TheGood: Much of the data can be coerced into timeseries • The Bad: There is a lot of data and it comes at you fast • The Good: Outlier analysis or anomaly detection is a killer-app • The Bad: Outlier analysis can be computationally intensive • The Good: There is no shortage of computational frameworks to handle streaming Casey Stella (Hortonworks) Streaming Outlier Analysis for Fun and Scalability 2016
  • 10.
    Streaming Analytics • TheGood: Much of the data can be coerced into timeseries • The Bad: There is a lot of data and it comes at you fast • The Good: Outlier analysis or anomaly detection is a killer-app • The Bad: Outlier analysis can be computationally intensive • The Good: There is no shortage of computational frameworks to handle streaming • The Bad: There are not an overabundance of high-quality outlier analysis frameworks Casey Stella (Hortonworks) Streaming Outlier Analysis for Fun and Scalability 2016
  • 11.
    Outlier Analysis Outlier analysisor anomaly detection is the analytical technique by which “interesting” points are differentiated from “normal” points. Often “interesting” implies some sort of error or state which should be researched further. 1 http://arxiv.org/pdf/1603.00567v1.pdf Casey Stella (Hortonworks) Streaming Outlier Analysis for Fun and Scalability 2016
  • 12.
    Outlier Analysis Outlier analysisor anomaly detection is the analytical technique by which “interesting” points are differentiated from “normal” points. Often “interesting” implies some sort of error or state which should be researched further. Macrobase1, an outlier analysis system built for IoT by MIT and Stanford and Cambridge Mobile Telematics, noted several properties of IoT data: • Data produced by IoT applications often have come from some “ordinary” distribution • IoT anomalies are often systemic • They are often fairly rare 1 http://arxiv.org/pdf/1603.00567v1.pdf Casey Stella (Hortonworks) Streaming Outlier Analysis for Fun and Scalability 2016
  • 13.
    Outlier Analysis: AHybrid Approach In order to function at scale, a two-phase approach is taken • For every data point Casey Stella (Hortonworks) Streaming Outlier Analysis for Fun and Scalability 2016
  • 14.
    Outlier Analysis: AHybrid Approach In order to function at scale, a two-phase approach is taken • For every data point ◦ Detect outlier candidates using a robust estimator of variability (e.g. median absolute deviation) that uses distributional sketching (e.g. Q-trees) ◦ Gather a biased sample (biased by recency) Casey Stella (Hortonworks) Streaming Outlier Analysis for Fun and Scalability 2016
  • 15.
    Outlier Analysis: AHybrid Approach In order to function at scale, a two-phase approach is taken • For every data point ◦ Detect outlier candidates using a robust estimator of variability (e.g. median absolute deviation) that uses distributional sketching (e.g. Q-trees) ◦ Gather a biased sample (biased by recency) ◦ Extremely deterministic in space and cheap in computation Casey Stella (Hortonworks) Streaming Outlier Analysis for Fun and Scalability 2016
  • 16.
    Outlier Analysis: AHybrid Approach In order to function at scale, a two-phase approach is taken • For every data point ◦ Detect outlier candidates using a robust estimator of variability (e.g. median absolute deviation) that uses distributional sketching (e.g. Q-trees) ◦ Gather a biased sample (biased by recency) ◦ Extremely deterministic in space and cheap in computation • For every outlier candidate ◦ Use traditional, more computationally complex approaches to outlier analysis (e.g. Robust PCA) on the biased sample Casey Stella (Hortonworks) Streaming Outlier Analysis for Fun and Scalability 2016
  • 17.
    Outlier Analysis: AHybrid Approach In order to function at scale, a two-phase approach is taken • For every data point ◦ Detect outlier candidates using a robust estimator of variability (e.g. median absolute deviation) that uses distributional sketching (e.g. Q-trees) ◦ Gather a biased sample (biased by recency) ◦ Extremely deterministic in space and cheap in computation • For every outlier candidate ◦ Use traditional, more computationally complex approaches to outlier analysis (e.g. Robust PCA) on the biased sample ◦ Expensive computationally, but run infrequently Casey Stella (Hortonworks) Streaming Outlier Analysis for Fun and Scalability 2016
  • 18.
    Outlier Analysis: AHybrid Approach In order to function at scale, a two-phase approach is taken • For every data point ◦ Detect outlier candidates using a robust estimator of variability (e.g. median absolute deviation) that uses distributional sketching (e.g. Q-trees) ◦ Gather a biased sample (biased by recency) ◦ Extremely deterministic in space and cheap in computation • For every outlier candidate ◦ Use traditional, more computationally complex approaches to outlier analysis (e.g. Robust PCA) on the biased sample ◦ Expensive computationally, but run infrequently This becomes a data filter which can be attached to a timeseries data stream within a distributed computational framework (i.e. Storm, Spark, Flink, NiFi) to detect outliers. Casey Stella (Hortonworks) Streaming Outlier Analysis for Fun and Scalability 2016
  • 19.
    Sketchy Outlier Estimator:Median Absolute Deviation • Median absolute deviation (or MAD) is a robust statistic Casey Stella (Hortonworks) Streaming Outlier Analysis for Fun and Scalability 2016
  • 20.
    Sketchy Outlier Estimator:Median Absolute Deviation • Median absolute deviation (or MAD) is a robust statistic ◦ Robust statistics are statistics with good performance for data drawn from a wide range of non-normally distributed probability distributions ◦ Unlike the standard mean/standard deviation combo, MAD is not sensitive to the presence of outliers. Casey Stella (Hortonworks) Streaming Outlier Analysis for Fun and Scalability 2016
  • 21.
    Sketchy Outlier Estimator:Median Absolute Deviation • Median absolute deviation (or MAD) is a robust statistic ◦ Robust statistics are statistics with good performance for data drawn from a wide range of non-normally distributed probability distributions ◦ Unlike the standard mean/standard deviation combo, MAD is not sensitive to the presence of outliers. • The median absolute deviation is defined for a series of univariate samples X with ˜x =median(X), MAD(X)=median({∀xi ∈ X||xi − ˜x|}). Casey Stella (Hortonworks) Streaming Outlier Analysis for Fun and Scalability 2016
  • 22.
    Sketchy Outlier Estimator:Median Absolute Deviation • Median absolute deviation (or MAD) is a robust statistic ◦ Robust statistics are statistics with good performance for data drawn from a wide range of non-normally distributed probability distributions ◦ Unlike the standard mean/standard deviation combo, MAD is not sensitive to the presence of outliers. • The median absolute deviation is defined for a series of univariate samples X with ˜x =median(X), MAD(X)=median({∀xi ∈ X||xi − ˜x|}). • A point is considered an outlier if its distance from the current window median, scaled by the MAD for the previous window, is above a threshold. Casey Stella (Hortonworks) Streaming Outlier Analysis for Fun and Scalability 2016
  • 23.
    Sketchy Outlier Estimator:Median Absolute Deviation • Median absolute deviation (or MAD) is a robust statistic ◦ Robust statistics are statistics with good performance for data drawn from a wide range of non-normally distributed probability distributions ◦ Unlike the standard mean/standard deviation combo, MAD is not sensitive to the presence of outliers. • The median absolute deviation is defined for a series of univariate samples X with ˜x =median(X), MAD(X)=median({∀xi ∈ X||xi − ˜x|}). • A point is considered an outlier if its distance from the current window median, scaled by the MAD for the previous window, is above a threshold. tl;dr: A formal way to encode our intuition: If a point is far away from the “central” point of our window, then it’s likely an outlier. Casey Stella (Hortonworks) Streaming Outlier Analysis for Fun and Scalability 2016
  • 24.
    Architecture Casey Stella (Hortonworks)Streaming Outlier Analysis for Fun and Scalability 2016
  • 25.
    Architecture This kind ofarchitecture has a few characteristics that are interesting • Aimed primarily at many different low to medium velocity time series data Casey Stella (Hortonworks) Streaming Outlier Analysis for Fun and Scalability 2016
  • 26.
    Architecture This kind ofarchitecture has a few characteristics that are interesting • Aimed primarily at many different low to medium velocity time series data • Aimed at many different one-dimensional data streams instead of outliers in multidimensional data streams. Casey Stella (Hortonworks) Streaming Outlier Analysis for Fun and Scalability 2016
  • 27.
    Architecture This kind ofarchitecture has a few characteristics that are interesting • Aimed primarily at many different low to medium velocity time series data • Aimed at many different one-dimensional data streams instead of outliers in multidimensional data streams. • Because probabalistic sketches are extremely compact, you can look much farther back for your context than a naive windowing solution Casey Stella (Hortonworks) Streaming Outlier Analysis for Fun and Scalability 2016
  • 28.
    Architecture This kind ofarchitecture has a few characteristics that are interesting • Aimed primarily at many different low to medium velocity time series data • Aimed at many different one-dimensional data streams instead of outliers in multidimensional data streams. • Because probabalistic sketches are extremely compact, you can look much farther back for your context than a naive windowing solution • Send outliers (lower velocity and number) and send raw time series to a TSDB capable of handling scale. Investigate the data via a dashboard that can marry the two into a single pane of glass. Casey Stella (Hortonworks) Streaming Outlier Analysis for Fun and Scalability 2016
  • 29.
    Demos Demos Casey Stella (Hortonworks)Streaming Outlier Analysis for Fun and Scalability 2016
  • 30.
    Questions Thanks for yourattention! Questions? • Code & scripts for this talk available at http://github.com/cestella/streaming_outliers • Find me at http://caseystella.com • Twitter handle: @casey_stella • Email address: cstella@hortonworks.com Casey Stella (Hortonworks) Streaming Outlier Analysis for Fun and Scalability 2016