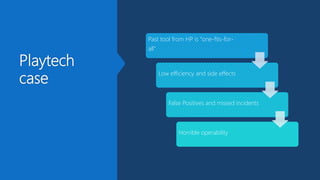
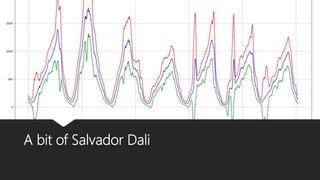
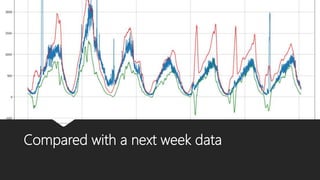
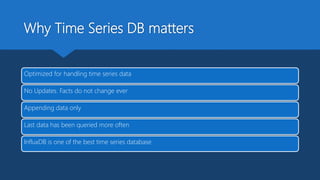
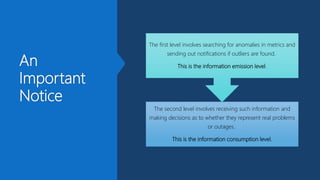
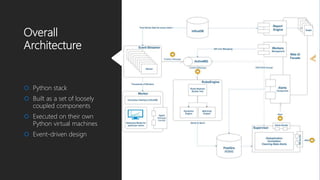
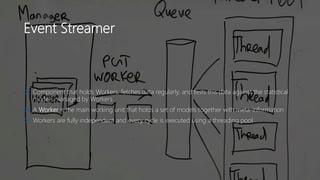
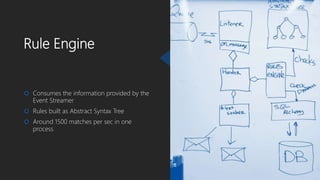
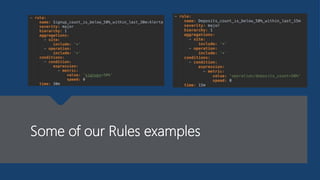
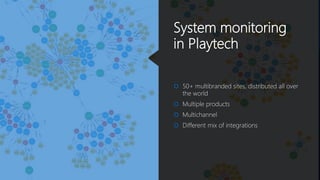
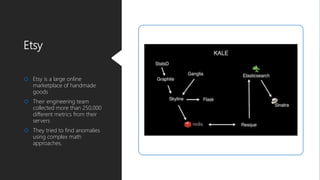
Never Fail Twice
How Playtech Mastered Failure Detection Across Distributed Systems
Bio
 Technical Architect with more than 18 y. of experience
 Passionate about IT
 Financial and Data Science background
 Last years in Research and Design projects
Agenda
• What is observability and monitoring
• Why this is hard
• Possible approaches
• How we solved it
• Future of the instrumentation and observability
Objectives
 Get in touch with time-series analysis
 Understanding Distributed Systems pro’s and con’s
 Understanding observability and instrumentation concepts
Observability
 Monitoring is for operating software/systems
 Instrumentation is for writing software
 Observability is for understanding systems
Charity Majors
Why is it difficult
 1. Various problems may lead to non-obvious system behaviour.
 2. Various metrics may have different correlations in time and space.
 3. Monitoring a complex application is a significant engineering endeavor in and of itself.
 4. There is a mix of different measurements and metrics.
System monitoring
in Playtech
 50+ multibranded sites, distributed all over
the world
 Multiple products
 Multichannel
 Different mix of integrations
On the shoulders of giants
A lot of companies
built their own
solutions for
monitoring their
systems.
There was not
always success
stories.
Etsy
 Etsy is a large online
marketplace of handmade
goods
 Their engineering team
collected more than 250,000
different metrics from their
servers
 They tried to find anomalies
using complex math
approaches.
Lessons
learnt from
KALE 1.0
Anomalies in other metrics should be used for root cause
analysis.
Alerts should only be sent out when anomalies are detected in
business and user metrics
A one-size-fits-all type of approach will probably not fit
at all
Anomaly detection is more than just outlier detection
Google SRE team’s BorgMon
 Google has trended toward simpler and faster monitoring
systems, with better tools for post hoc analysis
 [They] avoid “magic” systems that try to learn thresholds or
automatically detect causality
 Rules that generate alerts for humans should be simple to
understand and represent a clear failure
According to the authors of Site Reliability Engineering
Playtech
case
Past tool from HP is “one-fits-for-
all”
Low efficiency and side effects
False Positives and missed incidents
Horrible operability
Time Series
 A time series is a series of data points indexed (or listed or graphed) in time order
 Economical processes have a regular structure
 These are amount of sales in the shops, production of champagne, online transactions
 Usually they have seasonal periods and trend lines
 Using this information, simplifies analysis
Stationary Time-Series Data
 Is a stochastic process, which characteristics does not change
 White noise
Non Stationary Time Series
 Trend line
 Dispersion change
How to model that?
 Every measurement consists of a signal and an error
component/noise, because our processes are affected by many
factors
 Point_of_measurement = signal + error
 Subtract the model’s values from our measurements
 The more our model resembles the real signal, the more our
residue will approximate the error component or stationarity or
white noise
Example
Cut 30 min data piece
Regression or finding a trend line
Trend line subtracted
Looks like white noise
Dickey-Fuller test of an initial piece of data
Stationary hypothesis rejected
And after subtraction
Result is a stationary time series
Let’s take a moving average from our example
A bit of Salvador Dali
Compared with a next week data
Why Time Series DB matters
Optimized for handling time series data
No Updates. Facts do not change ever
Appending data only
Last data has been queried more often
InfluxDB is one of the best time series database
An
Important
Notice
The second level involves receiving such information and
making decisions as to whether they represent real problems
or outages.
This is the information consumption level.
The first level involves searching for anomalies in metrics and
sending out notifications if outliers are found.
This is the information emission level.
Overall
Architecture
 Python stack
 Built as a set of loosely
coupled components
 Executed on their own
Python virtual machines
 Event-driven design
Event Streamer
 Component that holds Workers, fetches data regularly, and tests this data against the statistical
models managed by Workers
 A Worker is the main working unit that holds a set of models together with meta-information
 Workers are fully independent and every cycle is executed using a threading pool
Rule Engine
 Consumes the information provided by the
Event Streamer
 Rules built as Abstract Syntax Tree
 Around 1500 matches per sec in one
process
We also measure dynamics
 We can take into account the speed and acceleration of the degradation of the metrics
 It correspond to, respectively, the severity and the predicted change in the severity of the incident
 Speed is an angular coefficient or a discrete derivative of a particular metric, which is calculated
for every violation
 The same applies to acceleration or the second order derivative
Some of our Rules examples
Model ensemble can be fine tuned
For every alert report is created
Alerta – open-source product for alerts
aggregation
Non Functional Moments
What future brings us
Q&A
 Thank you very much
 aleks.tavgen@gmail.com
 https://medium.com/@ATavgen/time-series-modelling-a9bf4f467687
 https://medium.com/@ATavgen/never-fail-twice-608147cb49b

Monitoring Distributed Systems

  • 1.
    Never Fail Twice HowPlaytech Mastered Failure Detection Across Distributed Systems
  • 2.
    Bio  Technical Architectwith more than 18 y. of experience  Passionate about IT  Financial and Data Science background  Last years in Research and Design projects
  • 3.
    Agenda • What isobservability and monitoring • Why this is hard • Possible approaches • How we solved it • Future of the instrumentation and observability
  • 4.
    Objectives  Get intouch with time-series analysis  Understanding Distributed Systems pro’s and con’s  Understanding observability and instrumentation concepts
  • 5.
    Observability  Monitoring isfor operating software/systems  Instrumentation is for writing software  Observability is for understanding systems Charity Majors
  • 6.
    Why is itdifficult  1. Various problems may lead to non-obvious system behaviour.  2. Various metrics may have different correlations in time and space.  3. Monitoring a complex application is a significant engineering endeavor in and of itself.  4. There is a mix of different measurements and metrics.
  • 7.
    System monitoring in Playtech 50+ multibranded sites, distributed all over the world  Multiple products  Multichannel  Different mix of integrations
  • 8.
    On the shouldersof giants A lot of companies built their own solutions for monitoring their systems. There was not always success stories.
  • 9.
    Etsy  Etsy isa large online marketplace of handmade goods  Their engineering team collected more than 250,000 different metrics from their servers  They tried to find anomalies using complex math approaches.
  • 10.
    Lessons learnt from KALE 1.0 Anomaliesin other metrics should be used for root cause analysis. Alerts should only be sent out when anomalies are detected in business and user metrics A one-size-fits-all type of approach will probably not fit at all Anomaly detection is more than just outlier detection
  • 11.
    Google SRE team’sBorgMon  Google has trended toward simpler and faster monitoring systems, with better tools for post hoc analysis  [They] avoid “magic” systems that try to learn thresholds or automatically detect causality  Rules that generate alerts for humans should be simple to understand and represent a clear failure According to the authors of Site Reliability Engineering
  • 12.
    Playtech case Past tool fromHP is “one-fits-for- all” Low efficiency and side effects False Positives and missed incidents Horrible operability
  • 13.
    Time Series  Atime series is a series of data points indexed (or listed or graphed) in time order  Economical processes have a regular structure  These are amount of sales in the shops, production of champagne, online transactions  Usually they have seasonal periods and trend lines  Using this information, simplifies analysis
  • 14.
    Stationary Time-Series Data Is a stochastic process, which characteristics does not change  White noise
  • 15.
    Non Stationary TimeSeries  Trend line  Dispersion change
  • 16.
    How to modelthat?  Every measurement consists of a signal and an error component/noise, because our processes are affected by many factors  Point_of_measurement = signal + error  Subtract the model’s values from our measurements  The more our model resembles the real signal, the more our residue will approximate the error component or stationarity or white noise
  • 17.
  • 18.
    Cut 30 mindata piece
  • 19.
  • 20.
  • 21.
    Dickey-Fuller test ofan initial piece of data Stationary hypothesis rejected
  • 22.
    And after subtraction Resultis a stationary time series
  • 23.
    Let’s take amoving average from our example
  • 24.
    A bit ofSalvador Dali
  • 25.
    Compared with anext week data
  • 26.
    Why Time SeriesDB matters Optimized for handling time series data No Updates. Facts do not change ever Appending data only Last data has been queried more often InfluxDB is one of the best time series database
  • 27.
    An Important Notice The second levelinvolves receiving such information and making decisions as to whether they represent real problems or outages. This is the information consumption level. The first level involves searching for anomalies in metrics and sending out notifications if outliers are found. This is the information emission level.
  • 28.
    Overall Architecture  Python stack Built as a set of loosely coupled components  Executed on their own Python virtual machines  Event-driven design
  • 29.
    Event Streamer  Componentthat holds Workers, fetches data regularly, and tests this data against the statistical models managed by Workers  A Worker is the main working unit that holds a set of models together with meta-information  Workers are fully independent and every cycle is executed using a threading pool
  • 30.
    Rule Engine  Consumesthe information provided by the Event Streamer  Rules built as Abstract Syntax Tree  Around 1500 matches per sec in one process
  • 31.
    We also measuredynamics  We can take into account the speed and acceleration of the degradation of the metrics  It correspond to, respectively, the severity and the predicted change in the severity of the incident  Speed is an angular coefficient or a discrete derivative of a particular metric, which is calculated for every violation  The same applies to acceleration or the second order derivative
  • 32.
    Some of ourRules examples
  • 33.
    Model ensemble canbe fine tuned
  • 34.
    For every alertreport is created
  • 35.
    Alerta – open-sourceproduct for alerts aggregation
  • 36.
  • 37.
  • 38.
    Q&A  Thank youvery much  aleks.tavgen@gmail.com  https://medium.com/@ATavgen/time-series-modelling-a9bf4f467687  https://medium.com/@ATavgen/never-fail-twice-608147cb49b

Editor's Notes

  • #8 Во-первых, из-за высокой сложности продуктов и огромного количества настроек существуют ситуации, когда неправильные настройки приводят к деградации финансовых показателей, или скрытые баги в логике отражаются на общем функционале всей системы.  Во-вторых, есть специфические 3d-party интеграции для разных стран, и проблемы, возникающие у партнеров, начинают протекать к нам. Проблемы такого рода не ловятся low level monitoring; для их решения нужно мониторить ключевые индикаторы (KPI), сравнивать их со статистикой по системе и искать корреляции. В компании было ранее внедрено решение от Hewlett Packard Service Health Analyzer, которое было (мягко говоря) неидеально. Судя по маркетинговому проспекту, это система, которая сама обучается и обеспечивает раннее обнаружение проблем (SHA can take data streams from multiple sources and apply advanced, predictive algorithms in order to alert to and diagnose potential problems before they occur). По факту же это был черный ящик, который невозможно настроить, со всеми проблемами нужно было обращаться в HP и ждать месяцами, пока инженеры поддержки сделают что-то, что тоже не будет работать, как нужно. А еще — ужасный пользовательский интерфейс, старая JVM экосистема (Java 6.0), и, что самое главное — большое число False Positives и (что еще хуже) False Negatives, то есть некоторые серьезные проблемы либо не обнаруживались, либо были пойманы намного позже чем следует, что выражалось во вполне конкретном финансовом убытке.
  • #28 Опыт проекта Kale говорит об очень важном моменте. Алертинг — это не то же самое, что и поиск аномалий и outliers в метриках, поскольку, как уже говорилось, аномалии на единичных метриках будут всегда.  В действительности, у нас есть два логических уровня.  — Первый — это поиск аномалий в метриках и посылка нотификации о нарушении, если аномалия найдена. Это уровень эмиссии информации.  — Второй уровень — это компонент, получающий информацию о нарушениях и принимающий решения о том, является это критическим инцидентом или нет.  Таким образом действуем и мы, люди, когда исследуем проблему. Мы смотрим на что-либо, при обнаружении отклонений от нормы смотрим еще, и затем принимаем решение на основании наблюдений. В начале проекта мы решили попробовать Kapacitor, поскольку в нем есть возможность определения пользовательских функций на Python. Но каждая функция сидит в отдельном процессе, что создало бы overhead для сотен и тысяч метрик. Из-за этой и некоторых других проблем от него решено было отказаться. Для построения собственной системы в качестве основного стека был выбран Python, поскольку существует отличная экосистема для анализа данных, быстрые библиотеки (pandas, numpy и т.д.), отличная поддержка веб-решений. You name it. Для меня это был первый большой проект, целиком и полностью выполненный на Python. Сам я пришел к Python из Java мира. Мне не хотелось множить зоопарк стеков для одной системы, что в конечном счете было вознаграждено.
  • #29 Общая архитектура. Система построена в виде набора слабо связанных компонентов или сервисов, которые крутятся в своих процессах на своих Python VM. Это естественно для общего логического разбиения (events emitter / rules engine) и дает другие плюсы. Каждый компонент делает ограниченное количество специфических вещей. В дaльнейшем это позволит очень быстро расширять систему и добавлять новые пользовательские интерфейсы, не затрагивая основную логику и не боясь ее сломать. Между компонентами проведены достаточно четкие границы. Распределенный deploy удобен, если нужно разместить агент локально к ближе к сайту, который он мониторит — или же можно аггрегировать вместе большое количество разных систем.  Коммуникация должна быть построена на базе сообщений, поскольку вся система должна быть асинхронной.  В качестве Message Queue я выбрал ActiveMQ, но при желании сменить, например, на RabbitMQ, проблем не возникнет, поскольку все компоненты общаются по стандартному протоколу STOMP.
  • #30 Worker — это основной рабочий юнит, который хранит одну модель одной метрики вместе с мета-информацией. Он состоит из дата коннектора и хендлера, которому передает данные. Хендлер тестирует их на статистической модели, и если обнаруживает нарушения, то передает их агенту, который посылает событие в очередь. Workers полностью независимы друг от друга, каждый цикл выполняется через пул потоков. Поскольку большая часть времени тратится на I/O операции, то Global Interpreter Lock Python не сильно влияет на результат. Количество потоков ставится в конфиге; на текущей конфигурации оптимальным количеством оказалось 8 потоков. Information emmiter
  • #31 Information consuming Каждое сообщение отправляется в Rule Engine, и тут начинается самое интересное. В самом начале разработки я жестко задал правила в коде: когда одна метрика падает, а другая растет, то послать алерт. Но это решение не универсально и требует залезать в код для любого расширения. Поэтому нужен был какой-то язык, задающий правила. Тут пришлось вспоминать Абстрактные Синтаксические Деревья и дефинировать простой язык для описания правил. При запуске компонента правила считываются и строится синтаксическое дерево. При получении каждого сообщения все события с этого сайта за один тик проверяются согласно заданным правилам, и если правило срабатывает, то генерируется алерт. Сработавших правил может быть несколько. Если рассматривать динамику инцидентов, развивающихся во времени, то можно учитывать также скорость падения (уровень severity) и изменение скорости (прогноз изменения severity)
  • #32 Скорость — это угловой коэффициент или дискретная производная, который подсчитывается для каждого нарушения. То же касается и акселерации, дискретной производной второго порядка. Это значения можно задавать в правилах. Кумулятивные производные первых и вторых порядков могут учитываться в общей оценке инцидента.
  • #33 Правила описываются в формате YAML, но можно использовать любой другой, достаточно добавить свой парсер. Правила задаются в виде регулярных выражений имен метрик или просто префиксов метрик. Speed — это скорость деградации метрик, об этом ниже.
  • #37 SHA required Oracle server tens of Gb Ram PT-Pas 28962 lines of code. 1500 matches/per sec one process, up to 125 000 matches in current configuration (sharding probabilities)
  • #38 Non funfunc 28982 LOC