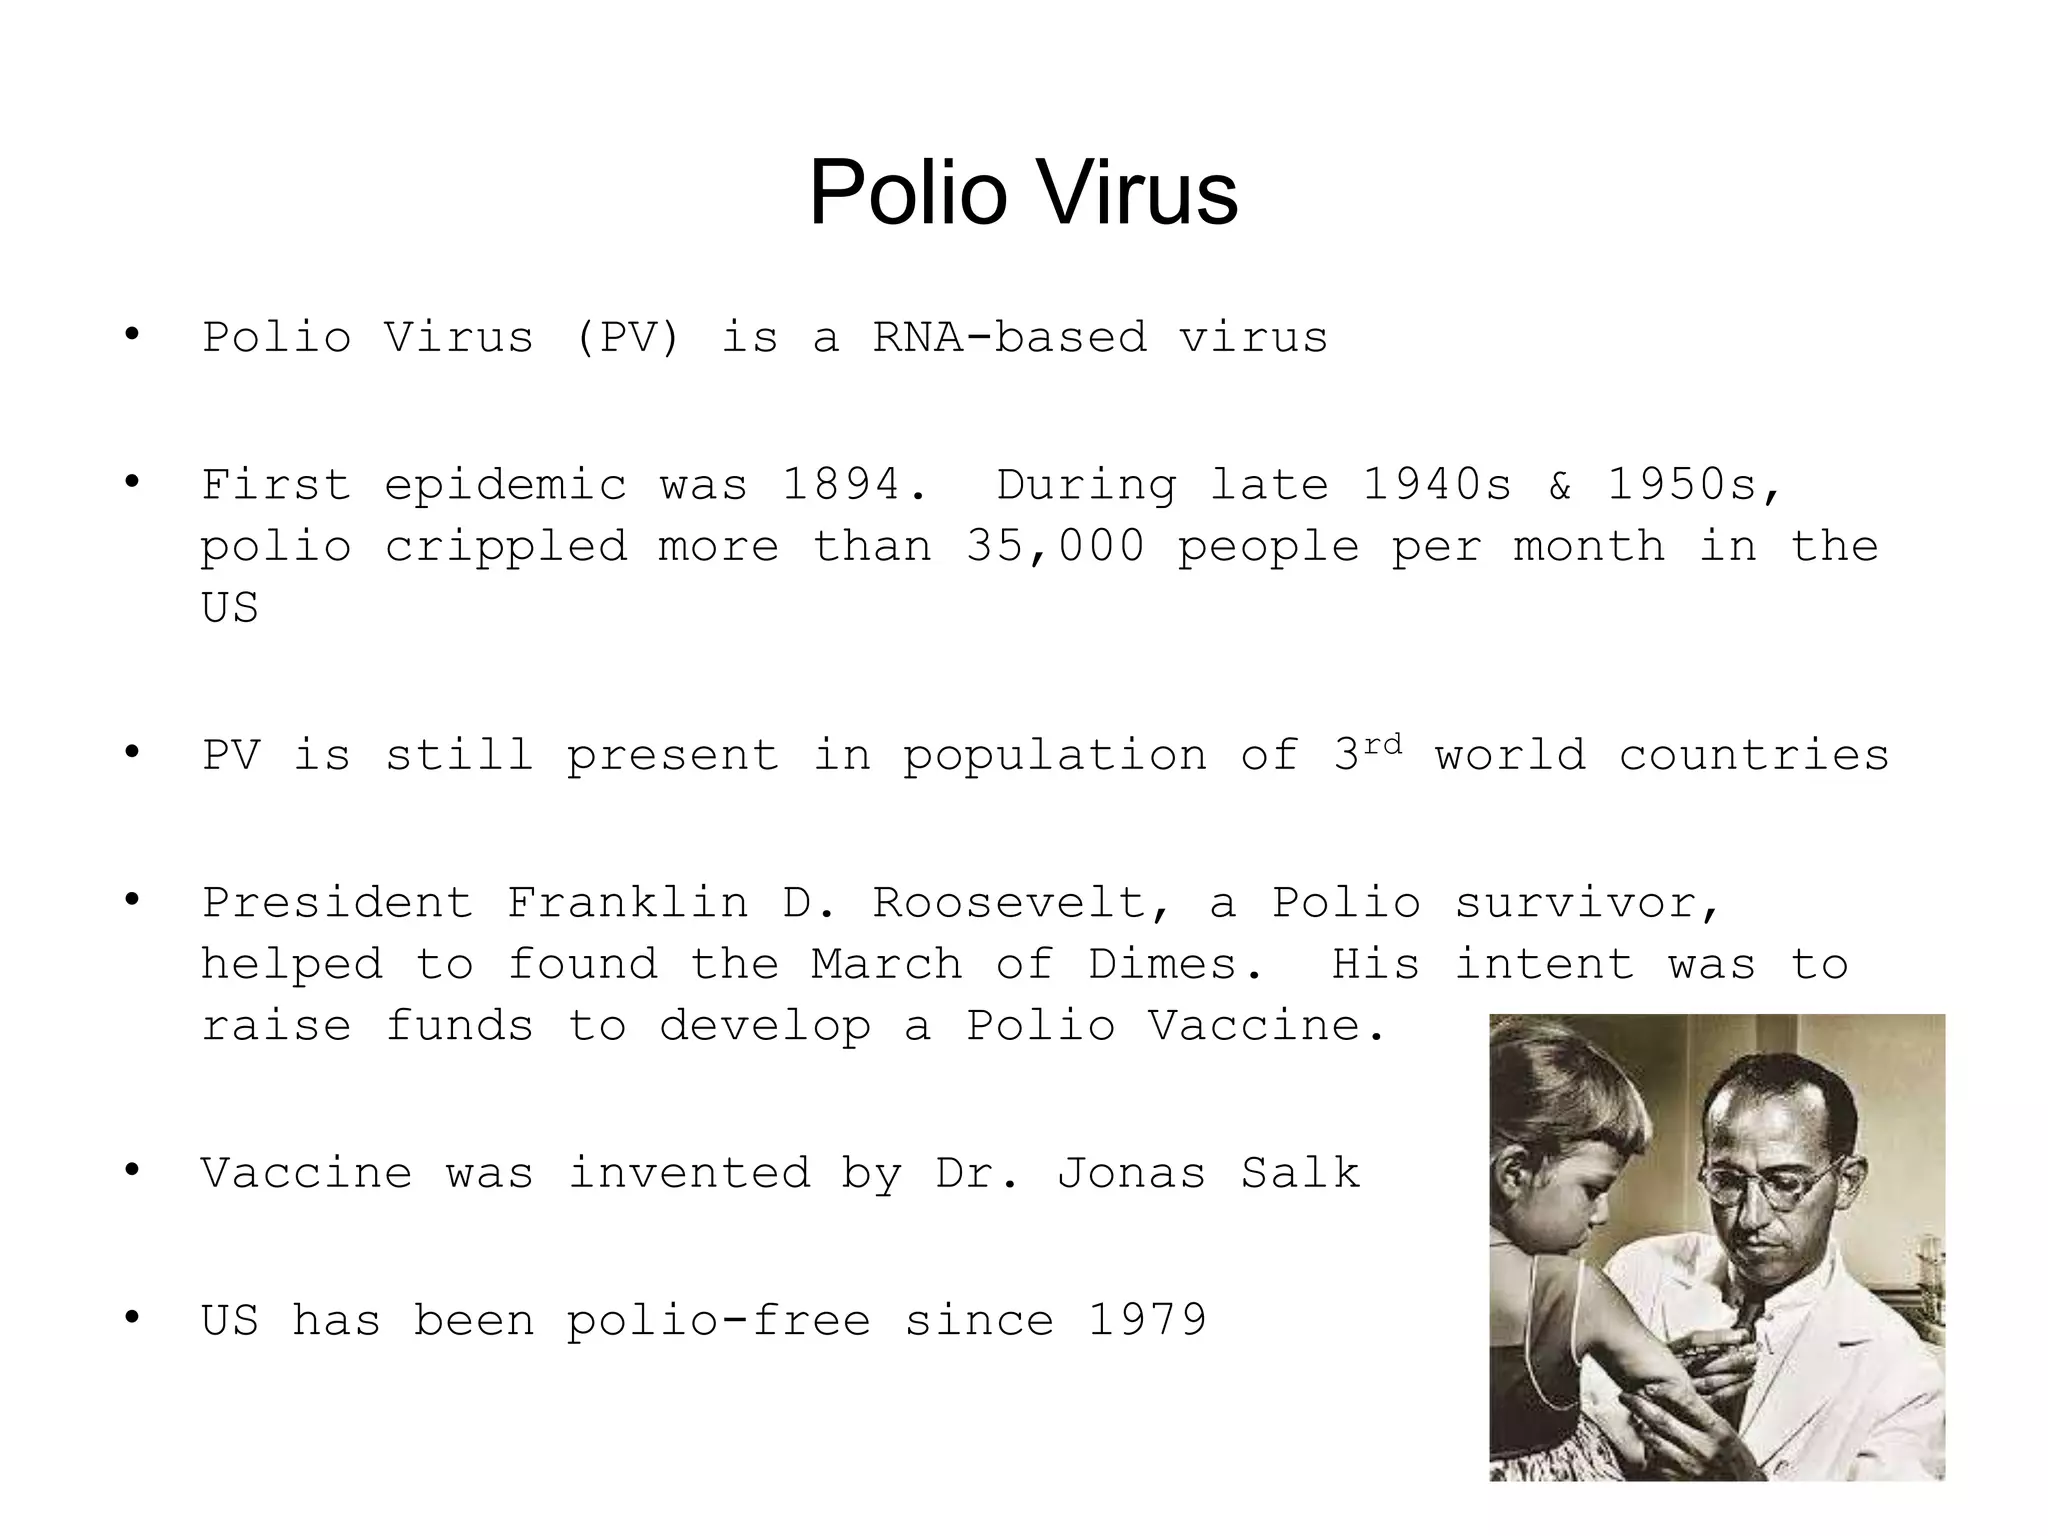
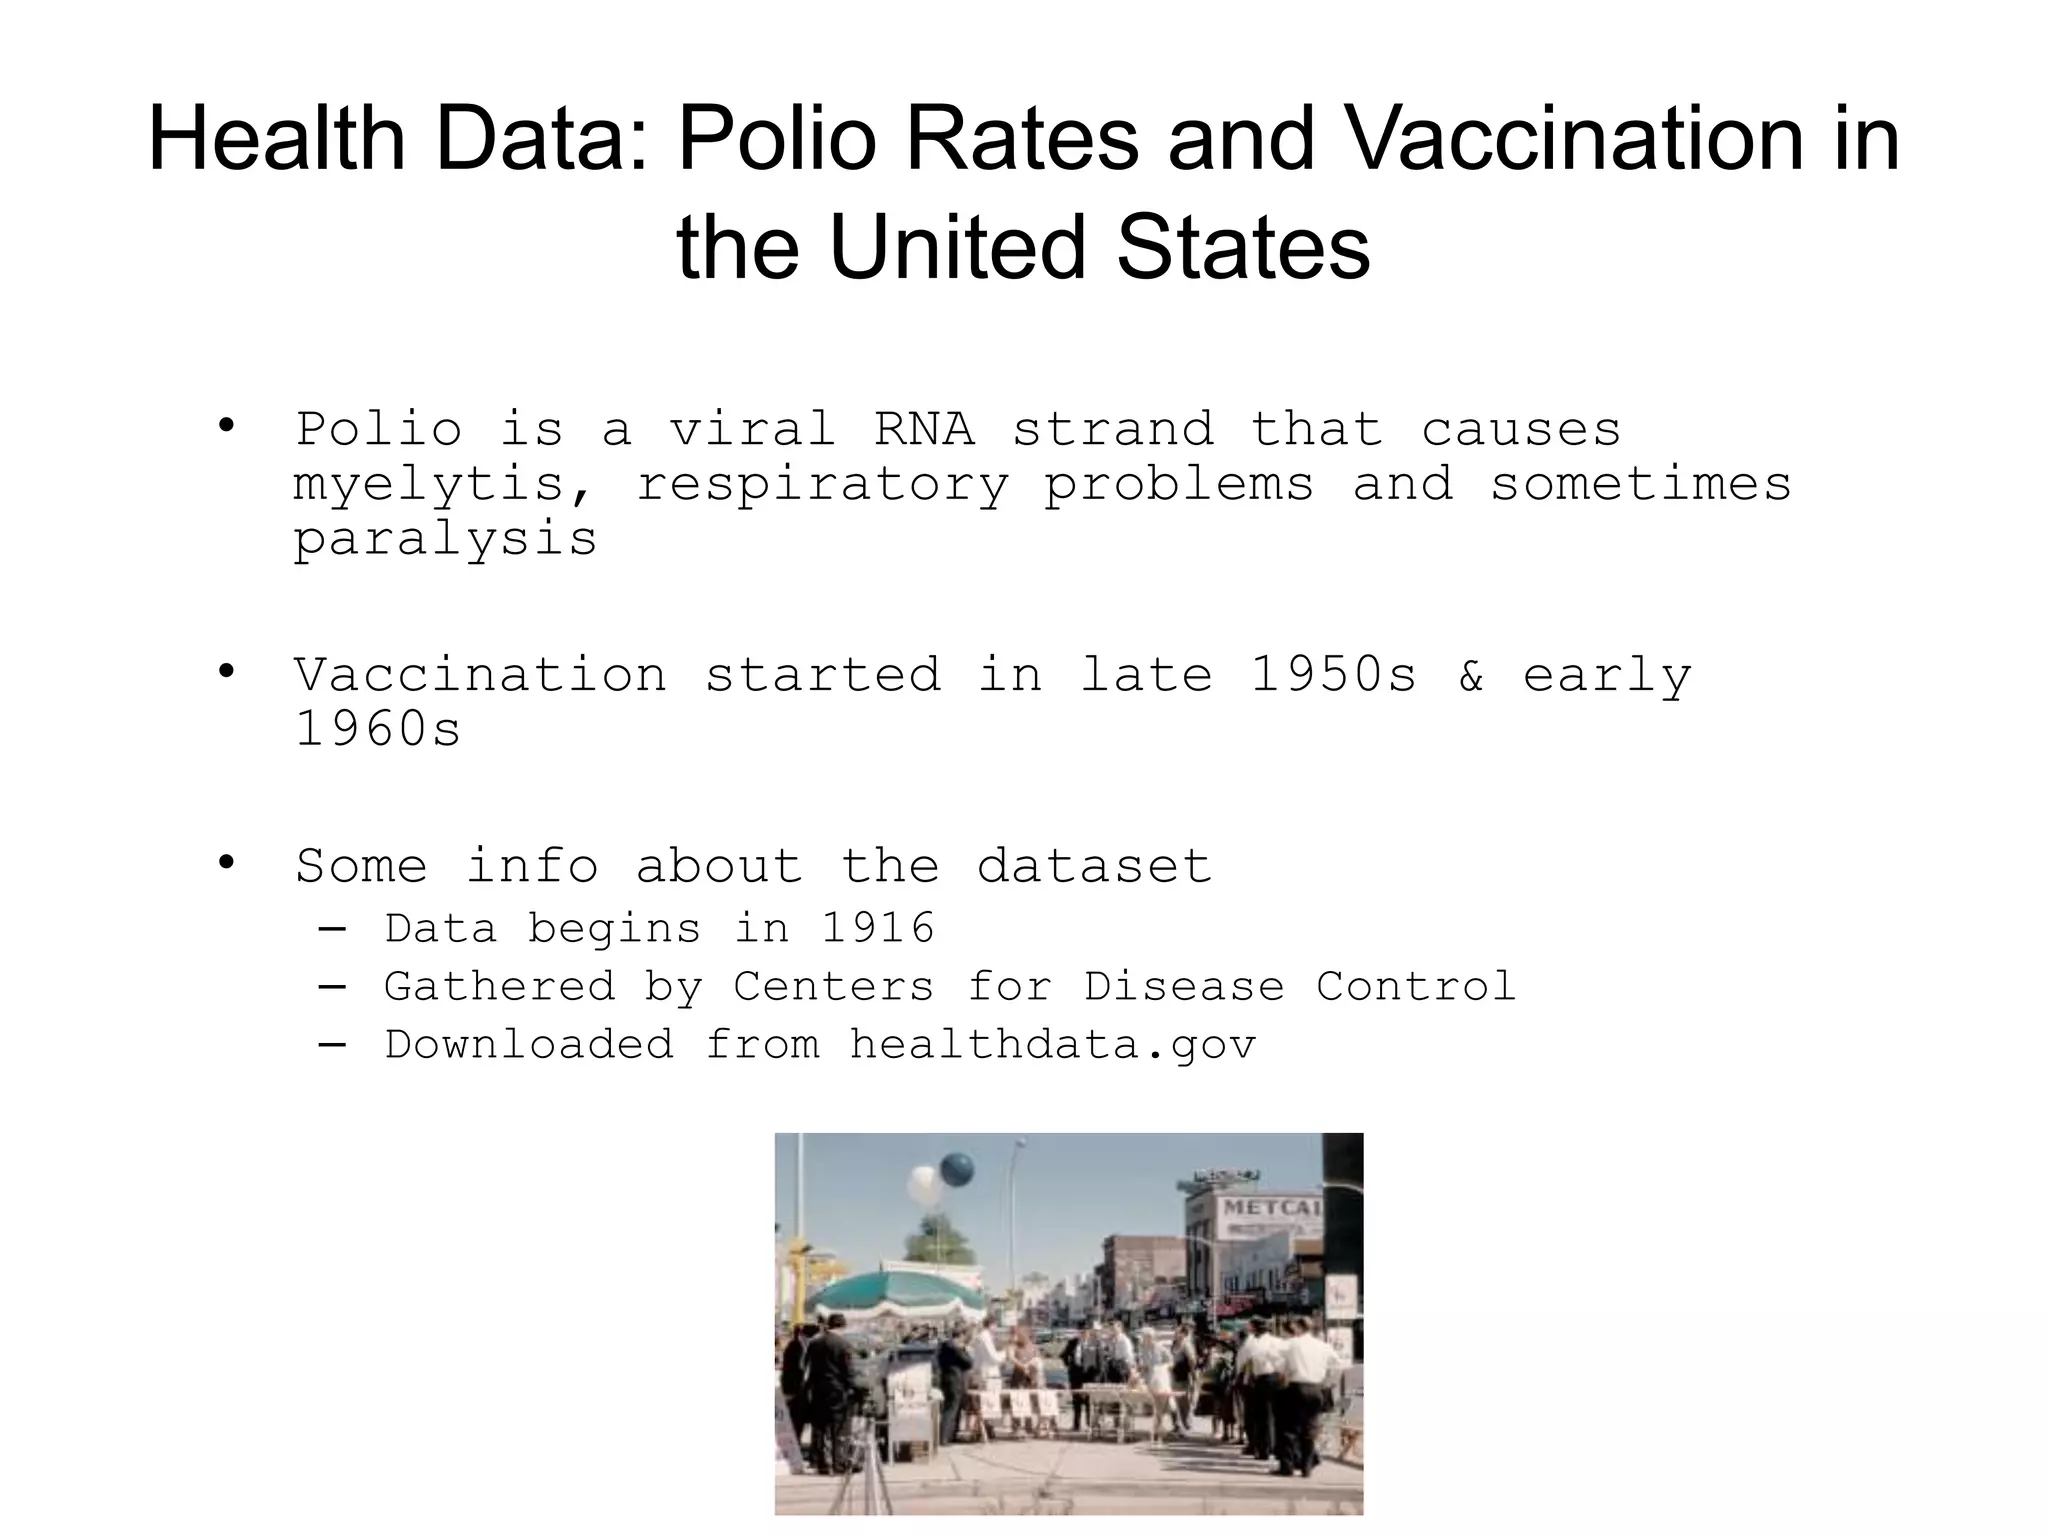
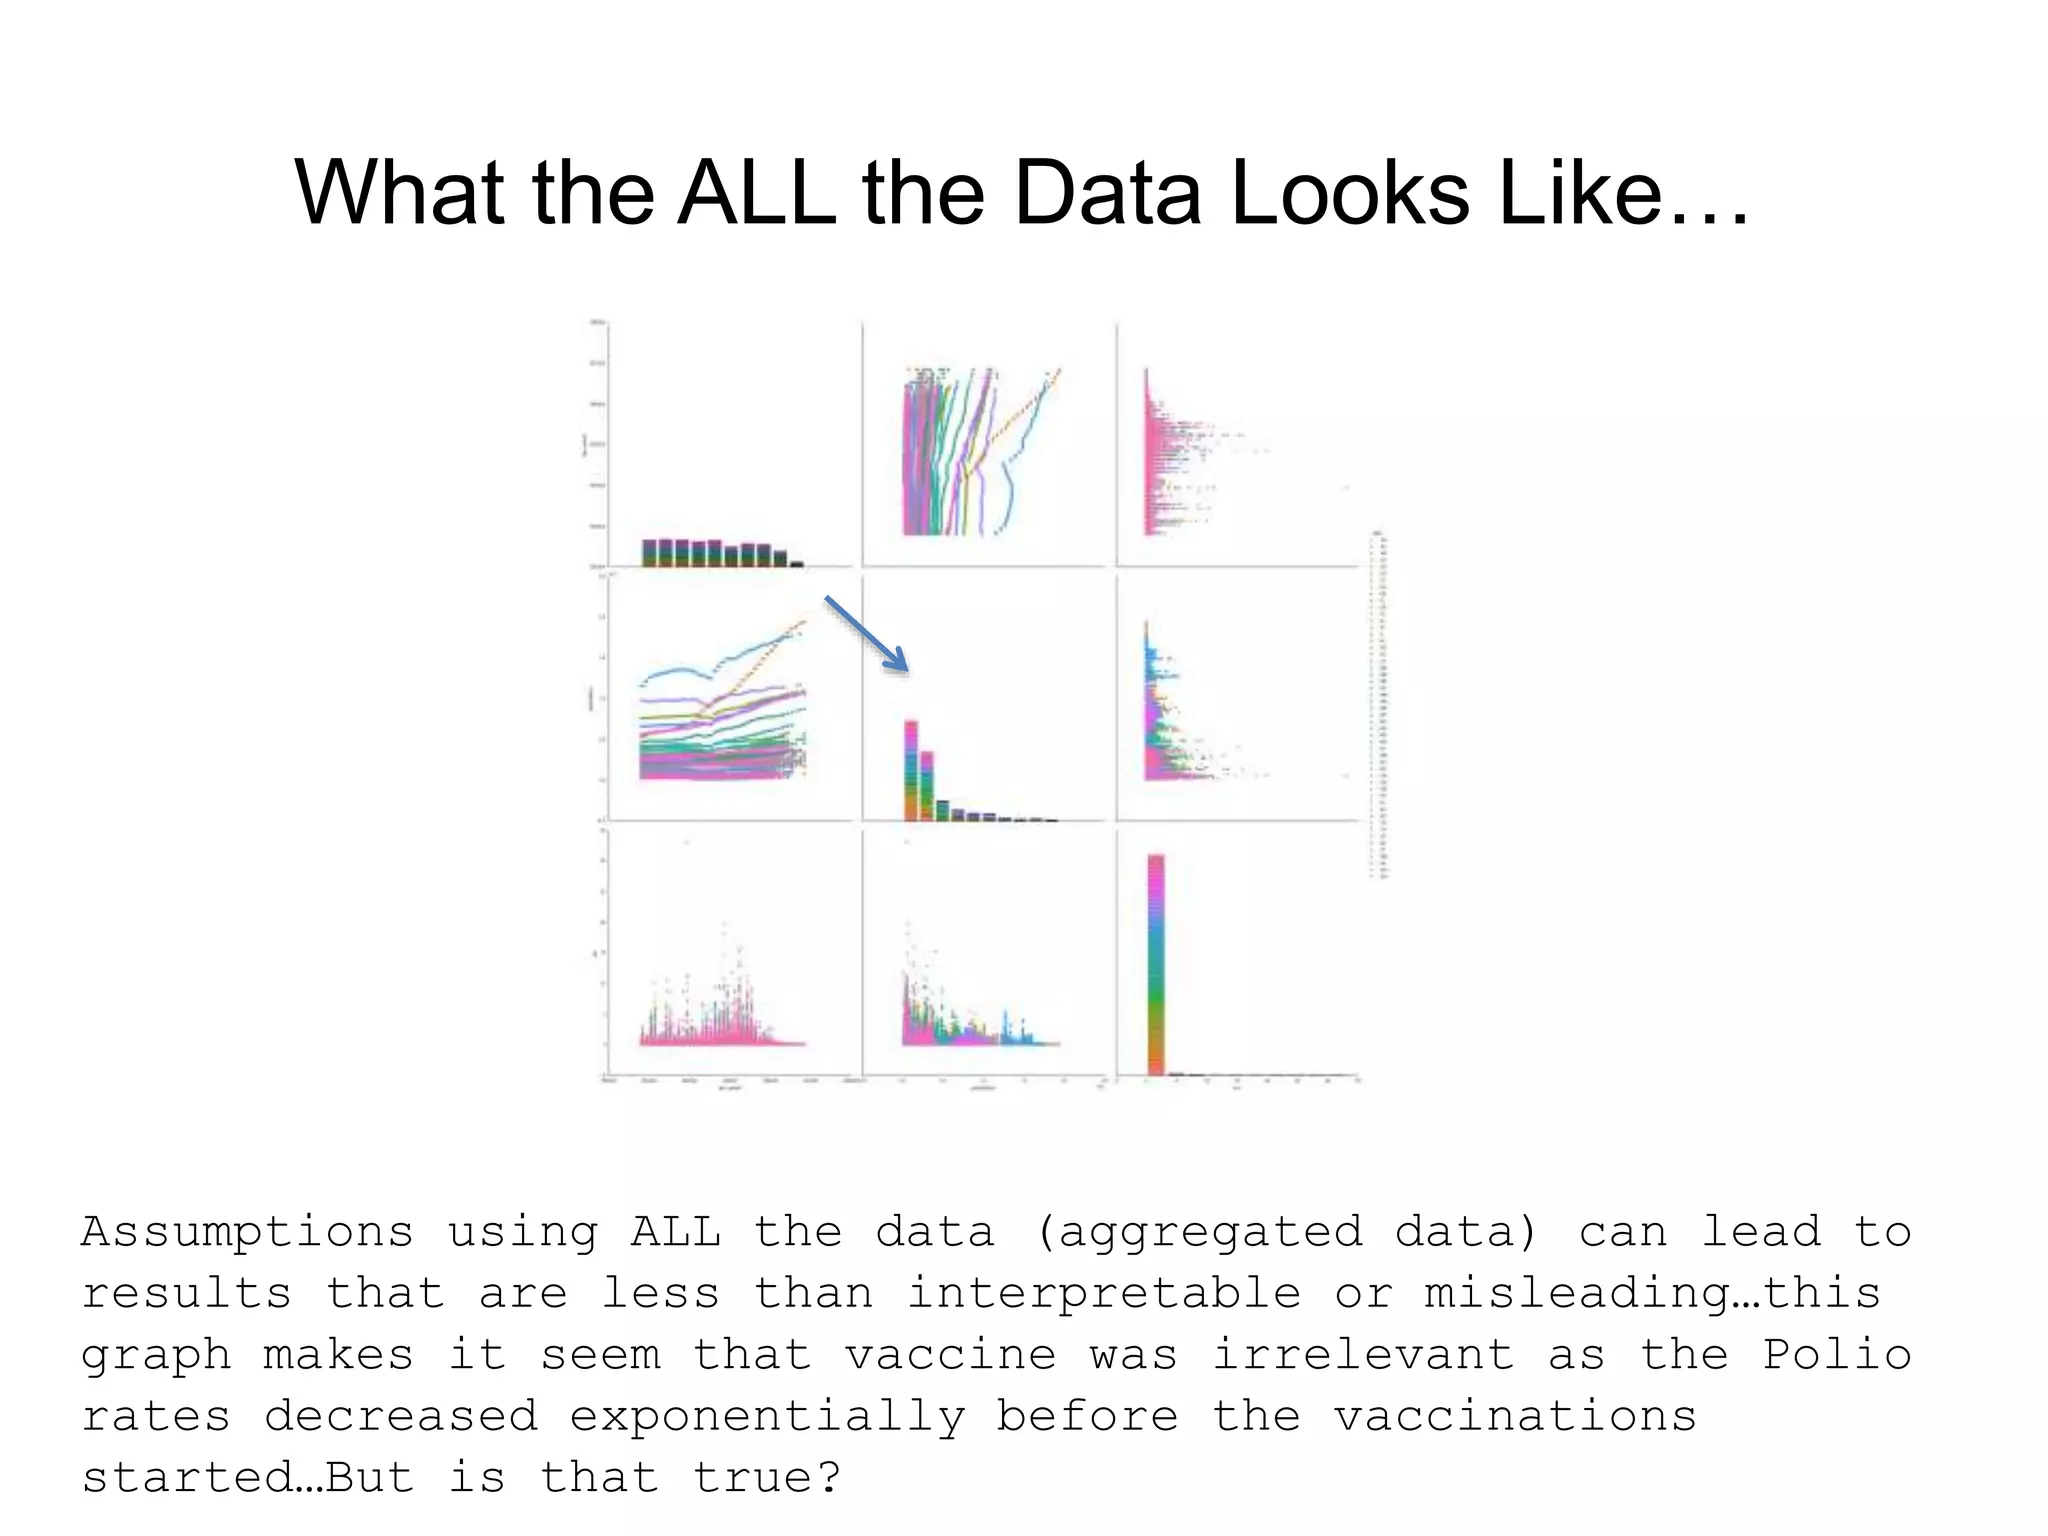
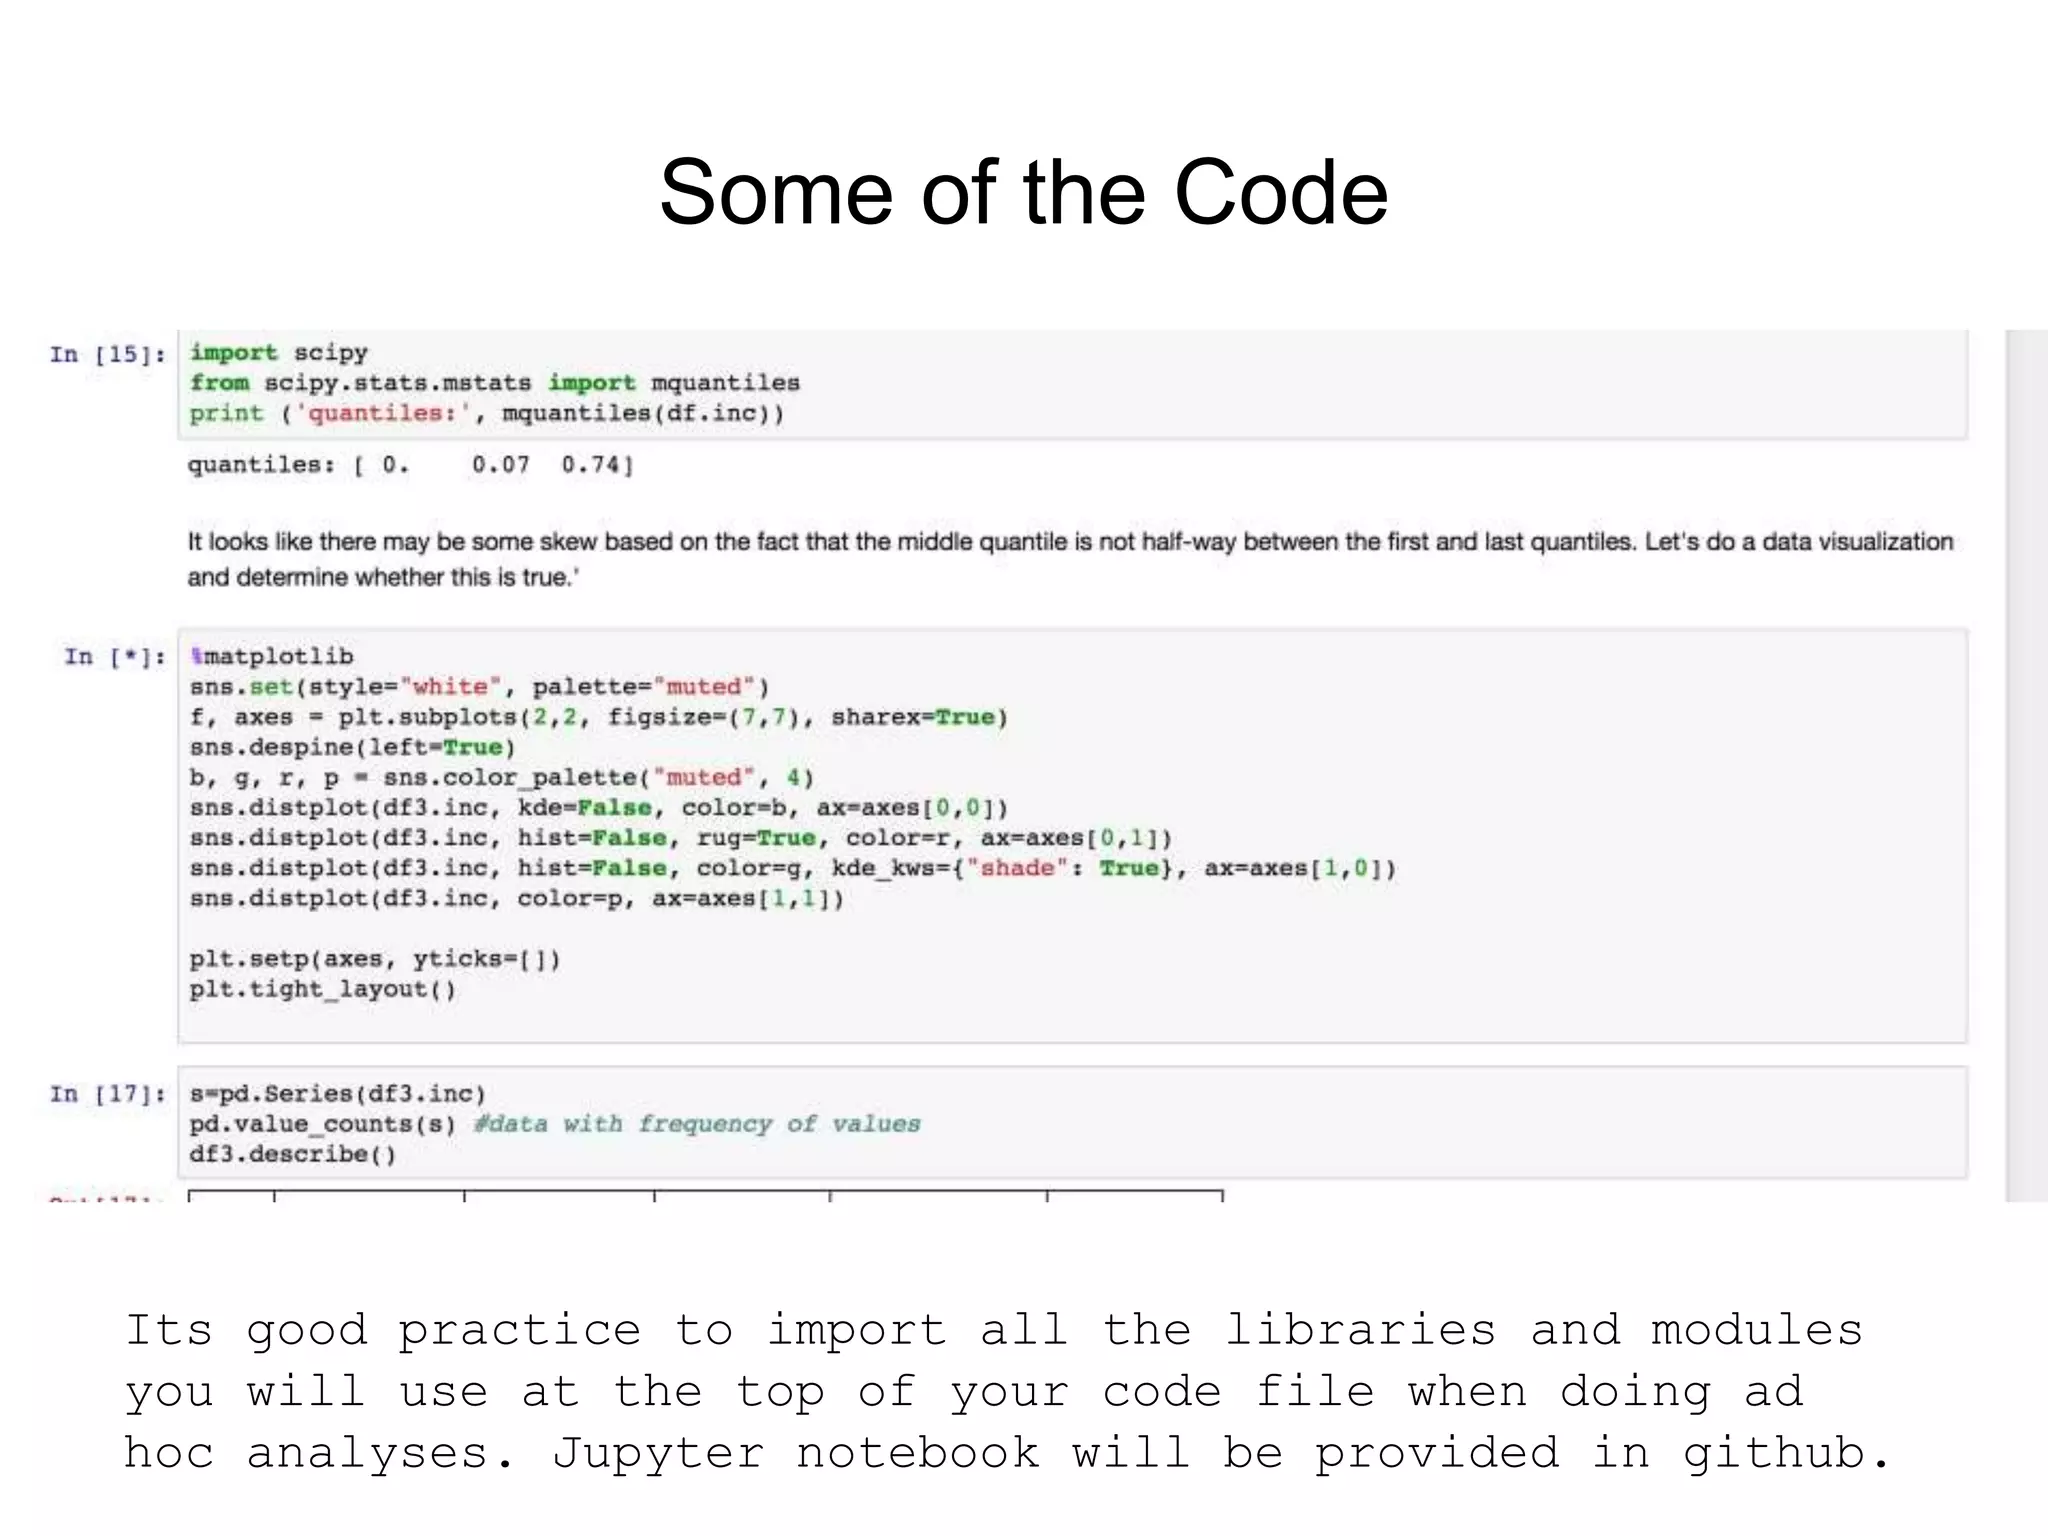
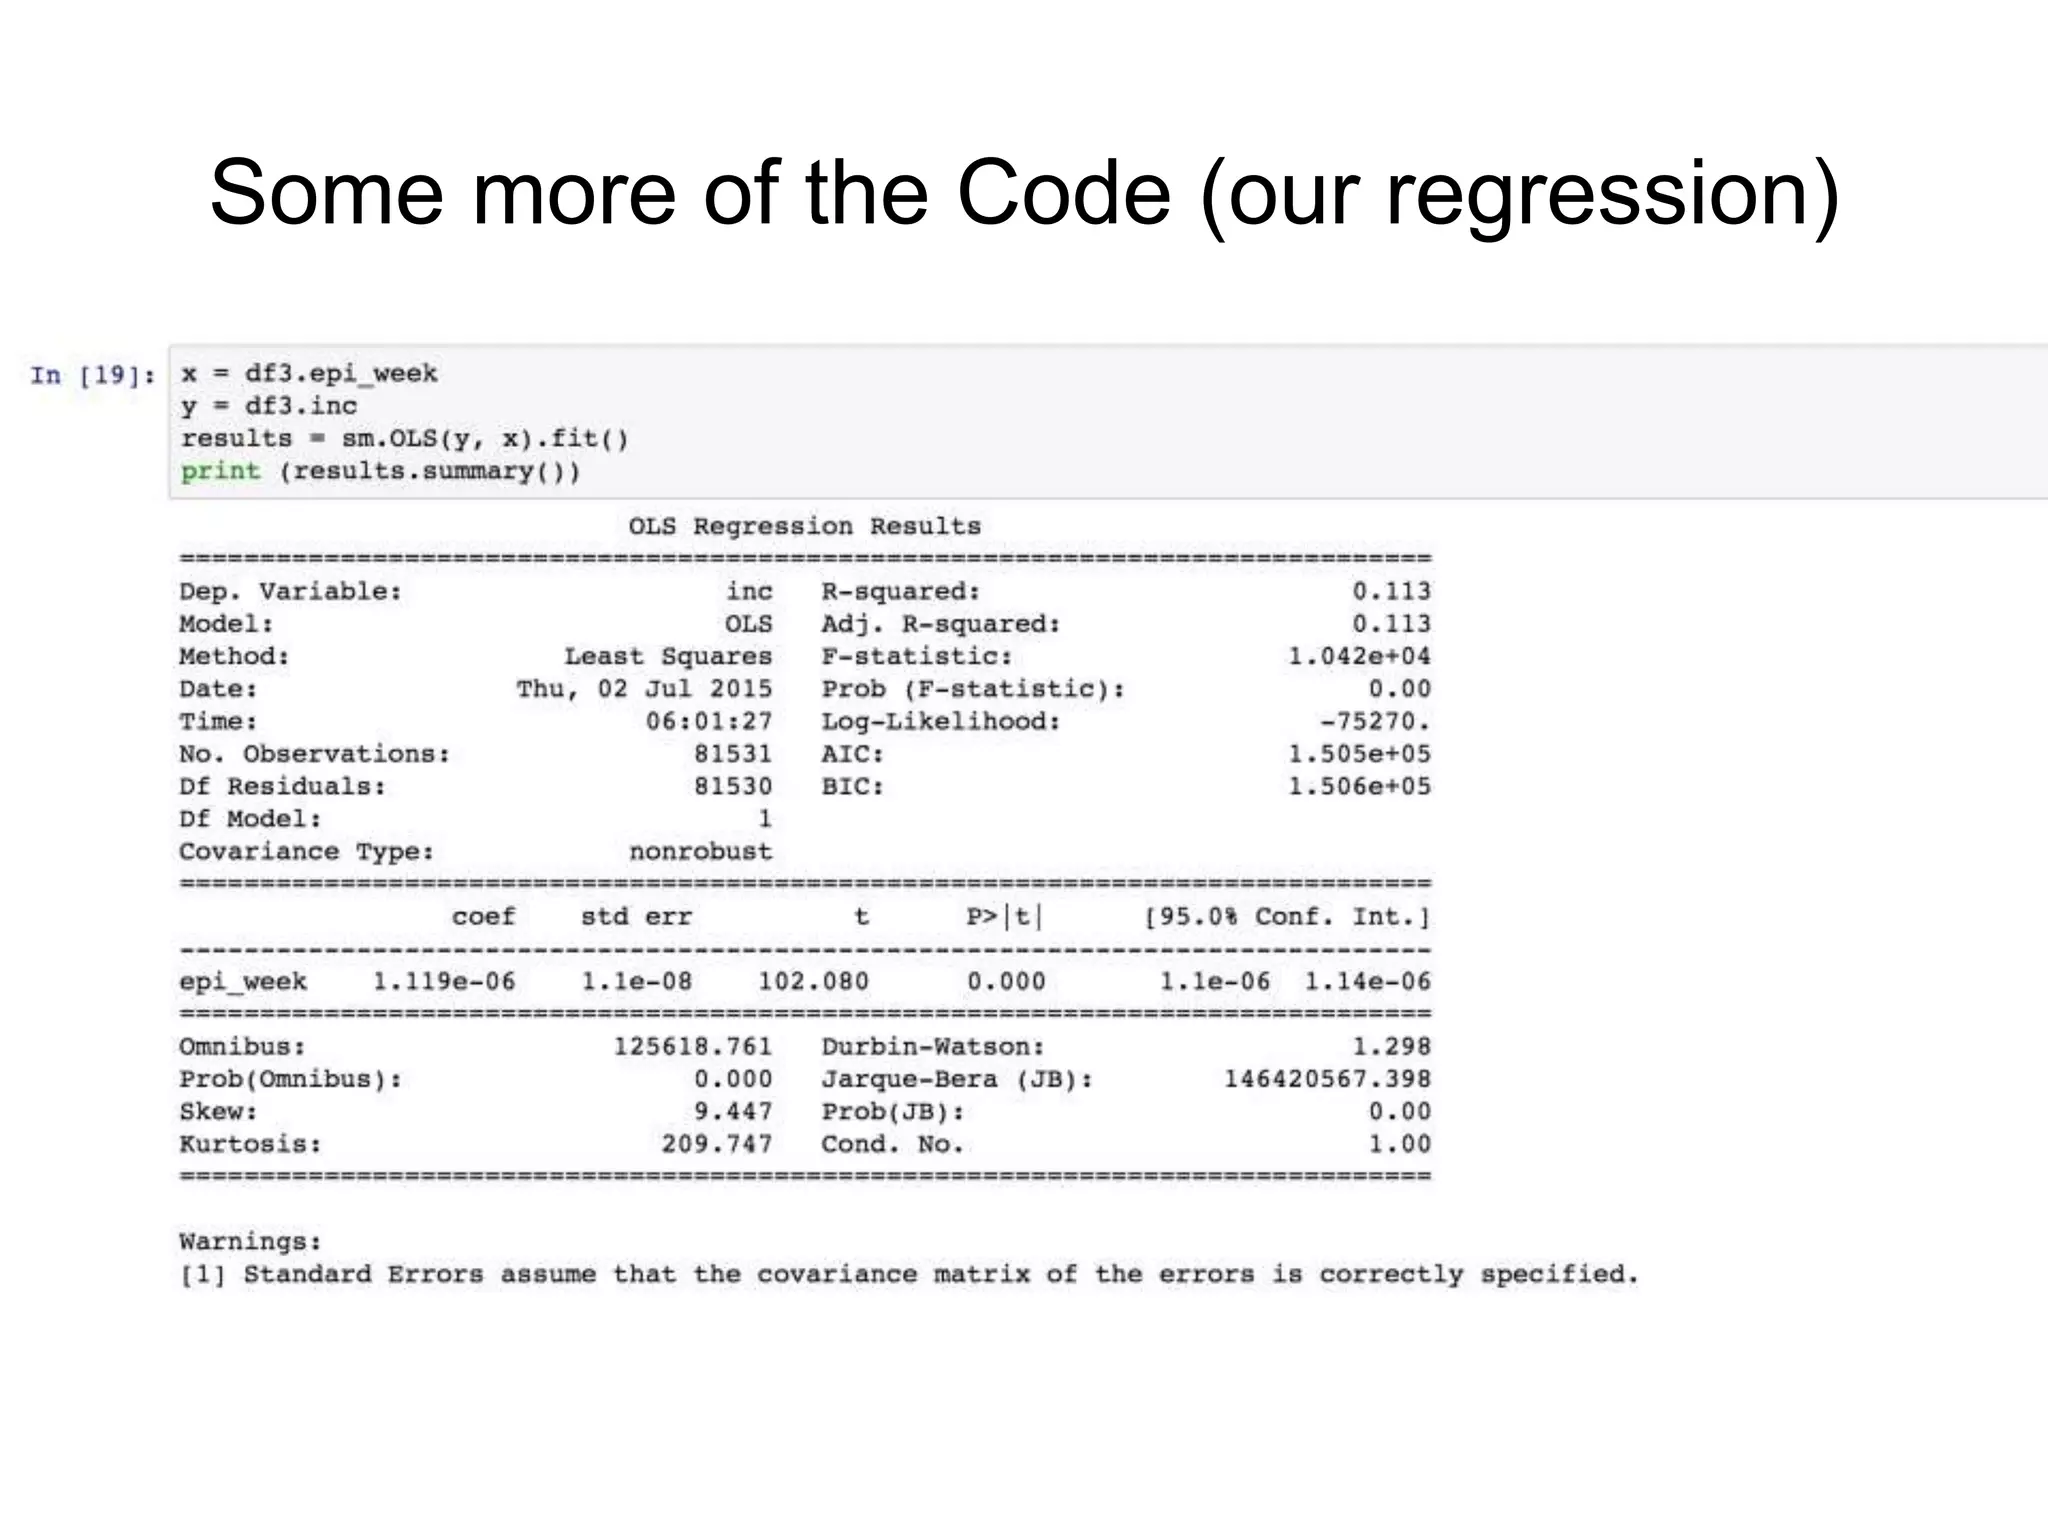
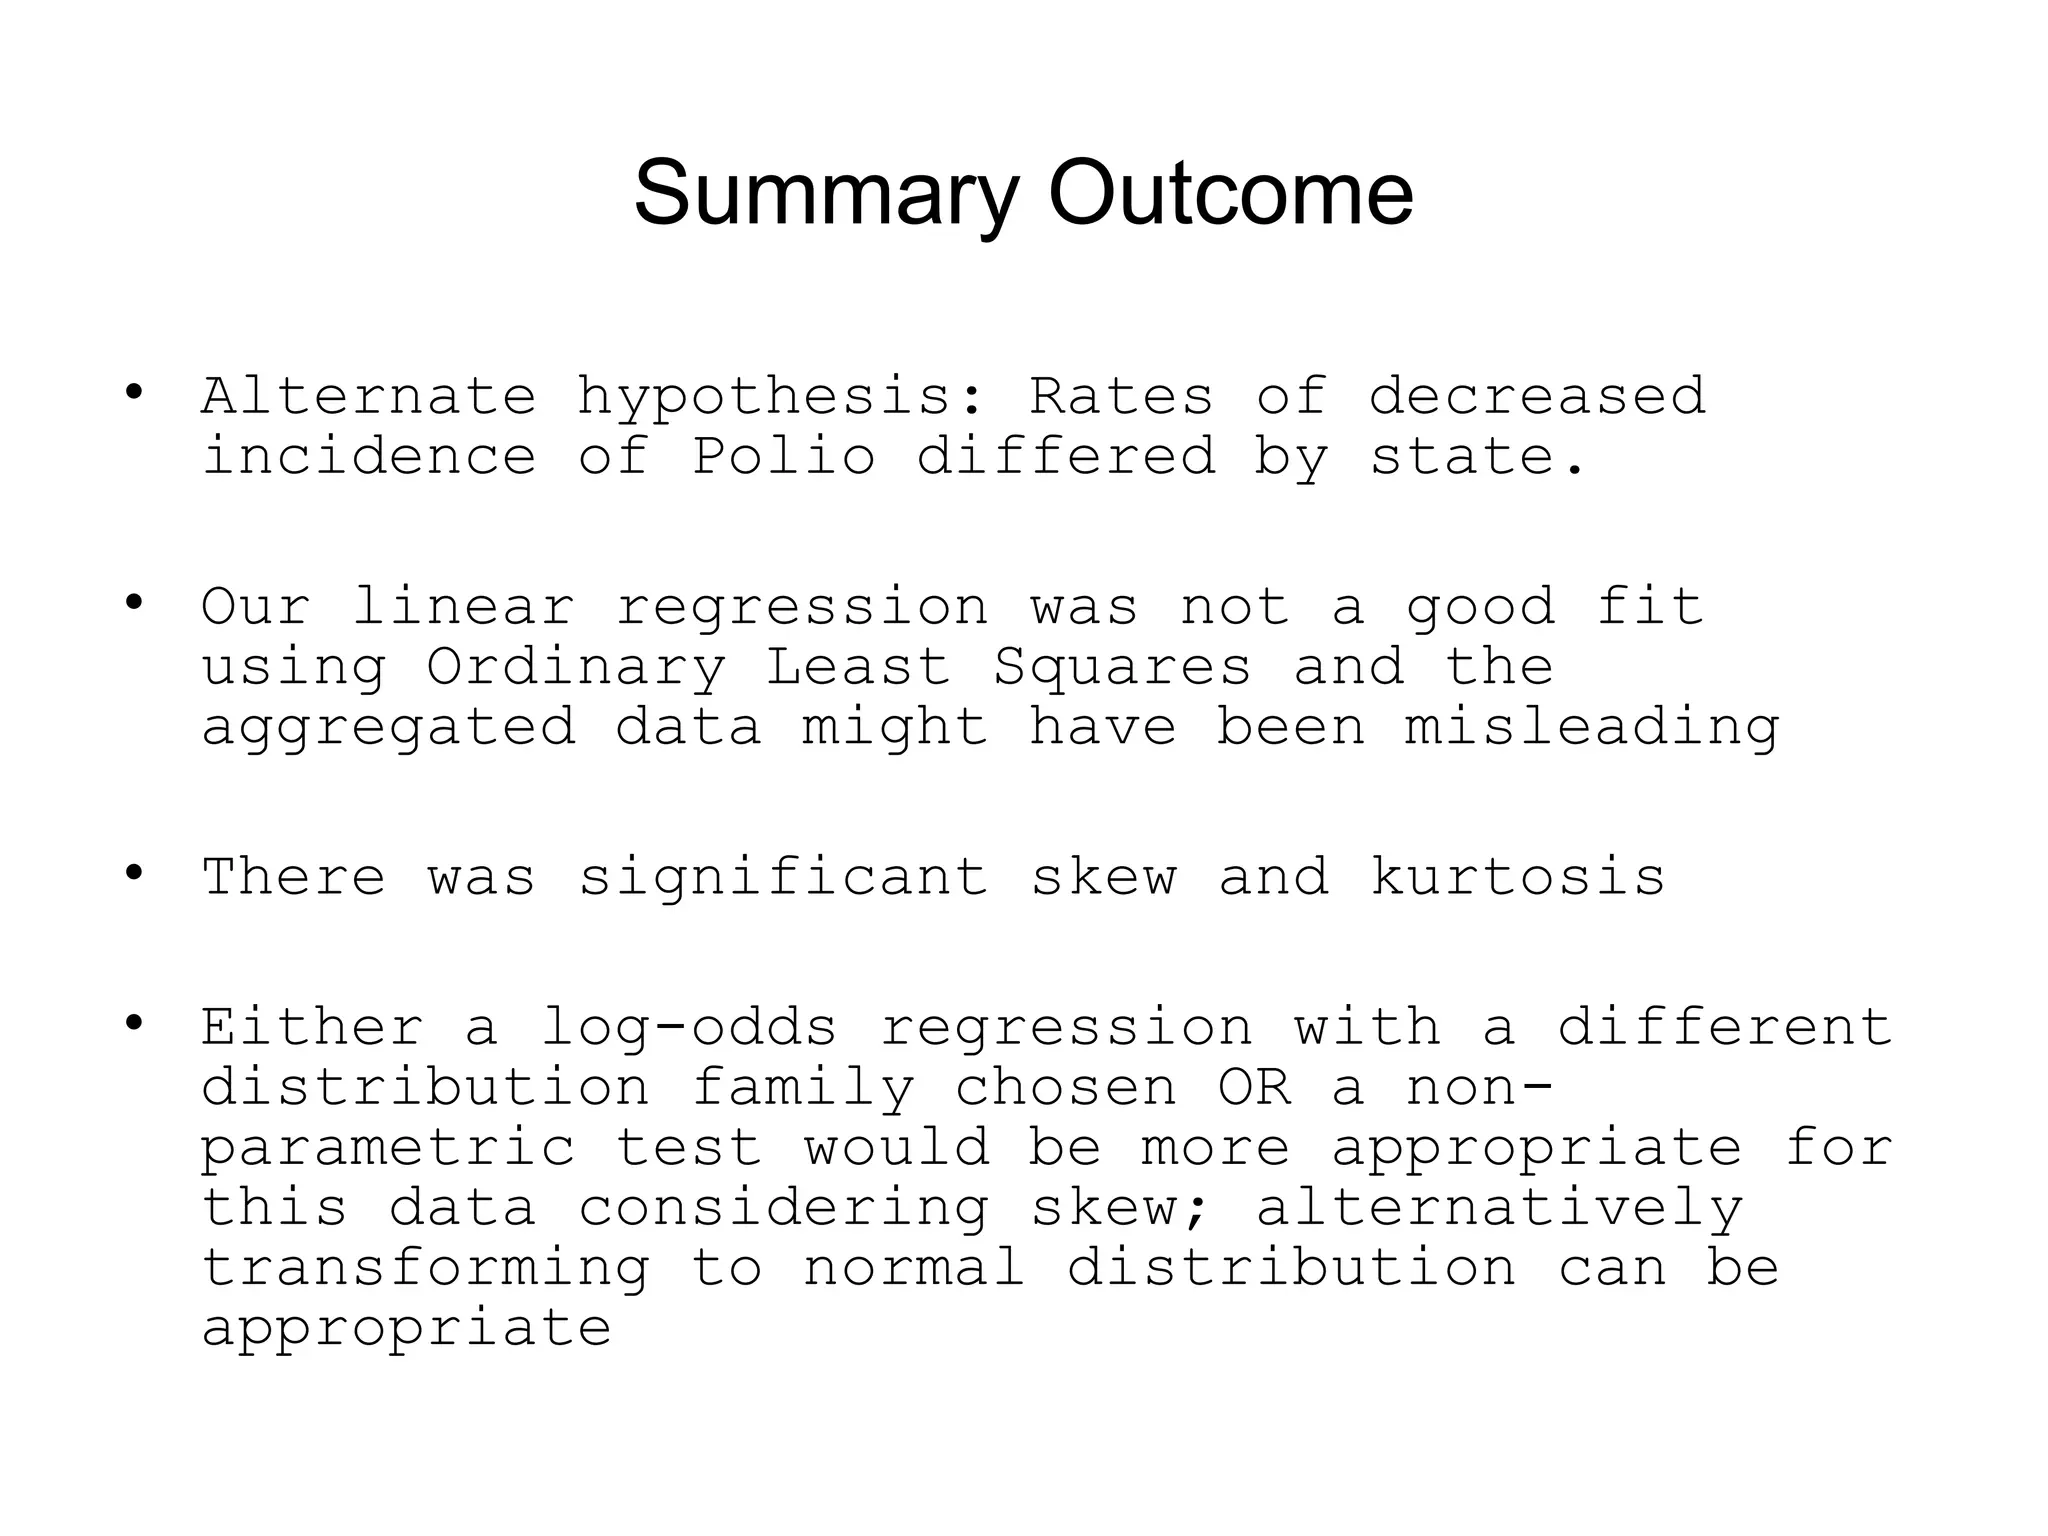
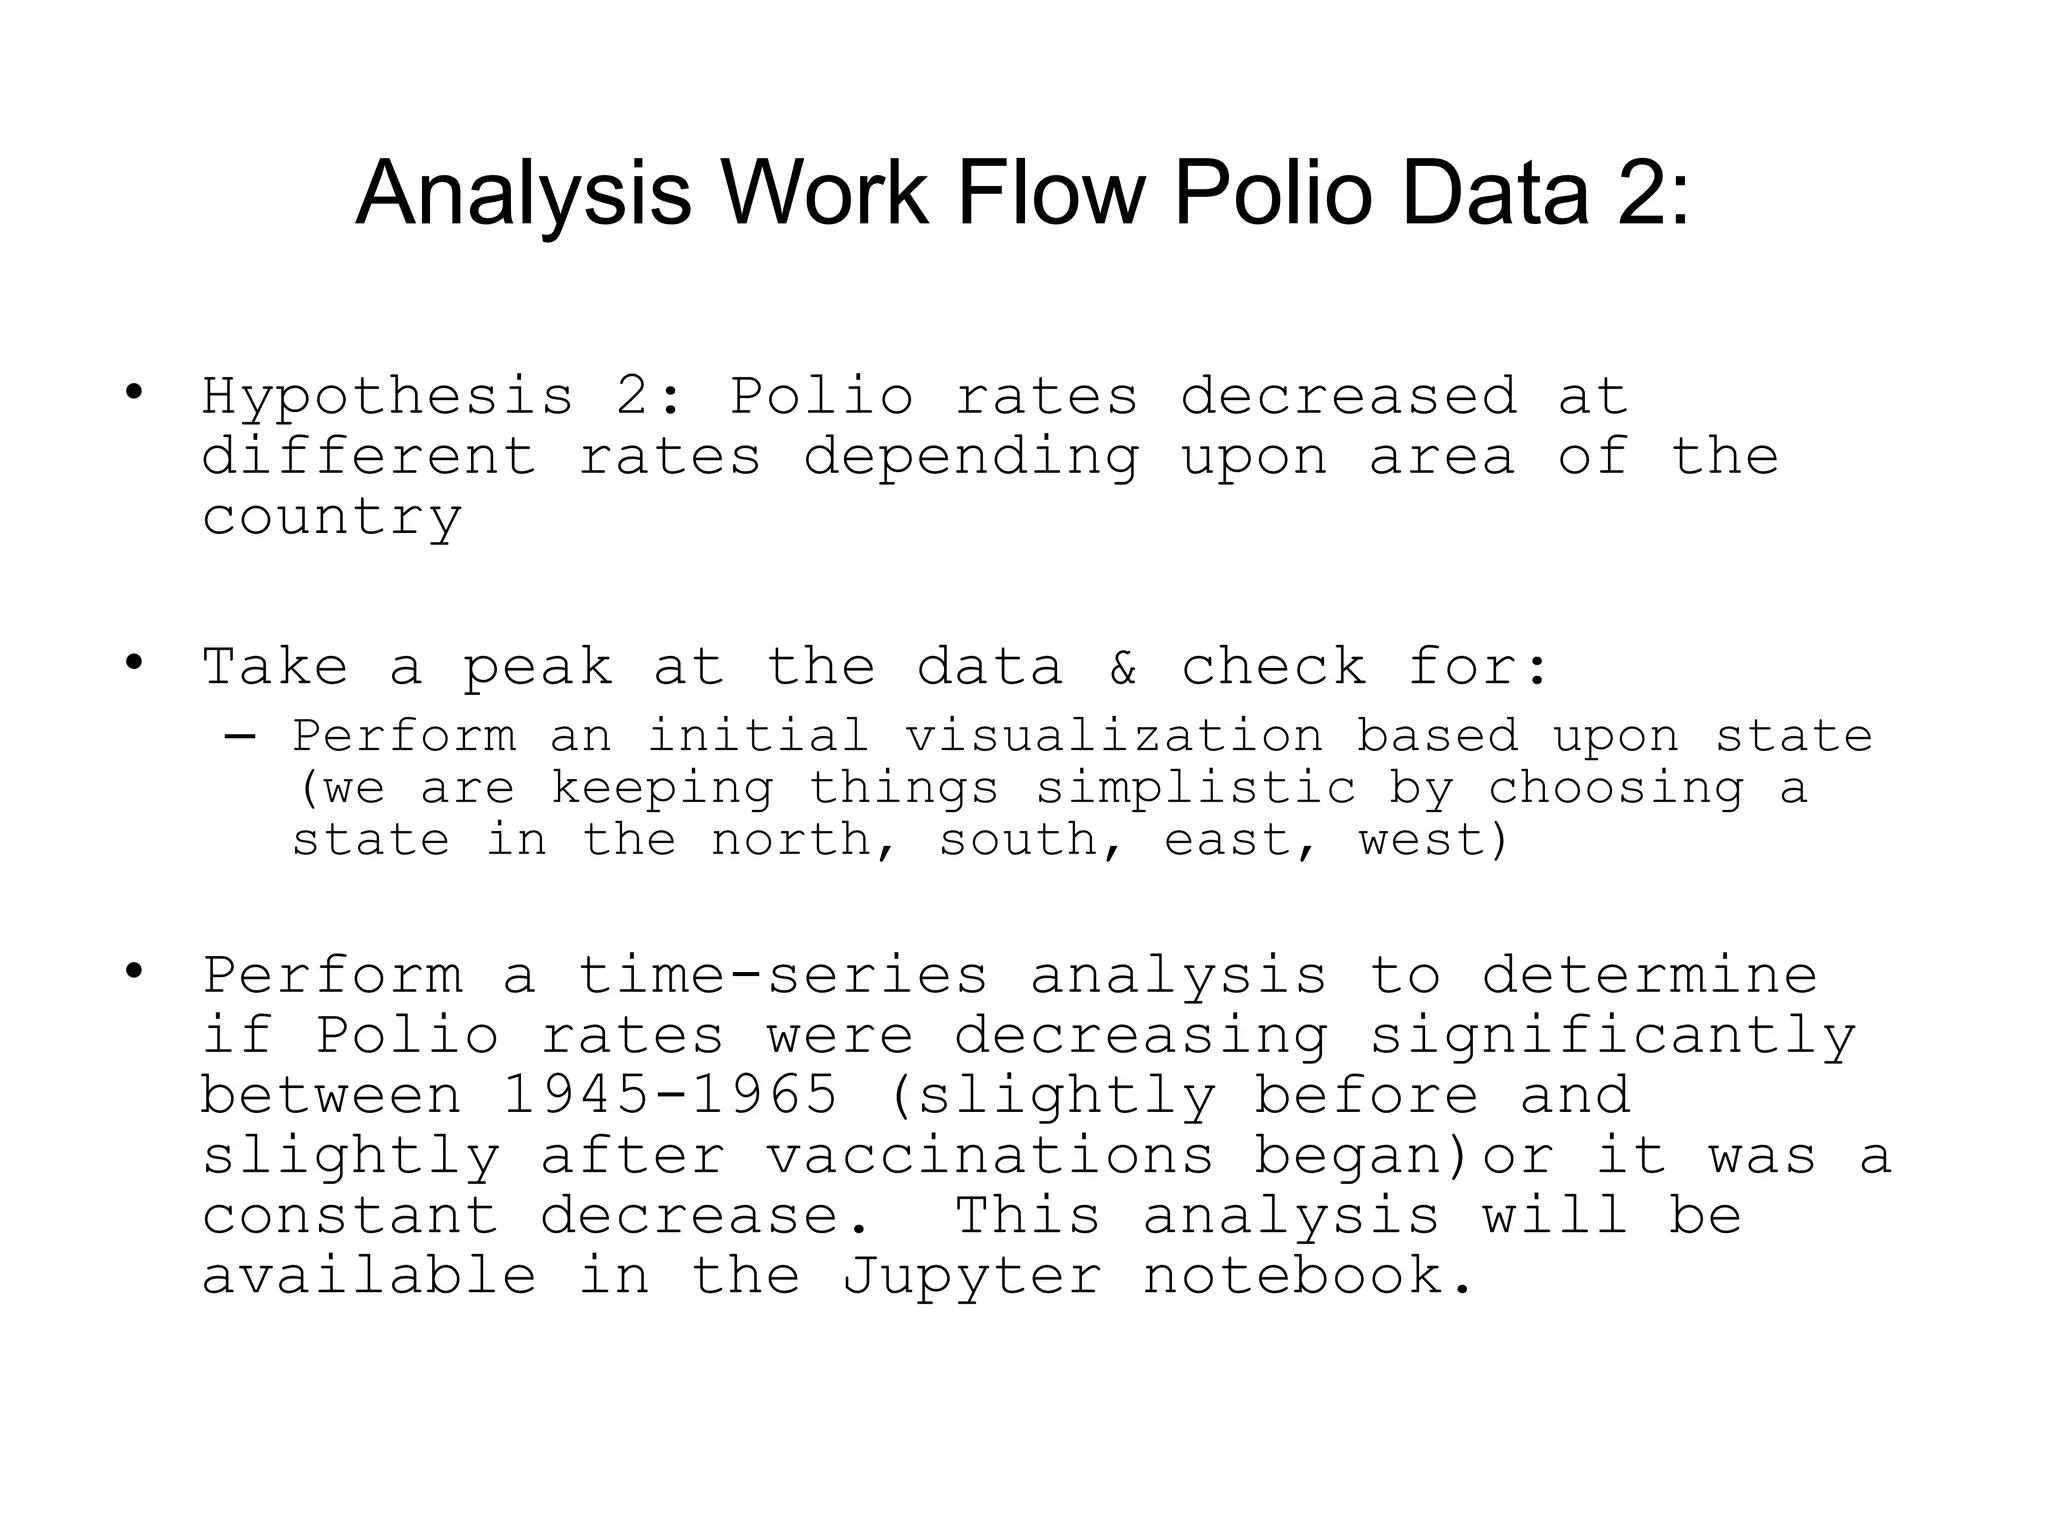
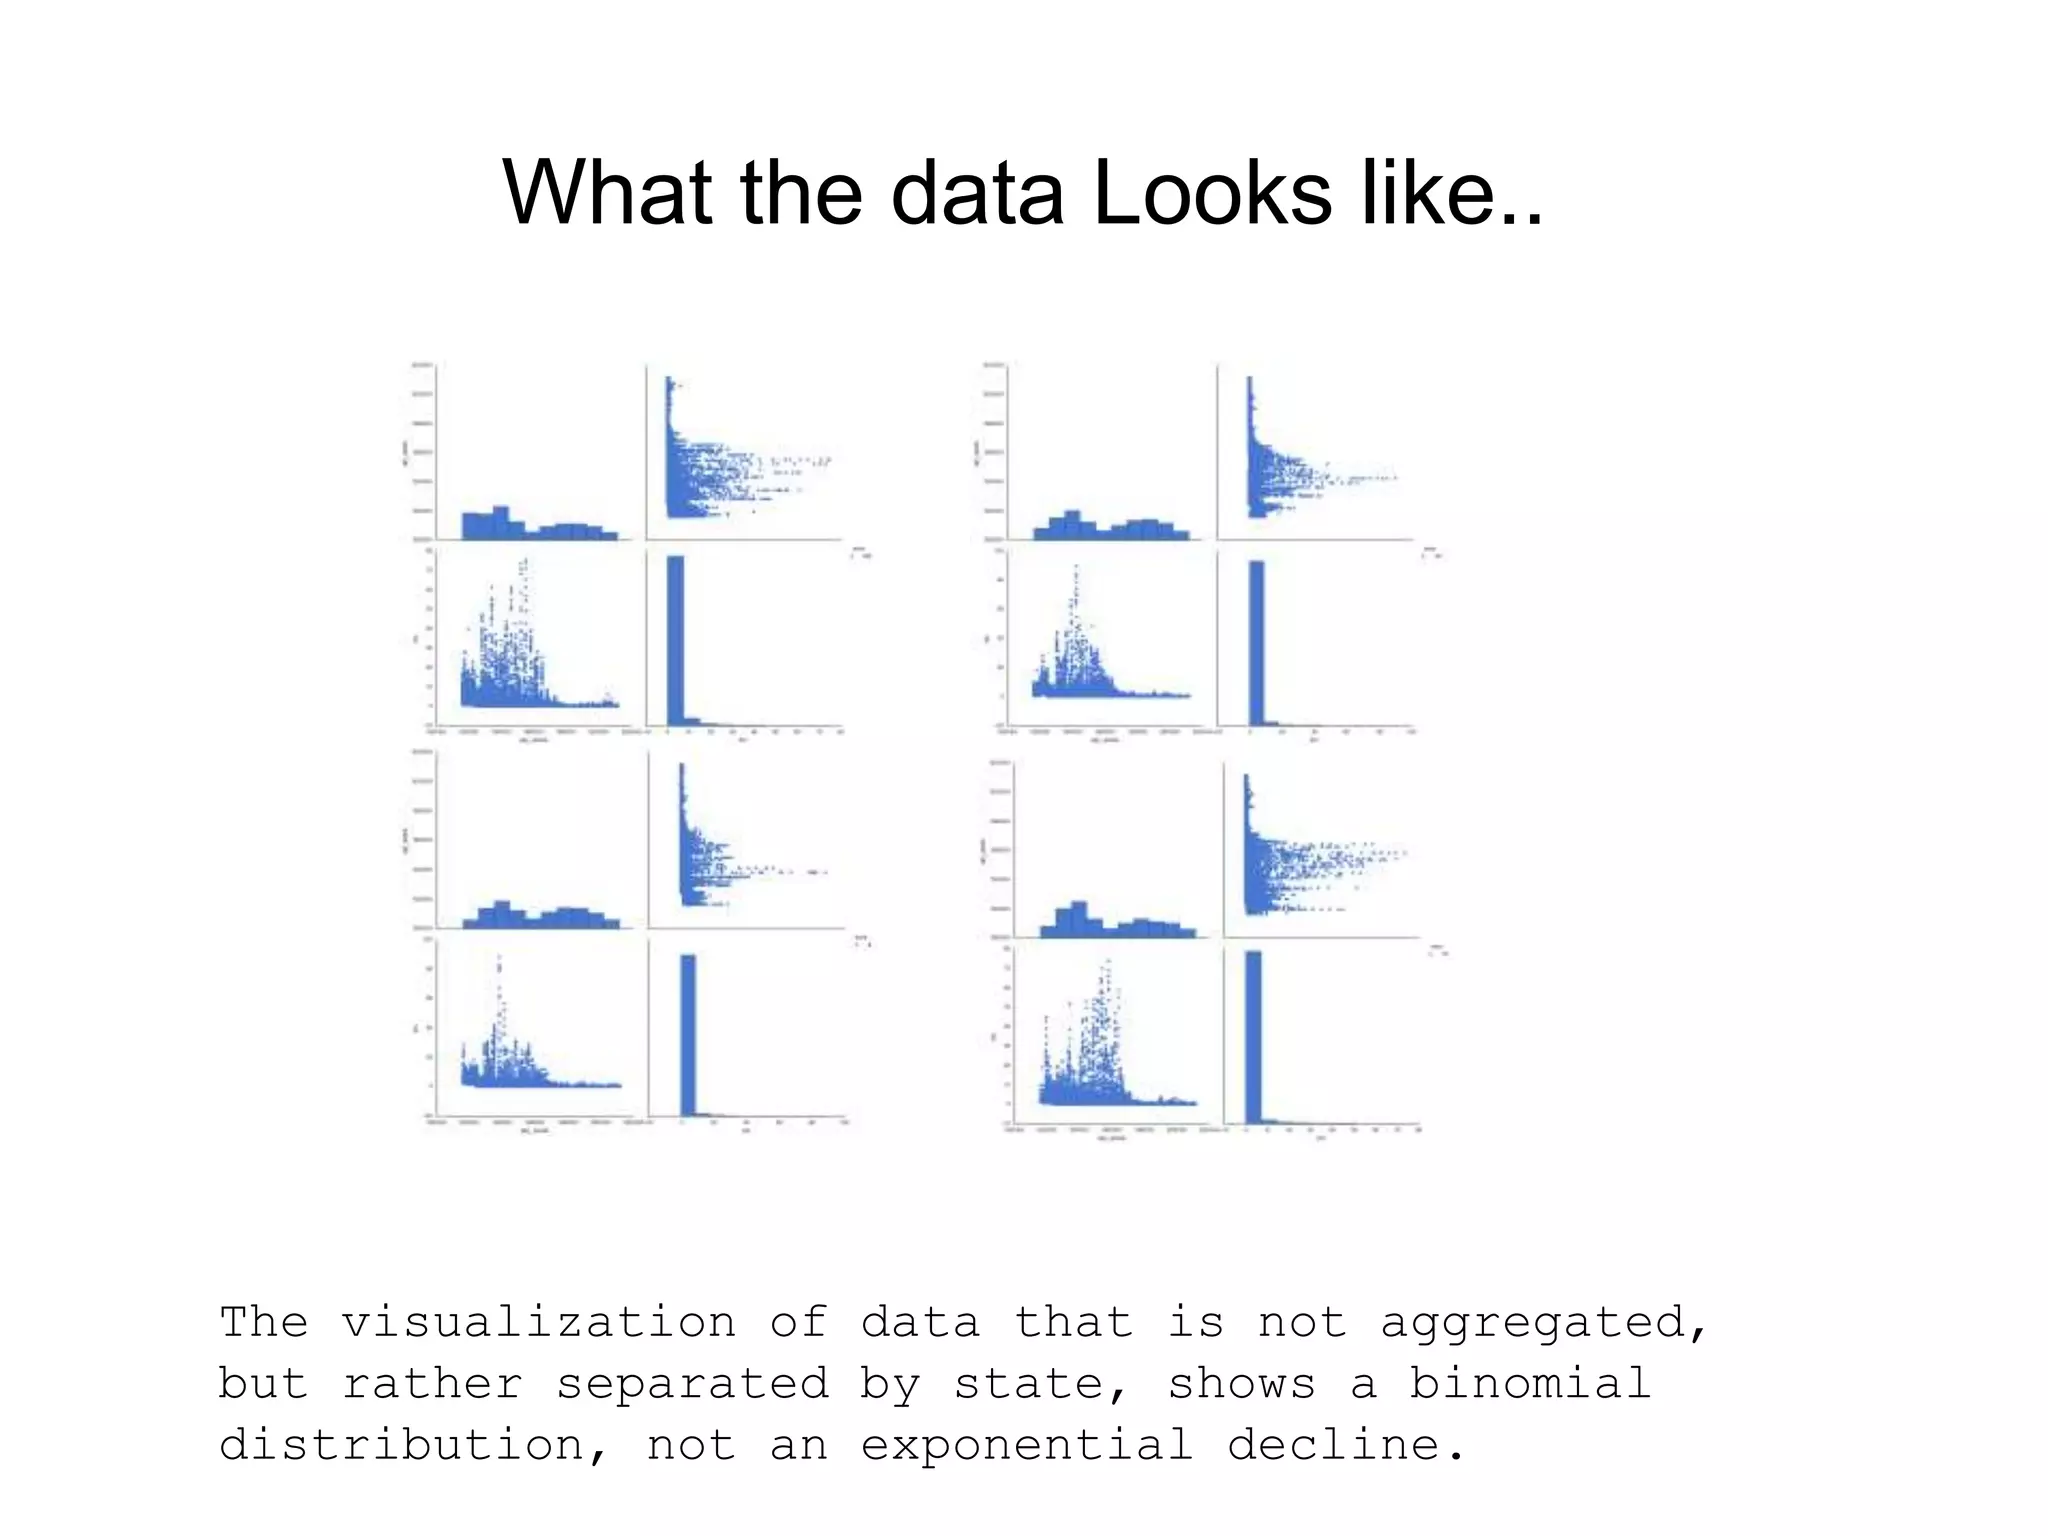
Intro to Scikit-Learn and StatsModels for the
Absolute Beginner
Jennifer D. Davis, Ph.D.
July 2, 2015
“Risks, I like to say, always pay off. You
learn what to do, or what not to do.”
- Dr. Jonas E Salk
Outline
• Machine learning and statistics, tools of the data
scientist
• Why python?
• Popular Scikit Learn ML algorithms
• Popular StatsModels algorithms
• History of Scikit Learn and StatsModels
• A use case: Polio Rates and Vaccination in the
United States
Note: many of the slides contain lots of text or notes so you
don’t need to take written notes. At the same time, this is
a talk for absolute beginners and so we present in a fairly
non-technical manner.
Experienced audience members may find some information
lacking detail or caveats. Additional information/tutorial
will be available in a Jupyter notebook on github.
Why Python?
• Well developed scripting language that can also be
utilized for software development & is *scalable*
• Well developed machine learning libraries backed
by developers at Google among other places
• Runs on C/C++ in the background, so complex
computations can run faster or be ported to C
• Runs on big data platforms like Spark (pySpark)
• Plays nicely with other programming languages (see
Jython & Cython for porting to Java and C
respectively, other methods work too)
Why Machine Learning?
• Machine learning is a subset of Artificial
Intelligence, which is as the title suggests, uses
mathematics to mimic learning intelligence
• Machine learning takes complex data,
mathematically models it (using training data)
under tunable parameters, and allows for
predictions or assessments of *individuals* within
or compared to groups
• Machine learning includes network analysis, deep
learning, probability density graphs, supervised
learning, unsupervised learning, dimensionality
reduction (SVM, PCA) and other techniques
Why Statistics?
• Statistics is the mathematical application to data to build
a ‘model’ of how observations fit into a ‘big picture’
• Statistical analyses often include correlations,
assessments of how ‘good’ a model is based on error rates
or population fits
• Statistics is an essential part of data science repertoire,
but data scientists do not *rely* on statistics alone
• Examples include ANOVA, Pearson’s Correlation, ROC Curves
(assesses various models), Time Series, Regressions
• Statistical techniques can be applied to Machine Learning
algorithms to determine how effective, accurate or
predictive the algorithm is, but they are not the only
method
• Examples include: PPV, NPV, ROC Curves
How do Statistics & Machine Learning
Relate to One Another?
• Statistical methods are used to assess the
performance of a machine learning algorithm often but
do not require data to ‘tune’ the statistical test
• Some statistical tests can be utilized as machine
learning algorithms (e.g. log-odds regressions etc.)
• While Statistics is not generally considered part of
artificial intelligence, it can be used to determine
the accuracy, learning rate and other parameters tied
to AI & Machine Learning.
• Machine learning algorithms use test data to tune
their parameters. Remember the musician who’s
instrument is out of tune? We don’t want that
(under-fitting). And we don’t want the musician
tuned only to themselves—but differently than the
rest of the band--that’s over-fitting.
The Top 5 Machine Learning Algorithms for Data Science
Available in Scikit-Learn
• PageRank (Principal Eigenvector)
• AdaBoost (Ensemble Learning)
• kNN (K-nearest neighbor Classification)
• Principal Component Analysis (dimensionality reduction)
• Neural Network Models (example, Restricted Boltzmann
machines)
The Top 5 Statistical Models for Data Science Available in
StatsModels
• Generalized linear models (e.g. ordinary least squares
regressions)
• Nonparametric estimators
• Analysis of Variance
• Times Series Analysis
• Survival Analysis
Scikit Learn: History & Development
• Project started in 2007 as a Google Summer of Code project
by David Counapeau.
• Matthieu Brucher then took it up as part of his thesis
work.
• 2010 Fabian Pedregosa, Gael Varoquaux, Alexandre Gramfort &
Vincent Miachel of INRIA took project leadership
• The first public release was February 1, 2010
• Since releases have appeared about every ~3 months
• A great community exists, so if you’d like to contribute
your own code for machine-learning algorithms contact the
scikit-learn team.
StatsModels History & Development
• Statsmodels is a Python library that provides classes &
functions for estimation of many statistical functions
• It is useful for conducting tests such as ANOVA, ARMA,
time-series, various flavors of regressions
• Results are tested against existing statistical packages to
ensure accuracy
• For those of you who are used to R, you can fit models
using R-style functional programming
• The modules were originally from scipy.stats written by
Jonathan Taylor. It was later expanded and moved.
• As part of the Google Summer of Code 2009, statsmodels was
tested, improved and released as a package. Since then a
team of developers from Google and AWR have supported the
development. To oversee coding practices (i.e. use of PEP-
8) python.org typically reviews modules/libraries.
Use Cases: Scikit-Learn
• Classification – identify which category an object or
person belongs too, eg. Spam detection or image
recognition, or which of you will pay more than $40, $75 or
$100 for a pair of shoes?
• Regression, predicting continuous-value attributes
associated with an object, e.g. patient drug response based
on other factors
• Clustering – grouping similar objects into sets, e.g.
customer segmentation, grouping experimental outcomes
• Dimensionality reduction (reducing the number of variables
included in ML analyses), see my github for example
• Model selection – comparing, cross-validating, choosing
tuning parameters & metrics
• Preprocessing (yes, this is important!!!) – feature
extraction & normalization, transforming input data such as
text, into a vector or representation that can be used by a
ML algorithm
Use Cases: StatsModels
• Linear regression models (I will show an example,
but not the best example)
• Plotting data to assess its fit – are you over
fitting or under fitting or just right?
• Discrete Choice Models – how good is your
regression and other uses
• Nonparametric Statistics – e.g. t-tests for data
not normally distributed
• General Linear Models – other flavors of
regressions
• Robust Regression – more regressions!
• Time Series Analyses – used in Fraud Detection
• Others such as ANOVA, Kernel Density & Survival
Analyses
Polio Virus
• Polio Virus (PV) is a RNA-based virus
• First epidemic was 1894. During late 1940s & 1950s,
polio crippled more than 35,000 people per month in the
US
• PV is still present in population of 3rd world countries
• President Franklin D. Roosevelt, a Polio survivor,
helped to found the March of Dimes. His intent was to
raise funds to develop a Polio Vaccine.
• Vaccine was invented by Dr. Jonas Salk
• US has been polio-free since 1979
Health Data: Polio Rates and Vaccination in
the United States
• Polio is a viral RNA strand that causes
myelytis, respiratory problems and sometimes
paralysis
• Vaccination started in late 1950s & early
1960s
• Some info about the dataset
– Data begins in 1916
– Gathered by Centers for Disease Control
– Downloaded from healthdata.gov
Analysis Work Flow Polio Data I
• Hypothesis 1: Polio Rates Decreased due to
Vaccination
• Take a peak at the data & check for:
– “Missing-ness”
– Number of observations and types of
observations
– Perform an initial visualization
• Perform a regression analysis to determine
whether the use of vaccines was correlated
to an exponential drop in Polio rates
What the ALL the Data Looks Like…
Assumptions using ALL the data (aggregated data) can lead to
results that are less than interpretable or misleading…this
graph makes it seem that vaccine was irrelevant as the Polio
rates decreased exponentially before the vaccinations
started…But is that true?
Some of the Code
Its good practice to import all the libraries and modules
you will use at the top of your code file when doing ad
hoc analyses. Jupyter notebook will be provided in github.
Some more of the Code (our regression)
Summary Outcome
• Alternate hypothesis: Rates of decreased
incidence of Polio differed by state.
• Our linear regression was not a good fit
using Ordinary Least Squares and the
aggregated data might have been misleading
• There was significant skew and kurtosis
• Either a log-odds regression with a different
distribution family chosen OR a non-
parametric test would be more appropriate for
this data considering skew; alternatively
transforming to normal distribution can be
appropriate
Analysis Work Flow Polio Data 2:
• Hypothesis 2: Polio rates decreased at
different rates depending upon area of the
country
• Take a peak at the data & check for:
– Perform an initial visualization based upon state
(we are keeping things simplistic by choosing a
state in the north, south, east, west)
• Perform a time-series analysis to determine
if Polio rates were decreasing significantly
between 1945-1965 (slightly before and
slightly after vaccinations began)or it was a
constant decrease. This analysis will be
available in the Jupyter notebook.
What the data Looks like..
The visualization of data that is not aggregated,
but rather separated by state, shows a binomial
distribution, not an exponential decline.
Insights & Future Action Points for Polio
Study
• Vaccination had an effect, which created an initial
dip in Polio levels not long after vaccination began.
• Although the rate of polio decreased in response to
vaccinations with a moderate decline, the incidences
rose again.
• Ultimately vaccination and public health measures
were able to wipe out new incidences of Polio from
the US--but not until 1979, decades after the vaccine
was first administered
• Population rates of disease do not necessarily
correlate with vaccination
• Vigilance and population-level prevention should be
supplemented (not replaced) with vaccination
Example 2: K-means Clustering of Iris
Dataset
• Quick example of visual analysis & K-means
clustering using the canonical ‘Iris’ Dataset
• This dataset includes different examples of
Iris Flowers along with their physical
features
• We are taking a simple example directly from
the Sci-kit learn library but I will also add
an example of cluster analysis for the Polio
data at a later point in the Jupyter notebook
within my github repository
Some of the Code
Output for K-means Clustering
Insights: As we might have
guessed there are
3 clusters for most feature
combinations, and these are
generally separate for each
type of flower—but not always!
Can you see where this isn’t
true?
The End
• Thank you ObjectRocket & Rackspace for sponsoring
PyLadies ATX and this talk!
• Where to find the data: www.healthdata.gov
• Where to find all of the Code:
https://github.com/jddavis-100/Statistics-and-
Machine-Learning/wiki/Welcome-&-Table-of-Contents
• Where to find the Jupyter Notebook: I will be
providing it to Sara Safavi so contact her soon. You
can also find a static copy of it on my wiki (soon).
• Where to have fun: start on 6th & make your way to
Rainey…or out to Salt Lick Grill or ACL festival in
Zilker Park…or…any number of awesome places in ATX!
A very simplistic Confusion Matrix
Understanding the true positives, true negatives, false
positives and false negatives, allows us to calculate
accuracy & precision. We can also use this analyses on
both the test and the training data. Other tests such as
marginal error are sometimes used.

Intro scikitlearnstatsmodels

  • 1.
    Intro to Scikit-Learnand StatsModels for the Absolute Beginner Jennifer D. Davis, Ph.D. July 2, 2015
  • 2.
    “Risks, I liketo say, always pay off. You learn what to do, or what not to do.” - Dr. Jonas E Salk
  • 3.
    Outline • Machine learningand statistics, tools of the data scientist • Why python? • Popular Scikit Learn ML algorithms • Popular StatsModels algorithms • History of Scikit Learn and StatsModels • A use case: Polio Rates and Vaccination in the United States Note: many of the slides contain lots of text or notes so you don’t need to take written notes. At the same time, this is a talk for absolute beginners and so we present in a fairly non-technical manner. Experienced audience members may find some information lacking detail or caveats. Additional information/tutorial will be available in a Jupyter notebook on github.
  • 4.
    Why Python? • Welldeveloped scripting language that can also be utilized for software development & is *scalable* • Well developed machine learning libraries backed by developers at Google among other places • Runs on C/C++ in the background, so complex computations can run faster or be ported to C • Runs on big data platforms like Spark (pySpark) • Plays nicely with other programming languages (see Jython & Cython for porting to Java and C respectively, other methods work too)
  • 5.
    Why Machine Learning? •Machine learning is a subset of Artificial Intelligence, which is as the title suggests, uses mathematics to mimic learning intelligence • Machine learning takes complex data, mathematically models it (using training data) under tunable parameters, and allows for predictions or assessments of *individuals* within or compared to groups • Machine learning includes network analysis, deep learning, probability density graphs, supervised learning, unsupervised learning, dimensionality reduction (SVM, PCA) and other techniques
  • 6.
    Why Statistics? • Statisticsis the mathematical application to data to build a ‘model’ of how observations fit into a ‘big picture’ • Statistical analyses often include correlations, assessments of how ‘good’ a model is based on error rates or population fits • Statistics is an essential part of data science repertoire, but data scientists do not *rely* on statistics alone • Examples include ANOVA, Pearson’s Correlation, ROC Curves (assesses various models), Time Series, Regressions • Statistical techniques can be applied to Machine Learning algorithms to determine how effective, accurate or predictive the algorithm is, but they are not the only method • Examples include: PPV, NPV, ROC Curves
  • 7.
    How do Statistics& Machine Learning Relate to One Another? • Statistical methods are used to assess the performance of a machine learning algorithm often but do not require data to ‘tune’ the statistical test • Some statistical tests can be utilized as machine learning algorithms (e.g. log-odds regressions etc.) • While Statistics is not generally considered part of artificial intelligence, it can be used to determine the accuracy, learning rate and other parameters tied to AI & Machine Learning. • Machine learning algorithms use test data to tune their parameters. Remember the musician who’s instrument is out of tune? We don’t want that (under-fitting). And we don’t want the musician tuned only to themselves—but differently than the rest of the band--that’s over-fitting.
  • 8.
    The Top 5Machine Learning Algorithms for Data Science Available in Scikit-Learn • PageRank (Principal Eigenvector) • AdaBoost (Ensemble Learning) • kNN (K-nearest neighbor Classification) • Principal Component Analysis (dimensionality reduction) • Neural Network Models (example, Restricted Boltzmann machines)
  • 9.
    The Top 5Statistical Models for Data Science Available in StatsModels • Generalized linear models (e.g. ordinary least squares regressions) • Nonparametric estimators • Analysis of Variance • Times Series Analysis • Survival Analysis
  • 10.
    Scikit Learn: History& Development • Project started in 2007 as a Google Summer of Code project by David Counapeau. • Matthieu Brucher then took it up as part of his thesis work. • 2010 Fabian Pedregosa, Gael Varoquaux, Alexandre Gramfort & Vincent Miachel of INRIA took project leadership • The first public release was February 1, 2010 • Since releases have appeared about every ~3 months • A great community exists, so if you’d like to contribute your own code for machine-learning algorithms contact the scikit-learn team.
  • 11.
    StatsModels History &Development • Statsmodels is a Python library that provides classes & functions for estimation of many statistical functions • It is useful for conducting tests such as ANOVA, ARMA, time-series, various flavors of regressions • Results are tested against existing statistical packages to ensure accuracy • For those of you who are used to R, you can fit models using R-style functional programming • The modules were originally from scipy.stats written by Jonathan Taylor. It was later expanded and moved. • As part of the Google Summer of Code 2009, statsmodels was tested, improved and released as a package. Since then a team of developers from Google and AWR have supported the development. To oversee coding practices (i.e. use of PEP- 8) python.org typically reviews modules/libraries.
  • 12.
    Use Cases: Scikit-Learn •Classification – identify which category an object or person belongs too, eg. Spam detection or image recognition, or which of you will pay more than $40, $75 or $100 for a pair of shoes? • Regression, predicting continuous-value attributes associated with an object, e.g. patient drug response based on other factors • Clustering – grouping similar objects into sets, e.g. customer segmentation, grouping experimental outcomes • Dimensionality reduction (reducing the number of variables included in ML analyses), see my github for example • Model selection – comparing, cross-validating, choosing tuning parameters & metrics • Preprocessing (yes, this is important!!!) – feature extraction & normalization, transforming input data such as text, into a vector or representation that can be used by a ML algorithm
  • 13.
    Use Cases: StatsModels •Linear regression models (I will show an example, but not the best example) • Plotting data to assess its fit – are you over fitting or under fitting or just right? • Discrete Choice Models – how good is your regression and other uses • Nonparametric Statistics – e.g. t-tests for data not normally distributed • General Linear Models – other flavors of regressions • Robust Regression – more regressions! • Time Series Analyses – used in Fraud Detection • Others such as ANOVA, Kernel Density & Survival Analyses
  • 14.
    Polio Virus • PolioVirus (PV) is a RNA-based virus • First epidemic was 1894. During late 1940s & 1950s, polio crippled more than 35,000 people per month in the US • PV is still present in population of 3rd world countries • President Franklin D. Roosevelt, a Polio survivor, helped to found the March of Dimes. His intent was to raise funds to develop a Polio Vaccine. • Vaccine was invented by Dr. Jonas Salk • US has been polio-free since 1979
  • 15.
    Health Data: PolioRates and Vaccination in the United States • Polio is a viral RNA strand that causes myelytis, respiratory problems and sometimes paralysis • Vaccination started in late 1950s & early 1960s • Some info about the dataset – Data begins in 1916 – Gathered by Centers for Disease Control – Downloaded from healthdata.gov
  • 16.
    Analysis Work FlowPolio Data I • Hypothesis 1: Polio Rates Decreased due to Vaccination • Take a peak at the data & check for: – “Missing-ness” – Number of observations and types of observations – Perform an initial visualization • Perform a regression analysis to determine whether the use of vaccines was correlated to an exponential drop in Polio rates
  • 17.
    What the ALLthe Data Looks Like… Assumptions using ALL the data (aggregated data) can lead to results that are less than interpretable or misleading…this graph makes it seem that vaccine was irrelevant as the Polio rates decreased exponentially before the vaccinations started…But is that true?
  • 18.
    Some of theCode Its good practice to import all the libraries and modules you will use at the top of your code file when doing ad hoc analyses. Jupyter notebook will be provided in github.
  • 19.
    Some more ofthe Code (our regression)
  • 20.
    Summary Outcome • Alternatehypothesis: Rates of decreased incidence of Polio differed by state. • Our linear regression was not a good fit using Ordinary Least Squares and the aggregated data might have been misleading • There was significant skew and kurtosis • Either a log-odds regression with a different distribution family chosen OR a non- parametric test would be more appropriate for this data considering skew; alternatively transforming to normal distribution can be appropriate
  • 21.
    Analysis Work FlowPolio Data 2: • Hypothesis 2: Polio rates decreased at different rates depending upon area of the country • Take a peak at the data & check for: – Perform an initial visualization based upon state (we are keeping things simplistic by choosing a state in the north, south, east, west) • Perform a time-series analysis to determine if Polio rates were decreasing significantly between 1945-1965 (slightly before and slightly after vaccinations began)or it was a constant decrease. This analysis will be available in the Jupyter notebook.
  • 22.
    What the dataLooks like.. The visualization of data that is not aggregated, but rather separated by state, shows a binomial distribution, not an exponential decline.
  • 23.
    Insights & FutureAction Points for Polio Study • Vaccination had an effect, which created an initial dip in Polio levels not long after vaccination began. • Although the rate of polio decreased in response to vaccinations with a moderate decline, the incidences rose again. • Ultimately vaccination and public health measures were able to wipe out new incidences of Polio from the US--but not until 1979, decades after the vaccine was first administered • Population rates of disease do not necessarily correlate with vaccination • Vigilance and population-level prevention should be supplemented (not replaced) with vaccination
  • 24.
    Example 2: K-meansClustering of Iris Dataset • Quick example of visual analysis & K-means clustering using the canonical ‘Iris’ Dataset • This dataset includes different examples of Iris Flowers along with their physical features • We are taking a simple example directly from the Sci-kit learn library but I will also add an example of cluster analysis for the Polio data at a later point in the Jupyter notebook within my github repository
  • 25.
  • 26.
    Output for K-meansClustering Insights: As we might have guessed there are 3 clusters for most feature combinations, and these are generally separate for each type of flower—but not always! Can you see where this isn’t true?
  • 27.
    The End • Thankyou ObjectRocket & Rackspace for sponsoring PyLadies ATX and this talk! • Where to find the data: www.healthdata.gov • Where to find all of the Code: https://github.com/jddavis-100/Statistics-and- Machine-Learning/wiki/Welcome-&-Table-of-Contents • Where to find the Jupyter Notebook: I will be providing it to Sara Safavi so contact her soon. You can also find a static copy of it on my wiki (soon). • Where to have fun: start on 6th & make your way to Rainey…or out to Salt Lick Grill or ACL festival in Zilker Park…or…any number of awesome places in ATX!
  • 28.
    A very simplisticConfusion Matrix Understanding the true positives, true negatives, false positives and false negatives, allows us to calculate accuracy & precision. We can also use this analyses on both the test and the training data. Other tests such as marginal error are sometimes used.

Editor's Notes

  • #9 PageRank (Principal Eigenvector) was invented by Sergey Brin & Larry Page, 1998. Search ranking algorithm using hyperlinks on the web. The basis for the original Google search engine. AdaBoost (ensemble learning) – used in Ensemble Learning, a method to employ multiple ‘learners’ to solve a problem. AdaBoost is one of the most utilized ensemble algorithms invented by Yoav Fruend & Robert Schapire. kNN (K-nearest neighbor Classification) – this algorithm finds a group of ‘k’ objects in the training set that are closest (e.g. eucledian distance) to the test object. Elements required include (1) set of labeled objects, (2) a similarity metric and (2) the value of k (number of nearest neighbors). Principal Component Analysis (dimensionality reduction) Neural Network Models (e.g. Restricted Boltzmann machines)
  • #27 The plots display firstly what a K-means algorithm would yield using three clusters. It is then shown what the effect of a bad initialization is on the classification process: By setting n_init to only 1 (default is 10), the amount of times that the algorithm will be run with different centroid seeds is reduced. The next plot displays what using eight clusters would deliver and finally the ground truth.