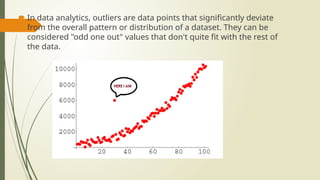
In dataanalytics, outliers are data points that significantly deviate
from the overall pattern or distribution of a dataset. They can be
considered "odd one out" values that don't quite fit with the rest of
the data.
3.
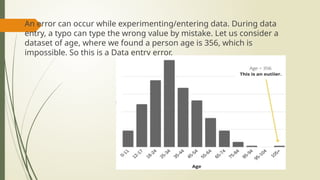
An errorcan occur while experimenting/entering data. During data
entry, a typo can type the wrong value by mistake. Let us consider a
dataset of age, where we found a person age is 356, which is
impossible. So this is a Data entry error.
4.
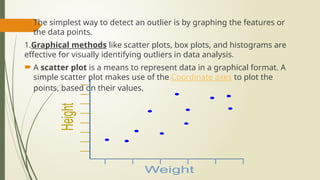
The simplestway to detect an outlier is by graphing the features or
the data points.
1.Graphical methods like scatter plots, box plots, and histograms are
effective for visually identifying outliers in data analysis.
A scatter plot is a means to represent data in a graphical format. A
simple scatter plot makes use of the Coordinate axes to plot the
points, based on their values.
6.
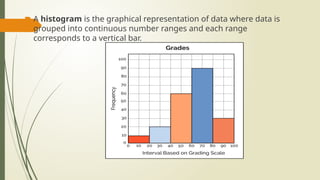
A histogramis the graphical representation of data where data is
grouped into continuous number ranges and each range
corresponds to a vertical bar.
7.
Standard deviation isa statistical measurement that looks at how far
discrete points in a dataset are dispersed from the mean of that set. It is
calculated as the square root of the variance.
If data points are far from the mean, there is a higher deviation
within the data set.
Z- Scores:In data analytics, a z-score (or standard score) indicates
how many standard deviations a data point is away from the mean of
a dataset. It's a way to standardize data, allowing for comparisons
across different datasets or distributions. A positive z-score means
the data point is above the mean, a negative score means it's below,
and a zero score means it's equal to the mean.
8.
The z-scoreis calculated using the following formula:
z = (x - μ) / σ
where: z is the z-score, x is the value of the data point, μ is the
population mean, and σ is the population standard deviation
9.
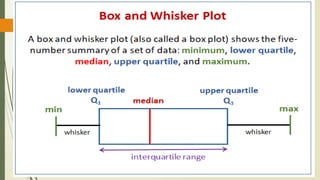
Interquartile Range method
The interquartile range (IQR) in data analytics is a measure of statistical
dispersion, specifically representing the range of the middle 50% of a
dataset. It is calculated by subtracting the first quartile (Q1) from the third
quartile (Q3). IQR is a robust measure of spread, less susceptible to
outliers than the range (difference between maximum and minimum
values)
10.
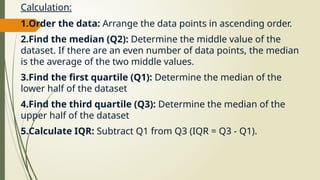
Calculation:
1.Order the data:Arrange the data points in ascending order.
2.Find the median (Q2): Determine the middle value of the
dataset. If there are an even number of data points, the median
is the average of the two middle values.
3.Find the first quartile (Q1): Determine the median of the
lower half of the dataset
4.Find the third quartile (Q3): Determine the median of the
upper half of the dataset
5.Calculate IQR: Subtract Q1 from Q3 (IQR = Q3 - Q1).
11.
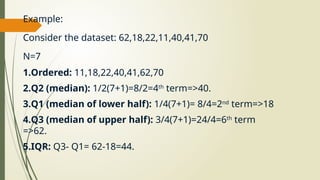
Example:
Consider the dataset:62,18,22,11,40,41,70
N=7
1.Ordered: 11,18,22,40,41,62,70
2.Q2 (median): 1/2(7+1)=8/2=4th
term=>40.
3.Q1 (median of lower half): 1/4(7+1)= 8/4=2nd
term=>18
4.Q3 (median of upper half): 3/4(7+1)=24/4=6th
term
=>62.
5.IQR: Q3- Q1= 62-18=44.
12.
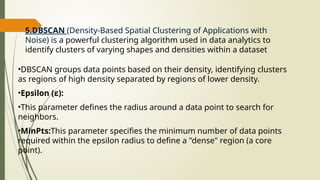
5.DBSCAN (Density-Based SpatialClustering of Applications with
Noise) is a powerful clustering algorithm used in data analytics to
identify clusters of varying shapes and densities within a dataset
•DBSCAN groups data points based on their density, identifying clusters
as regions of high density separated by regions of lower density.
•Epsilon (ε):
•This parameter defines the radius around a data point to search for
neighbors.
•MinPts:This parameter specifies the minimum number of data points
required within the epsilon radius to define a "dense" region (a core
point).
14.
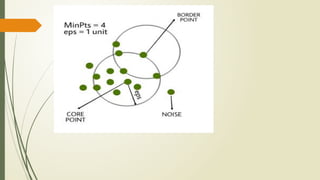
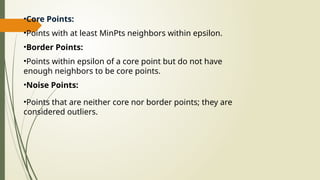
•Core Points:
•Points withat least MinPts neighbors within epsilon.
•Border Points:
•Points within epsilon of a core point but do not have
enough neighbors to be core points.
•Noise Points:
•Points that are neither core nor border points; they are
considered outliers.
15.
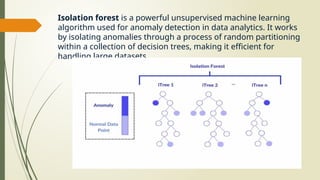
Isolation forest isa powerful unsupervised machine learning
algorithm used for anomaly detection in data analytics. It works
by isolating anomalies through a process of random partitioning
within a collection of decision trees, making it efficient for
handling large datasets.