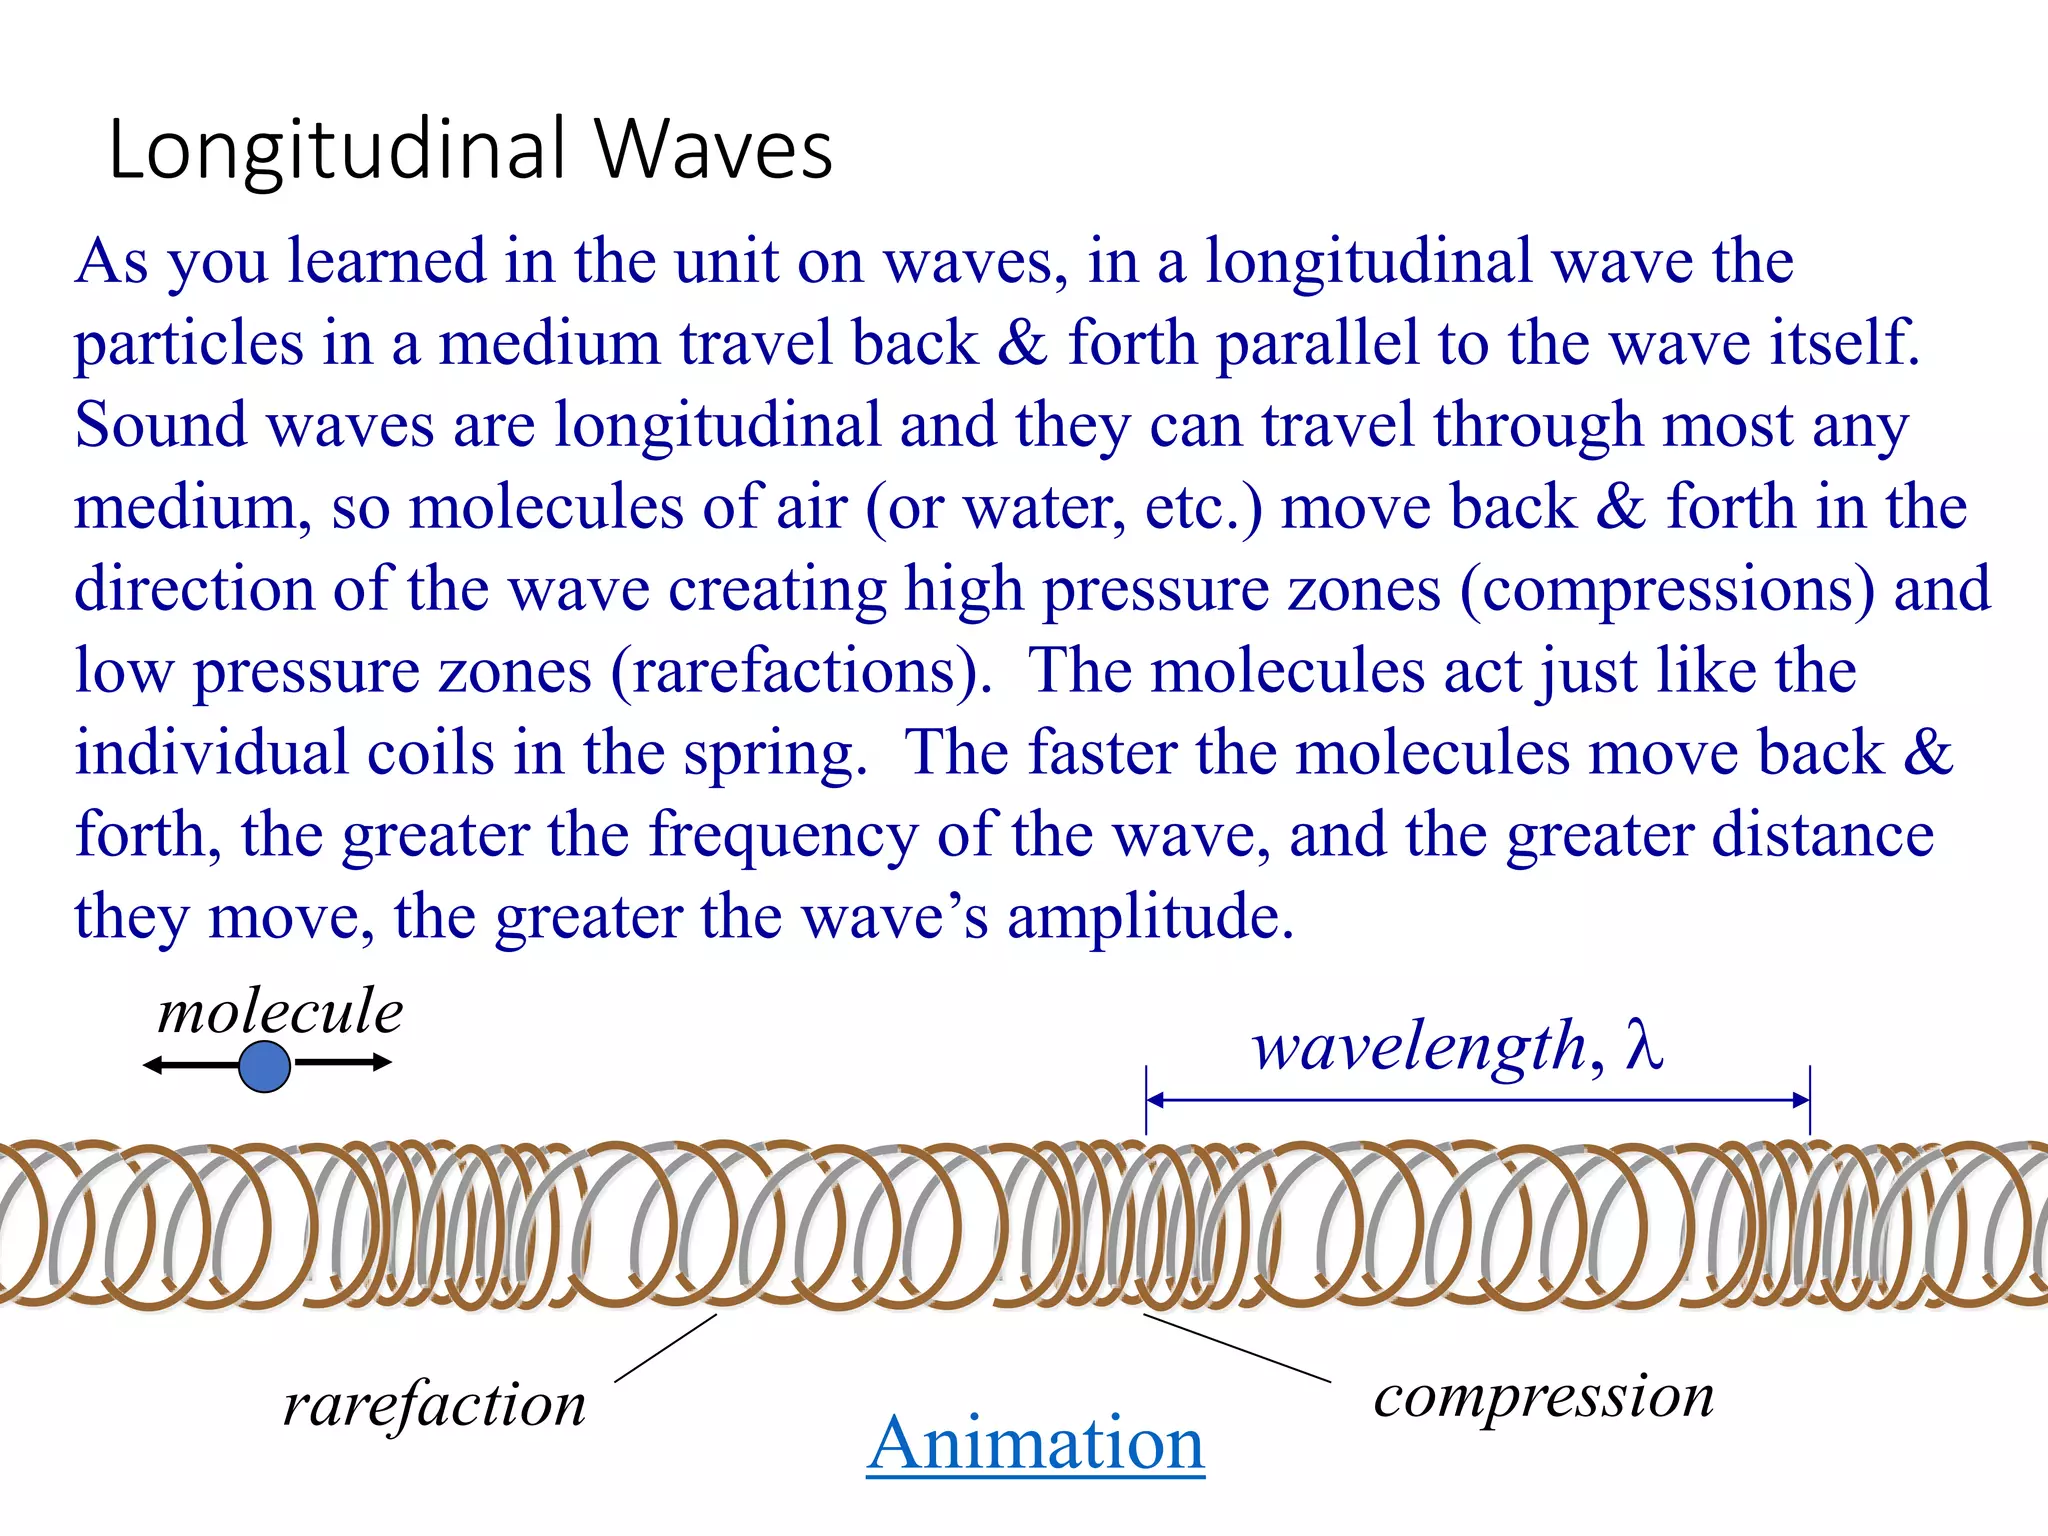
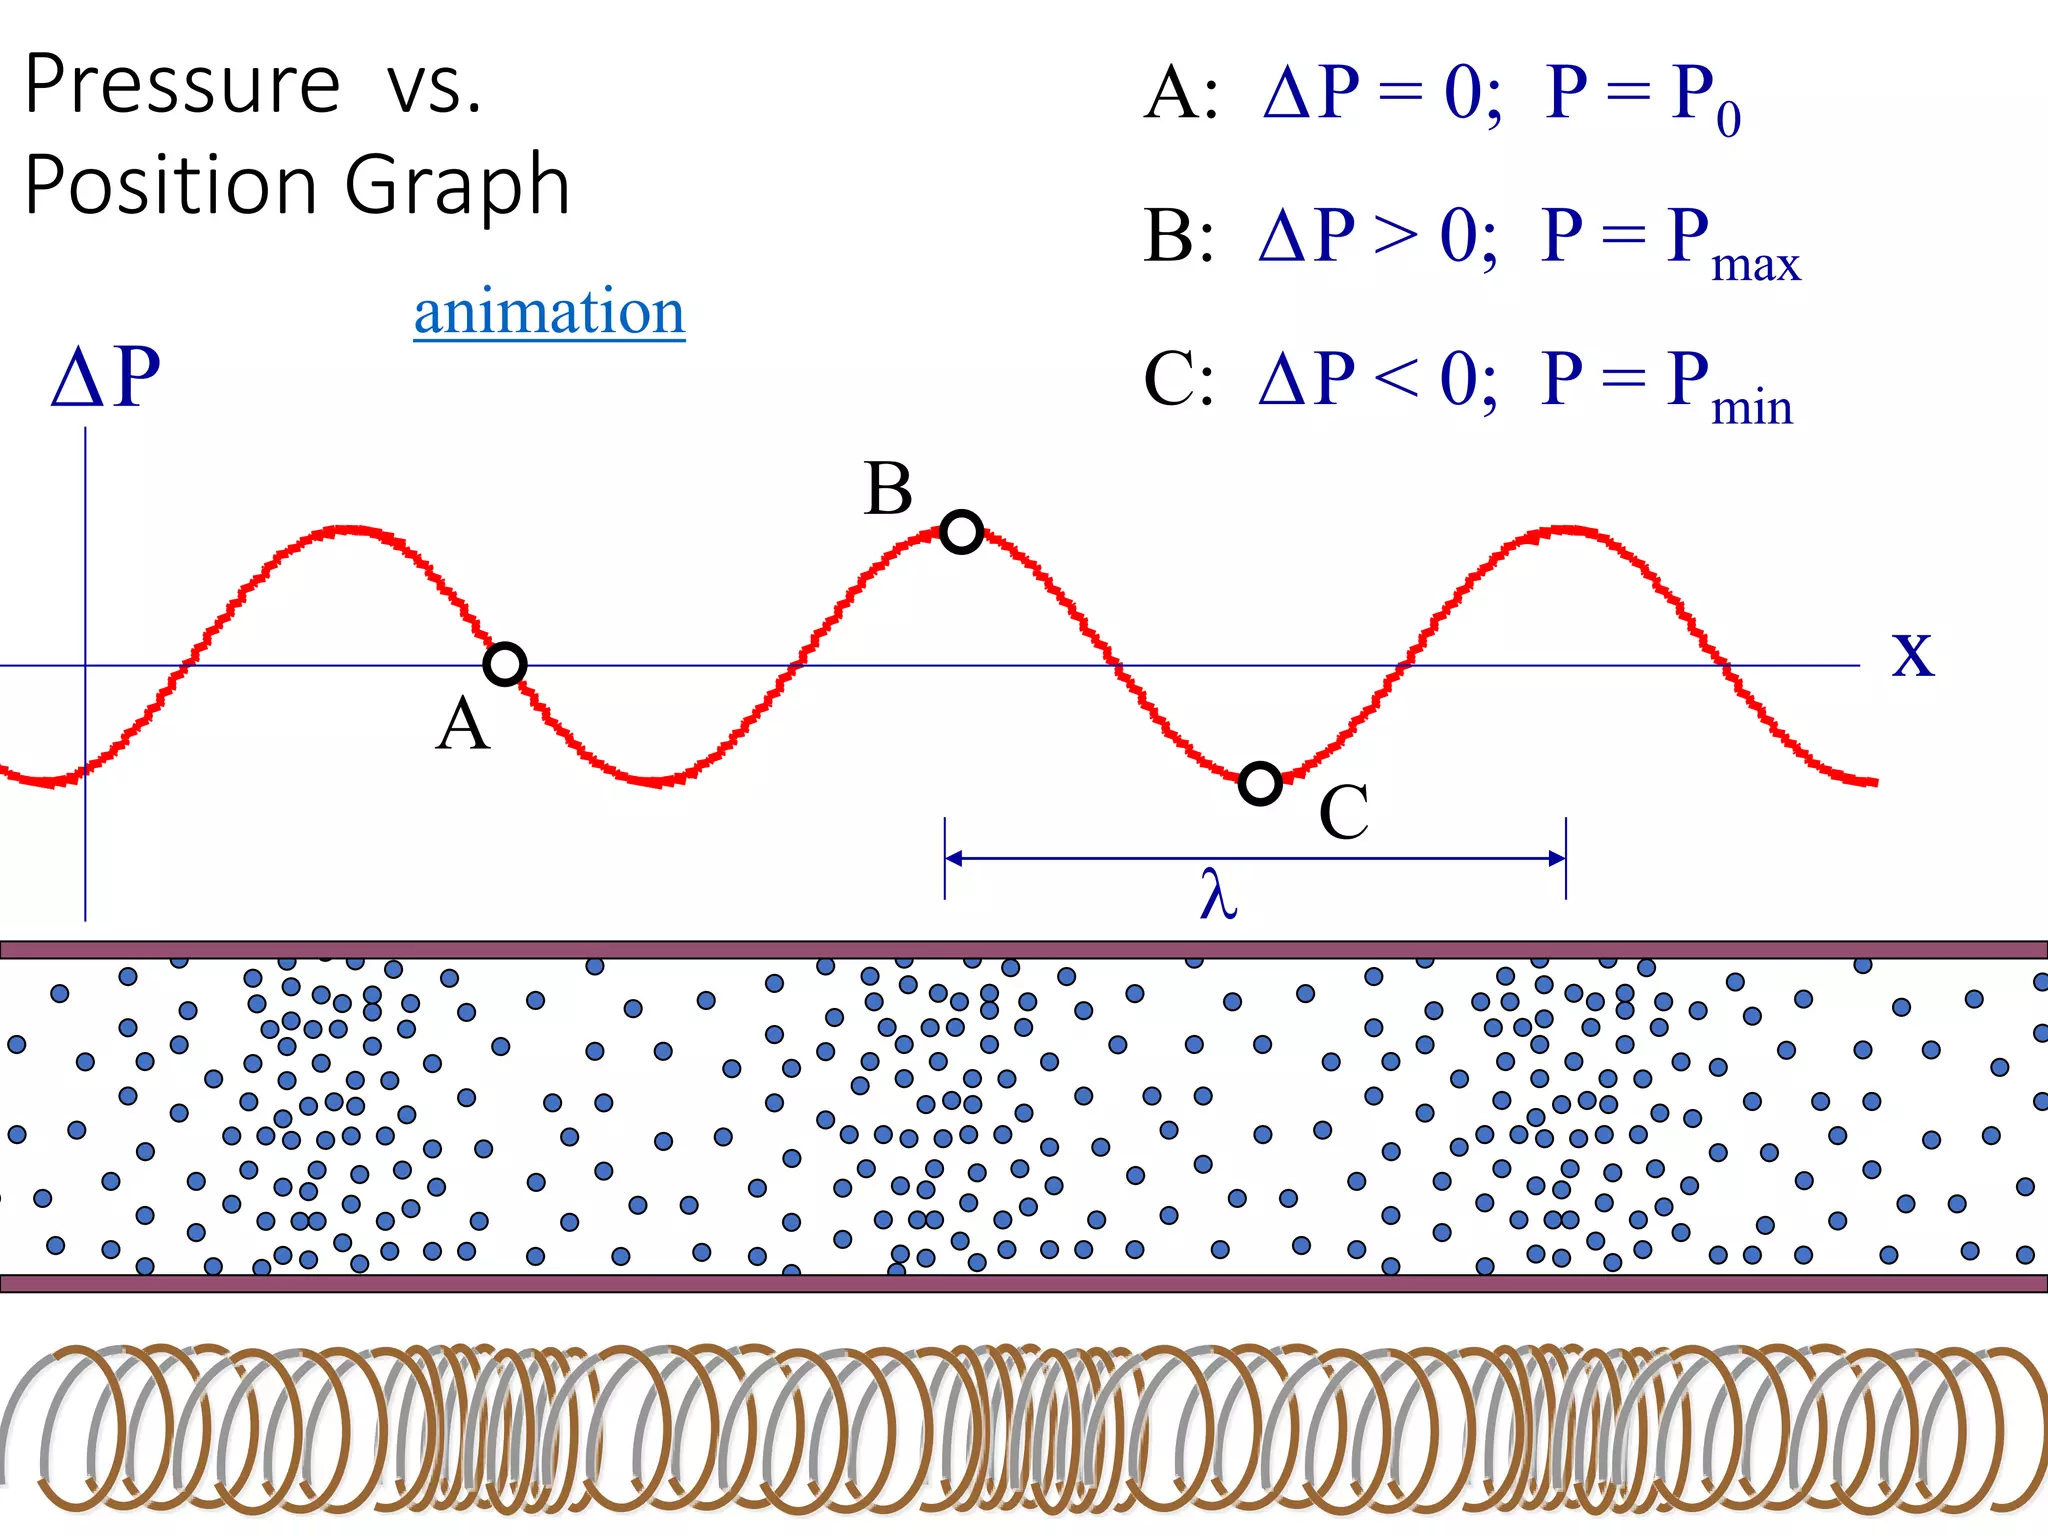
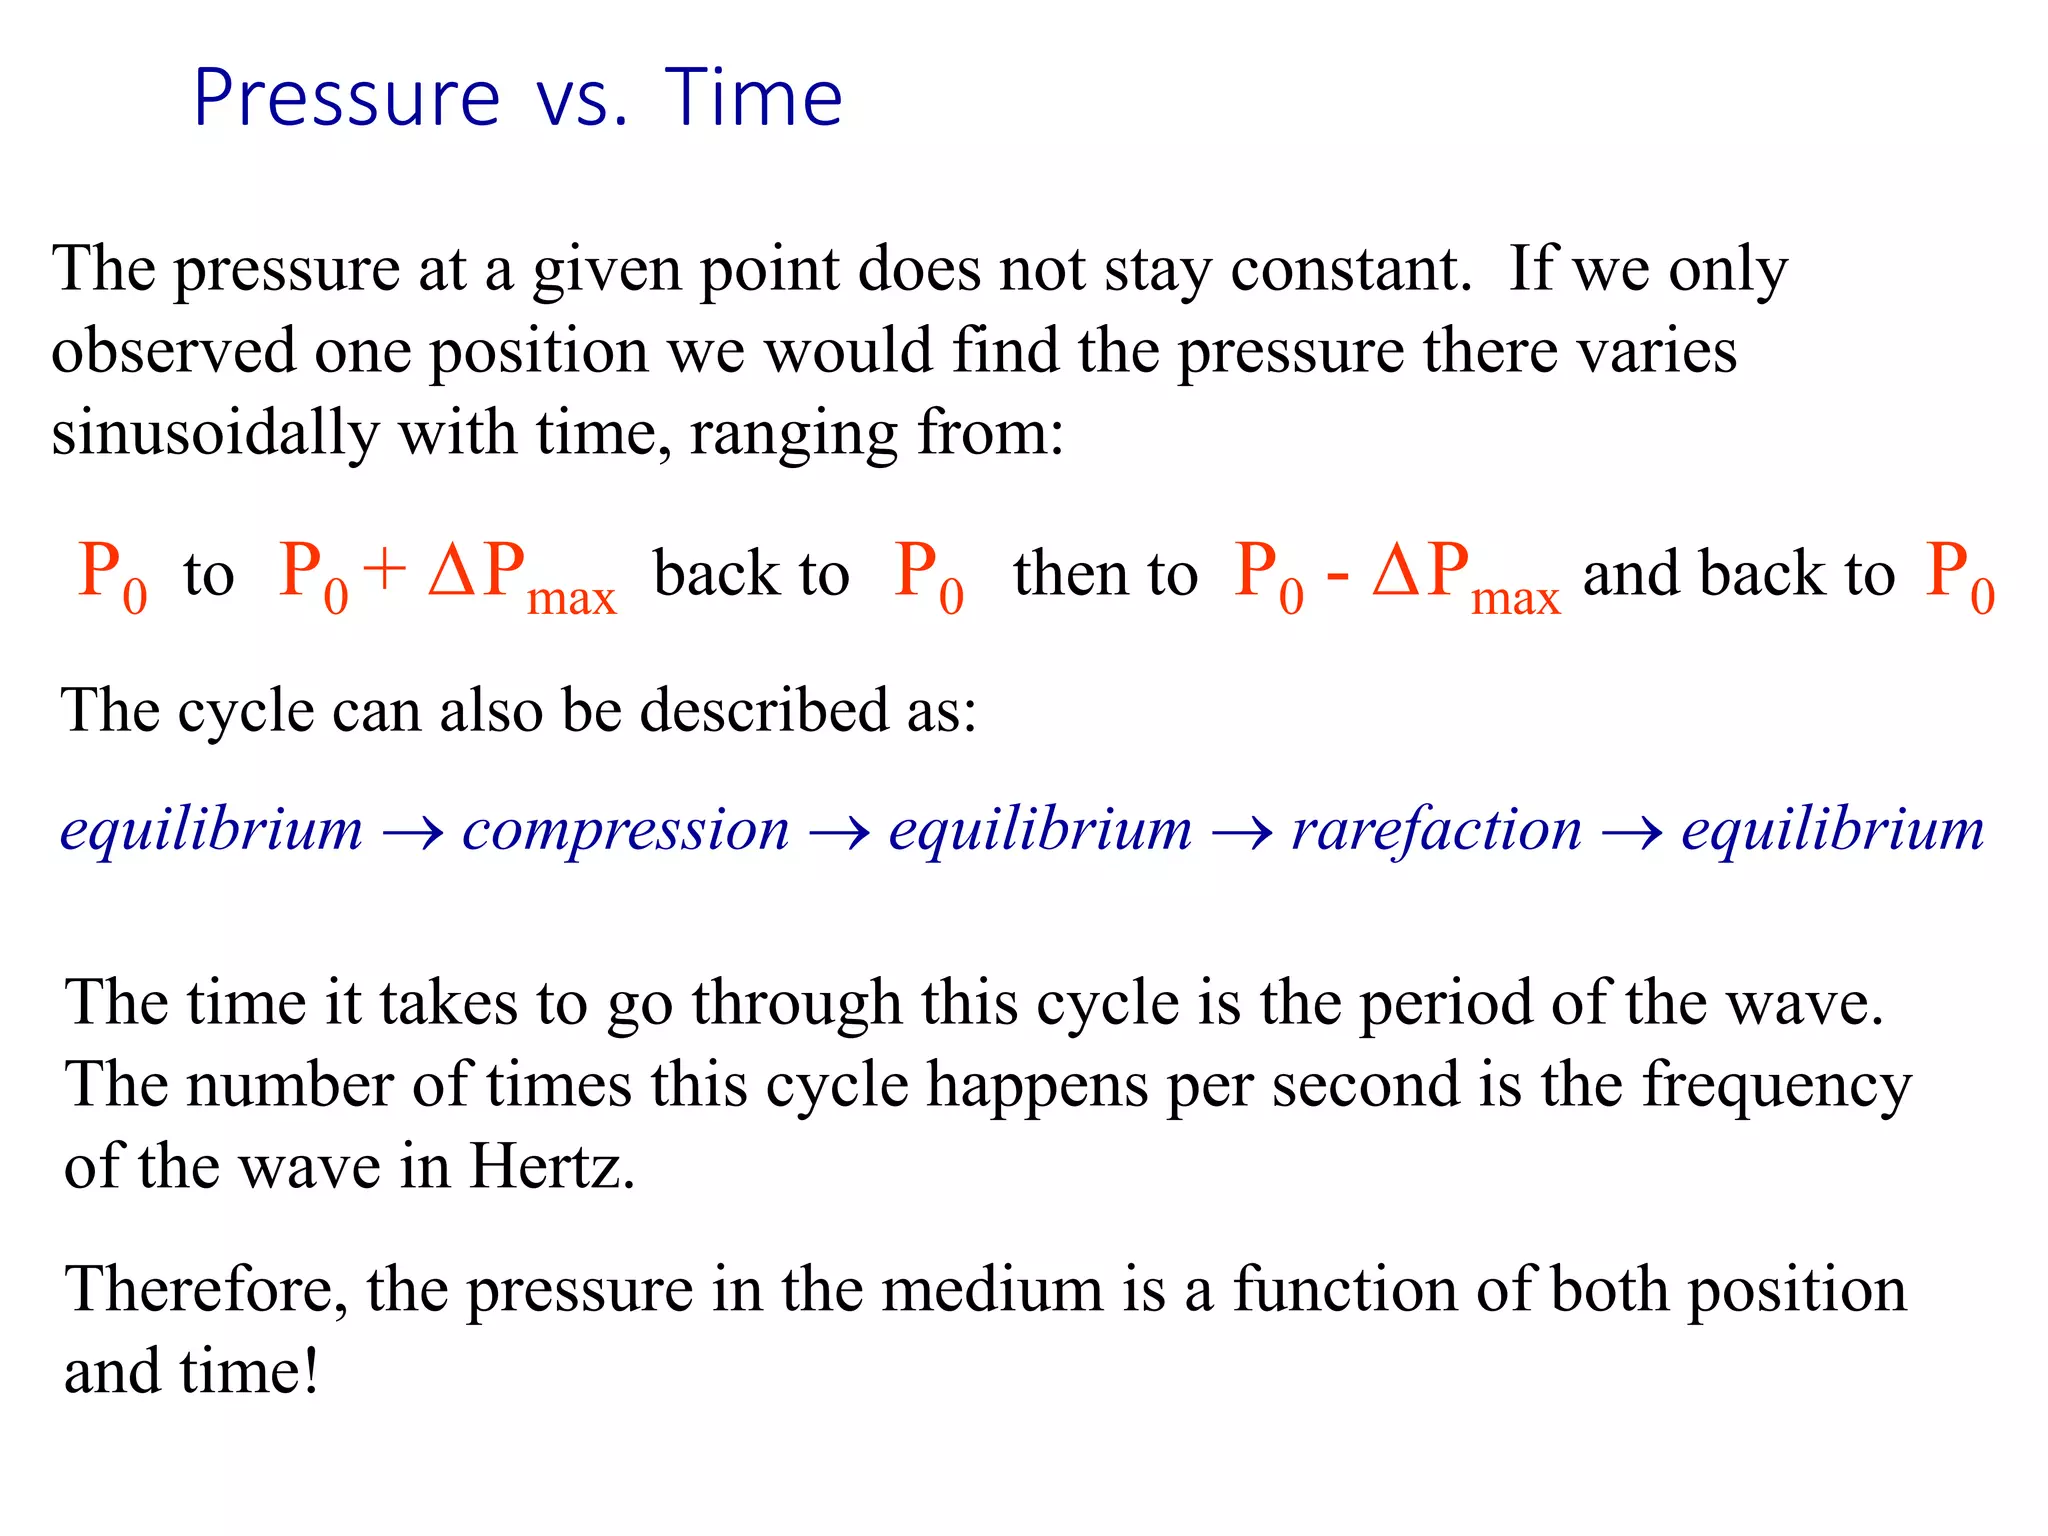
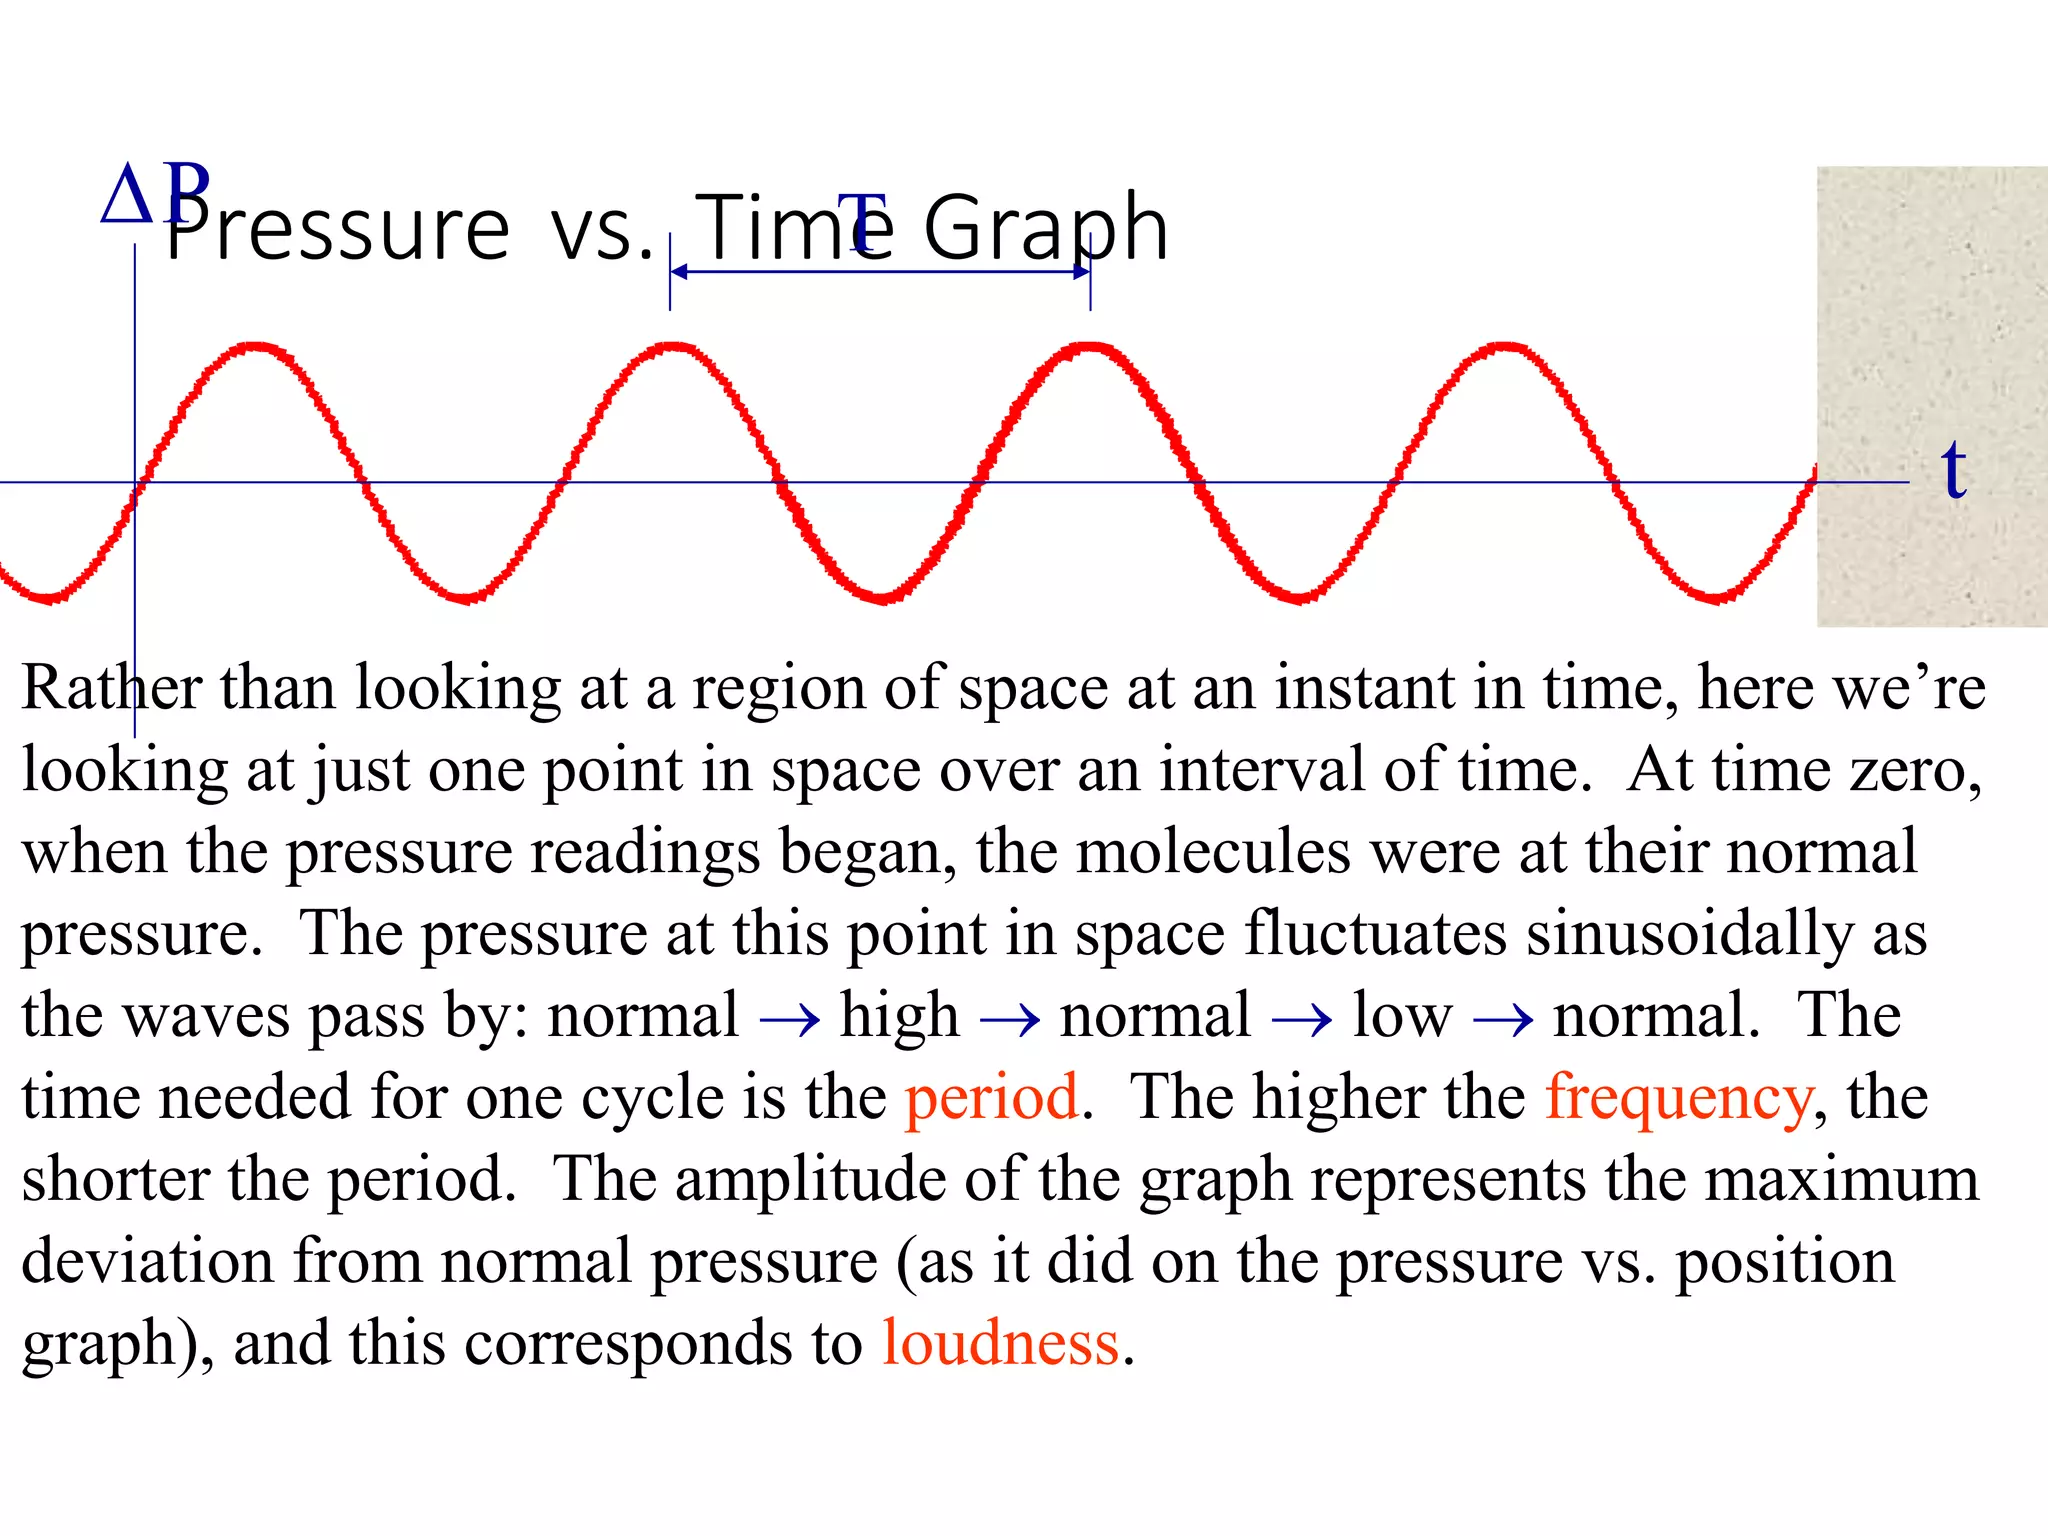
This document provides information about sound waves and how they propagate. It discusses longitudinal waves, pressure variations in sound waves, factors that determine the speed of sound in different mediums, wavefronts, frequency and pitch, how the human ear detects sound, and the range of human hearing. Examples of different speeds of sound in various materials like air, water, steel and glass are given.
WAVES
INTRODUCTION
A wave is a period disturbance which transfers energy from one place to another.
There are two types of waves:
1. Mechanical waves
2. Electromagnetic waves
WAVES
INTRODUCTION
A wave is a period disturbance which transfers energy from one place to another.
There are two types of waves:
1. Mechanical waves
2. Electromagnetic waves
A powerpoint explaining what sound waves are, the equation used to calculate displacement, the equation used to calculate pressure and the equation for intensity.
Sound waves are produced by the vibration of material objects. A disturbance in the form of a longitudinal wave travels away from the vibrating source. High-pitched sounds are produced by sources vibrating at high frequency, while low-pitched sounds are produced by low-frequency sources Sound waves consist of traveling pulses of high-pressure zones, or compression, alternating with pulses of low-pressures zones, or rarefaction. Sound can travel through gases, liquids, and solid, but not through a vacuum.
it is about a chapter and learning this chapter is very important for class 8 and further standerds. it contains about sound,eye,ear, and its parts .all the best for your exams
Identify sound waves in nature and physics, the type of piezowaves accompanying them, the difference between sound waves audible to humans and between ultrasound and subsonic waves, how to theoretically calculate their speed when they pass through different physical media, calculate their frequency and wavelength, and the effect of temperatures and the density of different materials on these calculations
All about fibre optics prepares by some university students.It covers all the aspects of optical fibre which includes the working principle, advantages of optics, application and how total internal reflections occurs in a wire.
This pdf is about the Schizophrenia.
For more details visit on YouTube; @SELF-EXPLANATORY;
https://www.youtube.com/channel/UCAiarMZDNhe1A3Rnpr_WkzA/videos
Thanks...!
Observation of Io’s Resurfacing via Plume Deposition Using Ground-based Adapt...Sérgio Sacani
Since volcanic activity was first discovered on Io from Voyager images in 1979, changes
on Io’s surface have been monitored from both spacecraft and ground-based telescopes.
Here, we present the highest spatial resolution images of Io ever obtained from a groundbased telescope. These images, acquired by the SHARK-VIS instrument on the Large
Binocular Telescope, show evidence of a major resurfacing event on Io’s trailing hemisphere. When compared to the most recent spacecraft images, the SHARK-VIS images
show that a plume deposit from a powerful eruption at Pillan Patera has covered part
of the long-lived Pele plume deposit. Although this type of resurfacing event may be common on Io, few have been detected due to the rarity of spacecraft visits and the previously low spatial resolution available from Earth-based telescopes. The SHARK-VIS instrument ushers in a new era of high resolution imaging of Io’s surface using adaptive
optics at visible wavelengths.
Richard's entangled aventures in wonderlandRichard Gill
Since the loophole-free Bell experiments of 2020 and the Nobel prizes in physics of 2022, critics of Bell's work have retreated to the fortress of super-determinism. Now, super-determinism is a derogatory word - it just means "determinism". Palmer, Hance and Hossenfelder argue that quantum mechanics and determinism are not incompatible, using a sophisticated mathematical construction based on a subtle thinning of allowed states and measurements in quantum mechanics, such that what is left appears to make Bell's argument fail, without altering the empirical predictions of quantum mechanics. I think however that it is a smoke screen, and the slogan "lost in math" comes to my mind. I will discuss some other recent disproofs of Bell's theorem using the language of causality based on causal graphs. Causal thinking is also central to law and justice. I will mention surprising connections to my work on serial killer nurse cases, in particular the Dutch case of Lucia de Berk and the current UK case of Lucy Letby.
Introduction:
RNA interference (RNAi) or Post-Transcriptional Gene Silencing (PTGS) is an important biological process for modulating eukaryotic gene expression.
It is highly conserved process of posttranscriptional gene silencing by which double stranded RNA (dsRNA) causes sequence-specific degradation of mRNA sequences.
dsRNA-induced gene silencing (RNAi) is reported in a wide range of eukaryotes ranging from worms, insects, mammals and plants.
This process mediates resistance to both endogenous parasitic and exogenous pathogenic nucleic acids, and regulates the expression of protein-coding genes.
What are small ncRNAs?
micro RNA (miRNA)
short interfering RNA (siRNA)
Properties of small non-coding RNA:
Involved in silencing mRNA transcripts.
Called “small” because they are usually only about 21-24 nucleotides long.
Synthesized by first cutting up longer precursor sequences (like the 61nt one that Lee discovered).
Silence an mRNA by base pairing with some sequence on the mRNA.
Discovery of siRNA?
The first small RNA:
In 1993 Rosalind Lee (Victor Ambros lab) was studying a non- coding gene in C. elegans, lin-4, that was involved in silencing of another gene, lin-14, at the appropriate time in the
development of the worm C. elegans.
Two small transcripts of lin-4 (22nt and 61nt) were found to be complementary to a sequence in the 3' UTR of lin-14.
Because lin-4 encoded no protein, she deduced that it must be these transcripts that are causing the silencing by RNA-RNA interactions.
Types of RNAi ( non coding RNA)
MiRNA
Length (23-25 nt)
Trans acting
Binds with target MRNA in mismatch
Translation inhibition
Si RNA
Length 21 nt.
Cis acting
Bind with target Mrna in perfect complementary sequence
Piwi-RNA
Length ; 25 to 36 nt.
Expressed in Germ Cells
Regulates trnasposomes activity
MECHANISM OF RNAI:
First the double-stranded RNA teams up with a protein complex named Dicer, which cuts the long RNA into short pieces.
Then another protein complex called RISC (RNA-induced silencing complex) discards one of the two RNA strands.
The RISC-docked, single-stranded RNA then pairs with the homologous mRNA and destroys it.
THE RISC COMPLEX:
RISC is large(>500kD) RNA multi- protein Binding complex which triggers MRNA degradation in response to MRNA
Unwinding of double stranded Si RNA by ATP independent Helicase
Active component of RISC is Ago proteins( ENDONUCLEASE) which cleave target MRNA.
DICER: endonuclease (RNase Family III)
Argonaute: Central Component of the RNA-Induced Silencing Complex (RISC)
One strand of the dsRNA produced by Dicer is retained in the RISC complex in association with Argonaute
ARGONAUTE PROTEIN :
1.PAZ(PIWI/Argonaute/ Zwille)- Recognition of target MRNA
2.PIWI (p-element induced wimpy Testis)- breaks Phosphodiester bond of mRNA.)RNAse H activity.
MiRNA:
The Double-stranded RNAs are naturally produced in eukaryotic cells during development, and they have a key role in regulating gene expression .
THE IMPORTANCE OF MARTIAN ATMOSPHERE SAMPLE RETURN.Sérgio Sacani
The return of a sample of near-surface atmosphere from Mars would facilitate answers to several first-order science questions surrounding the formation and evolution of the planet. One of the important aspects of terrestrial planet formation in general is the role that primary atmospheres played in influencing the chemistry and structure of the planets and their antecedents. Studies of the martian atmosphere can be used to investigate the role of a primary atmosphere in its history. Atmosphere samples would also inform our understanding of the near-surface chemistry of the planet, and ultimately the prospects for life. High-precision isotopic analyses of constituent gases are needed to address these questions, requiring that the analyses are made on returned samples rather than in situ.
Nutraceutical market, scope and growth: Herbal drug technologyLokesh Patil
As consumer awareness of health and wellness rises, the nutraceutical market—which includes goods like functional meals, drinks, and dietary supplements that provide health advantages beyond basic nutrition—is growing significantly. As healthcare expenses rise, the population ages, and people want natural and preventative health solutions more and more, this industry is increasing quickly. Further driving market expansion are product formulation innovations and the use of cutting-edge technology for customized nutrition. With its worldwide reach, the nutraceutical industry is expected to keep growing and provide significant chances for research and investment in a number of categories, including vitamins, minerals, probiotics, and herbal supplements.
Multi-source connectivity as the driver of solar wind variability in the heli...Sérgio Sacani
The ambient solar wind that flls the heliosphere originates from multiple
sources in the solar corona and is highly structured. It is often described
as high-speed, relatively homogeneous, plasma streams from coronal
holes and slow-speed, highly variable, streams whose source regions are
under debate. A key goal of ESA/NASA’s Solar Orbiter mission is to identify
solar wind sources and understand what drives the complexity seen in the
heliosphere. By combining magnetic feld modelling and spectroscopic
techniques with high-resolution observations and measurements, we show
that the solar wind variability detected in situ by Solar Orbiter in March
2022 is driven by spatio-temporal changes in the magnetic connectivity to
multiple sources in the solar atmosphere. The magnetic feld footpoints
connected to the spacecraft moved from the boundaries of a coronal hole
to one active region (12961) and then across to another region (12957). This
is refected in the in situ measurements, which show the transition from fast
to highly Alfvénic then to slow solar wind that is disrupted by the arrival of
a coronal mass ejection. Our results describe solar wind variability at 0.5 au
but are applicable to near-Earth observatories.
This presentation explores a brief idea about the structural and functional attributes of nucleotides, the structure and function of genetic materials along with the impact of UV rays and pH upon them.
2. Sound
Longitudinal Waves
Pressure Graphs
Speed of Sound
Wavefronts
Frequency & Pitch
(human range)
The Human Ear
Sonar & Echolocation
Doppler Effect
(and sonic booms)
Interference
Standing Waves in a String:
Two fixed ends
Standing Waves in a Tube:
One open end
Two open ends
Musical Instruments
(and other complex sounds)
Beats
Intensity
Sound Level (decibels)
3. Longitudinal Waves
As you learned in the unit on waves, in a longitudinal wave the
particles in a medium travel back & forth parallel to the wave itself.
Sound waves are longitudinal and they can travel through most any
medium, so molecules of air (or water, etc.) move back & forth in the
direction of the wave creating high pressure zones (compressions) and
low pressure zones (rarefactions). The molecules act just like the
individual coils in the spring. The faster the molecules move back &
forth, the greater the frequency of the wave, and the greater distance
they move, the greater the wave’s amplitude.
wavelength,
Animation
rarefaction compression
molecule
4. Sound Waves: Molecular View
When sound travels through a medium, there are alternating regions of
high and low pressure. Compressions are high pressure regions where
the molecules are crowded together. Rarefactions are low pressure
regions where the molecules are more spread out. An individual
molecule moves side to side with each compression. The speed at
which a compression propagates through the medium is the wave
speed, but this is different than the speed of the molecules themselves.
wavelength,
5. Pressure vs. Position
The pressure at a given point in a medium fluctuates slightly as sound
waves pass by. The wavelength is determined by the distance between
consecutive compressions or consecutive rarefactions. At each com-
pression the pressure is a tad bit higher than its normal pressure. At
each rarefaction the pressure is a tad bit lower than normal. Let’s call
the equilibrium (normal) pressure P0 and the difference in pressure from
equilibrium P. P varies and is at a max at a compression or
rarefaction. In a fluid like air or water, Pmax is typically very small
compared to P0 but our ears are very sensitive to slight deviations in
pressure. The bigger P is, the greater the amplitude of the sound
wave, and the louder the sound. wavelength,
7. Pressure vs. Time
The pressure at a given point does not stay constant. If we only
observed one position we would find the pressure there varies
sinusoidally with time, ranging from:
P0 to P0 + Pmax back to P0 then to P0 - Pmax and back to P0
The time it takes to go through this cycle is the period of the wave.
The number of times this cycle happens per second is the frequency
of the wave in Hertz.
Therefore, the pressure in the medium is a function of both position
and time!
The cycle can also be described as:
equilibrium compression equilibrium rarefaction equilibrium
8. Pressure vs. Time GraphP T
t
Rather than looking at a region of space at an instant in time, here we’re
looking at just one point in space over an interval of time. At time zero,
when the pressure readings began, the molecules were at their normal
pressure. The pressure at this point in space fluctuates sinusoidally as
the waves pass by: normal high normal low normal. The
time needed for one cycle is the period. The higher the frequency, the
shorter the period. The amplitude of the graph represents the maximum
deviation from normal pressure (as it did on the pressure vs. position
graph), and this corresponds to loudness.
9. Comparison of Pressure GraphsPressure vs. Position: The graph is for a snapshot in time and
displays pressure variation for over an interval of space. The distance
between peaks on the graph is the wavelength of the wave.
Pressure vs. Time: The graph displays pressure variation over an
interval of time for only one point in space. The distance between
peaks on the graph is the period of the wave. The reciprocal of the
period is the frequency.
Both Graphs: Sound waves are longitudinal even though these graphs
look like transverse waves. Nothing in a sound wave is actually
waving in the shape of these graphs! The amplitude of either graph
corresponds to the loudness of the sound. The absolute pressure
matters not. For loudness, all that matters is how much the pressure
deviates from its norm, which doesn’t have to be much. In real life
the amplitude would diminish as the sound waves spread out.
10. Speed of SoundAs with all waves, the speed of sound depends on the medium
through which it is traveling. In the wave unit we learned that the
speed of a wave traveling on a rope is given by:
F
µ
v =
F = tension in rope
µ = mass per unit length of rope
In a rope, waves travel faster when the rope is under more tension and
slower if the rope is denser. The speed of a sound wave is given by:
Rope:
B
v =Sound:
B = bulk modulus of medium
= mass per unit volume (density)
The bulk modulus, B, of a medium basically tells you how hard it is
to compress it, just as the tension in a rope tells you how hard it is
stretch it or displace a piece of it. (continued)
11. Speed of Sound (cont.)F
µ
v =
B
v =
Rope:
Sound:
Notice that each equation is in the form
The bulk modulus for air is tiny compared to that of water, since air
is easily compressed and water nearly incompressible. So, even
though water is much denser than air, water is so much harder to
compress that sound travels over 4 times faster in water.
Steel is almost 8 times denser than water, but it’s over 70 times
harder to compress. Consequently, sound waves propagate through
steel about 3 times faster than in water, since (70/ 8)0.5 3.
v =
elastic property
inertial property
12. Temperature & the Speed of Sound
The speed of sound in dry air is given by:
v 331.4 + 0.60 T, where T is air temp in°C.
Because the speed of sound is inversely proportional
to the medium’s density, the less dense the medium,
the faster sound travels. The hotter a substance is,
B
v =
the faster its molecules/atoms vibrate and the more room they take up.
This lowers the substance’s density, which is significant in a gas. So,
in the summer, sound travels slightly faster outside than it does in the
winter. To visualize this keep in mind that molecules must bump into
each other in order to transmit a longitudinal wave. When molecules
move quickly, they need less time to bump into their neighbors.
Here are speeds for sound:
Air, 0 °C: 331 m/s Air, 20 °C: 343 m/s Water, 25 °C: 1493
m/s Iron: 5130 m/s Glass (Pyrex): 5640 m/s Diamond: 12
000 m/s
13. Wavefronts
Some waves are one dimensional, like vibrations in a guitar string or
sound waves traveling along a metal rod. Some waves are two
dimensional, such as surface water waves or seismic waves traveling
along the surface of the Earth. Some waves are 3-D, such as sound
traveling in all directions from a bell, or light doing the same from a
flashlight. To visualize 2-D and 3-D waves, we often draw
wavefronts. The red wavefronts below could represent the crest of
water waves on a pond moving outward after a rock was dropped in
the middle. They could also be used to represent high pressure
zonesin sound waves. The wavefronts for 3-D sound waves would be
spherical, but concentric circles are often used to simplify the picture.
If the wavefronts are evenly spaced, then is a constant.
crest
trough
Animation
14. Frequency & Pitch
Just as the amplitude of a sound wave relates to its loudness, the
frequency of the wave relates to its pitch. The higher the pitch, the
higher the frequency. The frequency you hear is just the number of
wavefronts that hit your eardrums in a unit of time. Wavelength
doesn’t necessarily correspond to pitch because, even if wavefronts
are very close together, if the wave is slow moving, not many
wavefronts will hit you each second. Even in a fast moving wave
with a small wavelength, the receiver or source could be moving,
which would change the frequency, hence the pitch.
Frequency Pitch
Amplitude Loudness
Listen to a pure tone (up to 1000 Hz)
Listen to 2 simultaneous tones (scroll down)
15. The Human Ear
Animation Ear Anatomy
The exterior part of the ear (the auricle, or pinna) is made of cartilage
and helps funnel sound waves into the auditory canal, which has wax
fibers to protect the ear from dirt. At the end of the auditory canal lies
the eardrum (tympanic membrane), which vibrates with the incoming
sound waves and transmits these vibrations along three tiny bones
(ossicles) called the hammer, anvil, and stirrup (malleus, incus, and
stapes). The little stapes bone is attached to the oval window, a
membrane of the cochlea.
The cochlea is a coil that converts the vibrations it receives into
electrical impulses and sends them to the brain via the auditory nerve.
Delicate hairs (stereocilia) in the cochlea are responsible for this signal
conversion. These hairs are easily damaged by loud noises, a major
cause of hearing loss!
The semicircular canals help maintain balance, but do not aid hearing.
16. Range of Human Hearing
Hear the full range of audible frequencies
(scroll down to speaker buttons)
The maximum range of frequencies for most people is from about
20 to 20 thousand hertz. This means if the number of high pressure
fronts (wavefronts) hitting our eardrums each second is from 20 to
20 000, then the sound may be detectable. If you listen to loud
music often, you’ll probably find that your range (bandwidth) will
be diminished.
Some animals, like dogs and some fish, can hear frequencies that are
higher than what humans can hear (ultrasound). Bats and dolphins
use ultrasound to locate prey (echolocation). Doctors make use of
ultrasound for imaging fetuses and breaking up kidney stones.
Elephants and some whales can communicate over vast distances
with sound waves too low in pitch for us to hear (infrasound).
17. The Decibel Scale
Source Decibels
Anything on the verge
of being audible
0
Whisper 30
Normal Conversation 60
Busy Traffic 70
Niagara Falls 90
Train 100
Construction Noise 110
Rock Concert 120
Machine Gun 130
Jet Takeoff 150
Rocket Takeoff 180
Pain
Damage
}
Constant
exposure
leads to
permanent
hearing loss.
The chart below lists the approximate sound levels of various sounds.
The loudness of a given sound depends, of course, on the power of
the source of the sound as well as the distance from the source. Note:
Listening to loud music will gradually damage your hearing!