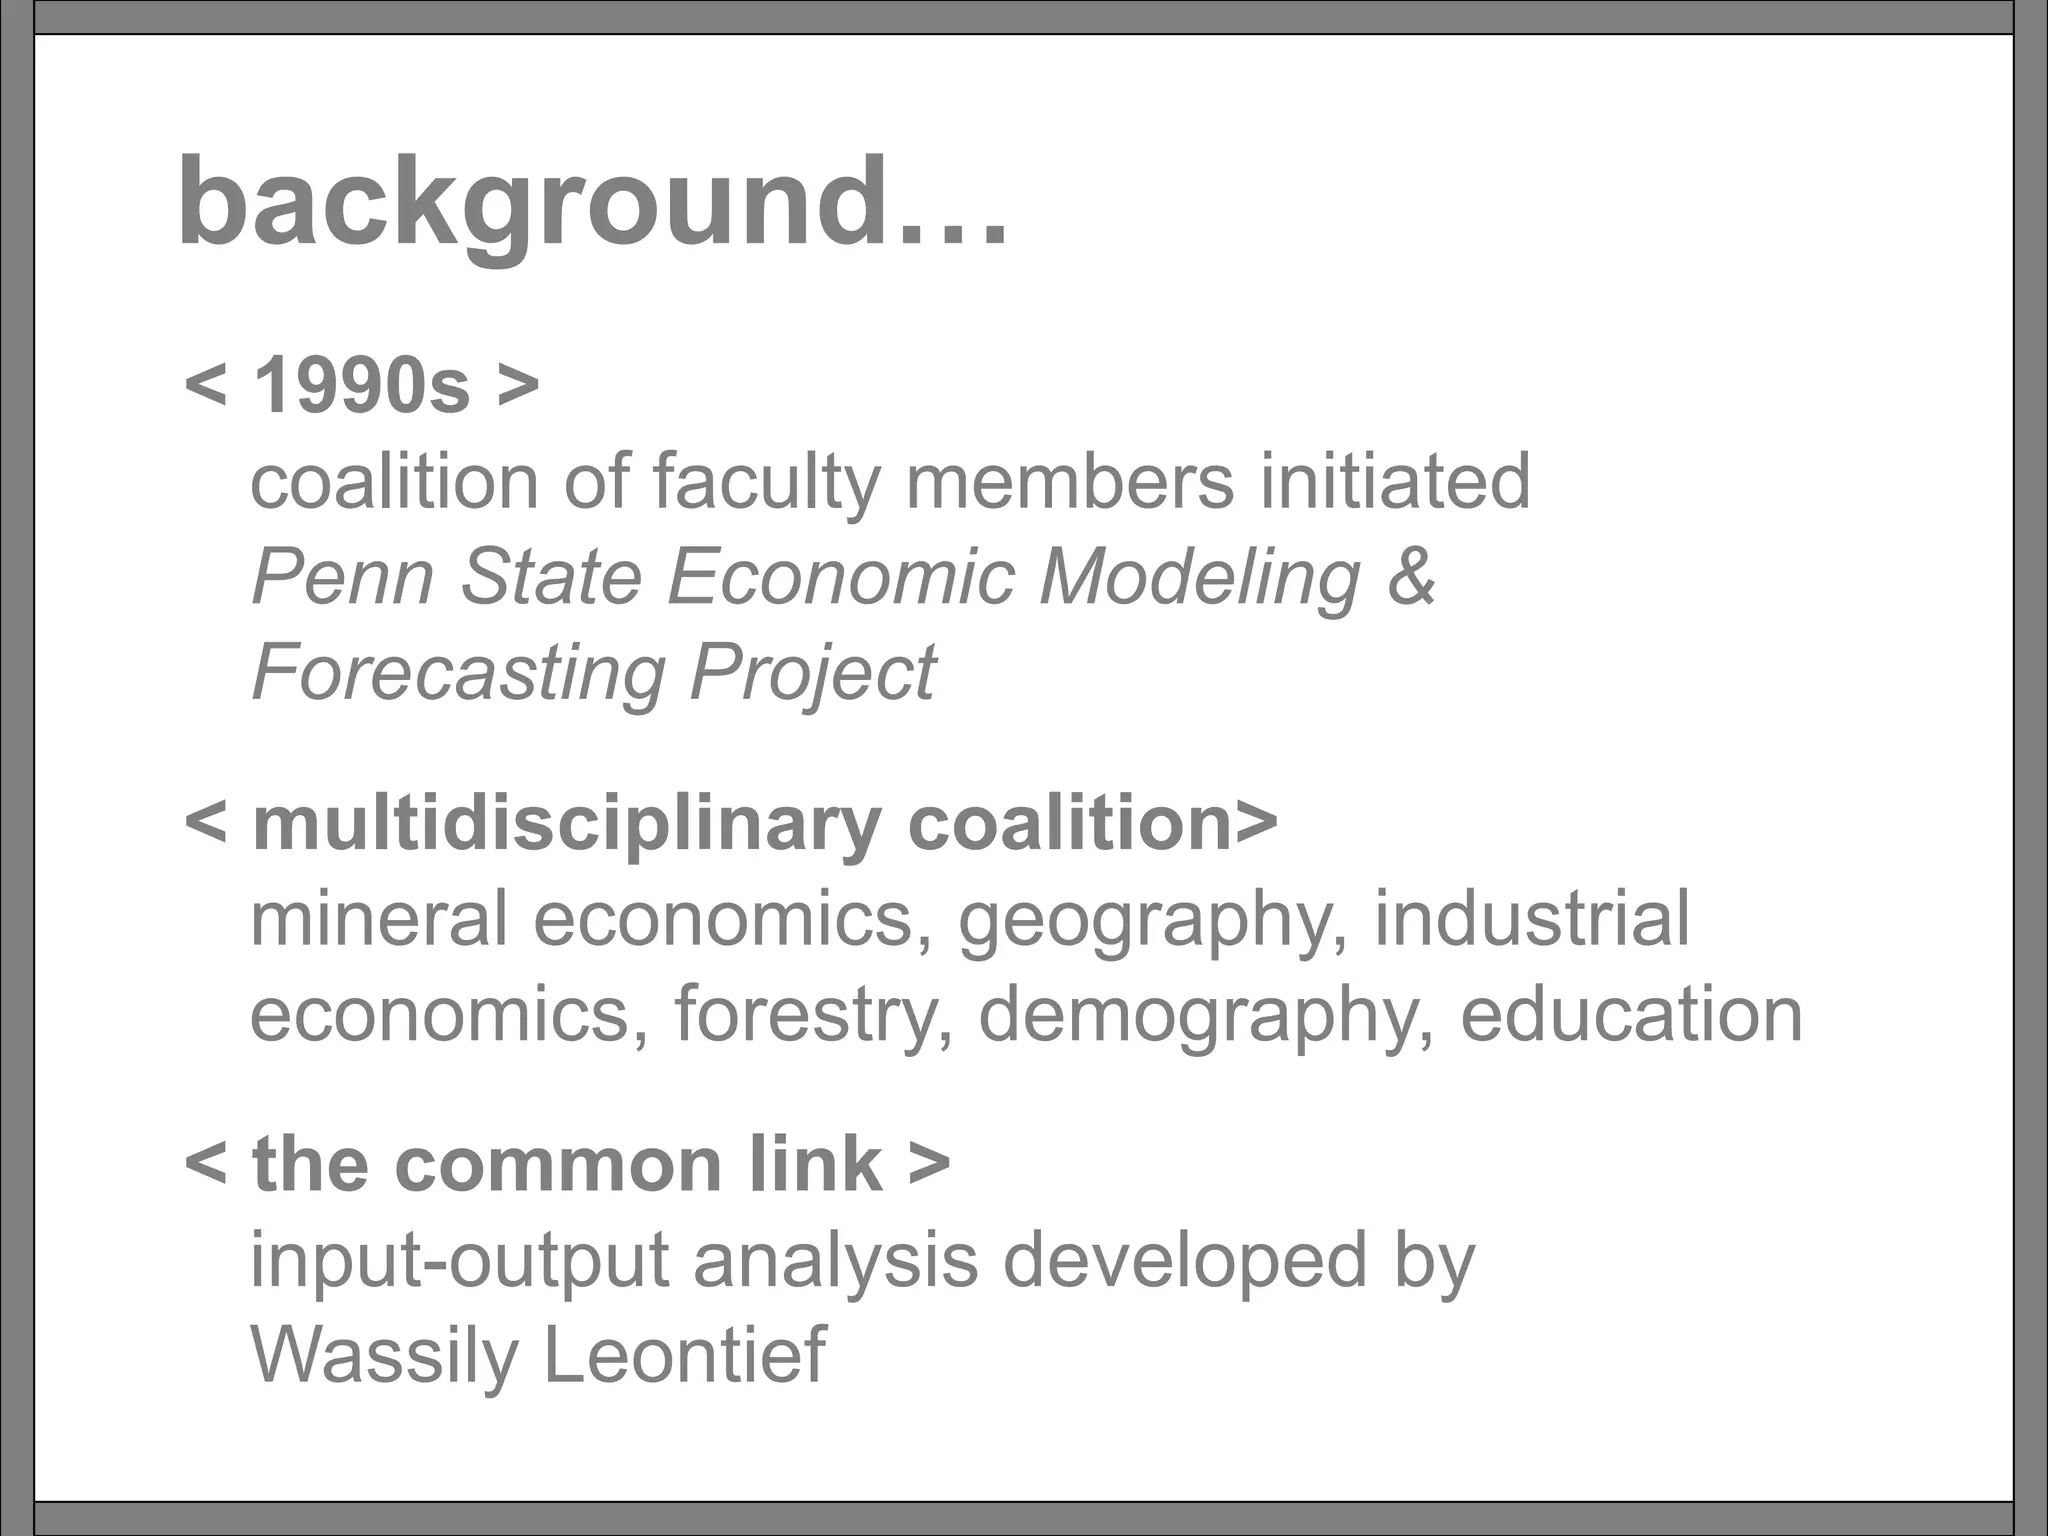
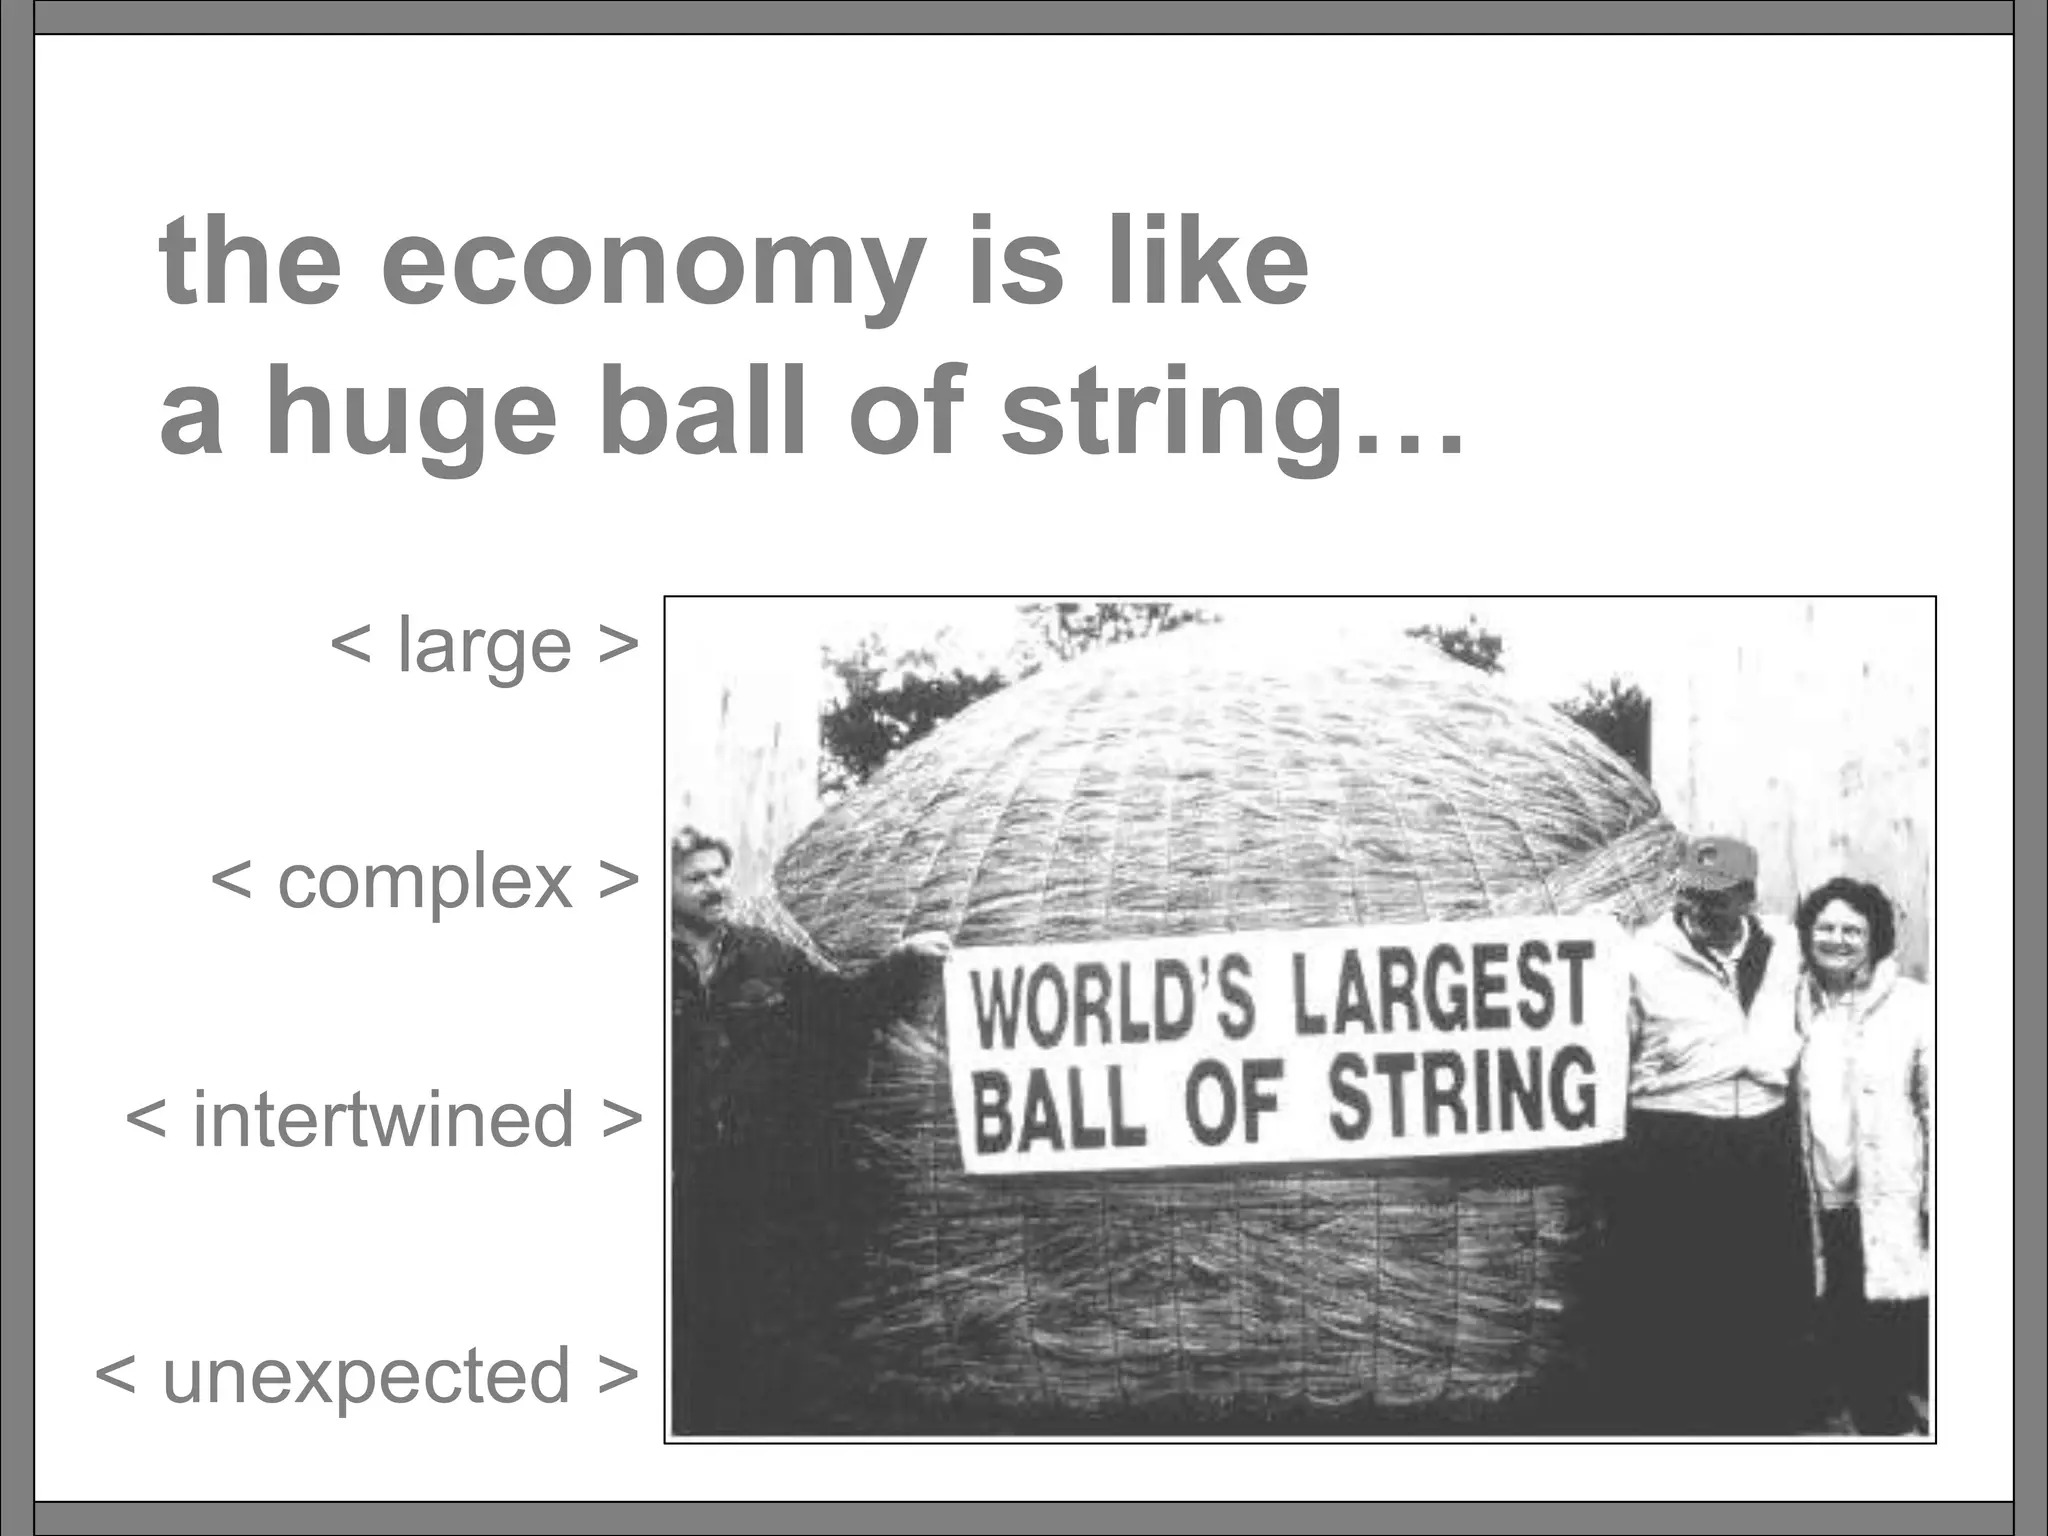
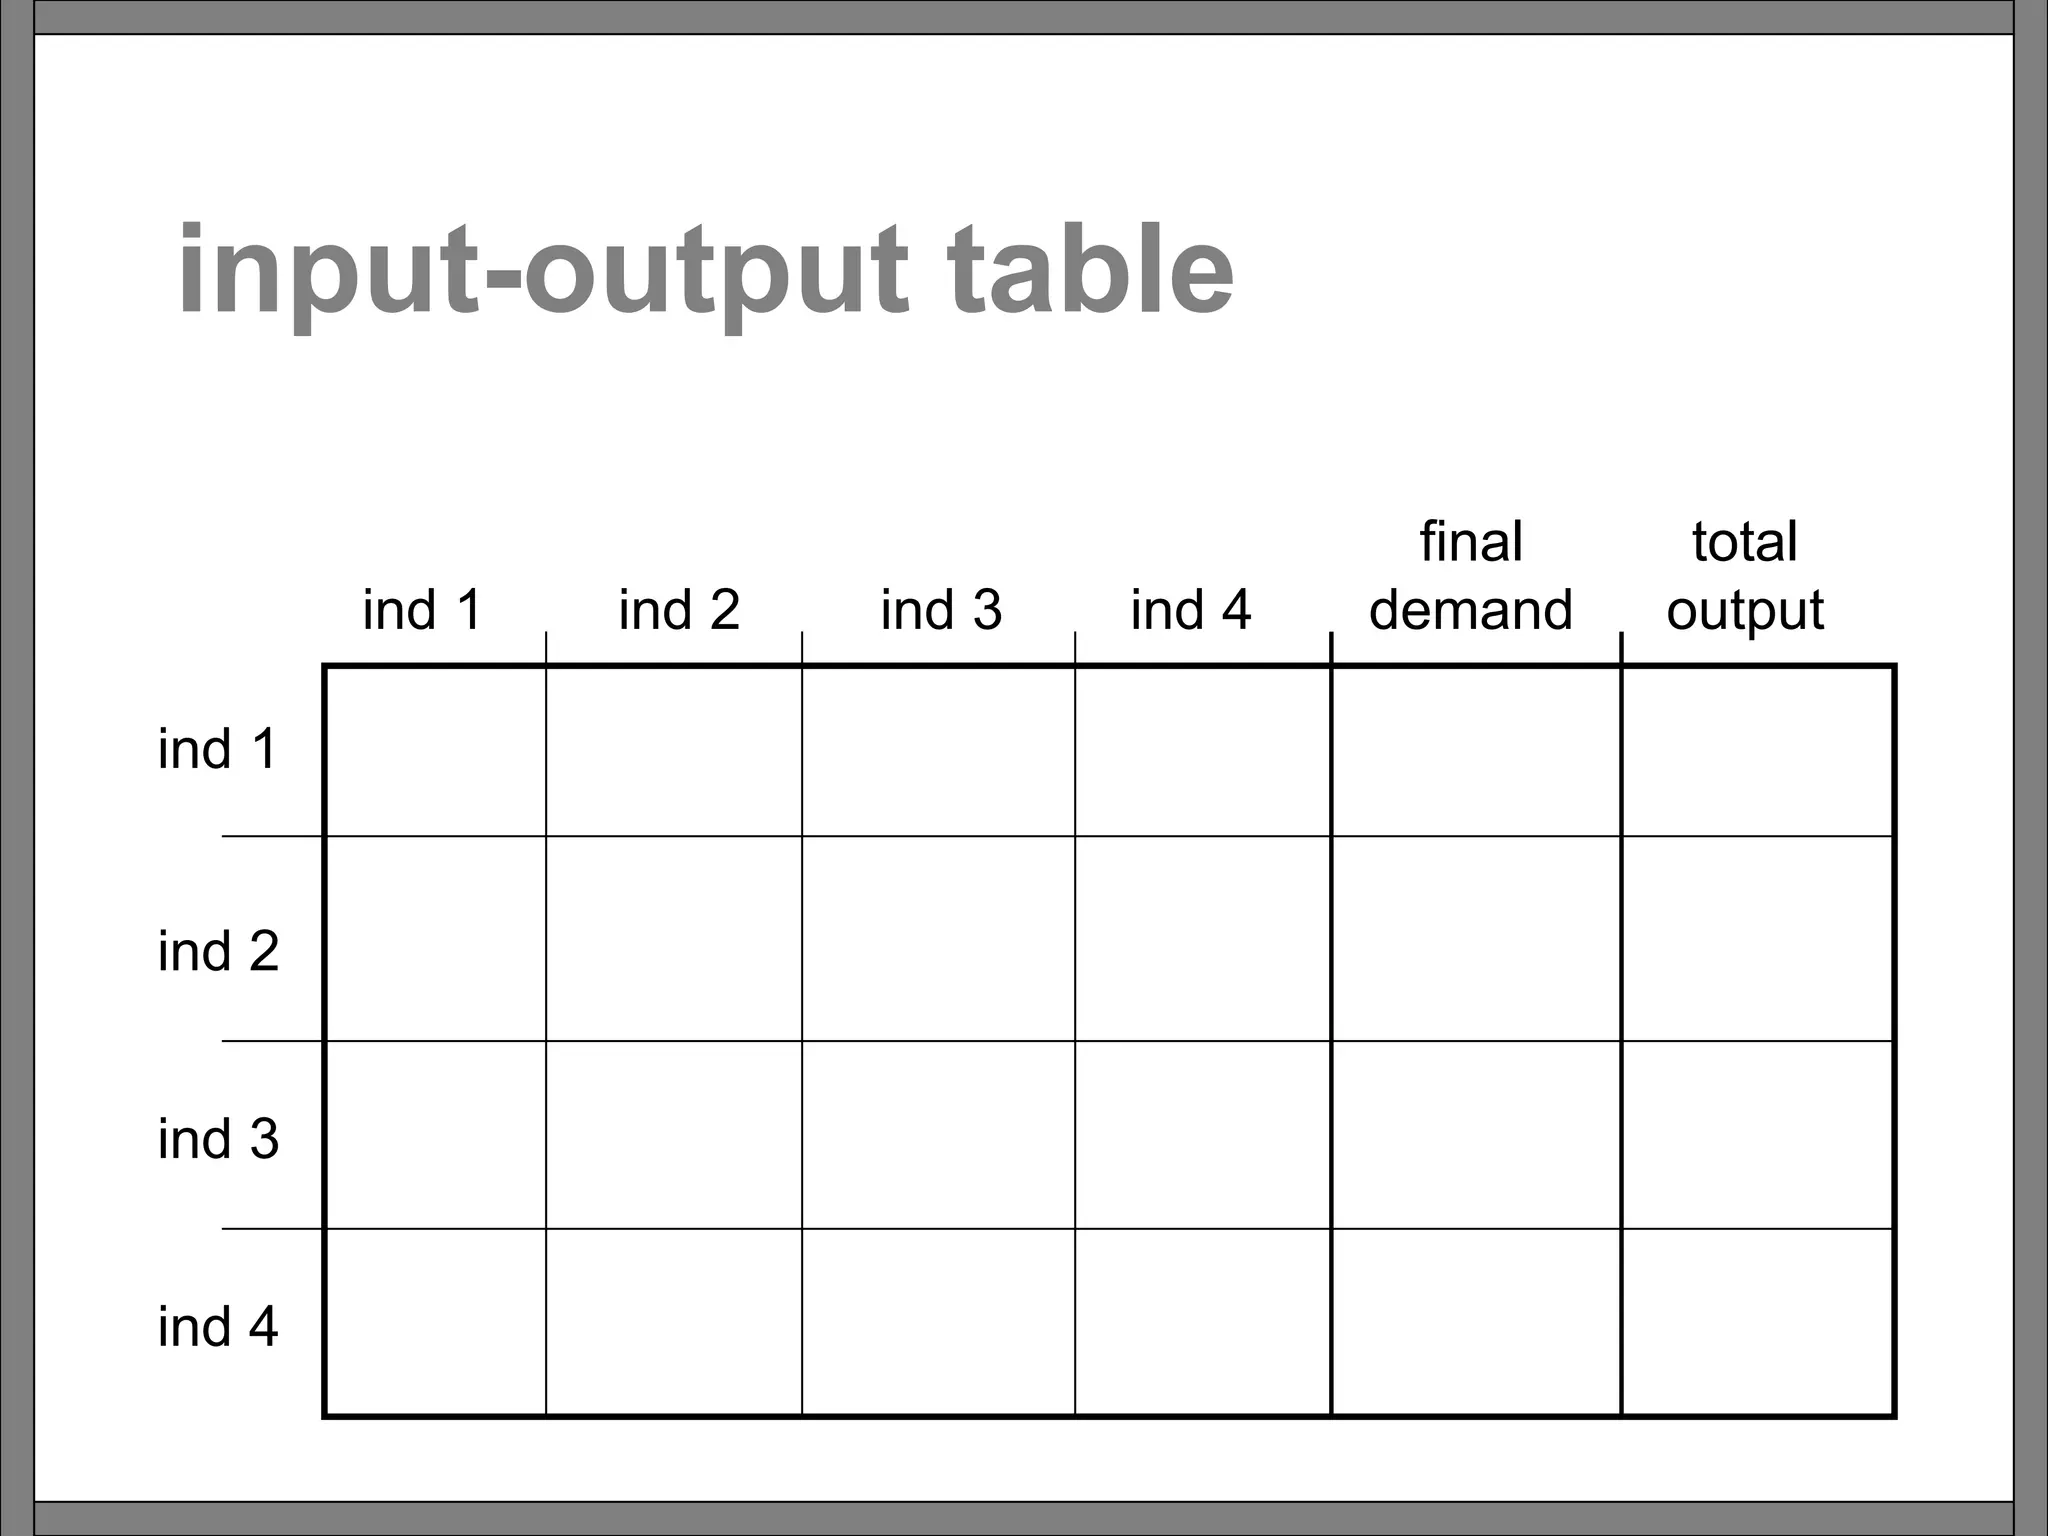
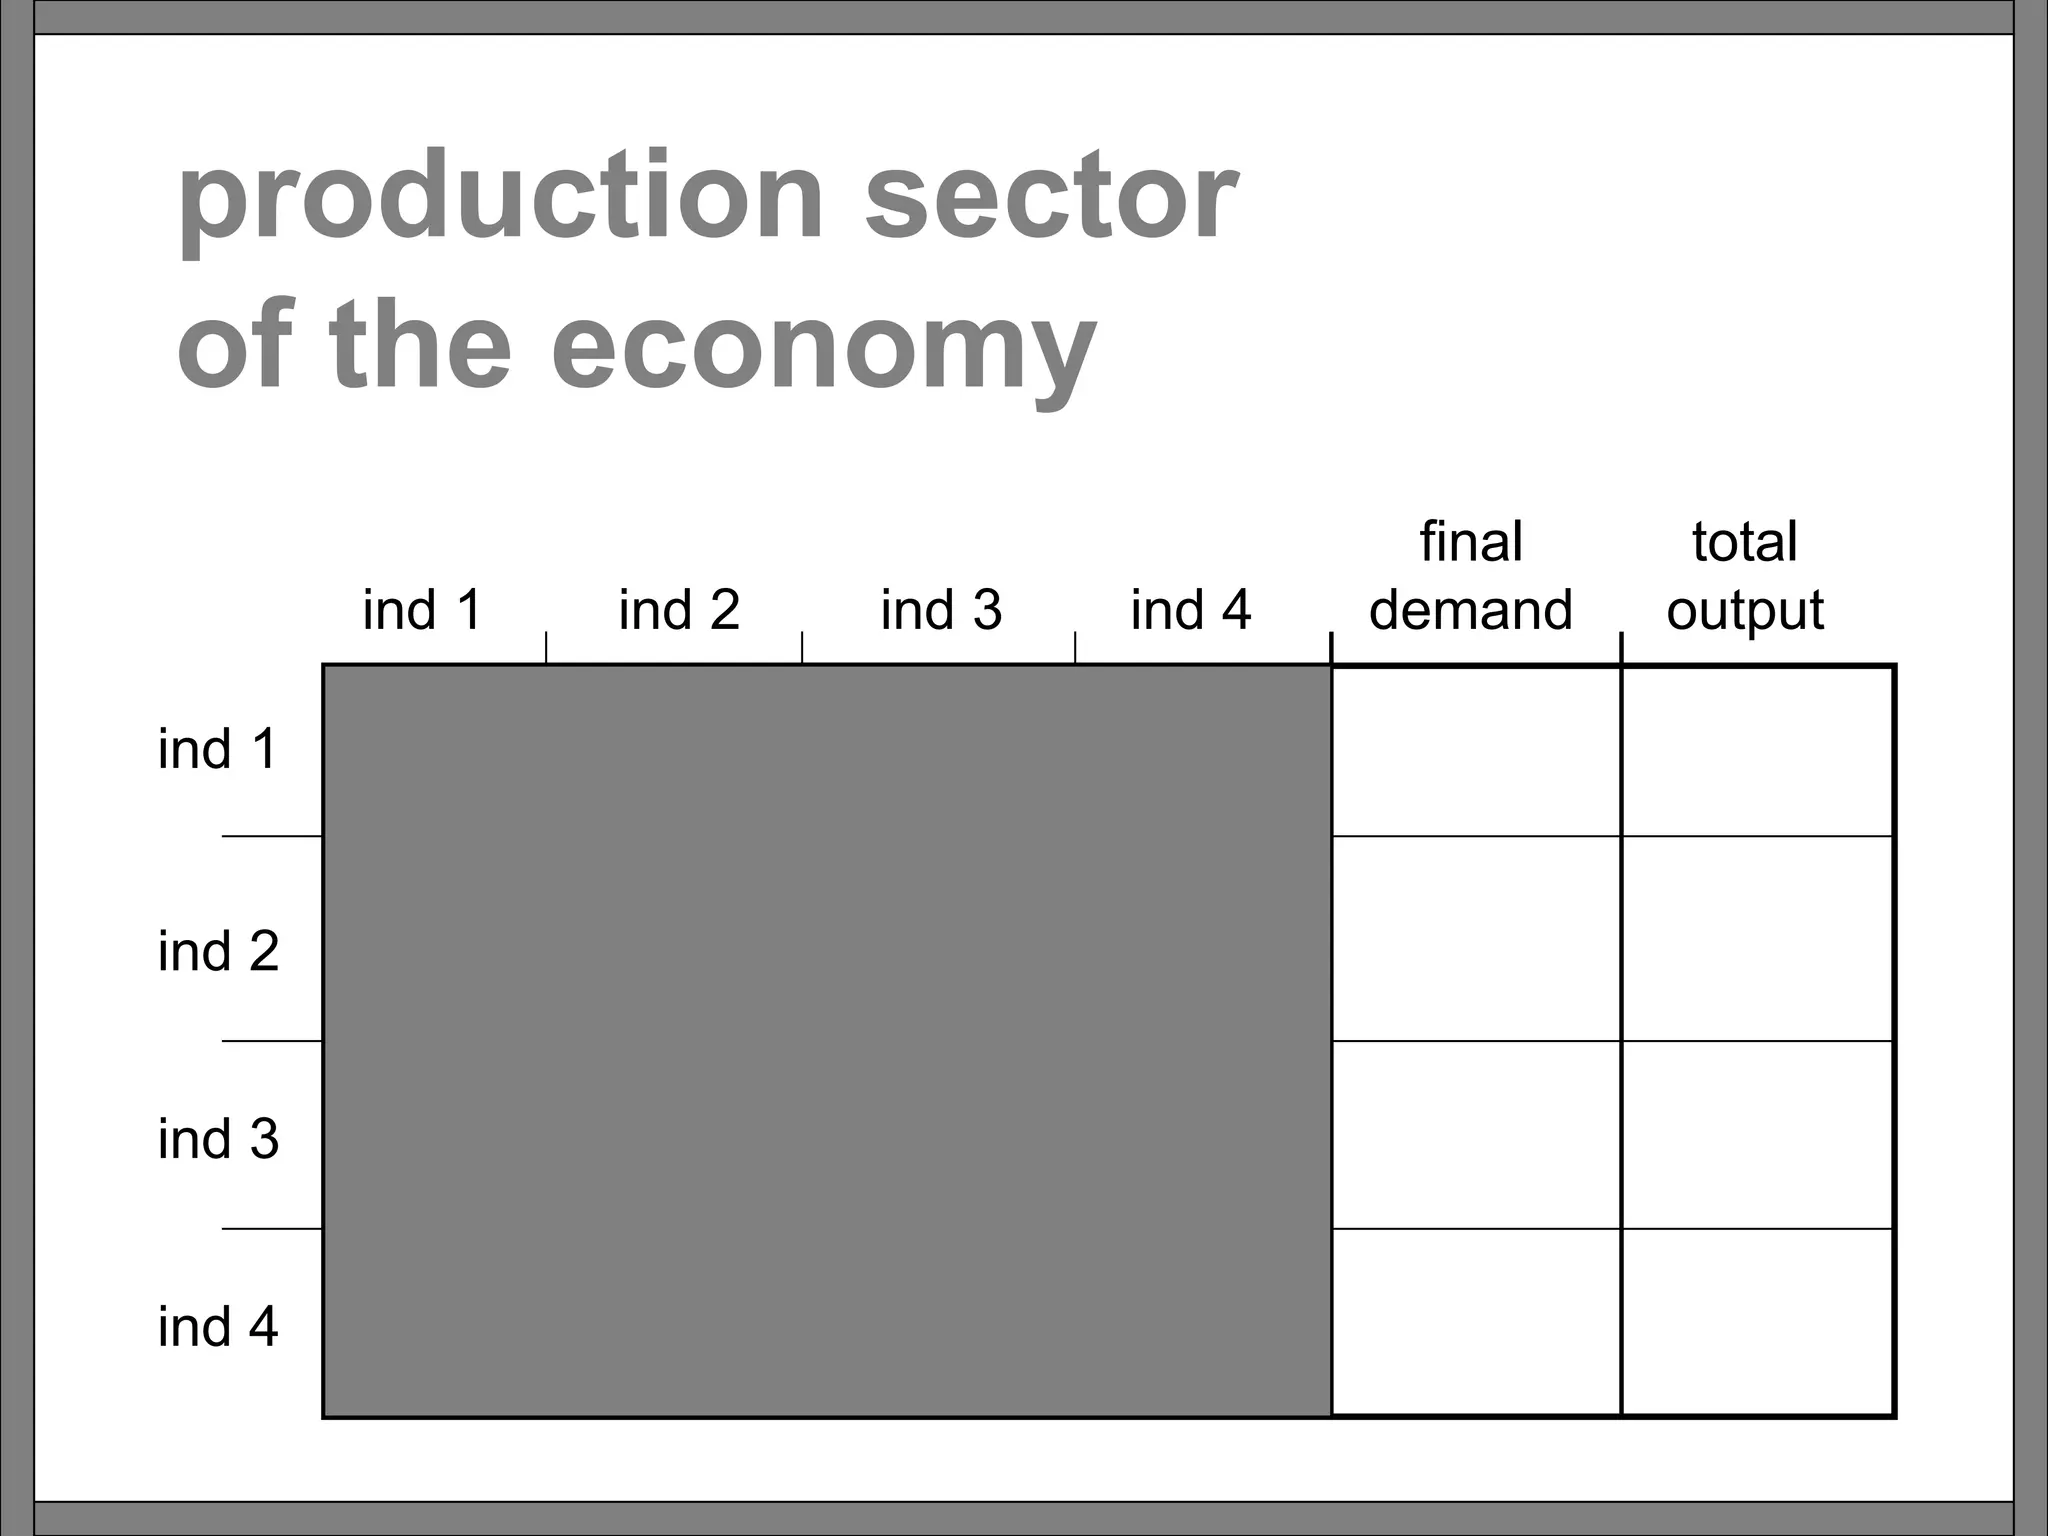
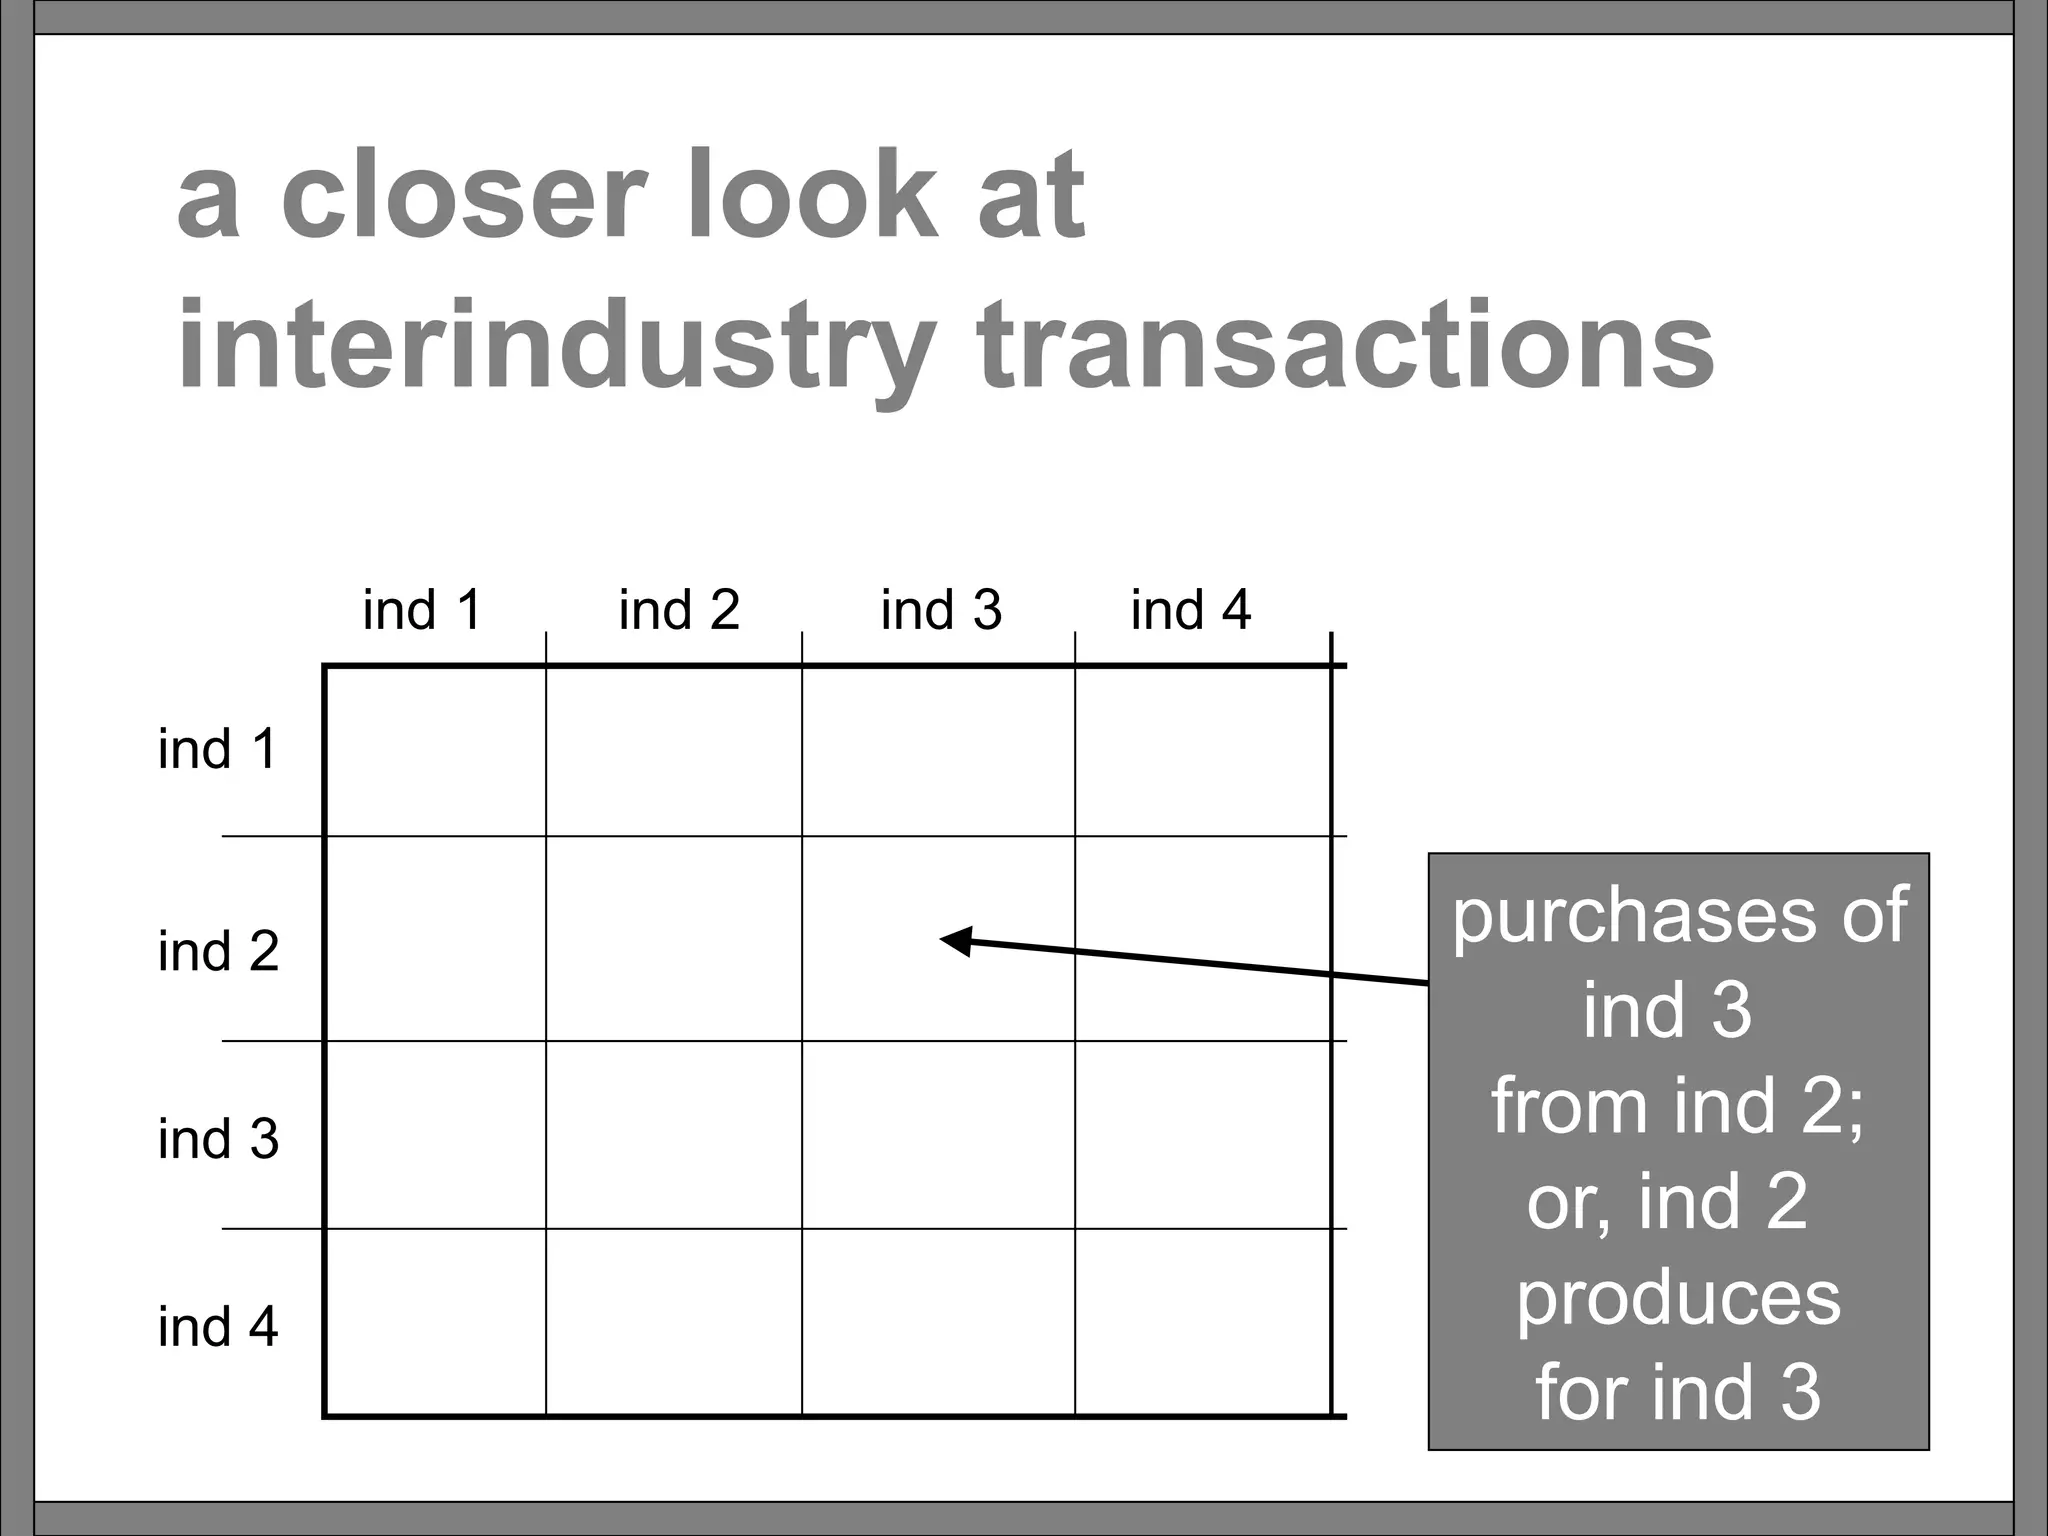
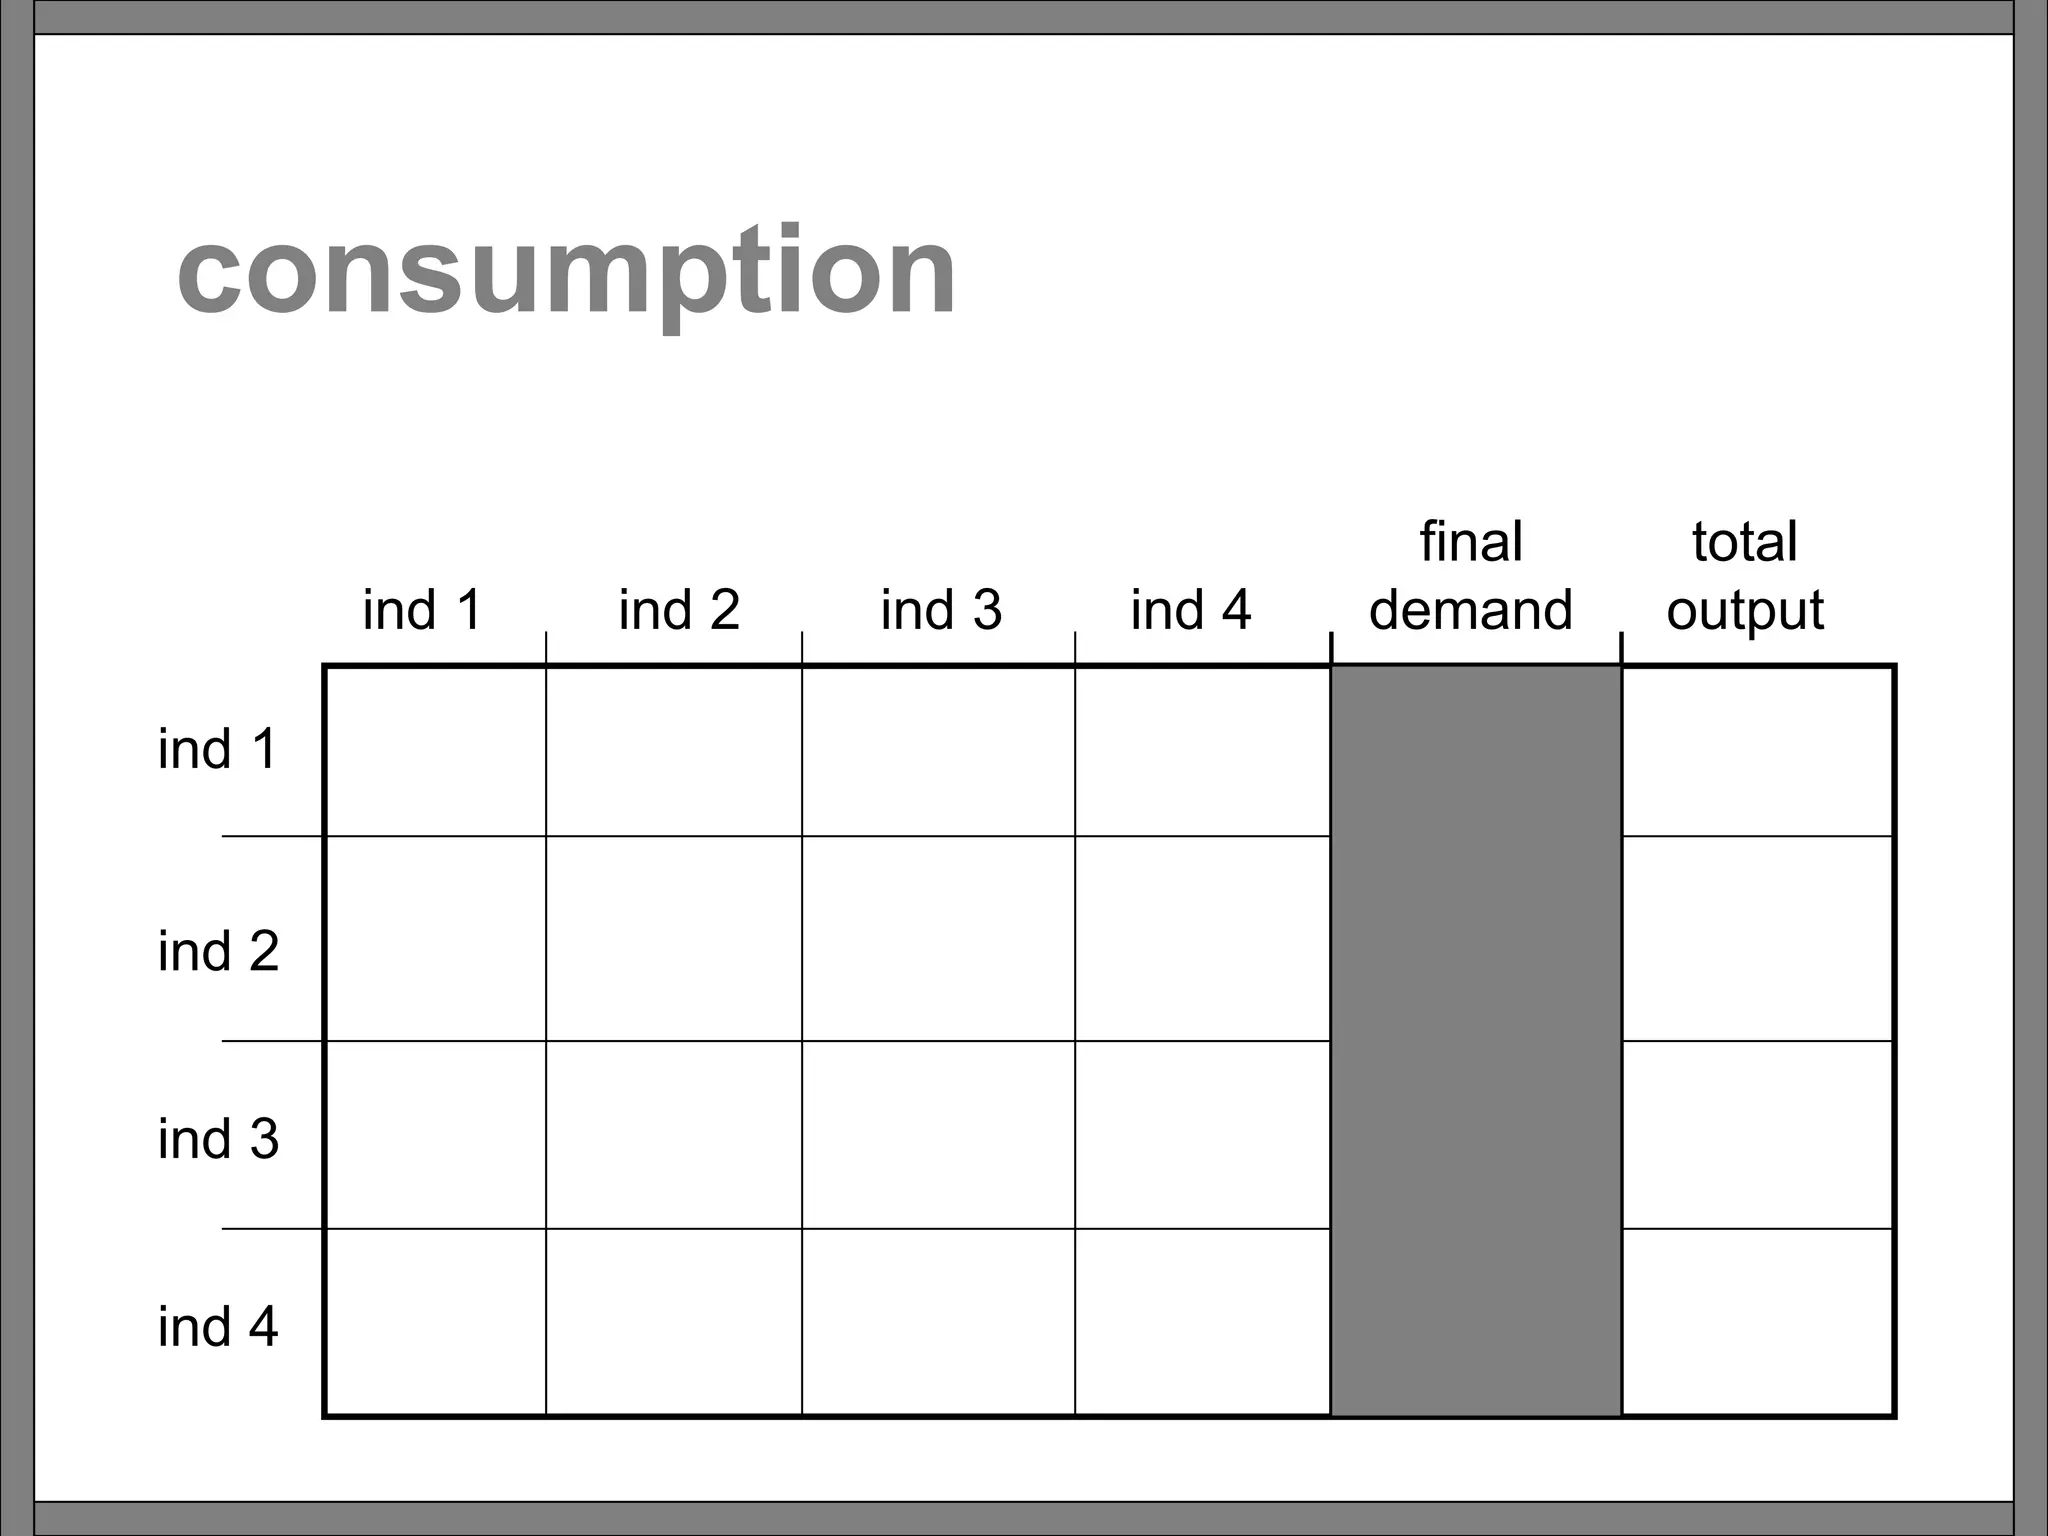
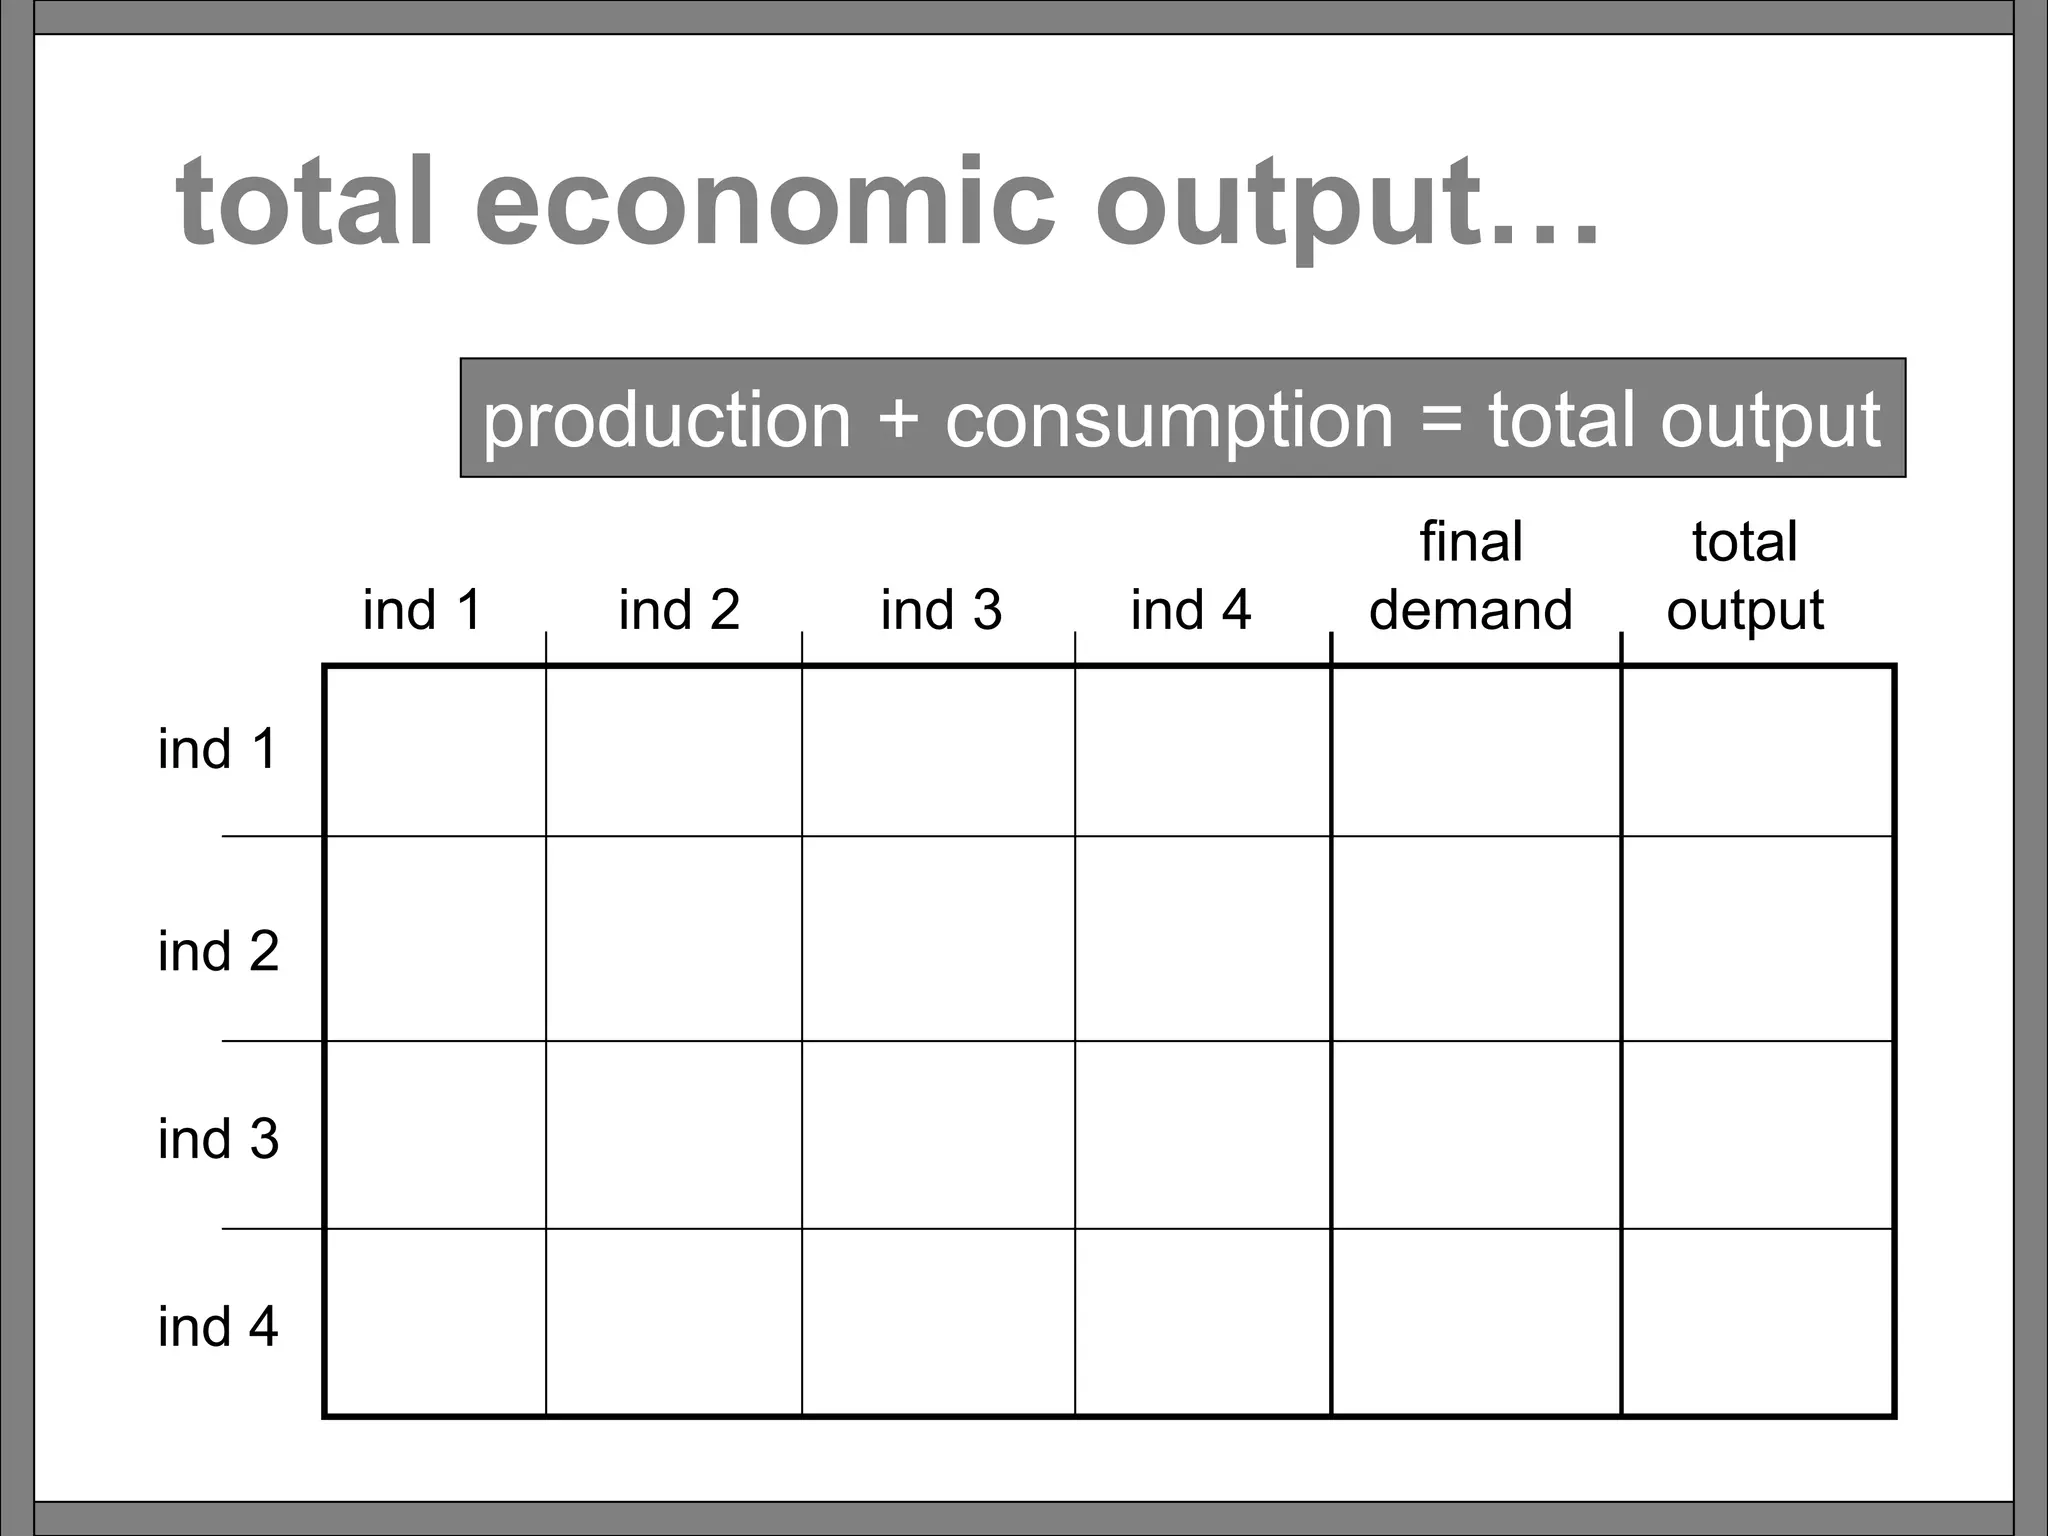
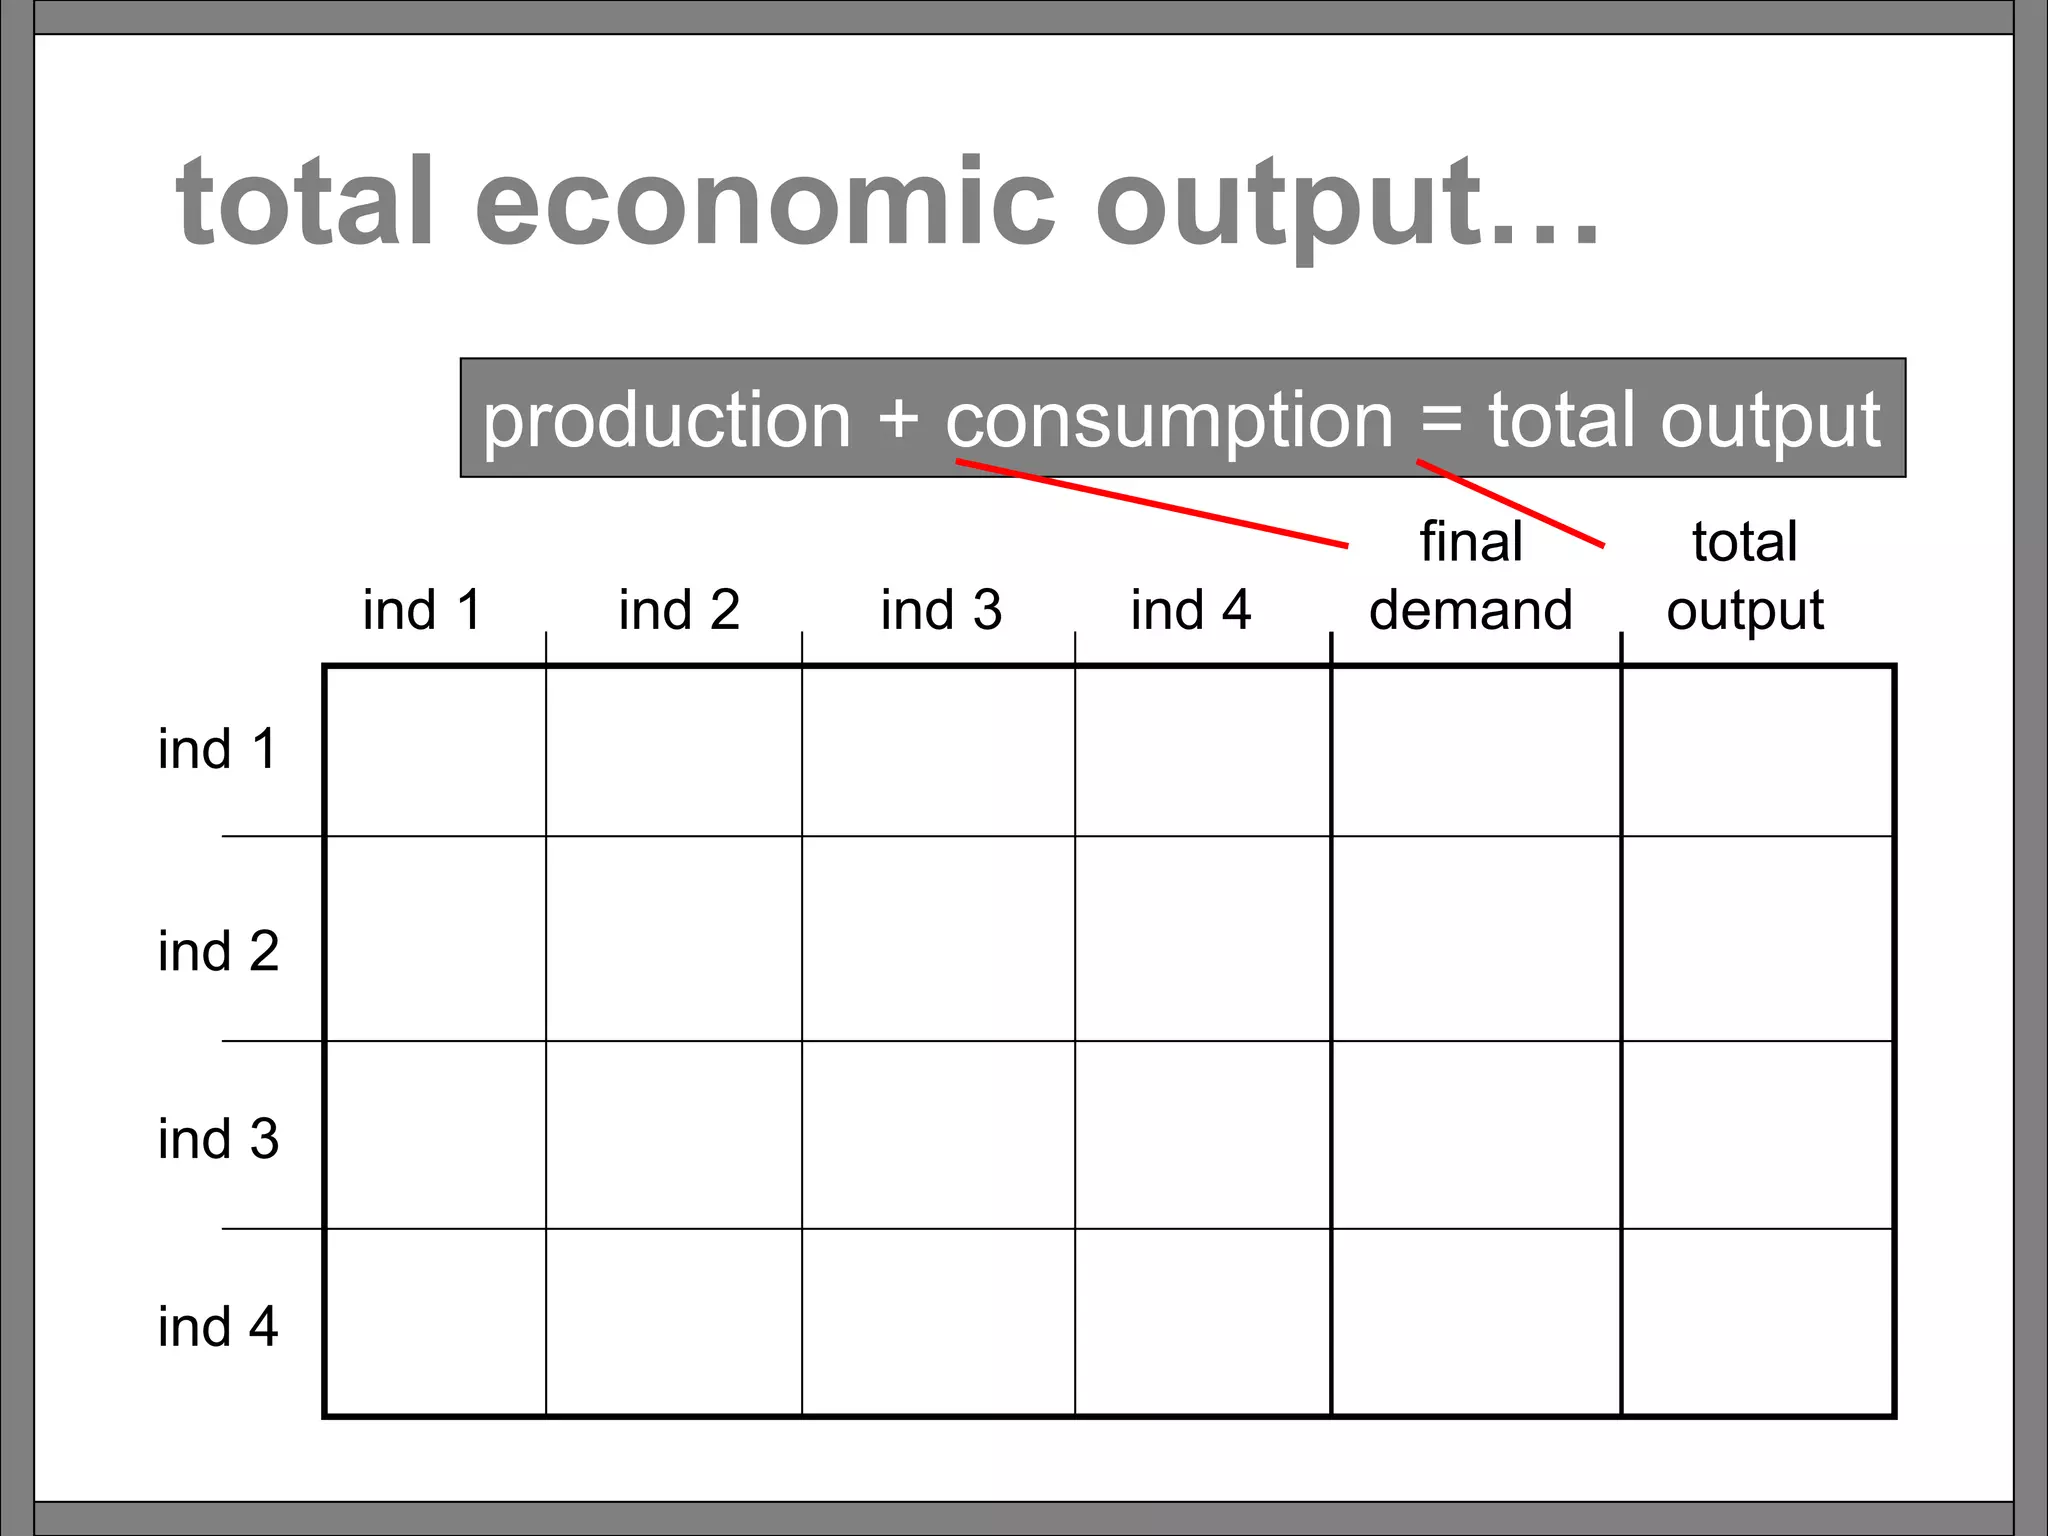
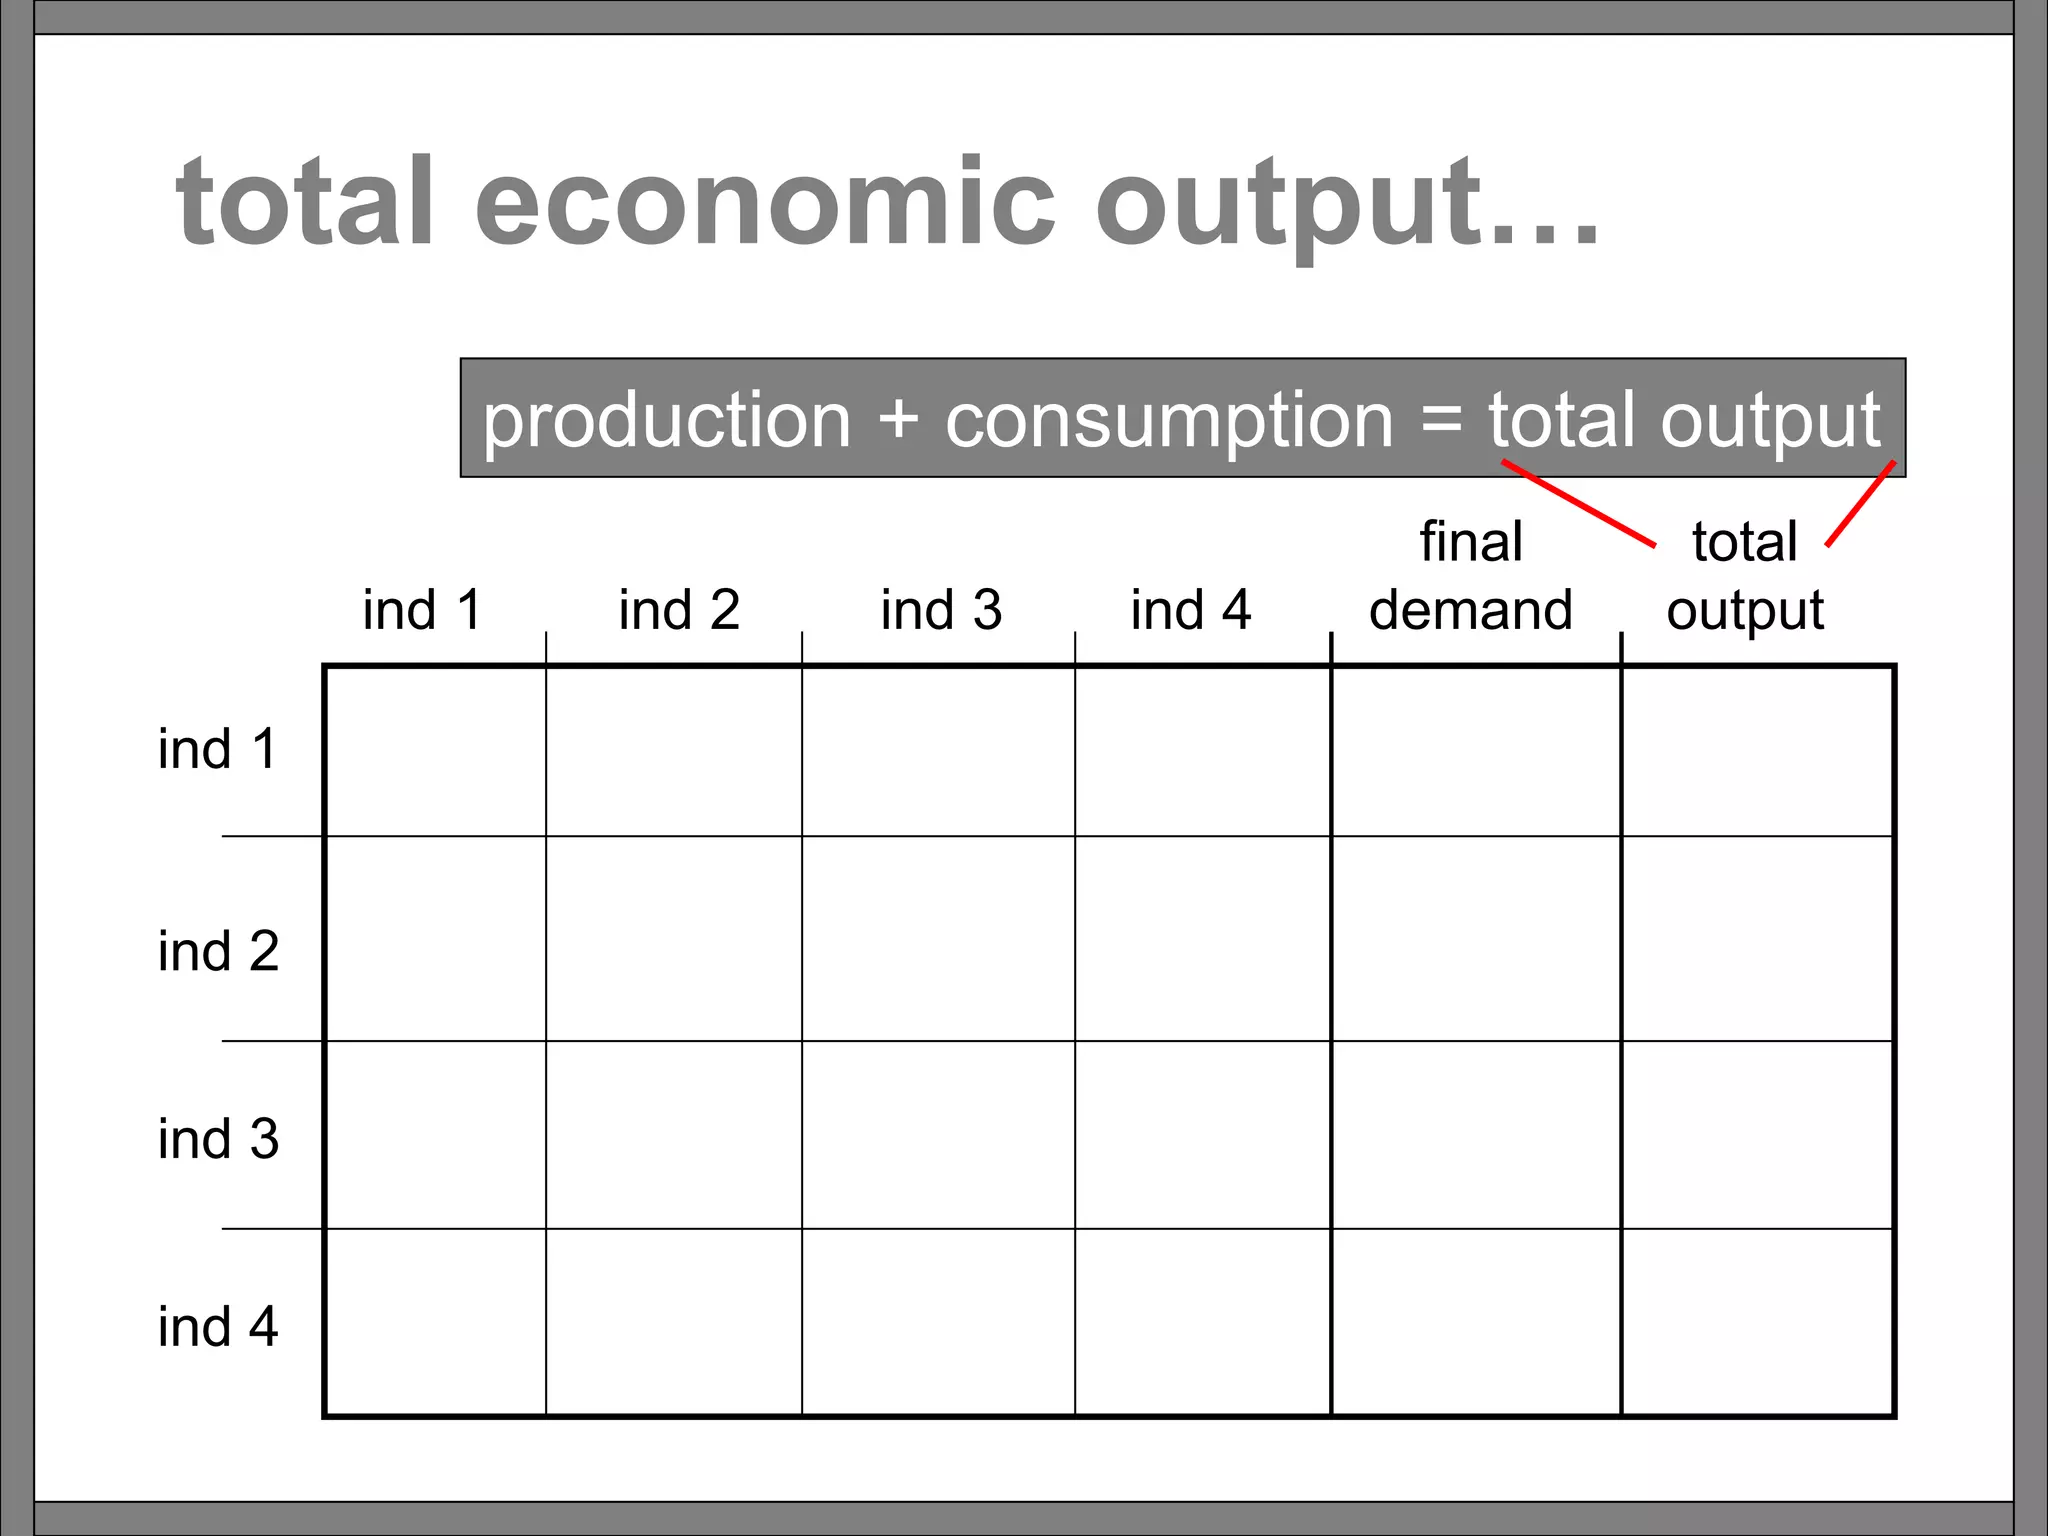
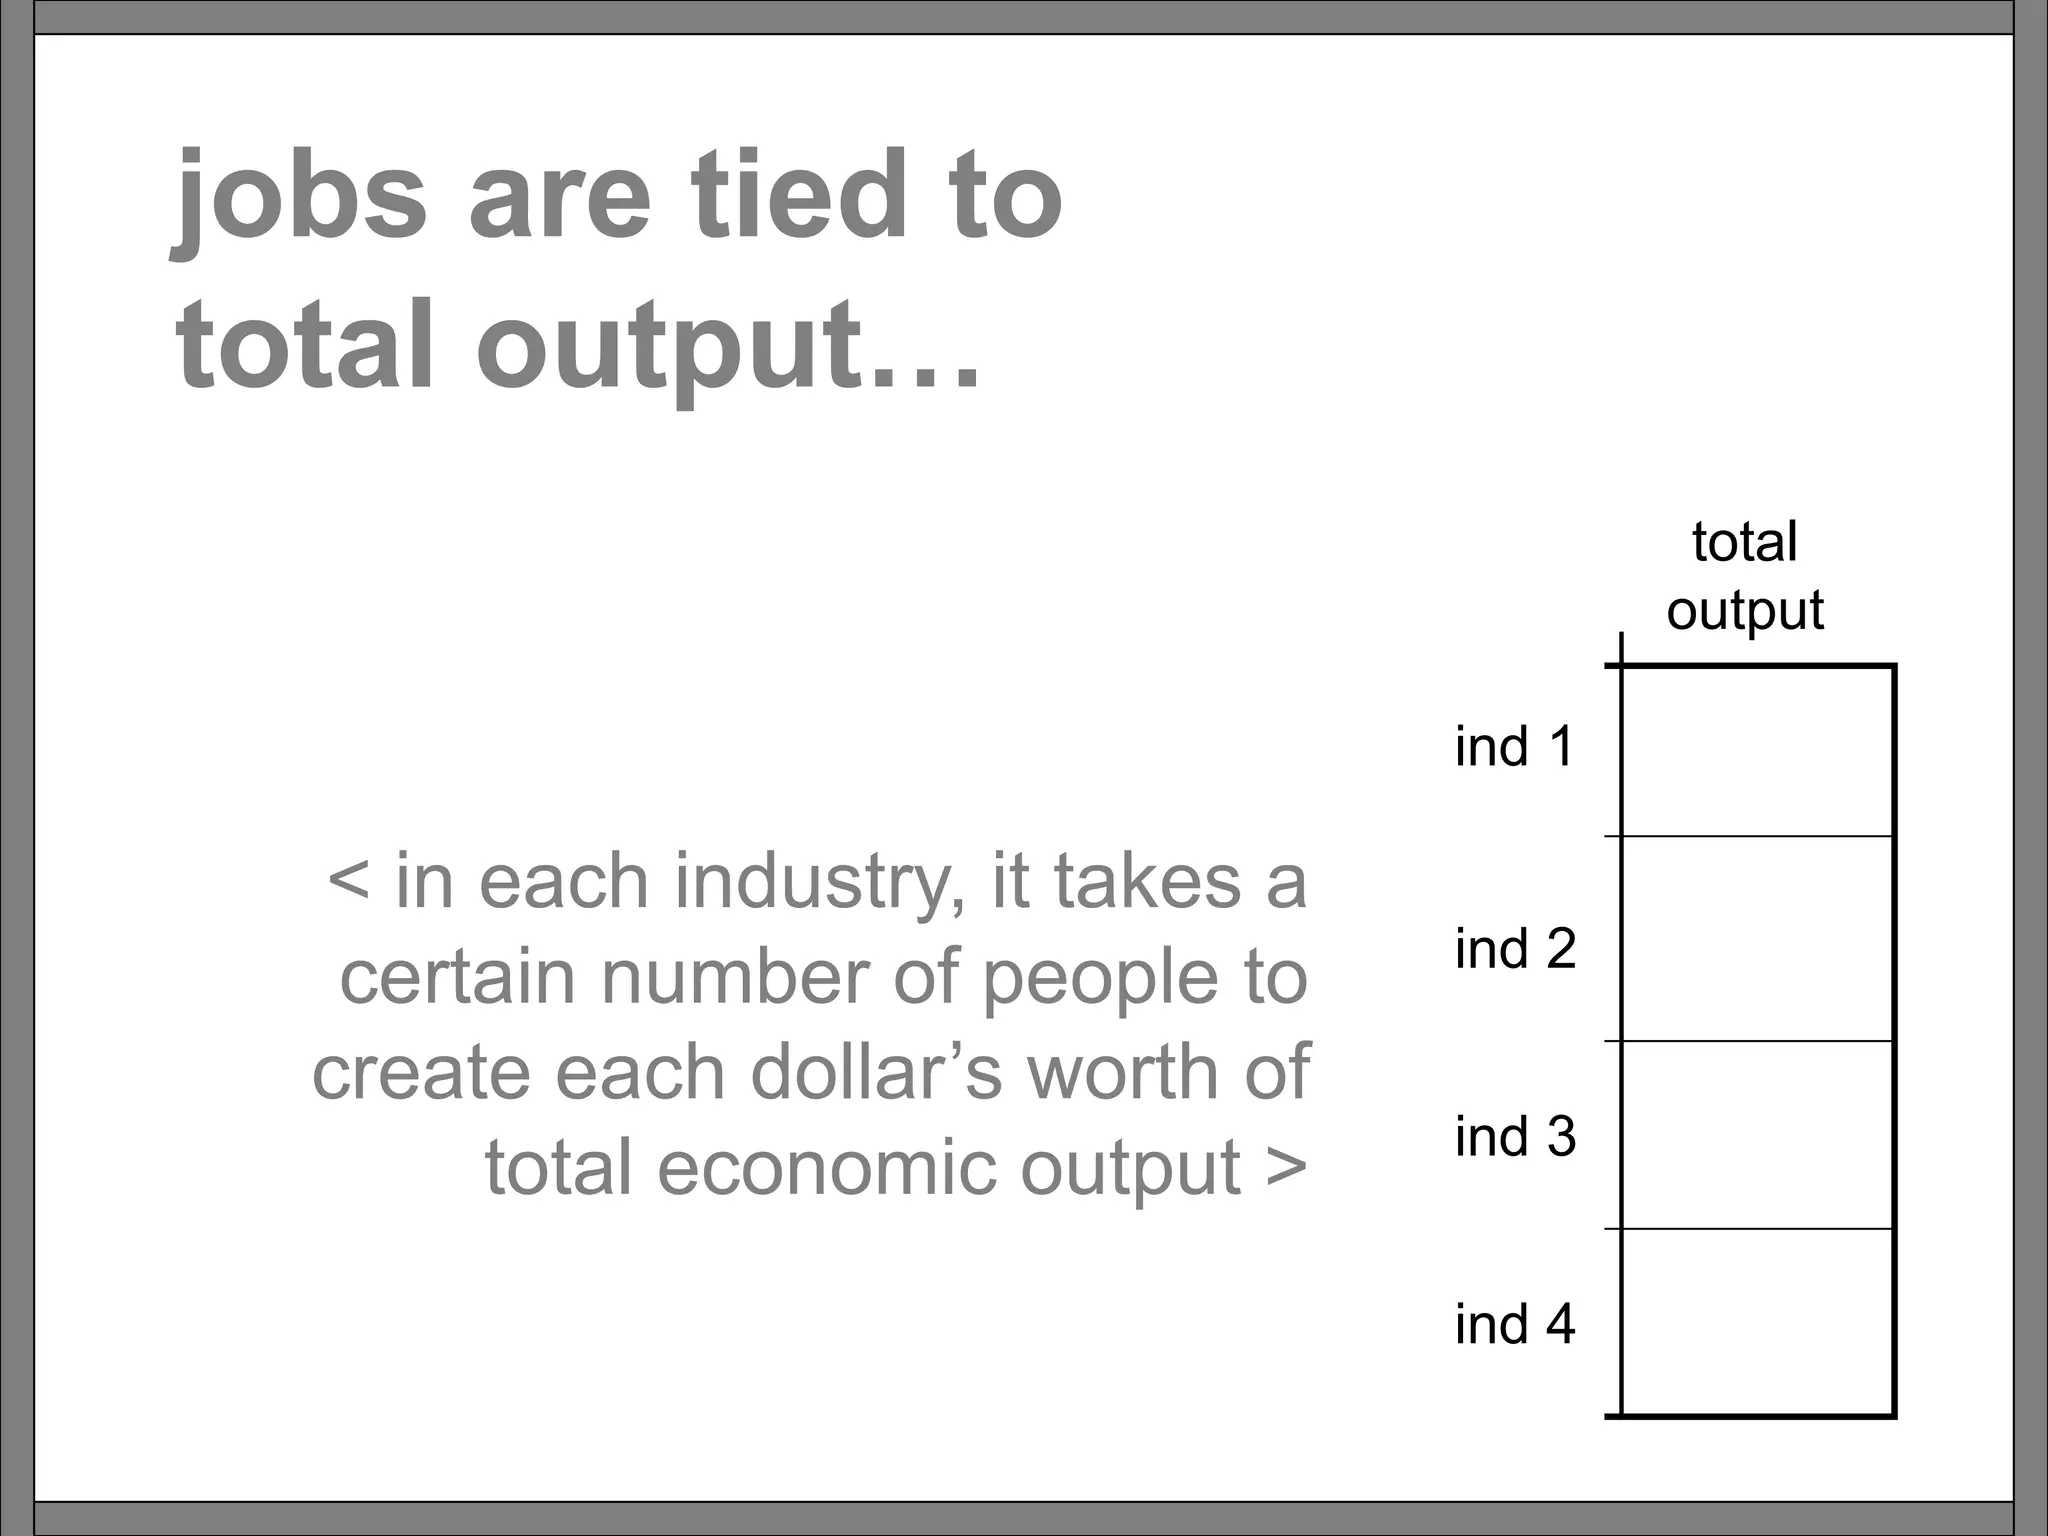
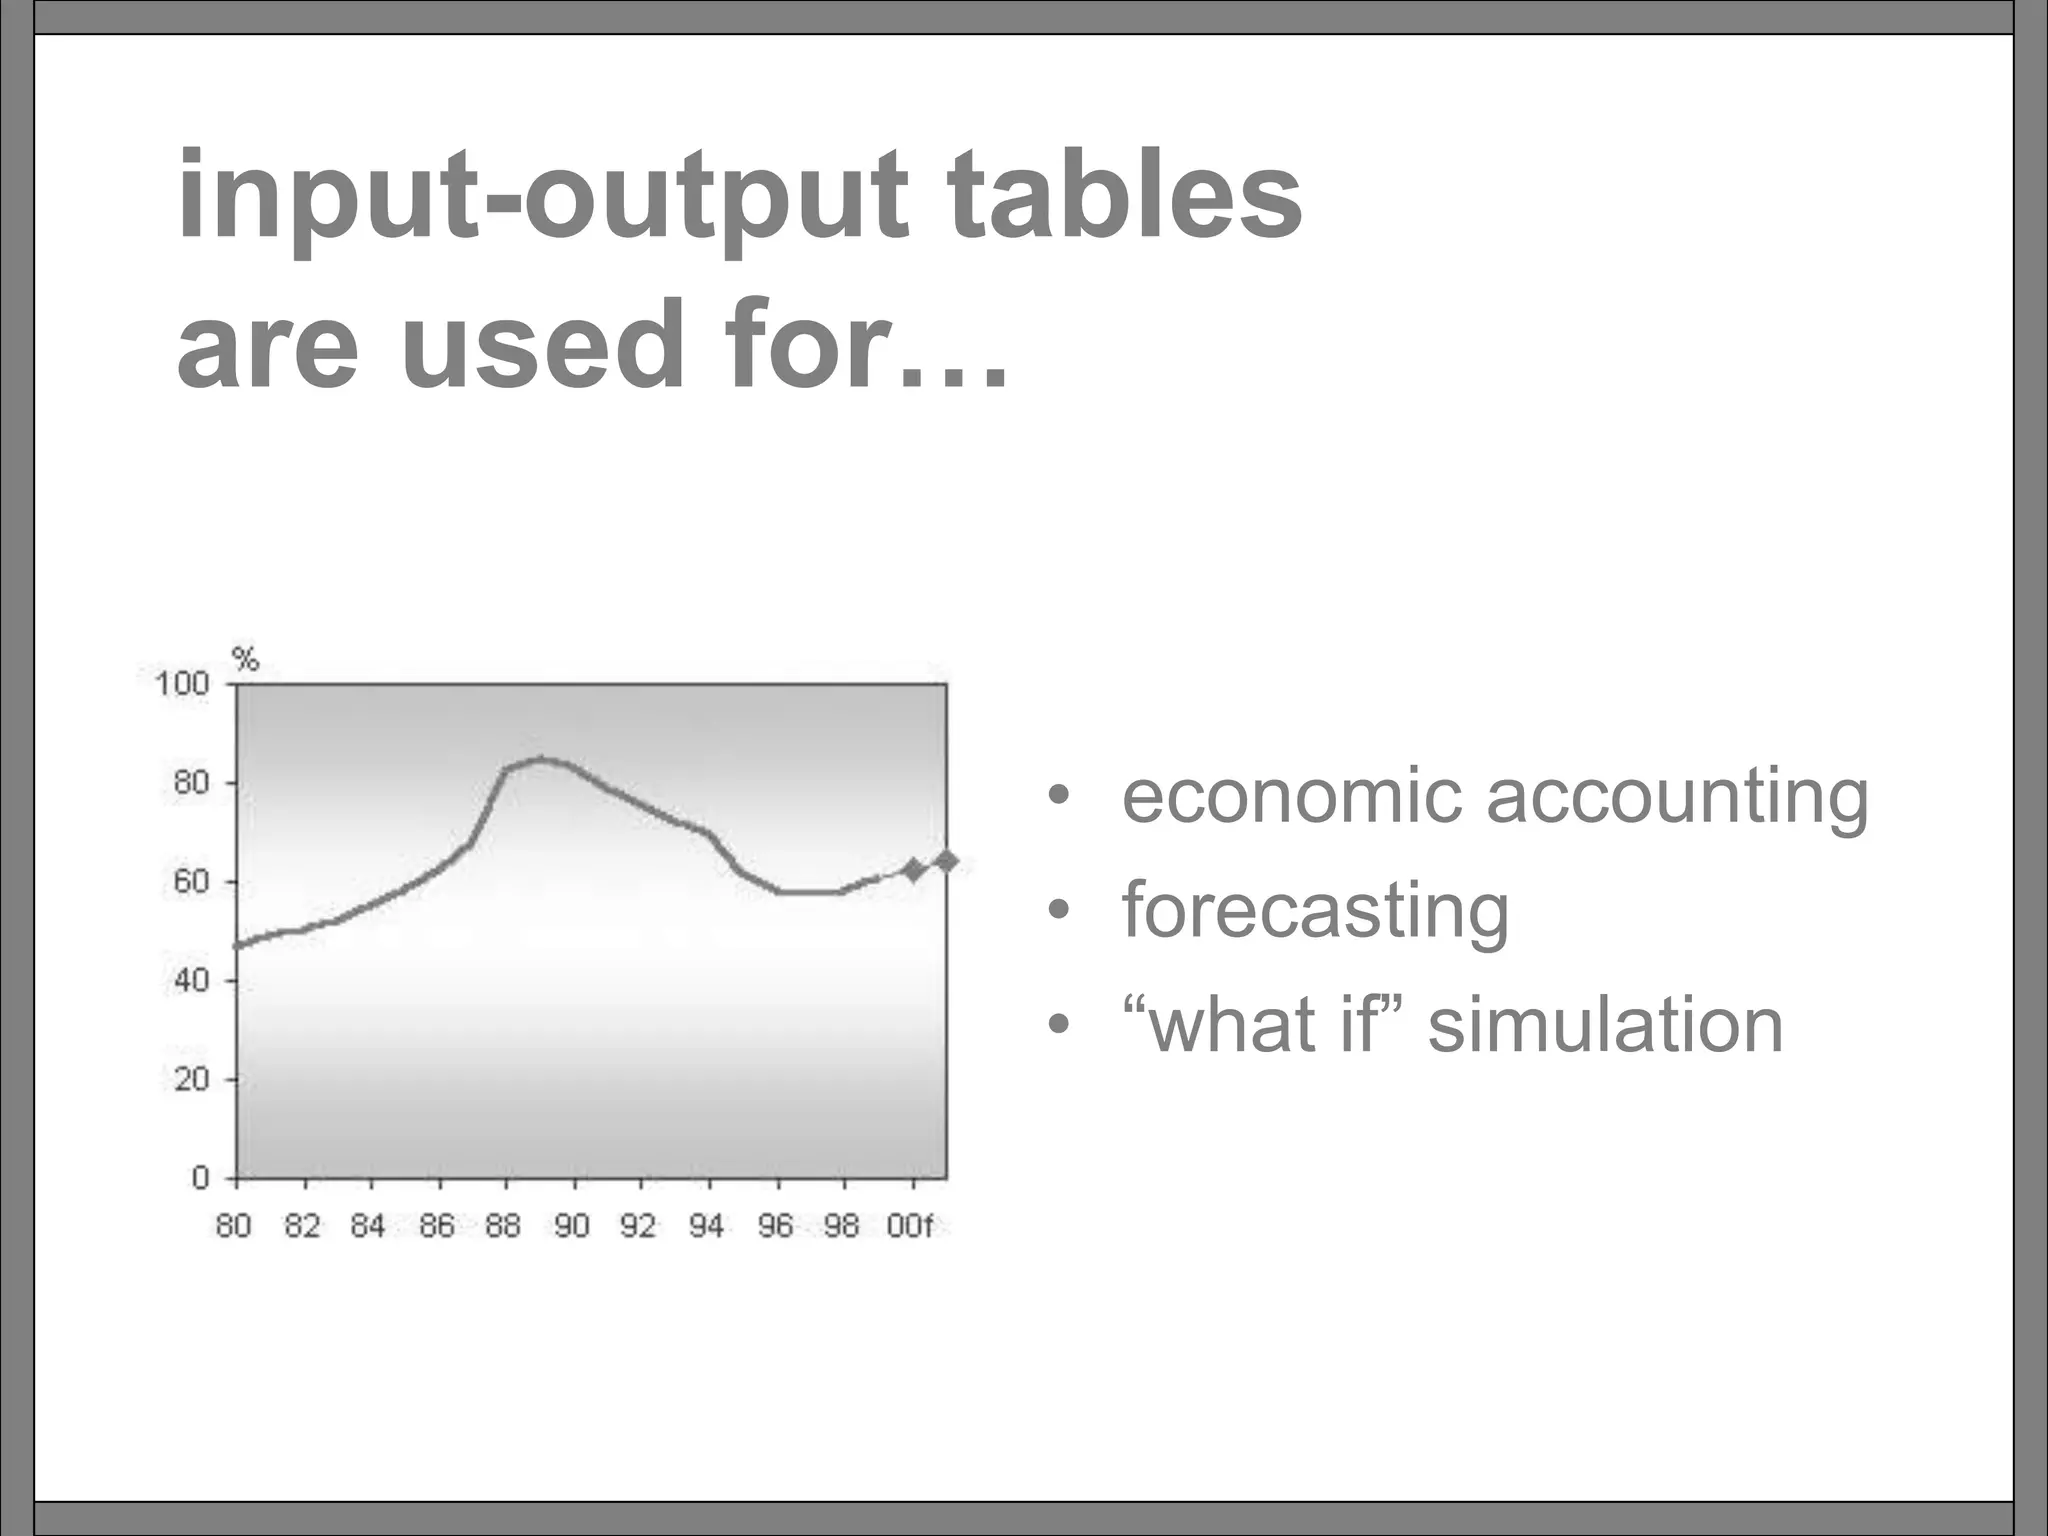
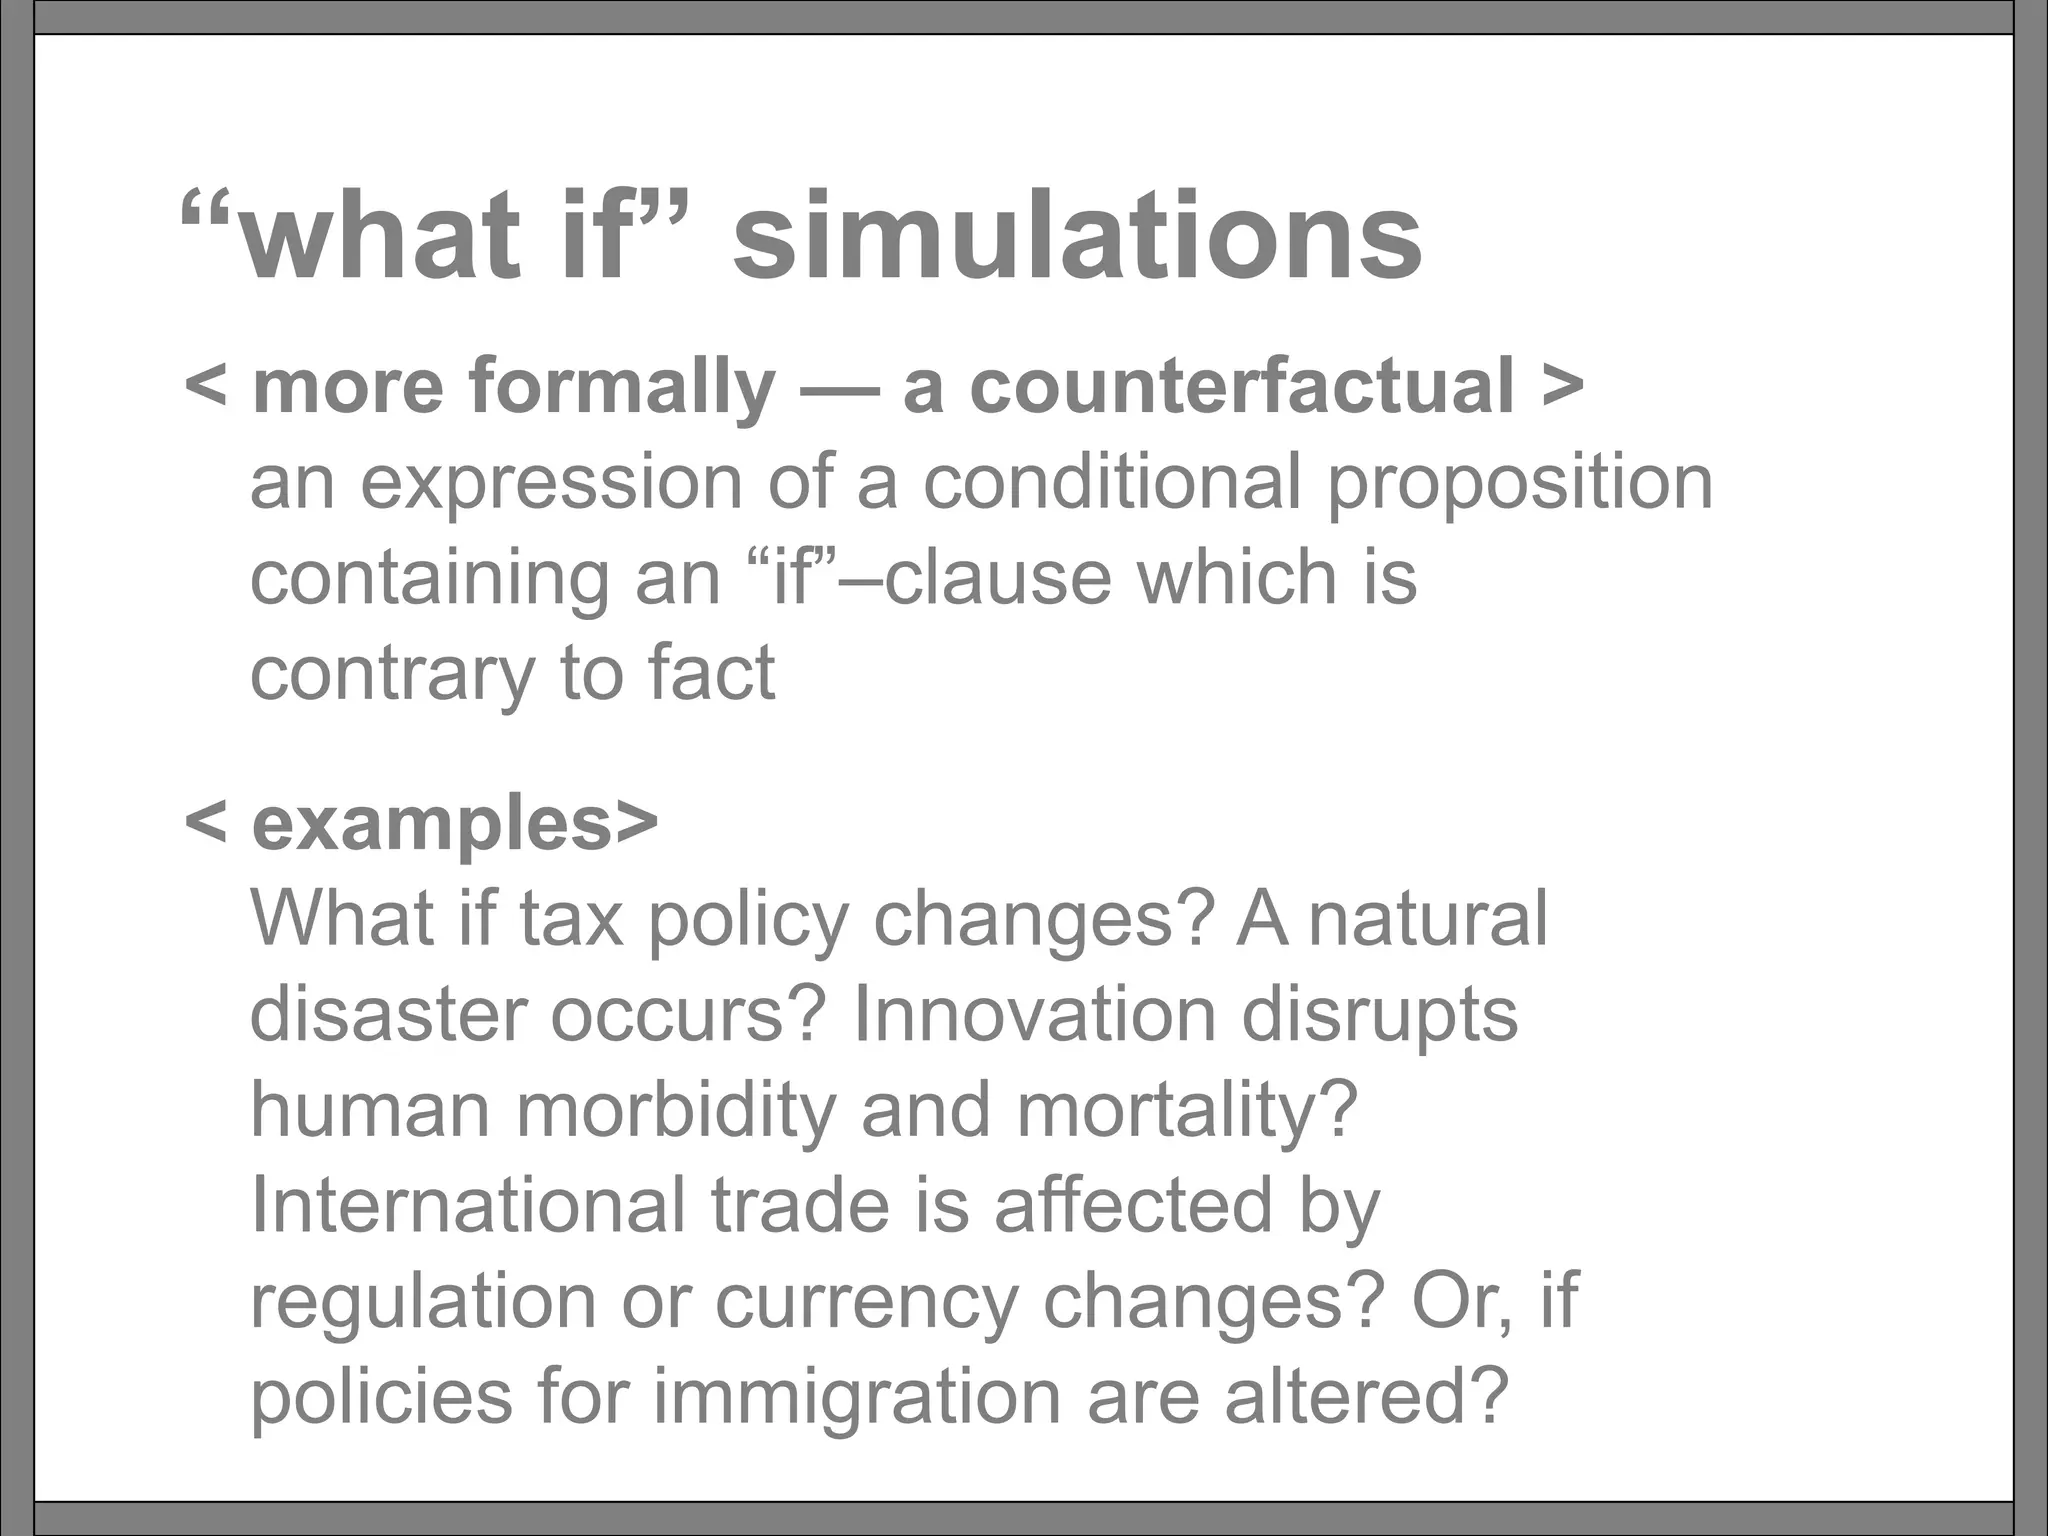
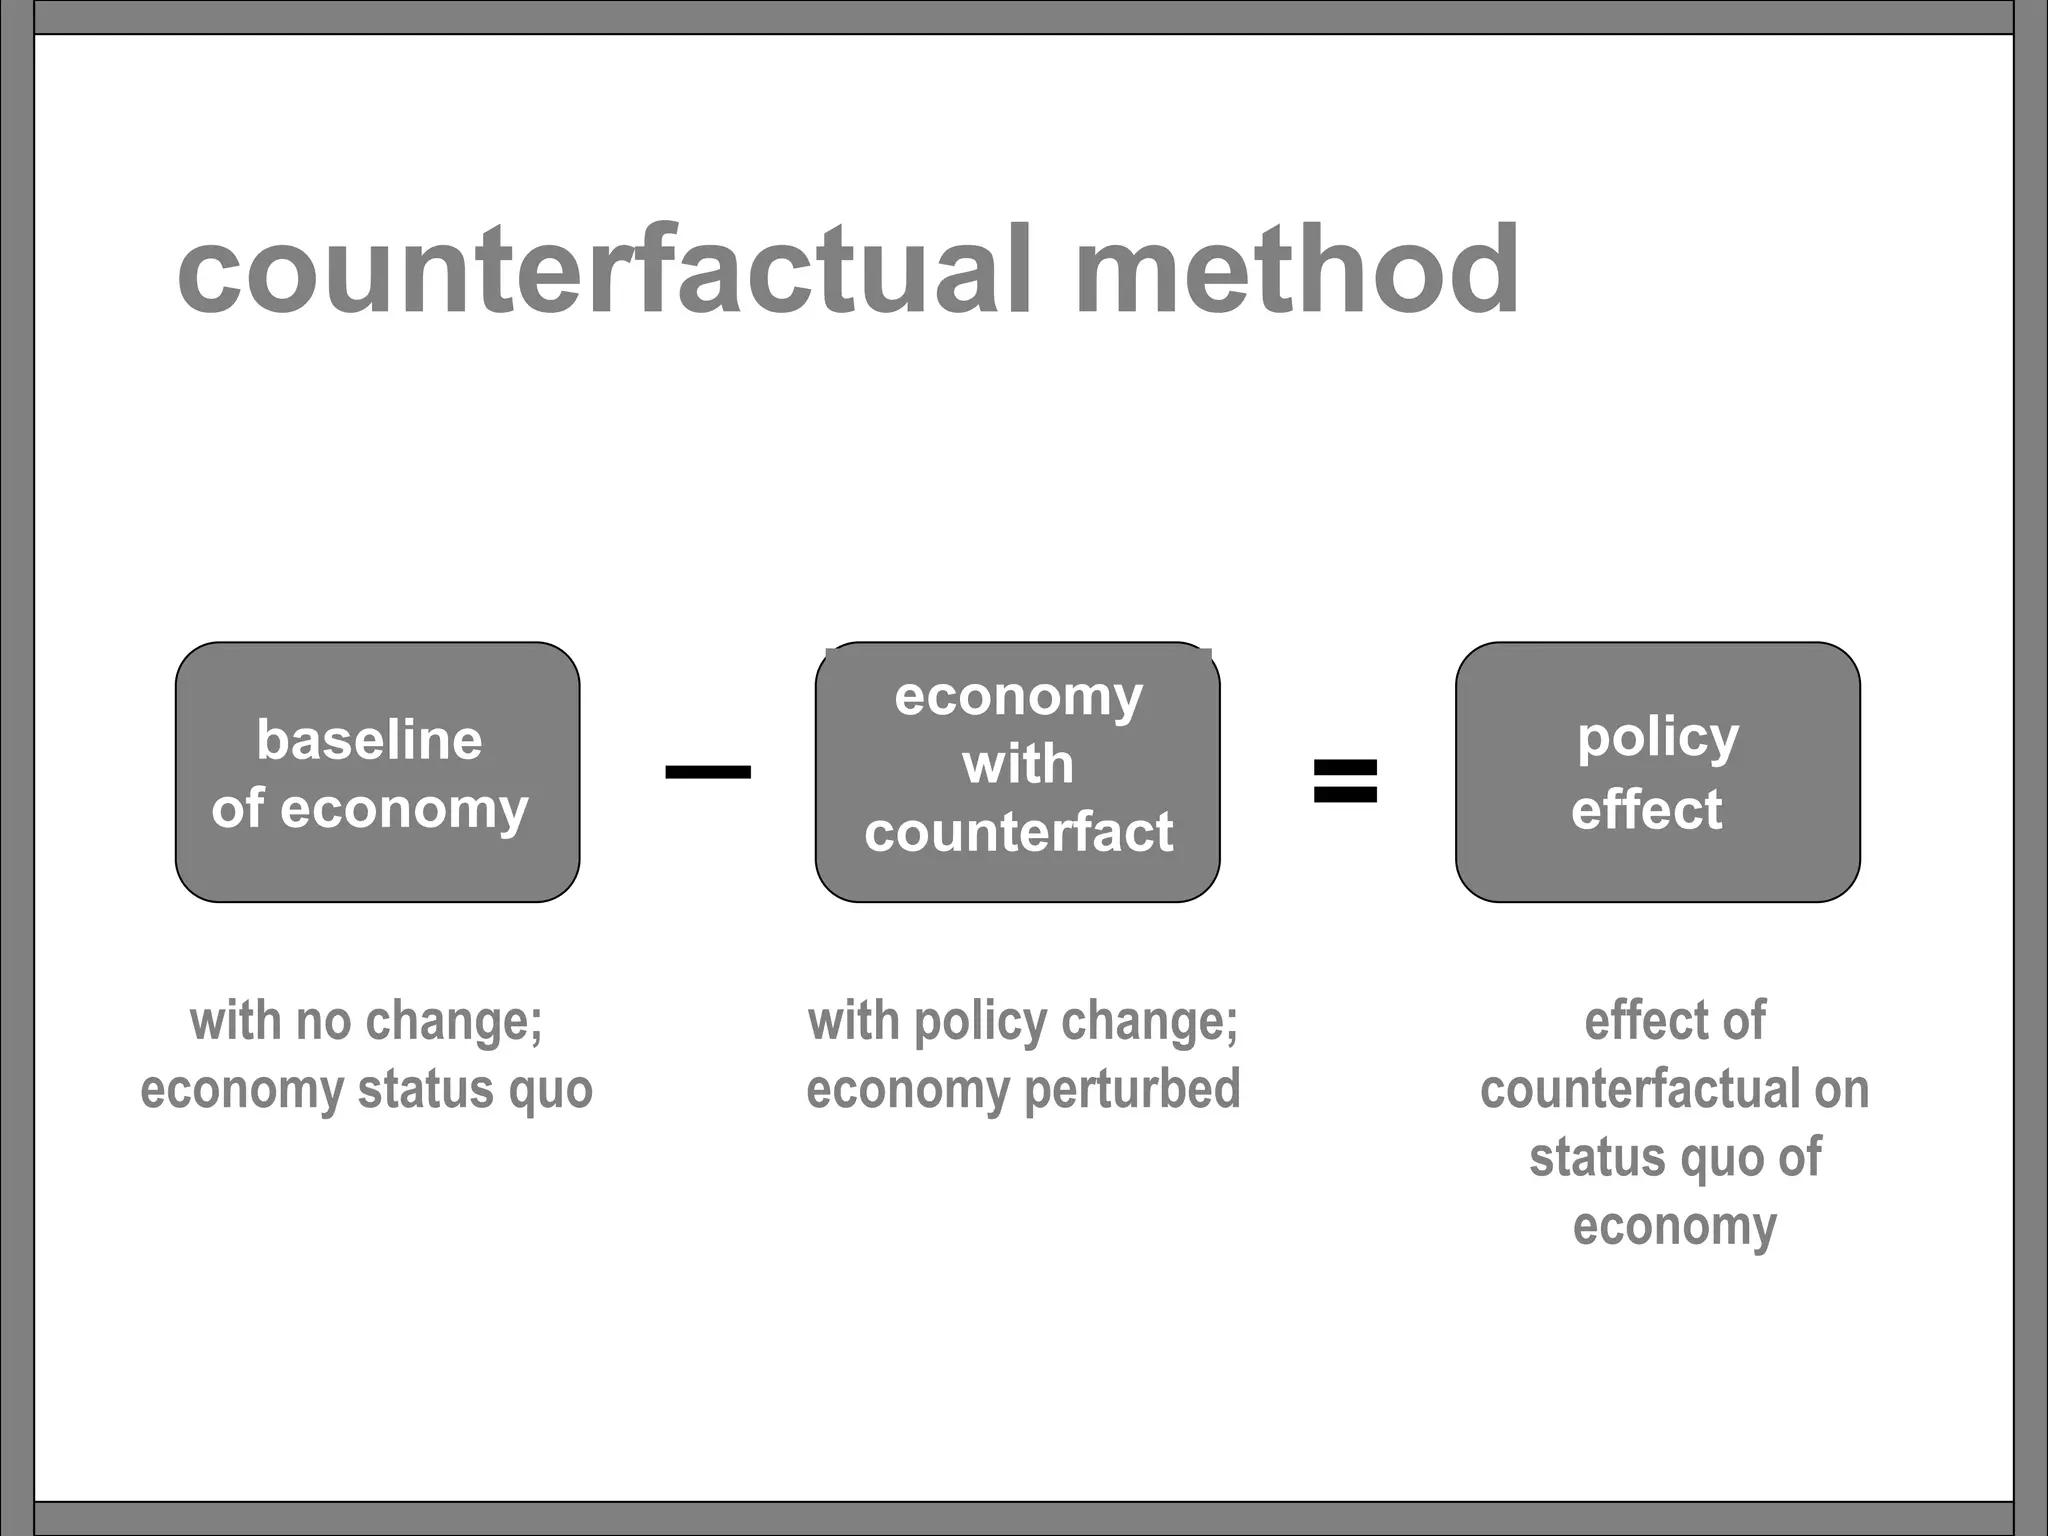
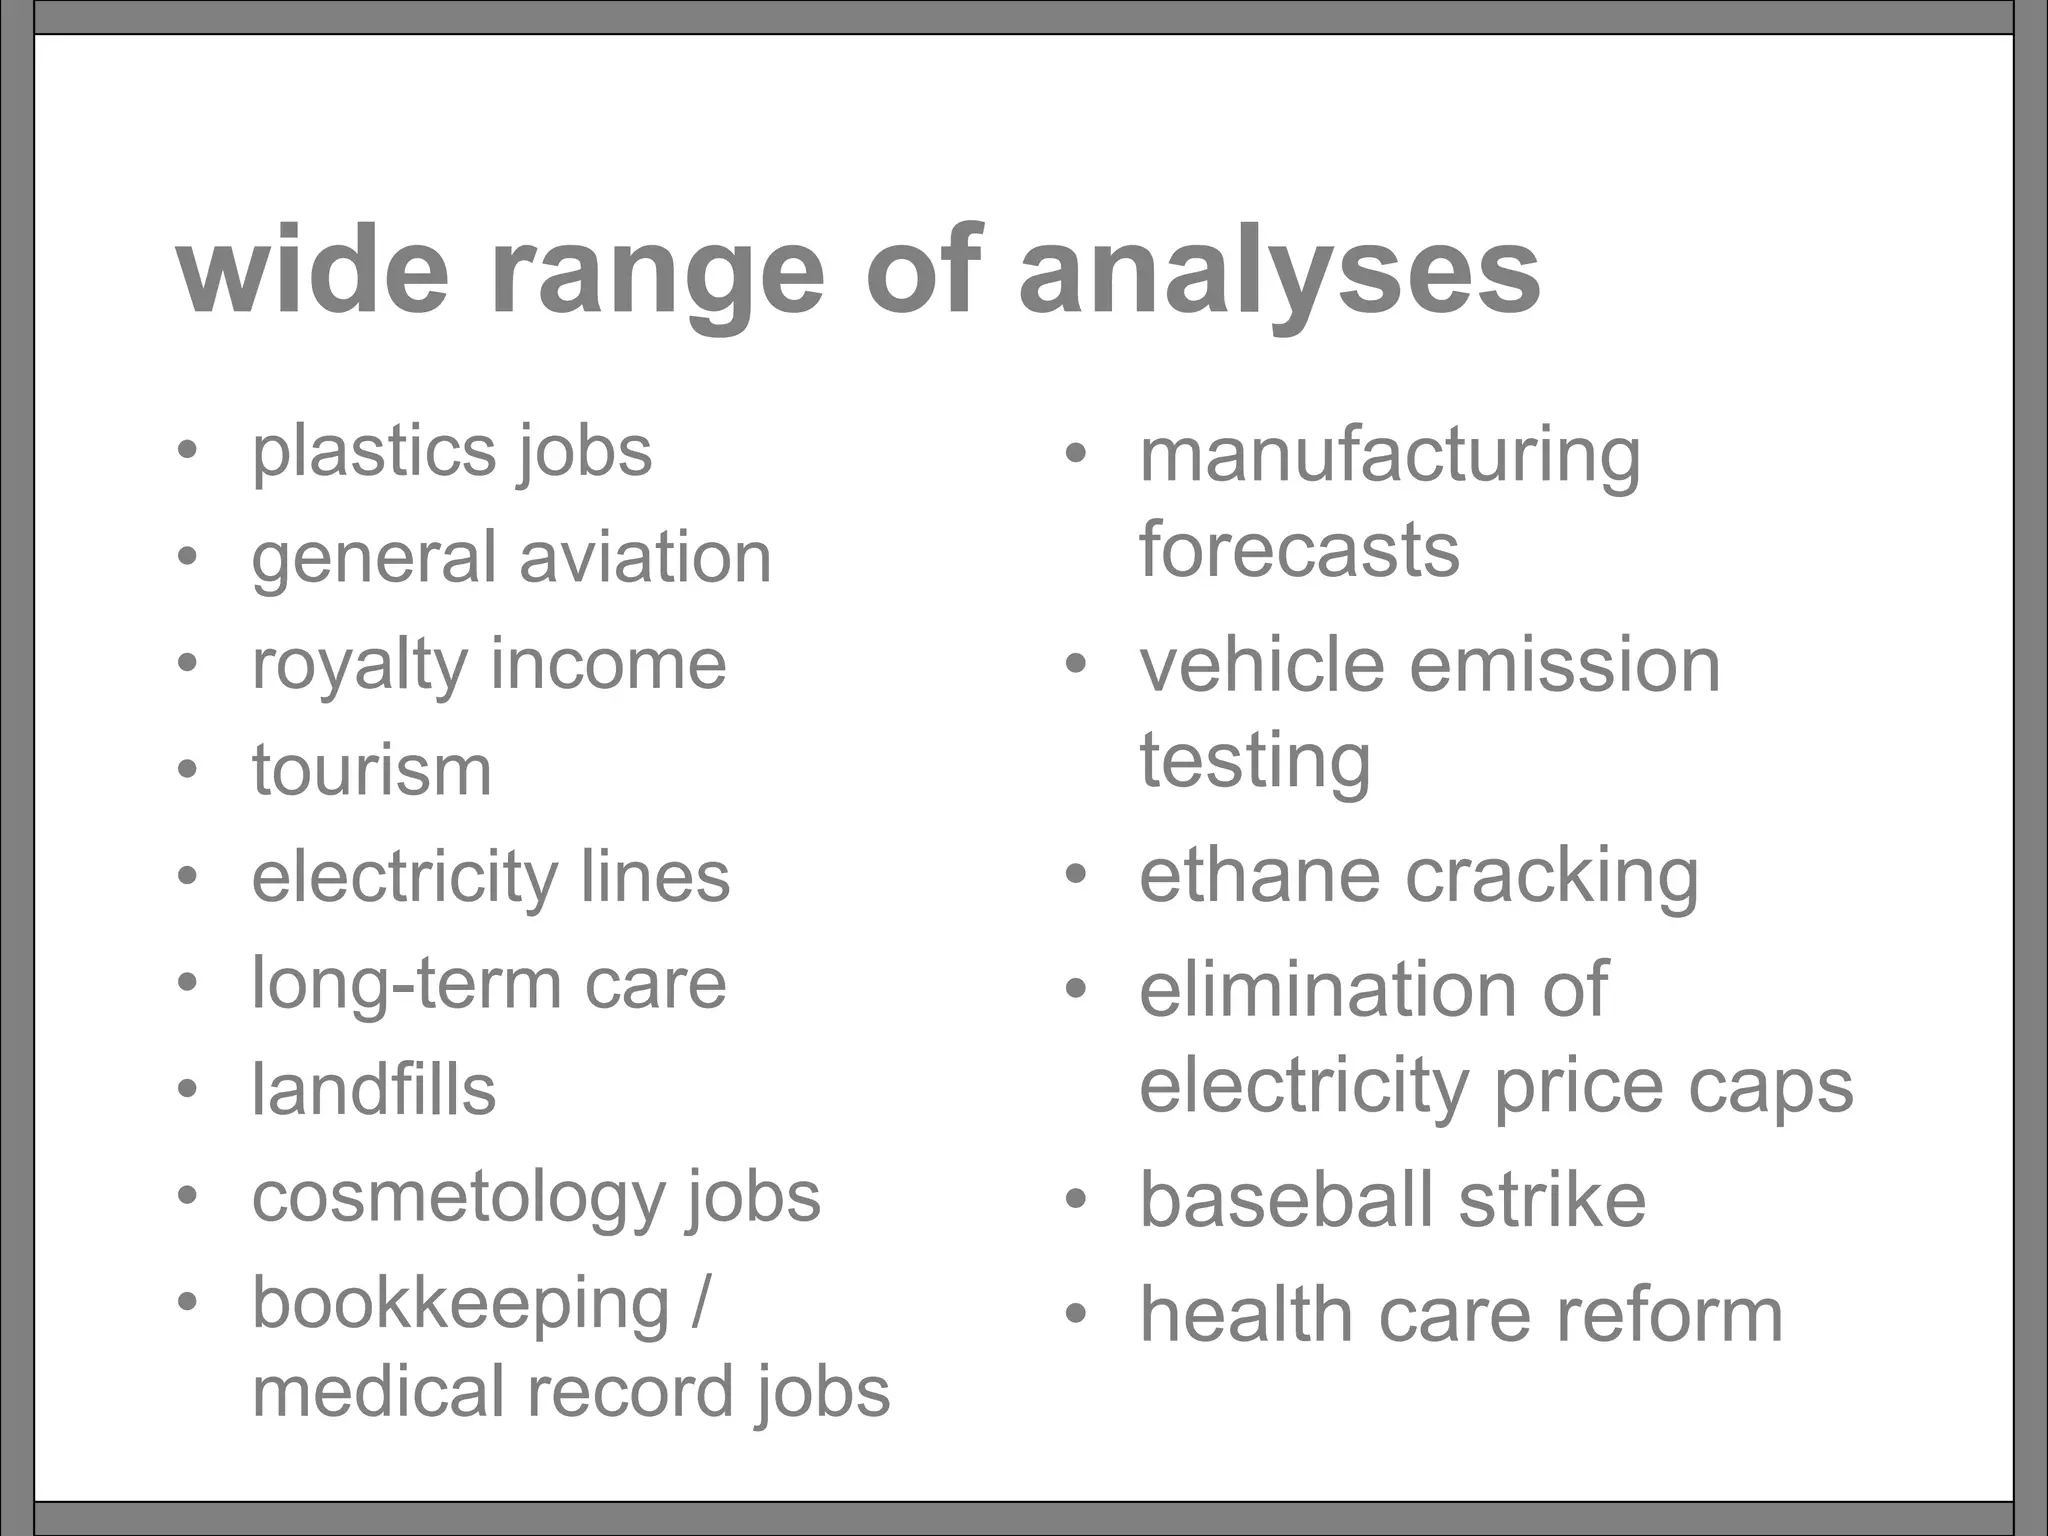
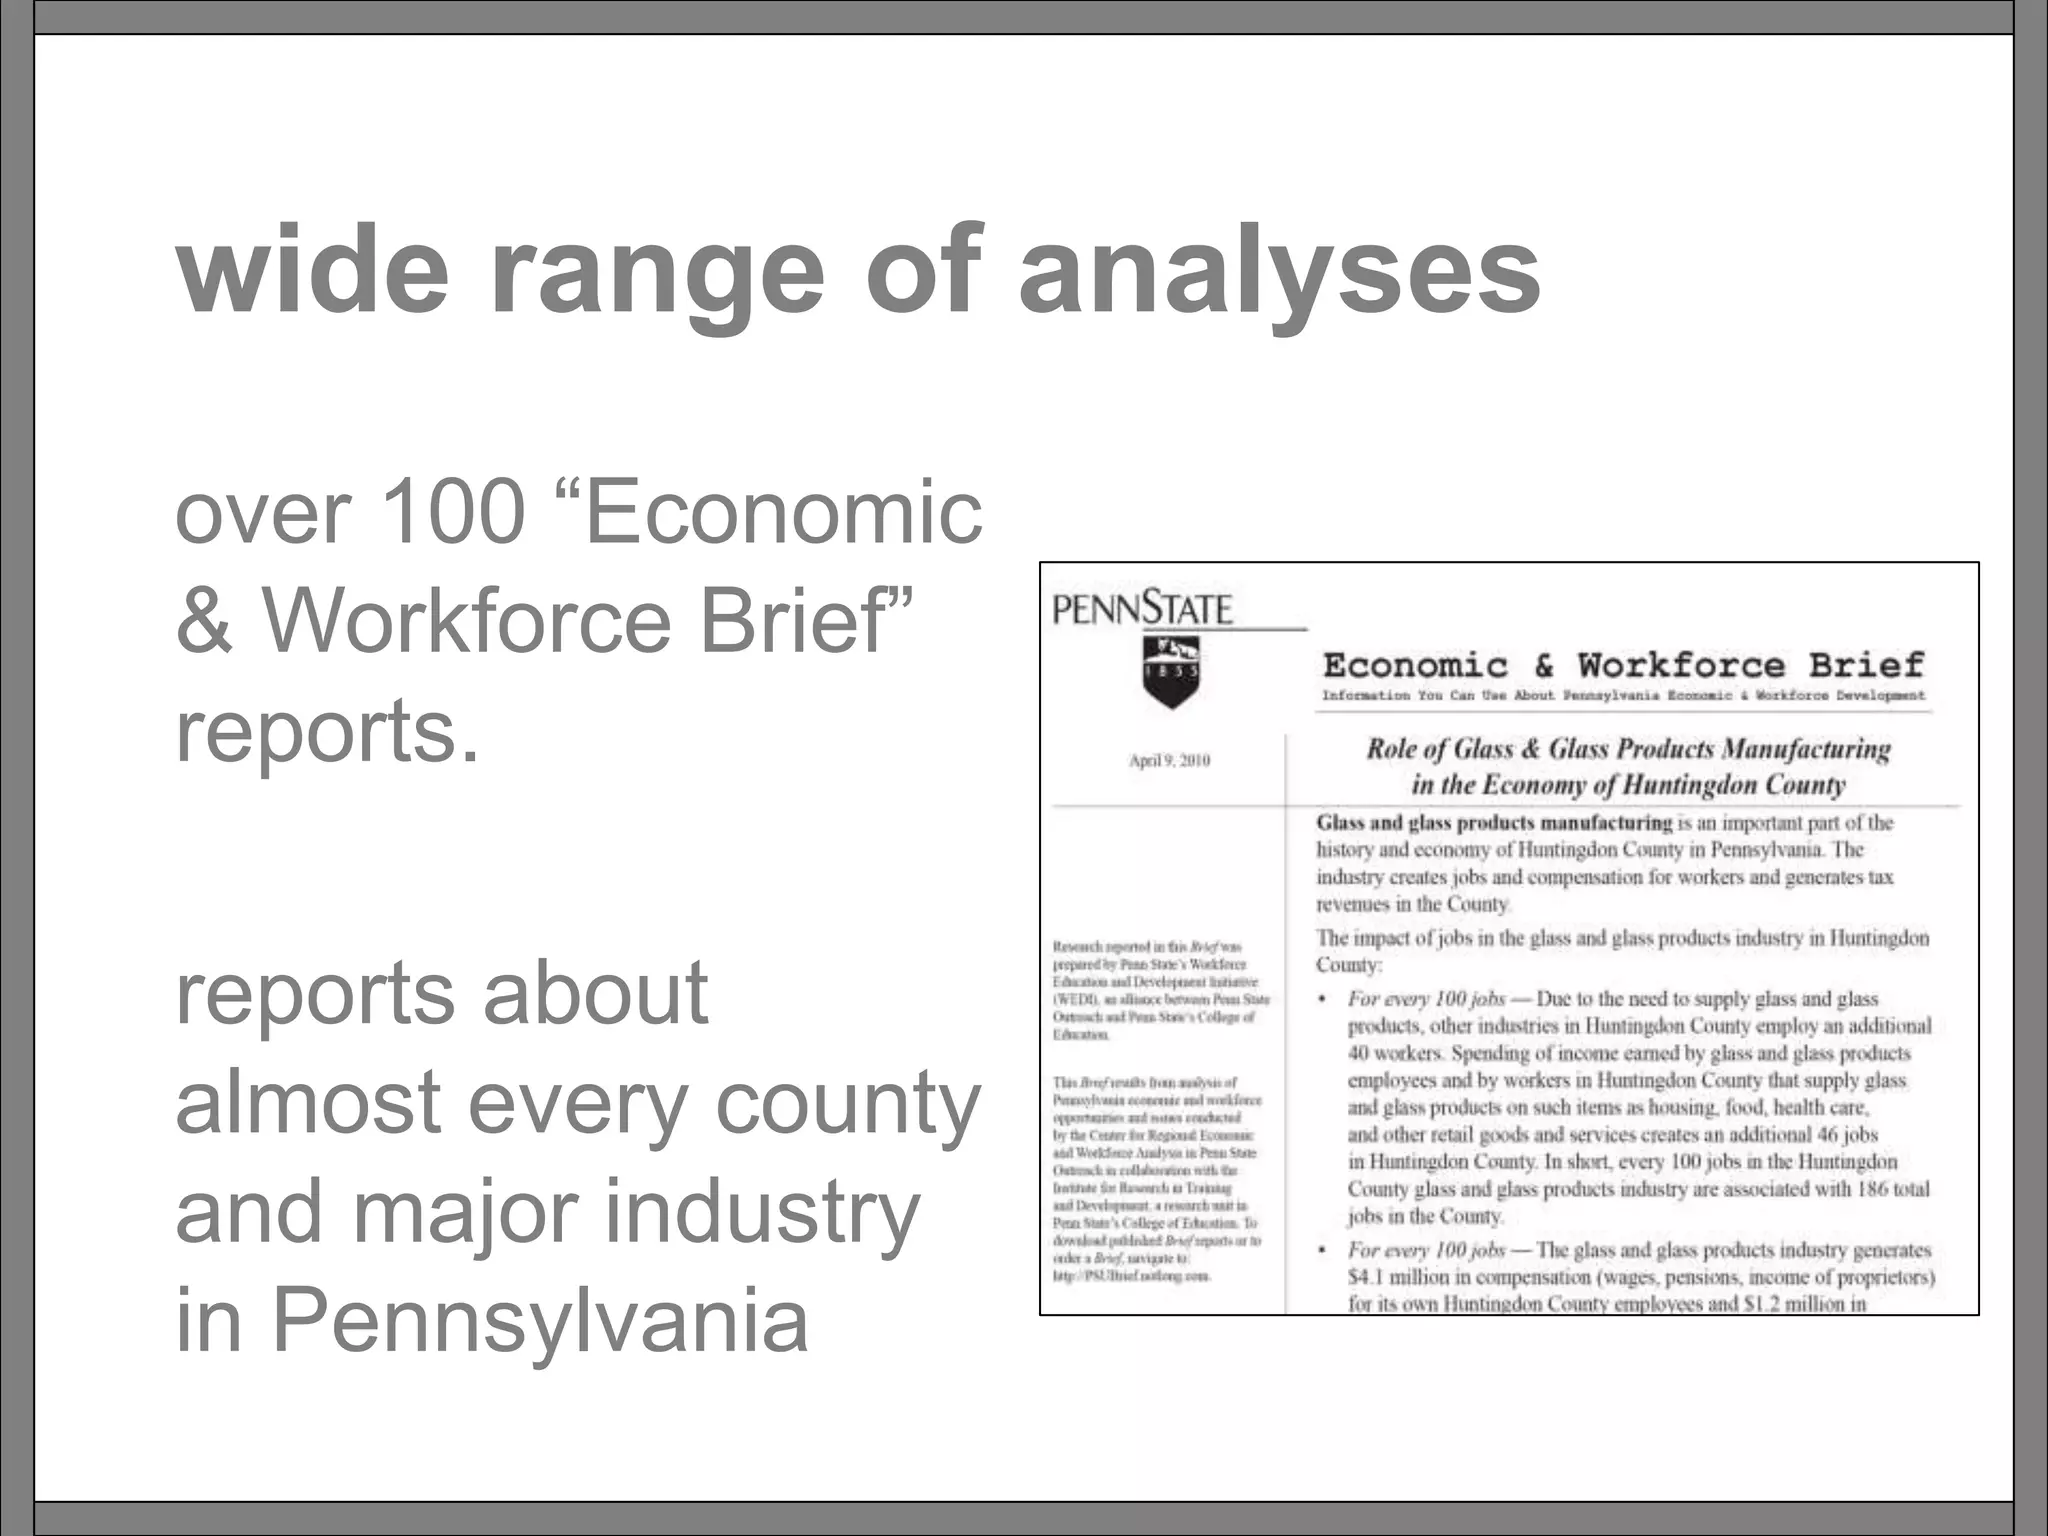
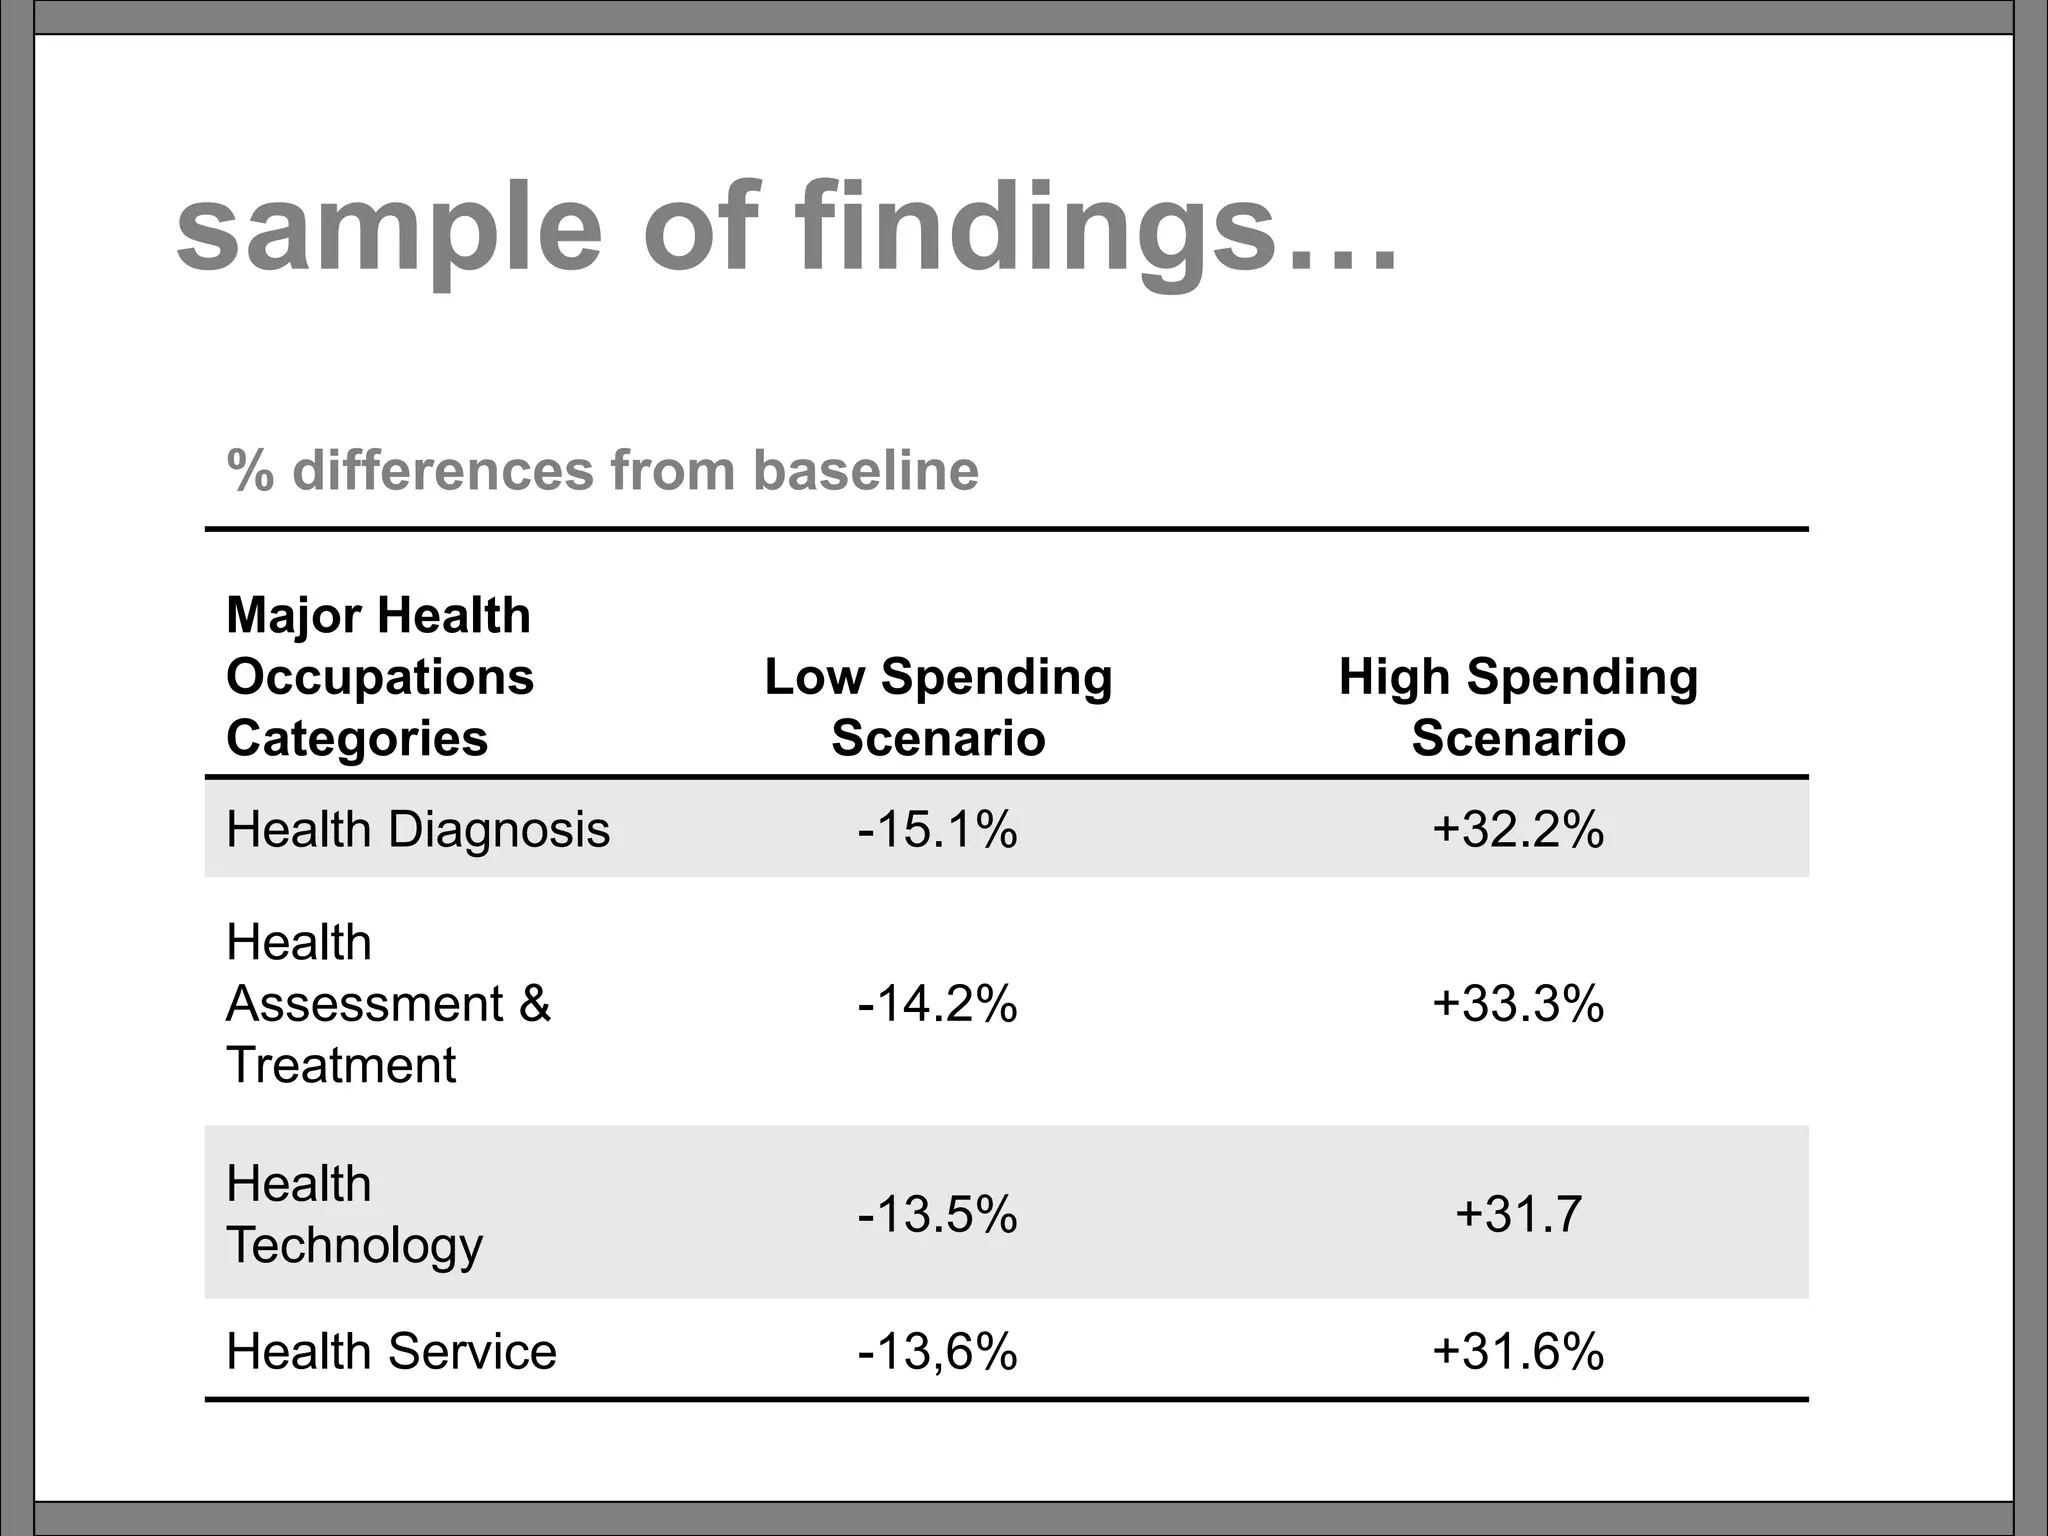
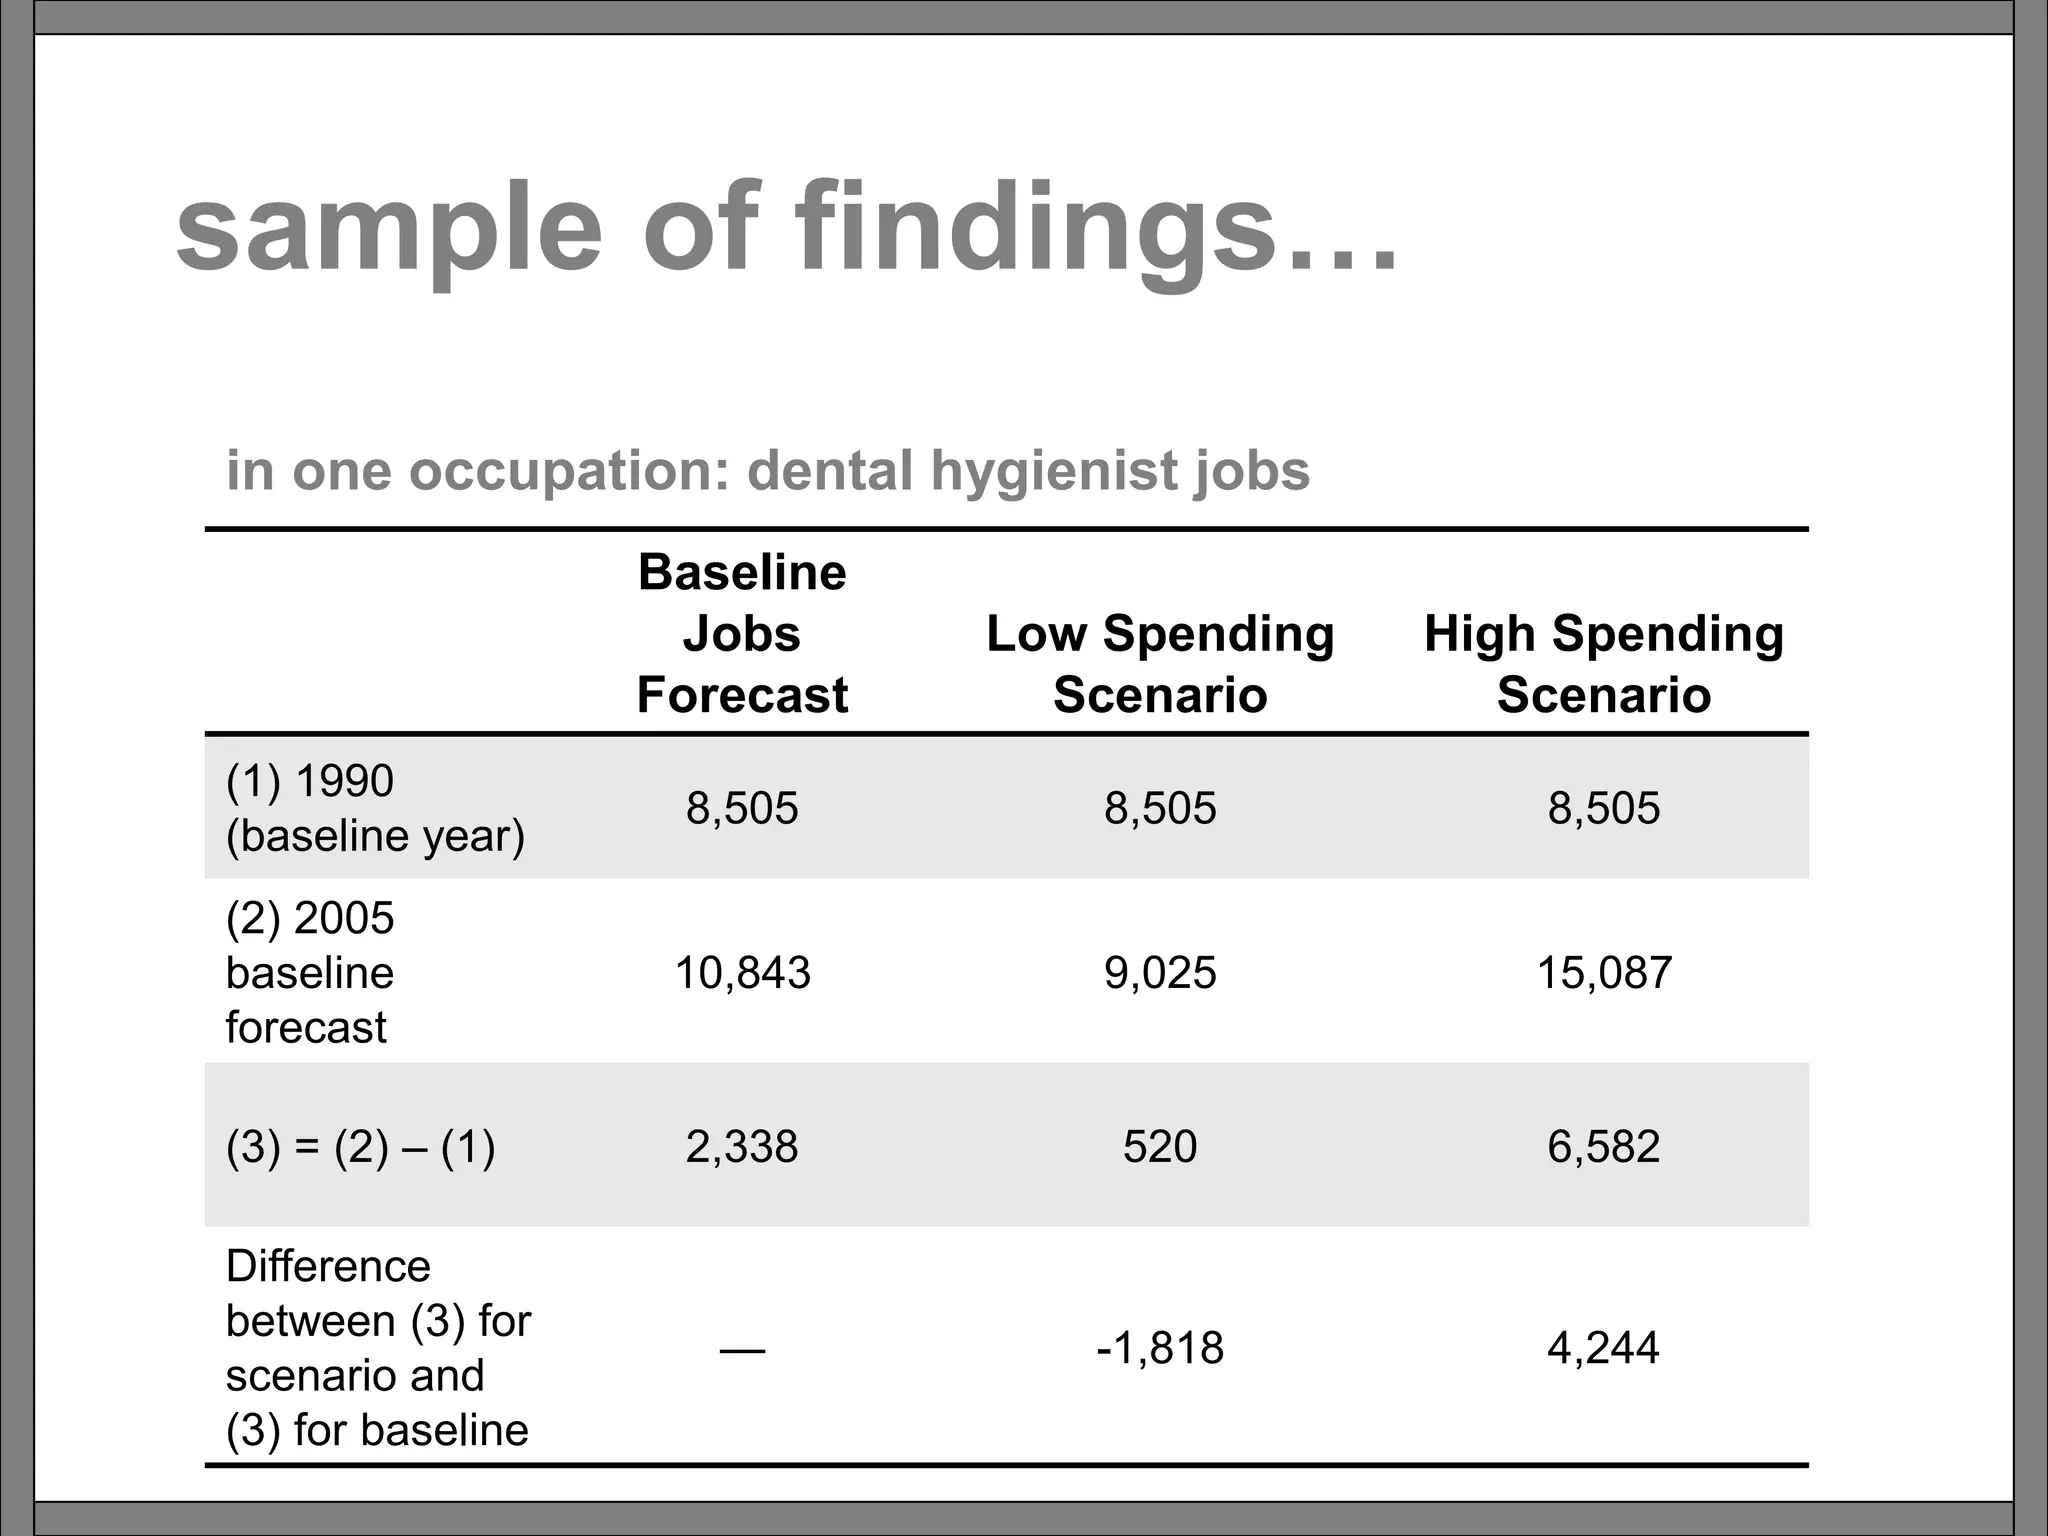
LINKING PRODUCTION,
CONSUMPTION,
EMPLOYMENT,
& SKILLS
Over 25 Years of Economic & Demographic
Policy Research at Penn State
David L. Passmore
today…
< background >
origin of the Penn State Economic
Modeling & Forecasting Project
< input-output model >
non-mathematical explanation of economic &
demographic models applied by the
Project
< examples >
some of the varied policy modeling &
forecasting efforts at Penn State
< background >
background…
< 1990s >
coalition of faculty members initiated
Penn State Economic Modeling &
Forecasting Project
< multidisciplinary coalition>
mineral economics, geography, industrial
economics, forestry, demography, education
< the common link >
input-output analysis developed by
Wassily Leontief
< input-output
model >
the economy is like
a huge ball of string…
< complex >
< intertwined >
< large >
< unexpected >
one way to organize data
about an economy…
< input-output
tables >
summarize
production,
consumption,
& employment
input-output table
ind 1
ind 2
ind 3
ind 4
ind 1 ind 2 ind 3 ind 4
final
demand
total
output
industries produce
goods & services
ind 1
ind 2
ind 3
ind 4
ind 1 ind 2 ind 3 ind 4
final
demand
total
output
producers
industries purchase
goods & services
ind 1
ind 2
ind 3
ind 4
ind 1 ind 2 ind 3 ind 4
final
demand
total
output
purchasers
production sector
of the economy
ind 1
ind 2
ind 3
ind 4
ind 1 ind 2 ind 3 ind 4
final
demand
total
output
production sector
of the economy
ind 1
ind 2
ind 3
ind 4
ind 1 ind 2 ind 3 ind 4
final
demand
total
output
interindustry
transactions
production sector
of the economy
ind 1
ind 2
ind 3
ind 4
ind 1 ind 2 ind 3 ind 4
final
demand
total
output
direct
requirements
a closer look at
interindustry transactions
ind 1
ind 2
ind 3
ind 4
ind 1 ind 2 ind 3 ind 4
final
demand
total
demand
purchases of
ind 2 from ind 1
purchasers
producers
a closer look at
interindustry transactions
ind 1
ind 2
ind 3
ind 4
ind 1 ind 2 ind 3 ind 4
final
demand
total
demand
purchases of
ind 3
from ind 2;
or, ind 2
produces
for ind 3
producers
purchasers
a closer look at
interindustry transactions
ind 1
ind 2
ind 3
ind 4
ind 1 ind 2 ind 3 ind 4
final
demand
total
demand
purchases of
ind 1 from
itself; some
industries use
the products
they make
producers
purchasers
industry production function
-- the direct supply chain
ind 1
ind 2
ind 3
ind 4
ind 1 ind 2 ind 3 ind 4
final
demand
total
demand
All purchases
of ind 1;
aka industry
production
function
purchasers
producers
producing & purchasing
continues until goods or
services created
ind 1
ind 2
ind 3
ind 4
ind 1 ind 2 ind 3 ind 4
final
demand
total
demand
< make/use…
make/use…
make/use…
the production
cycle goes
round & round >
consumption
ind 1
ind 2
ind 3
ind 4
ind 1 ind 2 ind 3 ind 4
final
demand
total
output
final demand…
gross domestic product…
consumption
ind 1
ind 2
ind 3
ind 4
ind 1 ind 2 ind 3 ind 4
final
demand
total
demand
< personal consumption >
< government purchases >
< investments >
< exports, net of imports >
ind 1
ind 2
ind 3
ind 4
total economic output…
ind 1
ind 2
ind 3
ind 4
ind 1 ind 2 ind 3 ind 4
final
demand
total
output
production + consumption = total output
total economic output…
ind 1
ind 2
ind 3
ind 4
ind 1 ind 2 ind 3 ind 4
final
demand
total
output
production + consumption = total output
total economic output…
ind 1
ind 2
ind 3
ind 4
ind 1 ind 2 ind 3 ind 4
final
demand
total
output
production + consumption = total output
total economic output…
ind 1
ind 2
ind 3
ind 4
ind 1 ind 2 ind 3 ind 4
final
demand
total
output
production + consumption = total output
total economic output…
ind 1
ind 2
ind 3
ind 4
ind 1 ind 2 ind 3 ind 4
final
demand
total
output
production + consumption = total output
< where jobs
come from >
jobs are created because…
• total output is created by a mix of productive
resources
• labor is a productive resource, along with
land and capital
• human capital is required to produce goods
and services
• people, with other resources, create output
jobs are tied to
total output…
ind 1
ind 2
ind 3
ind 4
ind 1 ind 2 ind 3 ind 4
final
demand
total
output
ind 1
ind 2
ind 3
ind 4
< in each industry, it takes a
certain number of people to
create each dollar’s worth of
total economic output >
jobs are tied to
total output…
ind 1
ind 2
ind 3
ind 4
ind 1 ind 2 ind 3 ind 4
final
demand
total
output
ind 1
ind 2
ind 3
ind 4
< if It takes .001 workers to
create $1 of economic output,
then,
jobs are tied to
total output…
ind 1
ind 2
ind 3
ind 4
ind 1 ind 2 ind 3 ind 4
final
demand
total
output
ind 1
ind 2
ind 3
ind 4
< if It takes .001 workers to
create $1 of economic output,
then, with $1 billion of total
industrial output, 1 million
workers are required >
jobs are tied to
total output…
ind 1
ind 2
ind 3
ind 4
ind 1 ind 2 ind 3 ind 4
final
demand
total
output
ind 1
ind 2
ind 3
ind 4
< changes in labor intensity
or in the kind or amount of
total economic output
create changes in numbers
and kinds of jobs >
occupational employment is
tied to total industrial
output…
ind 1
ind 2
ind 3
ind 4
ind 1 ind 2 ind 3 ind 4
final
demand
total
output
ind 1
ind 2
ind 3
ind 4
< industries use different occupations >
< industries use different labor intensities >
< occupational employment differs by industry >
occupational employment
is created when people
use their unique human
capital to create goods &
services
input-output tables
are used for…
• economic accounting
• forecasting
• “what if” simulation
“what if” simulations
< more formally — a counterfactual >
an expression of a conditional proposition
containing an “if”–clause which is
contrary to fact
< examples>
What if tax policy changes? A natural
disaster occurs? Innovation disrupts
human morbidity and mortality?
International trade is affected by
regulation or currency changes? Or, if
policies for immigration are altered?
policy
effect
counterfactual method
baseline
of economy
economy
with
counterfact =
with no change;
economy status quo
with policy change;
economy perturbed
effect of
counterfactual on
status quo of
economy
< examples >
wide range of analyses
• California pollution
standards in PA
• table eggs
• literacy
• adolescent fertility
• engineer shortages
• technical skills deficits
• educational reform
• planning career &
tech ed
• gas severance tax
• town planning
• military base closing
• occupational supply
• highway
construction
• ski industry
• energy workforce
• motorsports track
wide range of analyses
• plastics jobs
• general aviation
• royalty income
• tourism
• electricity lines
• long-term care
• landfills
• cosmetology jobs
• bookkeeping /
medical record jobs
• manufacturing
forecasts
• vehicle emission
testing
• ethane cracking
• elimination of
electricity price caps
• baseball strike
• health care reform
wide range of analyses
over 100 “Economic
& Workforce Brief”
reports.
reports about
almost every county
and major industry
in Pennsylvania
a detailed example…
< health care reform >
How National Health Care Spending Affects
Pennsylvania Health Care Employment
the health care reform
debate in the 1990s…
< health & medical technology had improved
remarkably >
< health care & service spending increased as
share of GNP >
< increasing numbers of people became
uninsured >
< strong, partisan, acrimonious debate over
health care funding occurred >
< numerous proposals offered for reform >
aim…
< examine sensitivity of Pennsylvania
health care & service employment to
alternative national spending patterns in
health-related industries >
approach…
< create two counterfactuals representing
high and low national spending scenarios that
we “pushed down” to Pennsylvania to capture
effect of national policy change on state
employment >
sample of findings…
Major Health
Occupations
Categories
Low Spending
Scenario
High Spending
Scenario
Health Diagnosis -15.1% +32.2%
Health
Assessment &
Treatment
-14.2% +33.3%
Health
Technology
-13.5% +31.7
Health Service -13,6% +31.6%
% job differences from baseline
sample of findings…
Baseline
Jobs
Forecast
Low Spending
Scenario
High Spending
Scenario
(1) 1990
(baseline year)
8,505 8,505 8,505
(2) 2005
baseline
forecast
10,843 9,025 15,087
(3) = (2) – (1) 2,338 520 6,582
Difference
between (3) for
scenario and
(3) for baseline
— -1,818 4,244
in one occupation: dental hygienist jobs
LINKING PRODUCTION,
CONSUMPTION,
EMPLOYMENT,
& SKILLS
Over 25 Years of Economic & Demographic
Policy Research at Penn State
David L. Passmore

Linking Production, Consumption, Employment, & Skills

  • 1.
    LINKING PRODUCTION, CONSUMPTION, EMPLOYMENT, & SKILLS Over25 Years of Economic & Demographic Policy Research at Penn State David L. Passmore
  • 2.
    today… < background > originof the Penn State Economic Modeling & Forecasting Project < input-output model > non-mathematical explanation of economic & demographic models applied by the Project < examples > some of the varied policy modeling & forecasting efforts at Penn State
  • 3.
  • 4.
    background… < 1990s > coalitionof faculty members initiated Penn State Economic Modeling & Forecasting Project < multidisciplinary coalition> mineral economics, geography, industrial economics, forestry, demography, education < the common link > input-output analysis developed by Wassily Leontief
  • 5.
  • 6.
    the economy islike a huge ball of string… < complex > < intertwined > < large > < unexpected >
  • 7.
    one way toorganize data about an economy… < input-output tables > summarize production, consumption, & employment
  • 8.
    input-output table ind 1 ind2 ind 3 ind 4 ind 1 ind 2 ind 3 ind 4 final demand total output
  • 9.
    industries produce goods &services ind 1 ind 2 ind 3 ind 4 ind 1 ind 2 ind 3 ind 4 final demand total output producers
  • 10.
    industries purchase goods &services ind 1 ind 2 ind 3 ind 4 ind 1 ind 2 ind 3 ind 4 final demand total output purchasers
  • 11.
    production sector of theeconomy ind 1 ind 2 ind 3 ind 4 ind 1 ind 2 ind 3 ind 4 final demand total output
  • 12.
    production sector of theeconomy ind 1 ind 2 ind 3 ind 4 ind 1 ind 2 ind 3 ind 4 final demand total output interindustry transactions
  • 13.
    production sector of theeconomy ind 1 ind 2 ind 3 ind 4 ind 1 ind 2 ind 3 ind 4 final demand total output direct requirements
  • 14.
    a closer lookat interindustry transactions ind 1 ind 2 ind 3 ind 4 ind 1 ind 2 ind 3 ind 4 final demand total demand purchases of ind 2 from ind 1 purchasers producers
  • 15.
    a closer lookat interindustry transactions ind 1 ind 2 ind 3 ind 4 ind 1 ind 2 ind 3 ind 4 final demand total demand purchases of ind 3 from ind 2; or, ind 2 produces for ind 3 producers purchasers
  • 16.
    a closer lookat interindustry transactions ind 1 ind 2 ind 3 ind 4 ind 1 ind 2 ind 3 ind 4 final demand total demand purchases of ind 1 from itself; some industries use the products they make producers purchasers
  • 17.
    industry production function --the direct supply chain ind 1 ind 2 ind 3 ind 4 ind 1 ind 2 ind 3 ind 4 final demand total demand All purchases of ind 1; aka industry production function purchasers producers
  • 18.
    producing & purchasing continuesuntil goods or services created ind 1 ind 2 ind 3 ind 4 ind 1 ind 2 ind 3 ind 4 final demand total demand < make/use… make/use… make/use… the production cycle goes round & round >
  • 19.
    consumption ind 1 ind 2 ind3 ind 4 ind 1 ind 2 ind 3 ind 4 final demand total output
  • 20.
    final demand… gross domesticproduct… consumption ind 1 ind 2 ind 3 ind 4 ind 1 ind 2 ind 3 ind 4 final demand total demand < personal consumption > < government purchases > < investments > < exports, net of imports > ind 1 ind 2 ind 3 ind 4
  • 21.
    total economic output… ind1 ind 2 ind 3 ind 4 ind 1 ind 2 ind 3 ind 4 final demand total output production + consumption = total output
  • 22.
    total economic output… ind1 ind 2 ind 3 ind 4 ind 1 ind 2 ind 3 ind 4 final demand total output production + consumption = total output
  • 23.
    total economic output… ind1 ind 2 ind 3 ind 4 ind 1 ind 2 ind 3 ind 4 final demand total output production + consumption = total output
  • 24.
    total economic output… ind1 ind 2 ind 3 ind 4 ind 1 ind 2 ind 3 ind 4 final demand total output production + consumption = total output
  • 25.
    total economic output… ind1 ind 2 ind 3 ind 4 ind 1 ind 2 ind 3 ind 4 final demand total output production + consumption = total output
  • 26.
  • 27.
    jobs are createdbecause… • total output is created by a mix of productive resources • labor is a productive resource, along with land and capital • human capital is required to produce goods and services • people, with other resources, create output
  • 28.
    jobs are tiedto total output… ind 1 ind 2 ind 3 ind 4 ind 1 ind 2 ind 3 ind 4 final demand total output ind 1 ind 2 ind 3 ind 4 < in each industry, it takes a certain number of people to create each dollar’s worth of total economic output >
  • 29.
    jobs are tiedto total output… ind 1 ind 2 ind 3 ind 4 ind 1 ind 2 ind 3 ind 4 final demand total output ind 1 ind 2 ind 3 ind 4 < if It takes .001 workers to create $1 of economic output, then,
  • 30.
    jobs are tiedto total output… ind 1 ind 2 ind 3 ind 4 ind 1 ind 2 ind 3 ind 4 final demand total output ind 1 ind 2 ind 3 ind 4 < if It takes .001 workers to create $1 of economic output, then, with $1 billion of total industrial output, 1 million workers are required >
  • 31.
    jobs are tiedto total output… ind 1 ind 2 ind 3 ind 4 ind 1 ind 2 ind 3 ind 4 final demand total output ind 1 ind 2 ind 3 ind 4 < changes in labor intensity or in the kind or amount of total economic output create changes in numbers and kinds of jobs >
  • 32.
    occupational employment is tiedto total industrial output… ind 1 ind 2 ind 3 ind 4 ind 1 ind 2 ind 3 ind 4 final demand total output ind 1 ind 2 ind 3 ind 4 < industries use different occupations > < industries use different labor intensities > < occupational employment differs by industry >
  • 33.
    occupational employment is createdwhen people use their unique human capital to create goods & services
  • 34.
    input-output tables are usedfor… • economic accounting • forecasting • “what if” simulation
  • 35.
    “what if” simulations <more formally — a counterfactual > an expression of a conditional proposition containing an “if”–clause which is contrary to fact < examples> What if tax policy changes? A natural disaster occurs? Innovation disrupts human morbidity and mortality? International trade is affected by regulation or currency changes? Or, if policies for immigration are altered?
  • 36.
    policy effect counterfactual method baseline of economy economy with counterfact= with no change; economy status quo with policy change; economy perturbed effect of counterfactual on status quo of economy
  • 37.
  • 38.
    wide range ofanalyses • California pollution standards in PA • table eggs • literacy • adolescent fertility • engineer shortages • technical skills deficits • educational reform • planning career & tech ed • gas severance tax • town planning • military base closing • occupational supply • highway construction • ski industry • energy workforce • motorsports track
  • 39.
    wide range ofanalyses • plastics jobs • general aviation • royalty income • tourism • electricity lines • long-term care • landfills • cosmetology jobs • bookkeeping / medical record jobs • manufacturing forecasts • vehicle emission testing • ethane cracking • elimination of electricity price caps • baseball strike • health care reform
  • 40.
    wide range ofanalyses • plastics jobs • general aviation • royalty income • tourism • electricity lines • long-term care • landfills • cosmetology jobs • bookkeeping / medical record jobs • manufacturing forecasts • vehicle emission testing • ethane cracking • elimination of electricity price caps • baseball strike • health care reform
  • 41.
    wide range ofanalyses over 100 “Economic & Workforce Brief” reports. reports about almost every county and major industry in Pennsylvania
  • 42.
    a detailed example… <health care reform > How National Health Care Spending Affects Pennsylvania Health Care Employment
  • 43.
    the health carereform debate in the 1990s… < health & medical technology had improved remarkably > < health care & service spending increased as share of GNP > < increasing numbers of people became uninsured > < strong, partisan, acrimonious debate over health care funding occurred > < numerous proposals offered for reform >
  • 44.
    aim… < examine sensitivityof Pennsylvania health care & service employment to alternative national spending patterns in health-related industries >
  • 45.
    approach… < create twocounterfactuals representing high and low national spending scenarios that we “pushed down” to Pennsylvania to capture effect of national policy change on state employment >
  • 46.
    sample of findings… MajorHealth Occupations Categories Low Spending Scenario High Spending Scenario Health Diagnosis -15.1% +32.2% Health Assessment & Treatment -14.2% +33.3% Health Technology -13.5% +31.7 Health Service -13,6% +31.6% % job differences from baseline
  • 47.
    sample of findings… Baseline Jobs Forecast LowSpending Scenario High Spending Scenario (1) 1990 (baseline year) 8,505 8,505 8,505 (2) 2005 baseline forecast 10,843 9,025 15,087 (3) = (2) – (1) 2,338 520 6,582 Difference between (3) for scenario and (3) for baseline — -1,818 4,244 in one occupation: dental hygienist jobs
  • 48.
    LINKING PRODUCTION, CONSUMPTION, EMPLOYMENT, & SKILLS Over25 Years of Economic & Demographic Policy Research at Penn State David L. Passmore