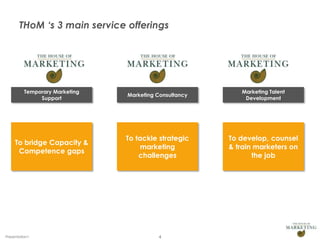
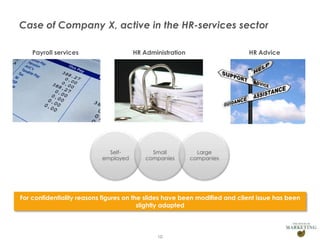
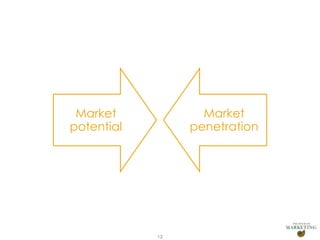
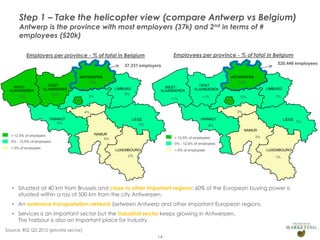
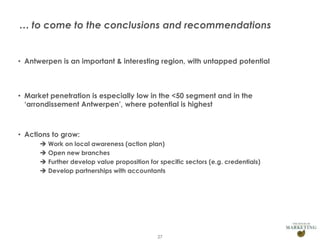
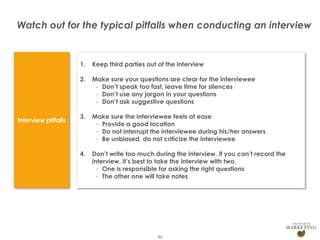
Market Research Projects
Solvay Consulting Club
19/10/2013
Agenda

• The House of Marketing
• Market Research Project
• Project Management
• Desk research
• Interviews

Presentation1

2
THoM offers marketing talent, adapted to the new business
context

In a economical environment where turbulence is the new norm,

The House of Marketing develops marketing talent and provides
marketing excellence at the right moment, exceeding clients'
expectations by delivering higher return on investment and by
making the organization more agile.
We achieve this by recruiting passionate marketers for whom we
create an inspiring and nurturing environment so that they can
develop their full potential.

Presentation1

3
THoM ‘s 3 main service offerings

Temporary Marketing
Support

Marketing Consultancy

Marketing Talent
Development

To bridge Capacity &
Competence gaps

To tackle strategic
marketing
challenges

To develop, counsel
& train marketers on
the job

Presentation1

4
We can help to bridge capacity & function gaps….

Product &
Brand
Managers

Business
Analysts

E-Marketers
& Social
Media
Specialists

Presentation1

Broad experience
Coordination activities of
specialists in
production, sales, advertising,
promotion, R&D, …
Churn analysis, churn
reduction
Product placement
optimization

Marketing
Managers

Market & competitor
analysis
Market assessment &
quantification
Clustering of customers

Channel &
Category
Managers

E-strategy definition & rollout
Coordination, design &
implementation of emarketing actions
Website
management, email
marketing, social
media, mobile

Process
Managers

5

B2B and B2C environments
Marketing plan, go-to-market
strategy &
implementation, people
management, business
intelligence
Coordination of Marketing
activities

Strong analytical and
negotiation skills
Enhancing retail partnerships
by increasing category sales
and aiding in fact
based/strategic selling

Extended experience in SME
and large matrix organizations
Alignment of organization
towards similar goals
Clear roles & responsibilities
definition, organizational
design
…and help you tackle strategic marketing challenges
Mostly project based

THoM expertise & solutions

Client challenges
Volume
driven

Margin
driven

Positioning

• Customer intelligence: translate data into
relevant insights
• Segmentation
• Business and marketing planning
• Innovation Management Program

• Attract new customers
• Increase customer spending
• Reduce customer churn
• Increase Innovation success rate

• Pricing exercise
• Category assessment
• Marketing performance management

• Restore customer trust
• Capture more customer value
• Margin management
• Doing more with less resources
• Tracking of ROI

(ROMI, CLTV, dashboards)

• Marketing audit

• Define or redefine positioning
• Changing customer experience from
product push to relational (customercentric)
• Positioning on the sustainability dimension
• Positioning towards current and potential
employees

• Positioning workshop, define brand
identity card
• Customer (store) experience
• Sustainability
• Employer branding

Consumer analytics and insights are crucial for each of the three challenges
Presentation1

6
Performance demands the right talent at the right
place, & ongoing training
The House of Marketing can help you to develop and keep the right talents in
your marketing department.
Marketing Talent Program
(see www.marketingtalent.be)

- One company or multi company
accelerated traineeship programs
- Training reinforced by coaching on the
job
- Relevant Marketing training, from general
to very specific & tailor made
- product management
- project management
- communication (online, offline)
- social media
- email marketing
-……

Training

Counseling

Presentation1

- Personal counseling focused on
marketing related skills and technical skills

7
FACTS – our vision of how marketing should evolve
Simplicity
Strategic consistency
Leadership continuity
Prioritize & making choices
Consistent brand across all channels
Seek leadership in specific category
Customer centricity
Focused team

•
•
•
•
•
•
•
•

• Detect trends & act
• Early warning systems & processes

Innovative company culture
Diversity of profiles
Idea generation process
Idea valuation
Porosity & open-mindedness

Agile & up to date organization
Built around customer engagement
Willingness to change
Flexibility & Speed

•
•
•
•

•
•
•
•
•

•
•
•
•

KPI’s & dashboards
Scenario analysis & ROMI
Connect with marketing intelligence
Analytical culture & skills

• People: yours & every stakeholder
• Planet: ACT on innovation, packaging, promotion...
• Profit: business-minded marketers

Presentation1

8
Agenda

• The House of Marketing
• Market Research Project
• Project Management
• Desk research
• Interviews

Presentation1

9
Case of Company X, active in the HR-services sector
Payroll services

HR Administration

Selfemployed

Small
companies

HR Advice

Large
companies

For confidentiality reasons figures on the slides have been modified and client issue has been
slightly adapted

Presentation1

10
Question

Previous studies indicated a low market penetration in Antwerp.
Should our company invest in the region of Antwerp?
How would you approach this question?

Presentation1

11
Market
potential

Presentation1

Market
penetration

12
Market
potential

Presentation1

Market
penetration

13
Step 1 – Take the helicopter view (compare Antwerp vs Belgium)
Antwerp is the province with most employers (37k) and 2nd in terms of #
employees (520k)

Employees per province - % of total in Belgium

Employers per province - % of total in Belgium

520.446 employees

37.331 employers
ANTWERPEN
WESTVLAANDEREN
13%

ANTWERPEN
19%

17%

OOST
VLAANDEREN
13%

WESTVLAANDEREN

LIMBURG
8%

8%

11%

13%

OOST
VLAANDEREN

LIMBURG
7%

10%

11%
20%

3%

4%
HAINAUT
9%

HAINAUT

LIEGE
9%

LIEGE

8%
NAMUR

> 12,5% of employers
5% - 12,5% of employers
< 5% of employers

NAMUR
4%

> 12,5% of employees

3%

5% - 12,5% of employees
LUXEMBOURG

< 5% of employees

2%

LUXEMBOURG

1%

• Situated at 40 km from Brussels and close to other important regions: 60% of the European buying power is
situated within a ray of 500 km from the city Antwerpen.
• An extensive transportation network between Antwerp and other important European regions.
• Services is an important sector but the industrial sector keeps growing in Antwerpen.
The harbour is also an important place for Industry.
Source: RSZ Q3 2010 (private sector)
Presentation1

14

7%
Step 2 – Zoom in

The ‘arrondissement Antwerpen’ represents 60% of companies and 62% of
employment in the province

Arrondissement Turnhout

Companies

Arrondissement Mechelen

22.237 employers
(60% of Antwerpen)

6.325 employers
(17% of Antwerpen)

8.769 employers
(23% of Antwerpen)

# heads

Arrondissement Antwerpen

319.829 heads
(62% of Antwerpen)
Average: 66 heads/customer

84.811 heads
(16% of Antwerpen)
Average: 40 heads/customer

115.806 heads
(22% of Antwerpen)
Average: 32 heads/customer

Source: RSZ Q3 2010 (private sector)
Presentation1

15
Step 3 – take a different angle

Employment in province Antwerpen is driven by Industry, Commerce, Admin
Services and the Health Sector
<50 in Antwerpen:
196k heads

50-200 in Antwerpen:
94k heads

>200 in Antwerpen:
230k heads

Top sectors within the <50 market
(in # heads)

Top sectors within the 50-200 market
(in # heads)

Top sectors within the >200 market
(in # heads)

80,000

80,000

80,000

70,000

70,000

70,000

60,000

60,000

60,000

50,000

50,000

50,000

40,000

To be compared with other regions
40,000

40,000

30,000

30,000

30,000

20,000

20,000

20,000

10,000

10,000

10,000

0

0

0

Top 6: 75% of employment

Top 6: 81% of employment

Source: RSZ Q3 2010 (private sector)
Presentation1

16

Top 6: 87% of employment
Step 4 – get to a level of detail that will be directly actionable
(e.g. as briefing to sales team)
Most important activities within the sector Industry are Chemicals & Food

Sector Industry in # heads
Segment < 50 in Antwerpen

Sector Industry in # heads
Segment >200 in Antwerpen

Sector Industry in # heads
Segment 50-200 in Antwerpen

18,000

18,000

18,000

16,000

16,000

16,000

14,000

14,000

14,000

12,000

12,000

12,000

10,000

10,000

10,000

8,000

8,000

8,000

6,000

6,000

6,000

4,000

4,000

4,000

2,000

2,000

2,000

0

0

0

Source: RSZ Q3 2010 (private sector)
Presentation1

17
Step 5 – Compare to competitor performance

Competitors are much more present and have a higher awareness ratio
Unaided awareness Study of Company X

Unaided awareness in
Antwerpen:
• competitor 1: 40%
• competitor 2: 29%
• company X: 11%

Awareness of
company x:
11%

Top of mind in
Antwerpen:
• competitor 1: 20%
• competitor 2: 17%
• Company X: 5%

Source: Awareness Barometer
Presentation1

18
Market
potential

Presentation1

Market
penetration

19
Step 1 – Evaluate situation for sub-segments of clients

With its 5.000 customers in Antwerpen, company X has a lower market
penetration compared to the national market penetration

Market penetration of Company X in Antwerpen
% market penetration
50%

40%

37%

Average: 32%

32%

30%
Average: 24%

20%

27%

22%

Average: 14,5%

13%
10%

10%
5%

6%

1-4

5-9

7%

0%

Presentation1

10-19

20-49

50-99

20

100-199

200-499

500-999

>999
Step 2- Evaluate situation for different type of products
Product C is the most important product in terms of invoicing

Invoicing value and number of customers per key product in Antwerpen (cross-segment)
4,000

3,500

3,000

2,500

2,000

1,500

1,000

500

0
Product C

Product A

Product D

Invoicing (M EUR)
Number of customers
Presentation1

21

Product B

Product E
Step 3 – take a detailed look at internal KPI

The ‘arrondissement Antwerpen’ only represents 20% of our customers in the
province Antwerpen

customers

Arrondissement ‘Turnhout’

(20% of customers Antwerpen)
5,4% penetration

(40% of customers Antwerpen)
5,8% penetration

(40% of customers Antwerpen)
8,4% penetration

# heads

Arrondissement ‘Mechelen’

Average: 70 heads/customer

Average: 60 heads/customer

Average: 40 heads/customer

Invoicing

Arrondissement ‘Antwerpen’

Average: 4.000 EUR/customer

Average: 4.800 EUR/customer

Average: 5.200 EUR/customer

Presentation1

22
Step 4 – investigate root causes

Customers indicated the importance of having a supplier close to their
business, which is a weakness for company X

Competitor 1
Competitor 2
Company X

Presentation1

23
Step 5- also think beyond your organization

Having a strong partner-network seems to be important to develop business in the
<50 segment

Company X: 55 partners

Company X: 34 partners

Company X: 43 partners

10% of top 100 partners

35% of top 100 partners

30% of top 100 partners

Current partner network in Antwerp is rather weak
compared to other regions

Presentation1

24
Last step – quantify market potential

Market Share (MS) and value of total market for
P1, P2 and P3 within the < 50 segment

Average market share on national level

% market share

A market share increase from 4%
to 11% generates + 4,5 M EUR

+ 1% MS SSS generates + 1,1 M €

P2:
3,6%

P1 : 4% MS

P1

Presentation1

A market share increase from 4,2%
to 9,8% generates + 1,2 M €

P2

25

P3:
4,2% MS

P3

Invoicing total
market (100% MS)
Gathering information via different channels…

Desk
research

Presentation1

Analyze
figures

Internal
interviews

26

External
interviews
… to come to the conclusions and recommendations

• Antwerpen is an important & interesting region, with untapped potential

• Market penetration is especially low in the <50 segment and in the
‘arrondissement Antwerpen’, where potential is highest

• Actions to grow:
 Work on local awareness (action plan)
 Open new branches
 Further develop value proposition for specific sectors (e.g. credentials)
 Develop partnerships with accountants

Presentation1

27
Agenda

• The House of Marketing
• Market Research Project
• Project Management
• Desk research
• Interviews

Presentation1

28
Quiz: What’s the difference between these 2 buildings?
Bilbao Guggenheim

Presentation1

Sydney Opera House

29
Quiz: What’s the difference between these 2 buildings?

Bilbao
Guggenheim

Sydney
Opera House

• Architectural Masterpiece
• More than 1 million visitors per year
• Estimated Construction Time of 4 years
• Construction cost of +/- € 80 million
Completed in 1997…
on time

Completed in 1973…
with 10 years delay

Cost € 84 million…
on budget

Presentation1

Cost € 77 million…
initial budget € 5 million

30
There are numerous reasons why projects usually fail…

People are not
working toward the
same goals and
specifications

The scope of the
project keeps
changing

Team members lack
the right skills or
expertise for the
project

Cost/Budget
overruns

Work is redone or
duplicated and will
impact project cycle
time

Presentation1

Team is sitting on
different
locations, no
connections, etc…

31
Project Management aims
at systematically reducing
risks of failure

Project Management
is the application of
knowledge, skills, tools and
techniques to project activities to
meet project requirements.

Presentation1

32
Step 1: Initiate

Project Management starts with defining the project and setting
up the right scope and objectives
1. Define the mission: why do we need to do the project?
2. Define the scope: what’s included and what’s not?
3. Set up objectives: what objectives do we aim to reach? (SMART*)
4. Align clear roles & responsibilities
5. Identify the end-deliverables

* SMART: Specific, Measurable, Actionable, Realistic and Time
Presentation1

33
Example of project objectives
What to
achieve

Target value of the
indicator

Indicators

Statement

Measures

Performance Targets

Create a revised
report that
summarizes monthly
sales activity

Content

Report must include the following
data for each product line:
•Total number of items sold
•Total sales revenue
•Total returns

Schedule

Report must be operational by August
31

Budget

Development expenditures are not to
exceed $40,000

Approvals

New report format must be
approved by
•Vice president of sales
•Regional sales manager
•District sales manager
•Sales representatives

Presentation1

34
Step 2 - Project plan

Divide project in streams or phases by listing activities
(incl. sequence, duration, dependencies, resources)
XX
Key activities

XX

Confidence
Clarity
Communication
Consistency
Control
Credibility

XX

Phase 1
desk research
interviews
Plan your interviews on time!
Phase 2
Testing
Phase 3
Training
Feedback sessions

Key meetings

Today
Presentation1

Status
meeting

Status
meeting
35

Validation
meeting
Brainstorming on project deliverables is done
by answering 6 questions chronologically
• What topics do you think you need to address in order to answer the question?
(Use structured thinking to be logical and exhaustive)
• Why do you need this topic? How relevant is it?
• What can’t you deliberately do? (Constraints, scope definition) And which
parameters/drivers can you address?

• What are the problems you expect to occur (for every topic) and how can you
address them?
• Define the deliverable(s) for each topic
• Having listed the topics, what is the immediate logical route of topics to follow?

Now you can list your ideas: Topic, Deliverable, Special remark(s)

Presentation1

36
Step 3 – Execute/ control

Important to have regular meetings with your team

Holding regular progress meetings with your team will enable you to:

• Have better communication – by keeping all the needed people involved
• Risk control - more people = better overall view
• Better overview - better status of where you are
• Do progress reporting to management (& stakeholders)

Presentation1

37
Step 4 – Project closing
An important process (and phase) of your project!

The end is near,
but you’re not there yet…

You should have laid the foundations of closure at the start:

• Clear goal and objectives
• People’s commitment to the end
• Project closure activities foreseen in the project plan
• Foresee a formalized but fun end ‘event’ so that people can
disconnect

Presentation1

38
Agenda

• The House of Marketing
• Market Research Project
• Project Management
• Desk research
• Interviews

Presentation1

39
Question

Consumer trends 2020-2025 for a major automotive company
How will youth evolve in Russia? What is the likely impact on
motoring?
How would you approach this?

Presentation1

40
Main challenges

1
2
3
Presentation1

Don’t get lost in the mass of information

Reconcile inconsistent data sources

From gut feeling to a real trend (or to the bin)

41
Tip & tricks for desk research

Where to
start ?

Start by defining what you want to know. Keep a broad view of
the information you are looking for.

Gather data

Online sources, Government departments, libraries, public
sources, business specific information, magazines &
publications, etc.

Analyse info

Check the quality of your source (e.g. governmental vs
commercial), try to find at least 3 different sources to ensure
they broadly agree and check how data was collected

Define
storyline

Presentation1

Always keep in mind what you are looking for and the question
you are trying to answer

42
Agenda

• The House of Marketing
• Market Research Project
• Project Management
• Desk research
• Interviews

Presentation1

43
A good interview, starts with good preparation

What

Who

• Internal interviews vs. external interviews
• Why do you want to interview him /her?
• Do some background research: what is his / her expertise?

How

Presentation1

• What do you want to find out during the interview?
• What do you want to learn?

•
•
•
•

Where will you take the interview?
Which questions will you ask?
Prepare all your questions before the interview
The duration of the interview can maximum take 1,5h

44
Put your questionnaire in a logical structure

1. Start with short introduction that explains the purpose of the interview

2. Begin with more open, general questions to bring the interviewee at ease

3. Ask specific or critical questions in the end
(but don’t avoid them!)

4. End the interview by thanking the interviewee, ask if he/she has more questions

5. Leave your contact details, so he/she can contact you

A good interviewer brings his/her interviewee at ease (also non-verbal behavior) and keeps
the overhand of the interview (follow your structure of questions)

Presentation1

45
Watch out for the typical pitfalls when conducting an interview

1.
2.

Presentation1

Make sure your questions are clear for the interviewee
- Don’t speak too fast, leave time for silences
- Don’t use any jargon in your questions
- Don’t ask suggestive questions

3.

Make sure the interviewee feels at ease
- Provide a good location
- Do not interrupt the interviewee during his/her answers
- Be unbiased, do not criticize the interviewee

4.

Interview pitfalls

Keep third parties out of the interview

Don’t write too much during the interview. If you can’t record the
interview, it’s best to take the interview with two.
- One is responsible for asking the right questions
- The other one will take notes

46
Market Research Projects
Solvay Consulting Club
09/03/2013

Solvay workshop market research 20131019

  • 1.
    Market Research Projects SolvayConsulting Club 19/10/2013
  • 2.
    Agenda • The Houseof Marketing • Market Research Project • Project Management • Desk research • Interviews Presentation1 2
  • 3.
    THoM offers marketingtalent, adapted to the new business context In a economical environment where turbulence is the new norm, The House of Marketing develops marketing talent and provides marketing excellence at the right moment, exceeding clients' expectations by delivering higher return on investment and by making the organization more agile. We achieve this by recruiting passionate marketers for whom we create an inspiring and nurturing environment so that they can develop their full potential. Presentation1 3
  • 4.
    THoM ‘s 3main service offerings Temporary Marketing Support Marketing Consultancy Marketing Talent Development To bridge Capacity & Competence gaps To tackle strategic marketing challenges To develop, counsel & train marketers on the job Presentation1 4
  • 5.
    We can helpto bridge capacity & function gaps…. Product & Brand Managers Business Analysts E-Marketers & Social Media Specialists Presentation1 Broad experience Coordination activities of specialists in production, sales, advertising, promotion, R&D, … Churn analysis, churn reduction Product placement optimization Marketing Managers Market & competitor analysis Market assessment & quantification Clustering of customers Channel & Category Managers E-strategy definition & rollout Coordination, design & implementation of emarketing actions Website management, email marketing, social media, mobile Process Managers 5 B2B and B2C environments Marketing plan, go-to-market strategy & implementation, people management, business intelligence Coordination of Marketing activities Strong analytical and negotiation skills Enhancing retail partnerships by increasing category sales and aiding in fact based/strategic selling Extended experience in SME and large matrix organizations Alignment of organization towards similar goals Clear roles & responsibilities definition, organizational design
  • 6.
    …and help youtackle strategic marketing challenges Mostly project based THoM expertise & solutions Client challenges Volume driven Margin driven Positioning • Customer intelligence: translate data into relevant insights • Segmentation • Business and marketing planning • Innovation Management Program • Attract new customers • Increase customer spending • Reduce customer churn • Increase Innovation success rate • Pricing exercise • Category assessment • Marketing performance management • Restore customer trust • Capture more customer value • Margin management • Doing more with less resources • Tracking of ROI (ROMI, CLTV, dashboards) • Marketing audit • Define or redefine positioning • Changing customer experience from product push to relational (customercentric) • Positioning on the sustainability dimension • Positioning towards current and potential employees • Positioning workshop, define brand identity card • Customer (store) experience • Sustainability • Employer branding Consumer analytics and insights are crucial for each of the three challenges Presentation1 6
  • 7.
    Performance demands theright talent at the right place, & ongoing training The House of Marketing can help you to develop and keep the right talents in your marketing department. Marketing Talent Program (see www.marketingtalent.be) - One company or multi company accelerated traineeship programs - Training reinforced by coaching on the job - Relevant Marketing training, from general to very specific & tailor made - product management - project management - communication (online, offline) - social media - email marketing -…… Training Counseling Presentation1 - Personal counseling focused on marketing related skills and technical skills 7
  • 8.
    FACTS – ourvision of how marketing should evolve Simplicity Strategic consistency Leadership continuity Prioritize & making choices Consistent brand across all channels Seek leadership in specific category Customer centricity Focused team • • • • • • • • • Detect trends & act • Early warning systems & processes Innovative company culture Diversity of profiles Idea generation process Idea valuation Porosity & open-mindedness Agile & up to date organization Built around customer engagement Willingness to change Flexibility & Speed • • • • • • • • • • • • • KPI’s & dashboards Scenario analysis & ROMI Connect with marketing intelligence Analytical culture & skills • People: yours & every stakeholder • Planet: ACT on innovation, packaging, promotion... • Profit: business-minded marketers Presentation1 8
  • 9.
    Agenda • The Houseof Marketing • Market Research Project • Project Management • Desk research • Interviews Presentation1 9
  • 10.
    Case of CompanyX, active in the HR-services sector Payroll services HR Administration Selfemployed Small companies HR Advice Large companies For confidentiality reasons figures on the slides have been modified and client issue has been slightly adapted Presentation1 10
  • 11.
    Question Previous studies indicateda low market penetration in Antwerp. Should our company invest in the region of Antwerp? How would you approach this question? Presentation1 11
  • 12.
  • 13.
  • 14.
    Step 1 –Take the helicopter view (compare Antwerp vs Belgium) Antwerp is the province with most employers (37k) and 2nd in terms of # employees (520k) Employees per province - % of total in Belgium Employers per province - % of total in Belgium 520.446 employees 37.331 employers ANTWERPEN WESTVLAANDEREN 13% ANTWERPEN 19% 17% OOST VLAANDEREN 13% WESTVLAANDEREN LIMBURG 8% 8% 11% 13% OOST VLAANDEREN LIMBURG 7% 10% 11% 20% 3% 4% HAINAUT 9% HAINAUT LIEGE 9% LIEGE 8% NAMUR > 12,5% of employers 5% - 12,5% of employers < 5% of employers NAMUR 4% > 12,5% of employees 3% 5% - 12,5% of employees LUXEMBOURG < 5% of employees 2% LUXEMBOURG 1% • Situated at 40 km from Brussels and close to other important regions: 60% of the European buying power is situated within a ray of 500 km from the city Antwerpen. • An extensive transportation network between Antwerp and other important European regions. • Services is an important sector but the industrial sector keeps growing in Antwerpen. The harbour is also an important place for Industry. Source: RSZ Q3 2010 (private sector) Presentation1 14 7%
  • 15.
    Step 2 –Zoom in The ‘arrondissement Antwerpen’ represents 60% of companies and 62% of employment in the province Arrondissement Turnhout Companies Arrondissement Mechelen 22.237 employers (60% of Antwerpen) 6.325 employers (17% of Antwerpen) 8.769 employers (23% of Antwerpen) # heads Arrondissement Antwerpen 319.829 heads (62% of Antwerpen) Average: 66 heads/customer 84.811 heads (16% of Antwerpen) Average: 40 heads/customer 115.806 heads (22% of Antwerpen) Average: 32 heads/customer Source: RSZ Q3 2010 (private sector) Presentation1 15
  • 16.
    Step 3 –take a different angle Employment in province Antwerpen is driven by Industry, Commerce, Admin Services and the Health Sector <50 in Antwerpen: 196k heads 50-200 in Antwerpen: 94k heads >200 in Antwerpen: 230k heads Top sectors within the <50 market (in # heads) Top sectors within the 50-200 market (in # heads) Top sectors within the >200 market (in # heads) 80,000 80,000 80,000 70,000 70,000 70,000 60,000 60,000 60,000 50,000 50,000 50,000 40,000 To be compared with other regions 40,000 40,000 30,000 30,000 30,000 20,000 20,000 20,000 10,000 10,000 10,000 0 0 0 Top 6: 75% of employment Top 6: 81% of employment Source: RSZ Q3 2010 (private sector) Presentation1 16 Top 6: 87% of employment
  • 17.
    Step 4 –get to a level of detail that will be directly actionable (e.g. as briefing to sales team) Most important activities within the sector Industry are Chemicals & Food Sector Industry in # heads Segment < 50 in Antwerpen Sector Industry in # heads Segment >200 in Antwerpen Sector Industry in # heads Segment 50-200 in Antwerpen 18,000 18,000 18,000 16,000 16,000 16,000 14,000 14,000 14,000 12,000 12,000 12,000 10,000 10,000 10,000 8,000 8,000 8,000 6,000 6,000 6,000 4,000 4,000 4,000 2,000 2,000 2,000 0 0 0 Source: RSZ Q3 2010 (private sector) Presentation1 17
  • 18.
    Step 5 –Compare to competitor performance Competitors are much more present and have a higher awareness ratio Unaided awareness Study of Company X Unaided awareness in Antwerpen: • competitor 1: 40% • competitor 2: 29% • company X: 11% Awareness of company x: 11% Top of mind in Antwerpen: • competitor 1: 20% • competitor 2: 17% • Company X: 5% Source: Awareness Barometer Presentation1 18
  • 19.
  • 20.
    Step 1 –Evaluate situation for sub-segments of clients With its 5.000 customers in Antwerpen, company X has a lower market penetration compared to the national market penetration Market penetration of Company X in Antwerpen % market penetration 50% 40% 37% Average: 32% 32% 30% Average: 24% 20% 27% 22% Average: 14,5% 13% 10% 10% 5% 6% 1-4 5-9 7% 0% Presentation1 10-19 20-49 50-99 20 100-199 200-499 500-999 >999
  • 21.
    Step 2- Evaluatesituation for different type of products Product C is the most important product in terms of invoicing Invoicing value and number of customers per key product in Antwerpen (cross-segment) 4,000 3,500 3,000 2,500 2,000 1,500 1,000 500 0 Product C Product A Product D Invoicing (M EUR) Number of customers Presentation1 21 Product B Product E
  • 22.
    Step 3 –take a detailed look at internal KPI The ‘arrondissement Antwerpen’ only represents 20% of our customers in the province Antwerpen customers Arrondissement ‘Turnhout’ (20% of customers Antwerpen) 5,4% penetration (40% of customers Antwerpen) 5,8% penetration (40% of customers Antwerpen) 8,4% penetration # heads Arrondissement ‘Mechelen’ Average: 70 heads/customer Average: 60 heads/customer Average: 40 heads/customer Invoicing Arrondissement ‘Antwerpen’ Average: 4.000 EUR/customer Average: 4.800 EUR/customer Average: 5.200 EUR/customer Presentation1 22
  • 23.
    Step 4 –investigate root causes Customers indicated the importance of having a supplier close to their business, which is a weakness for company X Competitor 1 Competitor 2 Company X Presentation1 23
  • 24.
    Step 5- alsothink beyond your organization Having a strong partner-network seems to be important to develop business in the <50 segment Company X: 55 partners Company X: 34 partners Company X: 43 partners 10% of top 100 partners 35% of top 100 partners 30% of top 100 partners Current partner network in Antwerp is rather weak compared to other regions Presentation1 24
  • 25.
    Last step –quantify market potential Market Share (MS) and value of total market for P1, P2 and P3 within the < 50 segment Average market share on national level % market share A market share increase from 4% to 11% generates + 4,5 M EUR + 1% MS SSS generates + 1,1 M € P2: 3,6% P1 : 4% MS P1 Presentation1 A market share increase from 4,2% to 9,8% generates + 1,2 M € P2 25 P3: 4,2% MS P3 Invoicing total market (100% MS)
  • 26.
    Gathering information viadifferent channels… Desk research Presentation1 Analyze figures Internal interviews 26 External interviews
  • 27.
    … to cometo the conclusions and recommendations • Antwerpen is an important & interesting region, with untapped potential • Market penetration is especially low in the <50 segment and in the ‘arrondissement Antwerpen’, where potential is highest • Actions to grow:  Work on local awareness (action plan)  Open new branches  Further develop value proposition for specific sectors (e.g. credentials)  Develop partnerships with accountants Presentation1 27
  • 28.
    Agenda • The Houseof Marketing • Market Research Project • Project Management • Desk research • Interviews Presentation1 28
  • 29.
    Quiz: What’s thedifference between these 2 buildings? Bilbao Guggenheim Presentation1 Sydney Opera House 29
  • 30.
    Quiz: What’s thedifference between these 2 buildings? Bilbao Guggenheim Sydney Opera House • Architectural Masterpiece • More than 1 million visitors per year • Estimated Construction Time of 4 years • Construction cost of +/- € 80 million Completed in 1997… on time Completed in 1973… with 10 years delay Cost € 84 million… on budget Presentation1 Cost € 77 million… initial budget € 5 million 30
  • 31.
    There are numerousreasons why projects usually fail… People are not working toward the same goals and specifications The scope of the project keeps changing Team members lack the right skills or expertise for the project Cost/Budget overruns Work is redone or duplicated and will impact project cycle time Presentation1 Team is sitting on different locations, no connections, etc… 31
  • 32.
    Project Management aims atsystematically reducing risks of failure Project Management is the application of knowledge, skills, tools and techniques to project activities to meet project requirements. Presentation1 32
  • 33.
    Step 1: Initiate ProjectManagement starts with defining the project and setting up the right scope and objectives 1. Define the mission: why do we need to do the project? 2. Define the scope: what’s included and what’s not? 3. Set up objectives: what objectives do we aim to reach? (SMART*) 4. Align clear roles & responsibilities 5. Identify the end-deliverables * SMART: Specific, Measurable, Actionable, Realistic and Time Presentation1 33
  • 34.
    Example of projectobjectives What to achieve Target value of the indicator Indicators Statement Measures Performance Targets Create a revised report that summarizes monthly sales activity Content Report must include the following data for each product line: •Total number of items sold •Total sales revenue •Total returns Schedule Report must be operational by August 31 Budget Development expenditures are not to exceed $40,000 Approvals New report format must be approved by •Vice president of sales •Regional sales manager •District sales manager •Sales representatives Presentation1 34
  • 35.
    Step 2 -Project plan Divide project in streams or phases by listing activities (incl. sequence, duration, dependencies, resources) XX Key activities XX Confidence Clarity Communication Consistency Control Credibility XX Phase 1 desk research interviews Plan your interviews on time! Phase 2 Testing Phase 3 Training Feedback sessions Key meetings Today Presentation1 Status meeting Status meeting 35 Validation meeting
  • 36.
    Brainstorming on projectdeliverables is done by answering 6 questions chronologically • What topics do you think you need to address in order to answer the question? (Use structured thinking to be logical and exhaustive) • Why do you need this topic? How relevant is it? • What can’t you deliberately do? (Constraints, scope definition) And which parameters/drivers can you address? • What are the problems you expect to occur (for every topic) and how can you address them? • Define the deliverable(s) for each topic • Having listed the topics, what is the immediate logical route of topics to follow? Now you can list your ideas: Topic, Deliverable, Special remark(s) Presentation1 36
  • 37.
    Step 3 –Execute/ control Important to have regular meetings with your team Holding regular progress meetings with your team will enable you to: • Have better communication – by keeping all the needed people involved • Risk control - more people = better overall view • Better overview - better status of where you are • Do progress reporting to management (& stakeholders) Presentation1 37
  • 38.
    Step 4 –Project closing An important process (and phase) of your project! The end is near, but you’re not there yet… You should have laid the foundations of closure at the start: • Clear goal and objectives • People’s commitment to the end • Project closure activities foreseen in the project plan • Foresee a formalized but fun end ‘event’ so that people can disconnect Presentation1 38
  • 39.
    Agenda • The Houseof Marketing • Market Research Project • Project Management • Desk research • Interviews Presentation1 39
  • 40.
    Question Consumer trends 2020-2025for a major automotive company How will youth evolve in Russia? What is the likely impact on motoring? How would you approach this? Presentation1 40
  • 41.
    Main challenges 1 2 3 Presentation1 Don’t getlost in the mass of information Reconcile inconsistent data sources From gut feeling to a real trend (or to the bin) 41
  • 42.
    Tip & tricksfor desk research Where to start ? Start by defining what you want to know. Keep a broad view of the information you are looking for. Gather data Online sources, Government departments, libraries, public sources, business specific information, magazines & publications, etc. Analyse info Check the quality of your source (e.g. governmental vs commercial), try to find at least 3 different sources to ensure they broadly agree and check how data was collected Define storyline Presentation1 Always keep in mind what you are looking for and the question you are trying to answer 42
  • 43.
    Agenda • The Houseof Marketing • Market Research Project • Project Management • Desk research • Interviews Presentation1 43
  • 44.
    A good interview,starts with good preparation What Who • Internal interviews vs. external interviews • Why do you want to interview him /her? • Do some background research: what is his / her expertise? How Presentation1 • What do you want to find out during the interview? • What do you want to learn? • • • • Where will you take the interview? Which questions will you ask? Prepare all your questions before the interview The duration of the interview can maximum take 1,5h 44
  • 45.
    Put your questionnairein a logical structure 1. Start with short introduction that explains the purpose of the interview 2. Begin with more open, general questions to bring the interviewee at ease 3. Ask specific or critical questions in the end (but don’t avoid them!) 4. End the interview by thanking the interviewee, ask if he/she has more questions 5. Leave your contact details, so he/she can contact you A good interviewer brings his/her interviewee at ease (also non-verbal behavior) and keeps the overhand of the interview (follow your structure of questions) Presentation1 45
  • 46.
    Watch out forthe typical pitfalls when conducting an interview 1. 2. Presentation1 Make sure your questions are clear for the interviewee - Don’t speak too fast, leave time for silences - Don’t use any jargon in your questions - Don’t ask suggestive questions 3. Make sure the interviewee feels at ease - Provide a good location - Do not interrupt the interviewee during his/her answers - Be unbiased, do not criticize the interviewee 4. Interview pitfalls Keep third parties out of the interview Don’t write too much during the interview. If you can’t record the interview, it’s best to take the interview with two. - One is responsible for asking the right questions - The other one will take notes 46
  • 47.
    Market Research Projects SolvayConsulting Club 09/03/2013

Editor's Notes

  • #15 Investigate macro trends
  • #16 Not only look at static data, also look for evolution (growth)
  • #36 Tom’s planner