The document identifies key areas to improve performance, including manpower shortage, stock replenishment, and customer service. It notes that manpower is directly proportional to completing projects and achieving targets. It recommends hiring additional staff to fulfill a 35% resource gap. It also recommends increasing stock levels by 15% to meet winter demand and achieve 110% of targets. Finally, it emphasizes the importance of customer experience across multiple touchpoints and focusing on metrics like sales per hour and average sale size to improve customer service and reach performance goals.
Finance departments will no doubt change the way they measure their business when shifting from the old world of chasing after each and every dollar to this new world of monetizing relationships. Get the low down on the 3 most important Subscription Metrics for your business.
Practical finance applications for HR Eng - TMS Consultingtmsphilipchow
I wasnt sure the CFO and HR Director are best friends in the first place. But lately they probably dont have much of a choice. Sky rocketing wages in China (and in many parts of Asia) means that what were two "seperate silo"s just have to work much more closely together. So they became close tennis buddies...but figured they dont even speak the same language. Attached the latest HKIHRM seminar on corp fin conducted for HR professionals. Also reran in Chinese for Shanghai University MBA Students. This is released as part of a series hosted by my partner Steve Chow
The Finance Perspective: The Business Model for the Subscription EconomyZuora, Inc.
Learn best practices for subscription financial management, with a focus on the ‘Three Metrics That Matter’, the new income statement for the Subscription Economy and how to apply it to your business. Learn best practices for subscription financial management, with a focus on the ‘Three Metrics That Matter’, the new income statement for the Subscription Economy and how to apply it to your business.
This presentation was given to the ecommerce team to update them on what (and why) we were proceeding with the Virtual Marketplaces Project, including partnering with Channel Advisor. -- Rick Wingender
Segmentation & Customer Lifetime Value AnalysisYunqi Zhang
• Conducted customer segmentation based on 5 datasets of a real online grocery store with millions data magnitude., incl. purchase frequency, total spending, and customer channel preference
• Conducted Lifetime Value analysis to select the most valuable segments based on profit contribution
• Forecasted the next purchase rate and amount using frequency model to design recommendations to increase revenue
• Designed customer loyalty programs to increase LTV by 17.5% and visualized the results
Customer Lifetime Value: The Core Metric in MarketingAdknowledge
How to use data and lifetime value to maximize the ROI on your marketing spend.
Out of all the metrics that we monitor in our business, there is one that captures the heart, soul, and ROI of our efforts: lifetime value (LTV) of our customers. The measurements of digital marketing have evolved dramatically over the years from CPM to CPC, CPA, CPI, and more. The next phase, and perhaps the most important, is calculating LTV. Few are taking the leap to position this metric as the core KPI of their marketing teams’ success. But the reality is, the moment your competitor starts to figure out LTV and you can’t, you’re dead.
In this session, Ben outlines best practices for developing the strategy necessary to undertake calculating lifetime value to better understand your customers and the essential analytics you need so you can boost your ROI.
Our 2020 Survey on Sales Compensation in Israeli SaaS Companies revealed valuable insights about both the matureness of the Israeli industry in the past two years as well as the the effects of COVID-19. We encourage the industry to use this survey as a sanity check tool for CEOs, CROs and CFOs to see where they stand vis-à-vis their peers.
Everything You Need to Know About Customer Lifetime Value (CLV)Demac Media
Customer Lifetime Value (CLV) has become a must know term for eCommerce merchants of any size. It allows you to discover the true value each customer has to your store. But what most people don't know are the different ways to calculate it and the true impact it has on your business.
In this discussion we cover everything you need to know about customer lifetime value. We present a few ways to calculate it as well as show some cases where CLV can impact a business. These cases will show what happens when you ignore lifetime value, and the benefits of making decisions with CLV in mind.
Subscribed 2017: What Are The 9 Keys & Why Are They Important?Zuora, Inc.
Zuora developed the 9 Keys to be used as a blueprint for building a subscription-based business. Join this session to learn about the foundational framework upon which a successful subscription business can scale. After this session, you’ll be equipped not only to get the most of your Zuora implementation, but also to optimize and continue to grow your business post go-live.
Customer Success Summit Keynote
Presented by: Thomas Lah, Executive Director, TSIA
Customer success has become one of the hottest capabilities technology companies find themselves investing in today. For technology-as-a-service providers, customer success potentially holds the key to retaining customers and expanding customer relationships. However, TSIA has been inundated with inquiries from member companies that are struggling to deliver customer success at scale.
In this closing keynote, TSIA executive director Thomas Lah will leverage recent benchmark data and industry observations to outline a seven-step approach to establishing and scaling a customer success capability. From the charter to the financial model to enabling technology, Thomas will provide practical frameworks customer success organizations can leverage as they grow.
Understanding the Financial Health of your Subscription BusinessTotango
Industry leaders, Zuora and Totango, present which metrics truly give an accurate picture of the health of your subscription business. Which metrics should you calculate and optimize on - ARR, GEI, CRC or other ratios?
Chief Financial Officer, Tyler Sloat from Zuora shares 3 metrics they measure for their company and track against other best-in-class subscription companies. Chief Marketing Officer, Kaiser Mulla-Feroze from Totango, also presents a couple key metrics he finds missing from the boardroom discussions.
Visit totango.com to view the entire webinar and hear their insightful commentary that accompanies these slides and Q&A.
This complete presentation has PPT slides on wide range of topics highlighting the core areas of your business needs. It has professionally designed templates with relevant visuals and subject driven content. This presentation deck has total of fourty five slides. Get access to the customizable templates. Our designers have created editable templates for your convenience. You can edit the colour, text and font size as per your need. You can add or delete the content if required. You are just a click to away to have this ready-made presentation. Click the download button now. https://bit.ly/3goZGY8
360 Degree View Of Customer Powerpoint Presentation SlidesSlideTeam
Increase consumer satisfaction and drive sales using these 360 Degree View Of Customer PowerPoint Presentation Slides. Take the assistance of our attention-grabbing customer mapping PowerPoint slideshow to drive ROI through various means like acquiring leads, increasing customer retention, etc. By utilizing these customer relationships PowerPoint templates you can elucidate the process of customer architecture that consists of consumer clustering, CRM analysis, real-time analytics, etc. Take advantage of these consumer lifecycle PPT visuals to reveal the components of 360 frameworks like CRM systems, DBMS, support ticketing, etc. Unveil the constituents of the customer lifecycle such as data visualization, data streaming, data integration, data science, etc. using our content-ready consumer engagement PowerPoint slide deck. Adopt a holistic customer view and interact with them through face-to-face communication, email, phone amongst others. Hence, without any further delay download this customer support PPT slide designs to engage effectively with your current as well as prospective clients. https://bit.ly/2OixhJT
Measuring the Performance of Your Subscription Business: The Three Metrics Th...Zuora, Inc.
How do you measure the true value of a subscription business? A traditional GAAP financial analysis can’t measure the health of a subscription business because it doesn’t recognize the value of subscription revenue. Learn about how subscription businesses need to measure their performance and the three metrics that really matter.
Taking the Guesswork out of Pipelines and ForecastsThe Naro Group
A healthy pipeline has velocity, with sales deals always moving. They are either continuously moving down the funnel towards a predictable closing date, or if an opportunity has lost momentum, it's qualified out of the sales pipeline altogether. This kind of pipeline has self-validating principles at each step in the sales process, with specific measures that help you understand not only where the real opportunities are, but also how your sales people are performing and what deals you can truly expect to close.
Enhance your audiences knowledge with this well researched complete deck. Showcase all the important features of the deck with perfect visuals. This deck comprises of total of forty four slides with each slide explained in detail. Each template comprises of professional diagrams and layouts. Our professional PowerPoint experts have also included icons, graphs and charts for your convenience. All you have to do is DOWNLOAD the deck. Make changes as per the requirement. Yes, these PPT slides are completely customizable. Edit the colour, text and font size. Add or delete the content from the slide. And leave your audience awestruck with the professionally designed Synergy Assessment Powerpoint Presentation Slides complete deck. https://bit.ly/3fqCpqv
CRM: A Business Imperative for Companies during the Global Economic DownturnNavik Numsiang
CRM: A Business Imperative for Companies during the Global Economic Downturn
Companies that invest wisely in information technology will reap the rewards
Implementing CRM will enable you to:
Increase revenue-generating activities
Achieve significant cost-savings and on-going productivity improvements
Deliver exceptional and personalised service
With this study, we distill and prescribe characteristics, practices and best-in-class methods associated with "fast growers,“ which we define as companies with GAAP revenue growth rates of 30% or higher. As discovered in previous years and validated again this year, the central driving force for fast growers is the appropriate, aligned go-to-market model executed with excellence and coupled with financial discipline and investment.
Use this report to compare your business to like companies in the Edison portfolio, as well as industry guidance. These benchmarks and advice will enable you to map your own plan and journey to becoming a fast grower, or accelerate even faster to a $100M company.
Venture Capital PowerPoint Presentation SlidesSlideTeam
Presenting this set of slides with name - Venture Capital PowerPoint Presentation Slides. This is a one stage process. The stages in this process are Investment, Venture Capital, Funding, Private Equity.
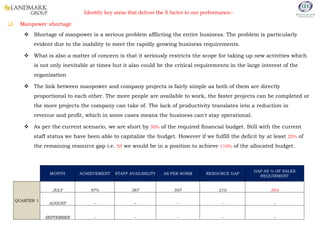
1. Identify key areas that deliver the X factor to our performance:-
Manpower shortage
Shortage of manpower is a serious problem afflicting the entire business. The problem is particularly
evident due to the inability to meet the rapidly growing business requirements.
What is also a matter of concern is that it seriously restricts the scope for taking up new activities which
is not only inevitable at times but it also could be the critical requirements in the large interest of the
organization
The link between manpower and company projects is fairly simple as both of them are directly
proportional to each other. The more people are available to work, the faster projects can be completed or
the more projects the company can take of. The lack of productivity translates into a reduction in
revenue and profit, which in some cases means the business can't stay operational.
As per the current scenario, we are short by 35% of the required financial budget. Still with the current
staff status we have been able to capitalize the budget. However if we fulfill the deficit by at least 25% of
the remaining resource gap i.e. 53 we would be in a position to achieve 110% of the allocated budget.
MONTH ACHIEVEMENT STAFF AVAILIBILITY AS PER NORM RESOURCE GAP
GAP AS % OF SALES
REQUIRMENT
QUARTER 1
JULY 97% 387 597 210 35%
AUGUST - - - - -
SEPTEMBER - - - - -
2. STORES
GRAD
E
AREA (SQ
FT)
AVAILABL
E STAFFS
OPTIMUM
REQUIRM
NETS AS
PER AREA
RESOURC
ES GAP
GAP AS %
OF AREA
REQUIRMEN
T
JULY
BUDGET
YEARLY
BUDGET
SALES
PER DAY
OPTIMUM
REQUIRMN
ETS AS PER
SALES
RESOURC
ES GAP
GAP AS %
OF SALES
REQUIRMEN
T
CP -
Takasusi A+ 21,447 15 29 14 48% 100% 27,821,601 77,068 26 11 42%
CP -
Alqassim A+ 10,770 10 14 4 30% 94% 15,230,091 42,189 14 4 29%
CP - King
Abdulla St A+ 20,251 22 27 5 19% 91% 54,256,026 150,294 50 28 56%
CP - Tabuk
A+ 12,722 12 17 5 29% 93% 20,886,951 57,859 19 7 38%
CP - Abha
A+ 17,221 15 23 8 35% 86% 25,708,954 71,216 24 9 37%
CP - Hail
A+ 12,313 11 16 5 33% 95% 17,958,527 49,747 17 6 34%
CP - Exit 9
A+ 19,865 22 26 4 17% 95% 59,714,293 165,414 55 33 60%
CP -
Khurais
Road A+ 18,367 16 24 8 35% 99% 36,067,026 99,909 33 17 52%
CP -
Mansoora A+ 19,324 17 26 9 34% 110% 22,283,150 61,726 21 4 17%
CP - Al
Kharj A+ 14,058 12 19 7 36% 97% 17,826,069 49,380 16 4 27%
CP -
Buraida A+ 12,648 13 17 4 23% 91% 30,605,673 84,780 28 15 54%
CP - Badiya
A+ 19,929 19 27 8 28% 106% 24,834,189 68,793 23 4 17%
CP -
Rabuwa A+ 17,731 16 24 8 32% 91% 27,754,099 76,881 26 10 38%
CP - Jizan
A+ 18,054 14 24 10 42% 92% 25,538,350 70,743 24 10 41%
CP - Gallery
A+ 18,417 20 25 5 19% 98% 33,147,536 91,821 31 11 35%
Total
253,117 234 337 103 31% 96% 439,632,536 1,217,819 406 172 42%
Babyshop “A” Grade Stores
3. Babyshop “B” Grade Stores
Available staff, Optimum staff and Resources Gap
STORES
GRAD
E
AREA
(SQ FT)
AVAILABLE
STAFFS
OPTIMUM
REQUIRMNET
S AS PER
AREA
RESOUR
CES GAP
GAP AS % OF
AREA
REQUIRMENT
JULY BUDGET
YEARLY
BUDGET
SALES
PER DAY
OPTIMUM
REQUIRMNET
S AS PER
SALES
RESOURCE
S GAP
GAP AS %
OF SALES
REQUIRME
NT
CP - Exit - 17 B+ 18,156 12 24 12 50% 102% 17,160,653 47,536 16 4 24%
CP - Salaam
Mall B+ 10,462 11 14 3 21% 91% 17,613,459 48,791 16 5 32%
CP - Al Jouf B+ 7,701 11 10 -1 -7% 99% 12,121,743 33,578 11 0 2%
CP - Othaim
Khurais B+ 9,432 11 13 2 13% 104% 19,311,756 53,495 18 7 38%
CP - Al Qasr
Mall B+ 15,640 15 21 6 28% 87% 21,177,251 58,663 20 5 23%
CP - Tabuk-2 B+ 11,109 11 15 4 26% 112% 13,474,408 37,325 12 1 12%
CP - Dawadmi B+ 6,985 7 9 2 25% 125% 8,080,538 22,384 7 0 6%
BS - Najran B+ 8,706 9 12 3 22% 116% 11,149,723 30,886 10 1 13%
BS- Garden
Mall-Hail B+ 5,369 4 7 3 44% 78% 8,059,225 22,325 7 3 46%
BS - Pada
Mall-Buraida B+ 8,812 5 12 7 57% 87% 6,428,605 17,808 6 1 16%
Total 102,373 96 136 40 30% 100% 134,577,361 372,790 124 28 23%
4. Babyshop “C” Grade Stores
Available staff, Optimum staff and Resources Gap
STORES
GRAD
E
AREA
(SQ FT)
AVAILABL
E STAFFS
OPTIMUM
REQUIRM
NETS AS
PER AREA
RESOURC
ES GAP
GAP AS %
OF AREA
REQUIRME
NT
JULY
BUDGET
YEARLY
BUDGET
SALES
PER DAY
OPTIMUM
REQUIRM
NETS AS
PER
SALES
RESOURC
ES GAP
GAP AS % OF
SALES
REQUIRMENT
BS -
Majardah C+ 4,315 3 6 3 48% 123% 4,726,310 13,092 4 1 31%
BS- Unaiza C+ 3,217 3 4 1 30% 87% 5,641,973 15,629 5 2 42%
BS - Citymall
Shifa C+ 5,457 4 7 3 45% 99% 8,739,106 24,208 8 4 50%
BS - Al Rass C+ 7,215 4 10 6 58% 104% 7,077,439 19,605 7 3 39%
BS - Abu
Arish C+ 5,977 6 8 2 25% 103% 6,186,382 17,137 6 (0) -5%
BS - Khamis
Avenue C+ 5,622 6 7 1 20% 103% 8,259,259 22,879 8 2 21%
BS- Rose Mall
Najran C+ 8,070 6 11 5 44% 141% 5,208,715 14,429 5 (1) -25%
BS- Dowma C+ 6,456 3 9 6 65% 85% 3,764,087 10,427 3 0 14%
CP - Sharorah C+ 7,102 6 9 3 37% 57% 7,181,421 19,893 7 1 10%
BS - Rehana C+ 8,425 7 11 4 38% 94% 7,927,182 21,959 7 0 4%
BS- Zulfi C+ 6,843 9 9 0 1% 120% 7,177,347 19,882 7 (2) -36%
Total 68,699 57 92 35 38% 101% 71,889,222 199,139 66 9 14%
NOTE: No doubt the fact that the present staff strength is not sufficient enough to carry out the routine statistical
functions at satisfactory level and also to undertake the statistical activities in new areas.
5. Identify key areas that deliver the X factor to our performance:-
Stock Replenishment
The stock replenishment provides a powerful tool and a unique competitive advantage to our
organization. First the forecasting can help predict what customers will buy, reducing inventory carrying
cost of unwanted goods while ensuring the customers that we carry the items as per there demand
Two much stocks can result in lower margins, high inventory cost and excess damage as stocks remain
in house too long. However shortage can be even worst as customers who can’t get an item in a
reasonable time may call the competitor. This is a loss opportunity for the business.
To overcome such issues in future we need to accurately forecast demand for inventory items and adjust
the calculation by warehouse, customer, season, product group or an individual item
Maximize the revenue and customer satisfaction by minimizing the chance of stock outs. Simultaneously
reducing the inventory carrying cost by accurately stocking the warehouse. The bottom line is that the
inventory fulfillment increases sales, margin and cash flow and lower the cost.
As per the current scenario the buying stock is not sufficient enough to fulfill the gap. We require 15%
extra stocks prior to the commencement of winter season to meet the requirement of achieving 110%
Customer service
Changing economic dynamics, diverse choices in product and services, numerous shopping formats and
unparallel access to information has empowered the customer to expect more from there retail
experience.
The customer interacts the retailer multiple time before during and after the purchase. So, it is
important for us to provide complete and consistent customer experience across these channels.
6. Identify key areas that deliver the X factor to our performance:-
In the purchase phase, the customer takes the buying decision on the product and pays for it. Various touch
points in this phase include the web, the physical store sales associates, assortments, layouts, etc.In the
service phase, the customer service and loyalty programmes are the key touch points that the retailer has with
the customer. After sales customer service includes installation of an appliance or return and exchange of
merchandise.
In the service phase, the customer service and the loyalty programme are the key touch points that we need to
have with the customer. Today the consumers are looking for a personalized, seamless and distinctive
experience from us. Keeping fashions exciting helps engage and retain customers, results in sales, generates
repeat traffic etc.
It is important to stay connected with the customers to remain the top of the mind recall when they shop.
Since the store staff members act as a brand ambassador for the stores. They are in direct contact with the
customers at various touch points and deliver the experience. So, continuous investment is required in the
training and coaching of staff to deliver on customer expectation.
The consumer wants sharply priced, fashionable apparel to expand their wardrobe both at the workplace and
at home. They no longer want to dress up just for work, they also want to look good implying access to choice
and range. From the time the customer enters the store to when he/she leaves the store, he/she must have
good experience across several touch points that includes interacting with staff, after sales experience, billing
at the POS and the store ambience.
Keeping the above factors into consideration and to reach the target of 110% we will try to focus upon sales
per hour, average sales, items per sale, conversion rate and wages to sales ratio.
7. Identify key areas that deliver the X factor to our performance:-
NOTE:-
Sales per hr- Statically will try to compare one sales person with the other and try to determine who is
efficient in selling and attending the customer
Average sale- Statically will try to compare the average selling price of a salesperson. The higher
statistics will show that the person has a wide knowledge on the product and the less statistics reveals
that he lacks the product knowledge or effective description
Wages to sales ratio- This will give us a graph comparing the hourly wages of a sales person to hourly
sales they have made . It will help us to determine their performance level and how effective they are.
We need to build a sustainable business model given that the gestation period for success in the retail sector
is long. Sustainable product pricing , offering products that imply longevity, expanding operations in a
calibrated but determined manner , are some of the ways in which we can convey our commitment to building
a long term presence.