Download to read offline

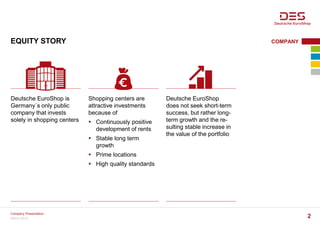
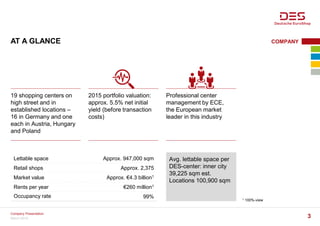
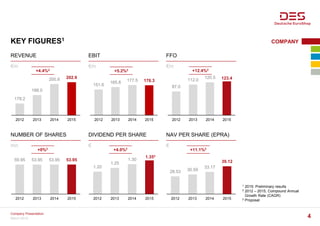
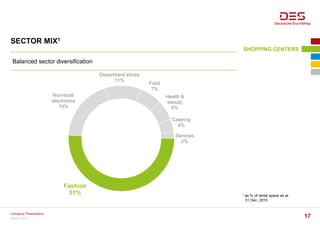
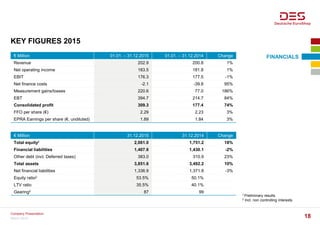
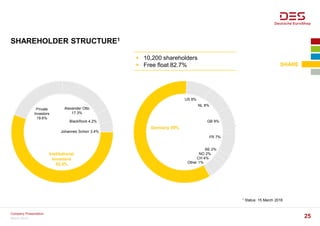
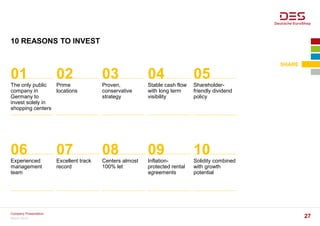
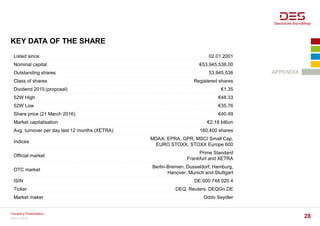

Deutsche EuroShop is Germany's only public company that invests solely in shopping centers. It owns 19 shopping centers located primarily in Germany with a total lettable space of approximately 947,000 square meters. Deutsche EuroShop focuses on long-term growth and stable increases in portfolio value through prime locations, high occupancy rates, and professional property management. Key financial figures for 2015 include total assets of €3.9 billion, revenue of €203 million, and FFO per share of €2.29, representing year-over-year growth. The company aims to further expand its portfolio through acquisitions and existing center extensions.


