
Recommended
Recommended
More Related Content
Similar to 7070dca734961a13b59cbaddfe19fcaed048be8ca17df185f0c11d82286fa03d_Lecture_26_MooKit.pptx
Similar to 7070dca734961a13b59cbaddfe19fcaed048be8ca17df185f0c11d82286fa03d_Lecture_26_MooKit.pptx (20)
Recently uploaded
Recently uploaded (20)
7070dca734961a13b59cbaddfe19fcaed048be8ca17df185f0c11d82286fa03d_Lecture_26_MooKit.pptx
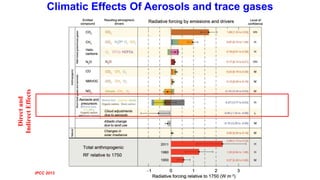
- 1. Climatic Effects Of Aerosols and trace gases Direct and Indirect Effects IPCC 2013
- 2. Global Mean Radiative Forcing: GHSs and Aerosols Ramanathan and Carmichael, 2008
- 3. Image Credit: IPCC WGI Fifth Assessment Report
- 4. Aerosols and Cloud Effects Image Credit: IPCC WGI Fifth Assessment Report
- 5. https://keelingcurve.ucsd.edu/ https://climate.nasa.gov/vital- signs/global-temperature/ Carbon dioxide concentration at Mauna Loa Observatory Temperature Anomaly ( C ) 1880 1900 1920 1940 1960 1980 2000 2020 -0.5 0.0 0.5 1.0 1.5 Ye ar
- 6. Global mean surface temperatures from Berkeley Earth (black dots) and modeled influence of different radiative forcings (colored lines), as well as the combination of all forcings (grey line) for the period from 1850 to 2017. See methods at the end of the article for details. Chart by Carbon Brief using Highcharts. Environmental Pollution and Climate Change 2.0C 1.0C 0.0C -1.0C -2.0C 1750 1800 1850 1900 1950 2000 Observed All factors Greenhouse Gases Aerosols Land Use Ozone Solar Volcanoes Temperature Year https://www.carbonbrief.org/analysis-why-scientists-think-100-of-global-warming-is-due-to-humans/
- 7. Sea Height Variations (mm) 0 25 50 75 100 1995 2000 2005 2010 2015 2020 Antarctica Mass (Gt) Year 2004 2008 2012 2016 2020 -3000 -2500 -2000 -1500 -1000 -500 0 Climate Induced Environmental Changes https://climate.nasa.gov/vital-signs/global-temperature/
- 8. SOLAR VARIATION AND CLIMATIC CHANGE • The Sun is the source of energy that causes the motion of the atmosphere and thereby controls weather and climate • Any change in the energy from the sun received at the Earth’s surface will therefore affect climate • The sun has a magnetic field that flips approximately every 11 years. Sunspots and solar flares are caused by the magnetic activity of the sun • The sunspots and solar flares can affect the earth by changing the amount of incoming sunlight and interacting with the earth’s magnetic field • If the Sun’s radiation intensity declined by 5-10% and there were no other compensating factors, ice would engulf the planet in less than a century. Ref: S & P
- 9. Although no theory exists to predict future changes in solar output, the effect of changes in Earth's orbit as it travels around the Sun is beginning to be understood. Orbital elements that vary cyclically over time: 1. Earth's tilt changes from 22° to 24.5° and back again every 41,000 years. 1. The month when Earth is closest to the Sun also varies over cycles of 19,000 and 24,000 years. Currently, Earth is closest to the Sun in January. This month-of- closest-approach factor can make a difference of 10% in the amount of solar radiation reaching a particular location in a given season 1. The shape of Earth's orbit varies from being nearly circular to being more elliptical with a period of 100,000 years. The radiative forcing resulting from changing solar output can be obtained by multiplying the change in total solar irradiance by (1 — α)/4, α where is the Earth’s albedo. For α = 0.3, (1 - α)/4 = 0.175. A 0.1% change in total solar irradiance (1.4 Wm-2 ) would be equivalent to a radiative forcing of about 0.2 Wm-2. Ref: S & P
- 10. An intense flare in the upper left quadrant of the solar disk that occurred June 6, 2000. The image on the left was taken at the Big Bear Solar Observatory using radiation in the hydrogen alpha line; the second from left is a soft x-ray image obtained from the Yohkoh satellite (“sun beam” in Japanese), the third is another soft x-ray image from the SOHO (Solar and Heliospheric Observatory) satellite, and the panel on the right shows a visible image of the sun taken from the SOHO satellite in which the light coming directly from the sun is blocked (the position of the solar disk is indicated in the image by the white circle) Ref: Wallace and Hobbs
- 11. (Top) Fractional area of the photosphere that is covered by sunspots as a function of latitude and time. Yellow shading indicates areal coverage in excess of 1%, red between 0.1 and 1%, and unshaded less than 0.1%. (Bottom) The fractional area of the surface of the entire solar photosphere (in %) covered by sunspots as a function of time. Upon close inspection of Fig it is evident that the areal coverage of sunspots varies from one solar cycle to the next and that the cycles from 1880 to 1940 were less pronounced than those later in the record. The sun was even less active during the first few decades of the 19th century. From 1645 to 1715 there were almost no sunspots referred to as the Maunder minimum in solar activity Ref: Wallace and Hobbs
- 12. Time variations in the flux density of solar radiation incident on the Earth as inferred from space-based measurements from a variety of instruments Extended time series of sunspot number (defined here as the number of sunspots on the sun’s (visible light) disk plus 10 times the number of sunspot groups) showing intervals of low solar activity. Ref: Wallace and Hobbs