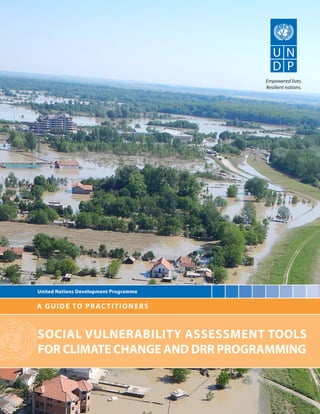
SlideShare a Scribd company logo
A GUIDE TO PRACTITIONERS
United Nations Development Programme
SOCIAL VULNERABILITY ASSESSMENT TOOLS
FOR CLIMATE CHANGE AND DRR PROGRAMMING
2 SOCIAL VULNERABILITY ASSESSMENT TOOLS FOR CLIMATE CHANGE AND DRR PROGRAMMING
SOCIAL VULNERABILITY ASSESSMENT TOOLS FOR CLIMATE CHANGE AND DRR PROGRAMMING 3
SOCIALVULNERABILITYASSESSMENTTOOLS
FORCLIMATECHANGEANDDRRPROGRAMMING
A GUIDE TO PRACTITIONERS
September 2017
4 SOCIAL VULNERABILITY ASSESSMENT TOOLS FOR CLIMATE CHANGE AND DRR PROGRAMMING
Publisher
United Nations Development Programme
Author:
Krunoslav Katic
Contributors:
Mihail Peleah
Zeljko Pavic
Krunoslav Vukelic
Reviewers:
Katerina Kostadinova Daskalovska
Yegor Volovik
Project coordinators:
Natalia Olofinskaya
Armen Grigoryan
Milena Kozomara
Editor:
Duska Tomanovic
Design:
Nenad Vasic
Photo:
UNDP Serbia
Printed by:
Number of copies:
300
ISBN:
978-92-95092-98-3
The views expressed in this publication are those of the author(s) and do not
necessarily represent those of the United Nations, including UNDP, or UN Member
States.
Itbecameapparentduringmyworkinthefieldofdisasterriskreductionandclimatechange,particularlyinthe
South East Europe, and specifically, while dealing with the issue of the respective national Risk Assessments,
that the subject of social vulnerability was inadequately addressed. This Guide was thus developed to boost
and support the capacities of disaster risk reduction and climate change practitioners at the local, national
and international levels. It aims to provide a tool supporting UNDP staff and project managers in planning and
implementing activities, projects and programs addressing social vulnerability.
That said, I particularly wish to express my sincere gratitude to Ms. Natalia Olofinskaya, the Regional Technical
Specialist – Adaptation to Climate Change, UNDP Istanbul Regional Hub, for her encouragement and guidance
in preparing this Guide, and to Mr. Armen Grigoryan, the Climate Change, Disaster Resilience and Global
Energy Policy Advisor, UNDP Istanbul Regional Hub, for providing me with the opportunity to embark on this
project.
I would also like to thank Mr. Željko Pavić, of the Department of Cultural Studies at the University of Osijek,
Croatia, Mr. Krunoslav Vukelić, of the marketing research and public opinion polling company Audeo based
in Osijek, Croatia and Mr. Mihail Peleah, a Programme Specialist, UNDP Istanbul Regional Hub, for providing
substantive expert input to this Guide.
Furthermore, my thanks go to peer reviewers Mrs. Katerina Kostadinova Daskalovska, an Independent
Consultant and Operational Risk Manager, the former Yugoslav Republic of Macedonia and Mr. Yegor Volovik,
a Portfolio Manager at UN Environment.
Last but not least, I would also like to take this opportunity to thank the Disaster Risk Reduction and Climate
Change staff at UNDP South East Europe Country Offices and the Disaster Risk Reduction experts and
practitioners at local and national levels in South East Europe who have been very supportive of this endeavor.
Krunoslav Katic
ACKNOWLEDGEMENTS
SOCIAL VULNERABILITY ASSESSMENT TOOLS FOR CLIMATE CHANGE AND DRR PROGRAMMING 5
6 SOCIAL VULNERABILITY ASSESSMENT TOOLS FOR CLIMATE CHANGE AND DRR PROGRAMMING
CONTENTS
SOCIAL VULNERABILITY ASSESSMENT TOOLS FOR CLIMATE CHANGE AND DRR PROGRAMMING 7
Background . . . . . . . . . . . . . . . . . . . . . . . . . . . . . . . . . . . . . . . . . . . . . . . . . . . . . . . . . . . . . . . . . . . . . . . . . . . . . . . . . . . . . . . . . .
Social vulnerability overview . . . . . . . . . . . . . . . . . . . . . . . . . . . . . . . . . . . . . . . . . . . . . . . . . . . . . . . . . . . . . . . . . . . . . . . . .
Overview of Social Vulnerability Assessment Methodologies and Tools Globally . . . . . . . . . . . . . . . . . . . . . .
CCA/DRR Social Vulnerability Case Studies . . . . . . . . . . . . . . . . . . . . . . . . . . . . . . . . . . . . . . . . . . . . . . . . . . . . . . . . . . .
Social vulnerability indicators . . . . . . . . . . . . . . . . . . . . . . . . . . . . . . . . . . . . . . . . . . . . . . . . . . . . . . . . . . . . . . . . . . . . . . . .
Introduction . . . . . . . . . . . . . . . . . . . . . . . . . . . . . . . . . . . . . . . . . . . . . . . . . . . . . . . . . . . . . . . . . . . . . . . . . . . . . . . . . . . . . . . . .
Development of Indicators . . . . . . . . . . . . . . . . . . . . . . . . . . . . . . . . . . . . . . . . . . . . . . . . . . . . . . . . . . . . . . . . . . . . . . . . . . .
Index calculation and application . . . . . . . . . . . . . . . . . . . . . . . . . . . . . . . . . . . . . . . . . . . . . . . . . . . . . . . . . . . . . . . . . . . .
Index validation . . . . . . . . . . . . . . . . . . . . . . . . . . . . . . . . . . . . . . . . . . . . . . . . . . . . . . . . . . . . . . . . . . . . . . . . . . . . . . . . . . . . . .
Index calculated. What’s next? . . . . . . . . . . . . . . . . . . . . . . . . . . . . . . . . . . . . . . . . . . . . . . . . . . . . . . . . . . . . . . . . . . . . . . . .
Conclusions and Recommendations . . . . . . . . . . . . . . . . . . . . . . . . . . . . . . . . . . . . . . . . . . . . . . . . . . . . . . . . . . . . . . . . . .
Annex 1. SVA Indicative timelines . . . . . . . . . . . . . . . . . . . . . . . . . . . . . . . . . . . . . . . . . . . . . . . . . . . . . . . . . . . . . . . . . . . . .
Annex 2. SVA Costs estimates . . . . . . . . . . . . . . . . . . . . . . . . . . . . . . . . . . . . . . . . . . . . . . . . . . . . . . . . . . . . . . . . . . . . . . . . .
Annex 3. Outline of the Terms of Reference (Deliverables) . . . . . . . . . . . . . . . . . . . . . . . . . . . . . . . . . . . . . . . . . . . . .
Annex 4. Comparable Social Vulnerability Profiling (CSVP) – Case study in Croatia . . . . . . . . . . . . . . . . . . . . .
References . . . . . . . . . . . . . . . . . . . . . . . . . . . . . . . . . . . . . . . . . . . . . . . . . . . . . . . . . . . . . . . . . . . . . . . . . . . . . . . . . . . . . . . . . . .
Table of Content
Table 1 CCA/DRR Social Vulnerability Assessment Case Studies Implemented by UNDP . . . . . . . . . . . . . .
Table 2 List of Examples of Social Vulnerability Indicators . . . . . . . . . . . . . . . . . . . . . . . . . . . . . . . . . . . . . . . . . . . .
Table 3 Characteristics of Household Resources . . . . . . . . . . . . . . . . . . . . . . . . . . . . . . . . . . . . . . . . . . . . . . . . . . . . . .
Table 4 List of Indicators Including Their Definitions and Data Sources . . . . . . . . . . . . . . . . . . . . . . . . . . . . . . . .
Table 5 Values of Vulnerability Indicators . . . . . . . . . . . . . . . . . . . . . . . . . . . . . . . . . . . . . . . . . . . . . . . . . . . . . . . . . . . . .
Table 6 SVA Costs without Qualitative Research in Stage 1 and without Stage 3 (in USD) . . . . . . . . . . . . . .
Table 7 SVA Costs with Qualitative Research in Stage 1 and CorrelationalValidation in Stage 3 (in USD) . . . . . .
Table 8SVACostswithQualitativeResearchinStage1andQualitativeResearchValidationinStage3(inUSD) . . . . .
Table 9 Estimated Survey Costs in USD (Data Collection, Average Duration 15 Minutes) . . . . . . . . . . . . . . .
Table 10 CSVP Vulnerability Table – Final Result . . . . . . . . . . . . . . . . . . . . . . . . . . . . . . . . . . . . . . . . . . . . . . . . . . . . . . .
List of Tables
Figure 1 Outline of an SVA Study . . . . . . . . . . . . . . . . . . . . . . . . . . . . . . . . . . . . . . . . . . . . . . . . . . . . . . . . . . . . . . . . . . . . .
Figure 2 Example of Social Vulnerability Index Mapping Created by MS Paint (CSVP Croatia) . . . . . . . . . .
Figure 3 Example of SV Index Mapping Created by Mapchart.net (Fictional Results) . . . . . . . . . . . . . . . . . .
Figure 4 Indicative Timeline for Conducting a Simplified SVA . . . . . . . . . . . . . . . . . . . . . . . . . . . . . . . . . . . . . . . .
Figure 5 Indicative Timeline for Conducting a Mid-Level Complexity SVA . . . . . . . . . . . . . . . . . . . . . . . . . . . . .
Figure 6 Indicative Timeline for Conducting a Complex SVA . . . . . . . . . . . . . . . . . . . . . . . . . . . . . . . . . . . . . . . . .
List of Figures
18
30
30
34
35
36
16
22
23
25
26
37
38
38
39
44
9
11
11
15
18
18
19
28
31
31
32
34
37
40
41
45
ABBREVIATIONS
8 SOCIAL VULNERABILITY ASSESSMENT TOOLS FOR CLIMATE CHANGE AND DRR PROGRAMMING
UBEVI	 Built Environment Index
CAPI	 Computer Assisted Personal Interviewing
CARE	 Cooperative for Assistance and Relief Everywhere
CATI	 Computer Assisted Telephone Interviewing
CCA	 Climate Change Adaptation
CRM	 Climate Risk Management
CSVP	 Comparable Social Vulnerability Profiling
CVCA	 Climate Vulnerability Capacity Assessment
DRR	 Disaster Risk Reduction
ECIS	 Europe and the Commonwealth of Independent States
F2F	 Face to Face
GDP	 Gross Domestic Product
GEOSTAT Geodesy Satellite
GIS	 Geographic Information System
HBS	 Household Budget Survey
MCA	 Multi Criteria Analysis
NGO	 Non Governmental Organization
PROVIA	 Programme of Research on Climate Change Vulnerability, Impacts &Adaptation
RCI	 Resilience Capacity Index
SD	 Standard Deviation
SEVI	 Socio-Economic Vulnerability Index
SoVI	 Social Vulnerability Index
SVA	 Social Vulnerability Analysis
UNDP	 United Nations Development Programme
BACKGROUND
SOCIAL VULNERABILITY ASSESSMENT TOOLS FOR CLIMATE CHANGE AND DRR PROGRAMMING 9
In the past twenty years, disasters cost more than $2 trillion, killed over 1.3 million and affected more than 4.4
billion people, including a disproportionately high number of women, children and other vulnerable groups1
.
Climate-relatedhazards,suchascyclones,droughtsandfloods,arebecomingincreasinglyfrequentandsevere
as a result of changing climate. In this new context of volatility, communities and nations are facing increasing,
multiple and interconnected risks that can reverse years - and sometimes decades - of development progress.
Specific categories of the population (1) may face a higher risk of disasters or climate change, related to the
place they are living (flood prone parts of the community, for example), crops they are growing (i.e. low cost,
low yield seeds, not resilient to climate change, for example); (2) may have lower preparedness and coping
capacity because they lack capitals to invest in adaptation and the decision making powers to affect public
decisions on adaptation; (3) may have lower resilience/adaptation capacity because they lack access to
economic and social support networks.
Climate change adaptation and risk management interventions need to be planned, designed and targeted
with the clear understanding of the social vulnerability profiles of various groups of beneficiaries. Numerous
methodologies are used worldwide for assessing the impact of climate change and disasters on vulnerable
population groups.
Nevertheless, those social vulnerability methodologies are not systematically integrated into the overall
process of climate and disaster risk management. Consequently, many studies that are meant to be “risk
assessments” do not go beyond being “hazard assessments” as they lack standardized, comparable and
quantifiable social dimensions of vulnerability.
A number of issues and challenges arise in defining and mapping the socially vulnerable population within
climate change adaptation and disaster risk assessment frameworks. The variety of parameters used to
determinesocialvulnerabilityincludes,butisnotlimitedto,incomedisparity,gender,age,disability,language,
literacy or family status. However, personal characteristics can be linked to vulnerability, but not define it.
Group approach is widespread because it is easy to administer and use for targeting the population, but it
largely ignores the internal heterogeneity of groups2
. Availability of data on social vulnerability (i.e. obtained
from censuses, pre- and post-disaster studies, public surveys, etc.), and the level at which we conduct social
vulnerability studies (individual, neighborhood, community, municipality, region, etc.) are critical issues
in conducting social vulnerability assessments for climate change adaptation or disaster risk reduction
programs. Finally, the tools for assessing social vulnerability have to be chosen for particular programmatic or
investment decisions.
1
UNISDR (2013) Tackling future risks, economic losses and exposure
2
More about the human centered approach in UNDP’s 2011 Regional Human Development Report. Beyond Transition Towards 	
Inclusive Societies, available at http://hdr.undp.org/en/content/beyond-transition .
BACKGROUND
10 SOCIAL VULNERABILITY ASSESSMENT TOOLS FOR CLIMATE CHANGE AND DRR PROGRAMMING
UNDP has been working on integrating issues of climate, disaster risk and energy at the country level, and
focusing on building resilience and ensuring that development remains risk-informed and sustainable. Since
2008, UNDP has supported more than 140 countries in accessing over $2.3 billion in grant finance to develop
and implement climate change initiatives3
.
In the Europe and the Commonwealth of Independent States (ECIS) region, UNDP has been supporting a rich
portfolio of project and policy initiatives addressing adaptation to climate change and disaster risk reduction.
The UNDP projects in the region have addressed diverse climate-induced threats and impacts and targeted
various adaptation and risk management objectives, ranging from improved resilience of agricultural
livelihoods to reduced vulnerability of communities and economies to climate-induced natural disasters.
These interventions are designed to target the most vulnerable people and communities and leave a legacy
of inclusive gender-sensitive adaptation planning and risk reduction.
The aim of this Guide is to first and foremost serve as a user friendly knowledge product on SocialVulnerability
Assessment (SVA) approaches and tools.This Guide provides information about on-going and future planning
and programming in the areas of climate change adaptation (CCA), climate risk management (CRM) and
disaster risk reduction (DRR).
As such, it is primarily designed for CCA and DRR practitioners in national governments, local level authorities
dealing with DRR/CCA, professional community and development organizations (including UNDP Country
Offices and projects) involved in the planning, design and/or implementation of CCA and DRR projects. Thus,
the Guide aims to improve the quality of CCA and DRR project development and implementation through
enhanced initiation, targeting and increased effectiveness of future interventions.
3
UNDP and Climate Change: Zero Carbon, Sustainable Development
This guide should be taken only as an outline and a proposal that can
assist project managers -DRR and CCA practitioners in developing social
vulnerability studies dealing with climate change and disasters in specific
countries.
SOCIAL VULNERABILITY OVERVIEW
SOCIAL VULNERABILITY ASSESSMENT TOOLS FOR CLIMATE CHANGE AND DRR PROGRAMMING 11
OVERVIEW OF SOCIAL VULNERABILITY ASSESSMENT
METHODOLOGIES AND TOOLS USED GLOBALLY
There are numerous operational definitions of social vulnerability to natural hazards, but it is most commonly
defined as “the differential capacity of groups and individuals to deal with hazards, based on their positions
within physical and social worlds”(Dow, 1992), or as“the inability to take effective measures to insure against
losses”(Bogard, 1989).
These differential capacities of groups and individuals are related to control over resources (or endowment
with capital), risk exposure, awareness and management, and the ability to respond. Resources form the basis
of an individual’s or community’s ability to be resilient. Diverse and abundant capitals reduce community
vulnerability and exposure to risks—i.e. forests can increase protection from storms and floods, while a
vibrant local economy can provide the necessary resources to cope when disaster strikes (or to invest in
disaster prevention measures, such as river bank reinforcement). In addition, capitals are necessary for risk
management and the ability to respond - education increases the skills and knowledge to understand
community risks and increases the ability to develop and implement risk reduction strategies, while social
capital facilitates coordination and cooperation so necessary for rapid response.
Different communities and individuals are exposed to different risks of hazard, even within the same district
or locality. For instance, many Roma communities live on the outskirts of towns, which may be more prone
to flooding. Such exposure is not necessarily linked to the socioeconomic status of a community. However, in
combination with access to resources and information, as well as visibility on the policymakers’ radar screen
and ability to influence decision making, it can lead to different abilities to respond.
Risk awareness and preparedness are the key elements for strengthening resilience, as they anticipate
the potential impact of hazards. However, there are significant differences in the levels of awareness and
preparedness of different groups and individuals. The reasons for these differences are multiple, but three
stand out as the most important. The first regards different degrees of access to information, due both to
the inaccessibility of information sources and lack of technologies. The second concerns the lack of skills and
knowledge for preparedness planning. Last but not least, the third regards lack of resources for preparedness
and response measures. This also includes human and social capital and the ability to mobilize people to
respond when crisis strikes.
It is impossible to directly measure social vulnerability because it includes so many aspects, described above,
some of which (like the ability to mobilize the community) become visible only after a disaster happened. Like
in many similar cases, we have to rely on measuring individual characteristics4
related to social vulnerability,
which put people in a less vulnerable position (such as their socioeconomic status or social connections) or
a more vulnerable position (disabilities or the community’s limited transport connectivity). When it comes to
measuring social vulnerability, Cutter, Boruff and Shirley (2003) departed from the following broad groups of
(often interplaying) characteristics of positions within physical and social worlds, assumed to be related to
vulnerability/resilience:
4
It needs to be noted that many of these characteristics can be highly contextual.
SOCIAL VULNERABILITY OVERVIEW
12 SOCIAL VULNERABILITY ASSESSMENT TOOLS FOR CLIMATE CHANGE AND DRR PROGRAMMING
1.	 Socioeconomic status (e.g. high-status groups should be more resilient to natural hazards and can
recover more quickly),
2.	 Gender (e.g. women are likely to be more vulnerable due to family-care obligations and lower labor
market position),
3.	 Race and ethnicity (e.g. language barriers that lead to lower resilience, especially when it comes to
post-disaster funds),
4.	 Age (e.g. mobility concerns leading to lower resilience),
5.	 Commercial and industrial development (e.g. the value, quality and density of commercial and
industrial buildings show the economic vitality of a community),
6.	 Employment loss (higher unemployment levels lead to additional pressure on the labor market in
the post-disaster period),
7.	 Rural/urban (e.g. rural communities are more vulnerable economically due to single-resource
economy, but urban communities are more vulnerable to evacuation problems),
8.	 Residential property (e.g. better-quality residential buildings lead to higher resilience),
9.	 Infrastructure and lifelines (e.g. loss of communications, such as bridges and transportation
infrastructure, can result in a financial burden),
10.	 Renters5
(a higher number of renters can lead to lower resilience),
11.	 Occupation (e.g. some occupations, such as agriculture and other natural resource-based
occupations, can be more impacted by a hazard),
12.	 Family structure (e.g. resilience can be lower in families with large numbers of dependents and
single-parent families),
13.	 Education (higher education is linked to higher income and greater access to information),
14.	 Population growth (rapid population growth can lead to greater vulnerability due to lack of quality
housing and urban systems),
15.	 Medical services (e.g. greater numbers of medical personnel and proximity to medical services lead
to better resilience),
16.	 Social dependence (e.g. people relying on social services constitute vulnerable groups that may
need additional assistance), and
17.	 Special needs population (e.g., institutionalized persons, homeless persons who can be more
severely affected due to lack of access to information or lower visibility).
5
Persons who rent a house/apartment.
SOCIAL VULNERABILITY OVERVIEW
SOCIAL VULNERABILITY ASSESSMENT TOOLS FOR CLIMATE CHANGE AND DRR PROGRAMMING 13
These variables can be divided into two groups based on the data collection level. The first group consists
of individual level variables (for example, education, age and gender) that are aggregated to produce
community-level numbers.
The second group comprises community-level variables, such as population growth, infrastructure quality
and urban/rural division that need not be aggregated. By conducting a principal component analysis with
normalized variables, these authors extracted eleven composite factors and used them to calculate the Social
Vulnerability Index (SoVI) of US counties, without assigning weights to the factors. The Social Vulnerability
Index was further developed by the Hazards and Vulnerability Research Institute at the University of South
Carolina6
.
Similarly, Oulahen et al. (2015) used the following five groups of indicators to calculate social vulnerability to
floods in the City of Vancouver:
1.	 Ability to cope (age, gender), ethnicity (minority status, immigration),
2.	 Access to resources (income, property value, percentage of renters, education, unemployment,
income from government transfers),
3.	 Household arrangement (single-parent households, single-member households),
4.	 Public transport (as the main family transportation mode), and
5.	 Built environment (quality of housing, age of construction, population density, dwelling in 5+ stories
apartments).
The authors also used the principal component analysis to extract the component factors and create an
additive model7
of the Social Vulnerability Index, a flexible tool appropriate for modelling multivariate data.
The areas were classified according to the standard deviation (SD) from the mean. The vulnerability scores/
areas were classified into five categories (quintiles): high (>1.5SD), medium-high (0.5 to 1.5SD), medium (–0.5
to 0.5SD), medium-low (–1.5 to 0.5SD) and low (<–1.5SD).
The Index (SoVI) was validated through focus groups with local practitioners working on the development of
natural hazard plans in the local municipalities.The practitioners were asked to indicate whether indexes/area
maps corresponded to the local reality when it came to flood hazards.
6
The list of variables that comprise the Index can be found on the Institute’s website (http://artsandsciences.sc.edu/geog/hvri/
sovi%C2%AE-0), together with detailed methodological explanations.
7
https://en.wikipedia.org/wiki/Additive_model
SOCIAL VULNERABILITY OVERVIEW
14 SOCIAL VULNERABILITY ASSESSMENT TOOLS FOR CLIMATE CHANGE AND DRR PROGRAMMING
Park et al. (2016) constructed a socio-economic vulnerability index that is specific to landslide hazards. They
used the following three sub-indexes relating to different issues of vulnerability/disaster risk:
1.	 Demographic and social index (age distribution; number of workers who may be exposed to
disasters, population density, foreigner ratio, education level, housing type),
2.	 Secondary damage triggering index (number of public offices, road area ratio, number of
electronic supply facilities, school area ratio, commercial and industrial area ratio), and
3.	 Preparation and response index (disasters frequency, Internet penetration rate, number of
disaster prevention facilities, perceived safety, number of medical doctors, and financial
independence of the borough). The authors assigned weights to the sub-indexes, as well to the
variables that comprise sub-indexes, through interviews with the key informants.
In their research in Norway, Holand, Lujala and Rød (2011) also used the basic methodological approach
delineated in Cutter, Boruff and Shirley (2003). They, however, consider “the social vulnerability concept to
consist of two distinct parts: socioeconomic vulnerability characterized by aspects such as living conditions
and population structure; and built environment vulnerability, measured by factors such as population
density, the quality and magnitude of infrastructure, and the number of exit routes.” Principal factor analysis
revealed a four-factor solution when it comes to the Socio-Economic Vulnerability Index (SEVI) and a three-
factor solution when it comes to the Built Environment Index (BEVI).
Even though most studies use unweighted indexes of social vulnerability to hazards, Oulahen et al. (2015)
point out the necessity of variable weighting, preferably by using the knowledge and experience of the
local stakeholders. For example, Emrich (2005) used the Delphi method with local experts in order to assign
variable weights.
SOCIAL VULNERABILITY OVERVIEW
SOCIAL VULNERABILITY ASSESSMENT TOOLS FOR CLIMATE CHANGE AND DRR PROGRAMMING 15
CCA/DRR SOCIAL VULNERABILITY CASE STUDIES
STUDY LOCATION
DATA
COLLECTION
METHODS
SHORT EXPLANATION OF
METHODOLOGY
Comparable
Social
Vulnerability
Profiling – CSVP
(Case study:
Croatia)
Croatia,
2015
Census 2011, Croatian
Bureau of Statistics
The calculation of six equally
valued variables/indicators
(without ponders) for several
Croatian cities, municipalities
and counties was followed by
their comparative analysis. The
final step involved comparing the
vulnerability tables against the
common denominator - either the
county or the state.
Economic
and social
vulnerability in
Georgia
Georgia,
2013
Household Budget
Survey by GEOSTAT on
regular sample + 500
households from each
target group. In-depth
interviews and focus
groups discussions
with representatives
from these 3 target
groups
The regular HBS questionnaire was
supplemented by a special module
on vulnerability. A qualitative
analysis was implemented at
the beginning of the research,
involving in-depth interviews with
the key stakeholders, in order to
design the appropriate special
module and another qualitative
analysis was performed after the
initial analysis of the survey results,
through focus groups comprising
participants from the three target
groups.
Disaster Risk
Reduction and
Climate Change
The former
Yugoslav
Republic of
Macedonia
(South-East
Region),
2013
2002 National census
After collecting useful data
about the South-East Region, a
set of indicators and indexes of
socioeconomic vulnerability was
designed in accordance with the
national policies and strategies.
The team then constructed an
index of vulnerability based on the
existing theoretical models.
SOCIAL VULNERABILITY OVERVIEW
16 SOCIAL VULNERABILITY ASSESSMENT TOOLS FOR CLIMATE CHANGE AND DRR PROGRAMMING
STUDY LOCATION
DATA
COLLECTION
METHODS
SHORT EXPLANATION OF
METHODOLOGY
Socio-Economic
Assessment of
Flood Risk in Rioni
Basin
Georgia
(Rioni
Basin), 2014
Flood risk scoring
in a form of Multi
Criteria Analysis
(MCA)
Flood risk screening and quantification
by social, agricultural and environmental
drivers in communities or municipalities
in order to indicate the riskiest areas in
the region. The next step involved the
identification and estimate of economic
damages.
Guidance on
Ecosystem
Considerations into
Climate Change
Vulnerability and
Impact Assessment
to Inform
Ecosystem-based
Adaptation
Nepal,
Peru and
Uganda,
2015
Several
methodologies, such
as CARE’s CVCA,
PROVIA guidance. No
data collection from
primary sources.
The CVCA (Climate Vulnerability
Capacity Assessment) methodology
of vulnerability and adaptive capacity
was used to analyze the communities,
households and individuals, i.e. at the
local level. The PROVIA model was used
for larger-scale assessments.
Testing of Climate
Risk Assessment
Methodology
Kyrgyzstan,
2013
Focus groups
(each with eight
participants) and
house interviews
(54 persons).
Comparative analysis
of the experts’
and respondents’
opinions
The respondents were asked about their
perceptions of changes in the frequency
of climate-related hazards (avalanches,
prolonged winter, livestock diseases,
landslides, etc.) and indications of climate
change (more frequent snowfalls, heavy
rains, etc.). A comparative analysis
identified some differences in opinion on
these issues among the experts and the
local population.
Table 1. CCA/DRR Social Vulnerability Assessment case studies implemented by UNDP
TheexamplesintheaboveTable1showthatsocialvulnerabilityandothertypesofvulnerabilityofsomespecificgroups
were calculated only on the basis of official census data and other secondary sources. In the Croatian case study, there
werenorespondentsatall–socialvulnerabilitywasmeasuredonlybasedonthedatafromthelastcensus.Arguably,the
mostdetailedSVAstudywasconductedinGeorgiawhereGEOSTAT’sHouseholdBudgetSurvey(HBS)wasexpandedto
includeaspecialmodule(infact,asetofspecificquestions)thatmeasuredvulnerability.
SOCIAL VULNERABILITY OVERVIEW
SOCIAL VULNERABILITY ASSESSMENT TOOLS FOR CLIMATE CHANGE AND DRR PROGRAMMING 17
The key stakeholders were interviewed before the Survey in order to design the most appropriate module. After the
analysisoftheHBSprimaryresultscoveringthethreetargetgroups,interviewswereheldwiththefocusgroupstoclarify
specific issues.The main issue arising with respect to the formerYugoslav Republic of Macedonia study is that it used
thedatafromthelatestavailablenationalcensus(11yearsold),whichwerethusprobablyoutdated.Thecasestudythat
included three countries on three different continents - Nepal, Peru and Uganda - employed different concepts (such
asCARE,PROVIA,etc.)inordertounderstandsocialvulnerabilityatthelocalandlarger-scalelevels,butdidnotuseany
primarydataobtainedfromsurveys,interviews,focus-groupsorbyothermethods.
As noted, these quantitative approaches to measuring social vulnerability are based on assumptions and models, and
on simplification of a complex reality. In reality, we do not face“known knows”and a deterministic relationship, but
rather“known unknowns”and“unknown unknowns”, or complicated and complex domains in terms of the Cynefin
Framework8
. Complicated problems may contain multiple right answers, and, although there is a clear relationship
between cause and effect, not everyone can see it. In general, good practice, as opposed to best practice, is more
appropriateforproblemsinthecomplicateddomain.
For instance, information for risk awareness can be provided through different channels - TV, radio, newspapers,
social networks, by word of mouth, etc. - which can have different capacity to reach different groups and which are
perceived differently. In case of complex problems, cause-and-effect relationships are not discernible in real time, only
retrospectively.Tryingtosolveacomplexproblembybestpracticesorgoodpracticesresultsinitreturninginadifferent
form;however,surprisinglysimplesolutionsemergetocomplexproblems.
This calls for using qualitative methods to complement quantitative studies. For instance, UNDP successfully
employed the micro-narratives technique9
in a number of cases, ranging from Green Economy in Belarus toWomen’s
Entrepreneurship in Tajikistan10
and Roma poverty from a human development perspective (UNDP BRC, 2011)11
.
Essentially,theapproachinvolvescollectingstories(narratives)andaskingtherespondentstotagthemaccordingtoa
numberofcriteria.Thiscanhelpbetterunderstandthemeaningofvulnerabilitycriteria.
The approach can also be used for identifying solutions by asking the following question:“How do we create more
stories like this one and fewer stories like that one?”For instance, in the case ofTajikistan, we found out that the major
obstacle for women’s entrepreneurship lay in their lack of self-confidence, not in high interest rates (as many had
suggested). In case of Belarus, we found out that the Government information campaign had zero effect on behavior
change,whileexamplesofneighborshadhugeimpact.
Overview of the previous research indicates that there is a wide range of indicators
that are being used in social vulnerability analyses. However, the methods for
calculating the social vulnerability indexes are relatively similar in most situations.
9
http://cognitive-edge.com/sensemaker/#sensemaker-cases
8
Cynefin Framework Introduction, available at http://cognitive-edge.com/videos/cynefin-framework-introduction/
11
http://www.eurasia.undp.org/content/rbec/en/home/library/roma/roma-poverty-human-development-perspective.html.
10
https://www.unpei.org/sites/default/files/e_library_documents/Women%20Empowerment%20in%20Tajikistan_0.pdf
SOCIAL VULNERABILITY INDICATORS
18 SOCIAL VULNERABILITY ASSESSMENT TOOLS FOR CLIMATE CHANGE AND DRR PROGRAMMING
A study of social vulnerability should develop a valid and reliable list of indicators and measure them in order
to classify geographic units of various sizes and levels according to their vulnerability to the specific natural
hazards or climate risks. Different sets of indicators should be applied to different types of natural hazards
(for example floods, earthquakes, landslides, droughts, etc.) in situations where it is deemed that social
vulnerability to these hazards is different in specific cases.
However, the same sets of indicators can be applied to the geographic units regardless of their size (e.g., local
self-government units of different levels) by aggregating the values of the social vulnerability indicators. At
the end, the study should produce a map with the classification of geographic units according to their level
of social vulnerability.
•	 Putting in place / agreeing on a conceptual framework for measurement
•	 Indicator development
•	 Index calculation and application
•	 Index validation
•	 Index use
These stages are shown in Figure 1 below
INTRODUCTION
Figure 1. Outline of the SVA study
PILOT
QUALITATIVE
RESEARCH
INDICATOR
DEVELOPMENT
WITHOUT PILOT
QUALITATIVE
RESEARCH
INDEX
CALCULATION
AND APPLICATION
INDEX
VALIDATION
QUANTITATIVE
VALIDATION
INDICATOR
DEVELOPMENT
QUALITATIVE
VALIDATION
SOCIAL VULNERABILITY INDICATORS
SOCIAL VULNERABILITY ASSESSMENT TOOLS FOR CLIMATE CHANGE AND DRR PROGRAMMING 19
DEVELOPMENT OF INDICATORS
In this stage of the study, a preliminary list of indicators suited to the local context and data availability
should be developed. The starting point should be the list of indicators comprised by the so-called Social
Vulnerability Index – SoVI12
. For example, this Index was used in the UNDP study on disaster risks and climate
change in the former Yugoslav Republic of Macedonia, with indicators selected after a comprehensive review
of the country’s legislation, national and regional policies and strategies and academic literature on the issue.
However, this Index should probably be extended to include items related to social networks, and other
possible aspects of social vulnerability not present in the Index.
The preliminary list of indicators can be developed with or without performing a pilot qualitative study. The
simplest way would involve desk research, wherein researchers would develop the list based on prior studies,
as well as theoretical and practical knowledge. However, a desk research does not fully ensure that the list will
be valid and well-suited to local circumstances.
Thus, several types of qualitative analysis (in-depth interviews, Delphi method, focus groups) with the key
informants (local experts and stakeholders), i.e. a pilot qualitative study, can be performed in order to produce
the preliminary list of indicators to be used in the subsequent phases of the study. It is very important to
note here that the list of indicators should be developed having in mind the local availability of data, and
possibilities to repeat the research in the future. Namely, only indicators that are available for geographic units
and can be expected to be available in the future should be included.
It should be mentioned that indicators can have different meanings at the individual, community, regional
and country levels. Moreover, tools available for data collection can have certain limitations related to the level
of disaggregation. For instance, GDP per capita is a good indicator of the quality of life or human development
opportunities. Spatially disaggregated GDP data, estimated by using the production method, measure the
gross value added generated in a specific territory and its sources – but not necessarily its purpose (on what
the income has been spent).
Because sub-national jurisdictions may benefit from large inter-regional transfers by the central government
(which are not reflected in sub-national gross value added data and the GDP estimates based on the
production method), sub-national per capita GDP data can be poor measures of sub-national living standards
and development prospects. GDP data are typically available at the regional level, but not at the provincial or
municipal levels.
Household surveys are an important tool for collecting various social vulnerability data (for instance, such a
survey was used in the Georgia Social Vulnerability Study), but they also have their limitations. In most cases,
household surveys operate at the level of households, not individuals, hence income and expenditures are
average for all household members and mask intra-household inequalities. Because of their design, these
surveys are representative at the country level.
12
Susan L. Cutter; Bryan J. Boruff; W. Lynn Shirley,“Social Vulnerability to Environmental Hazards,”Social Science Quarterly, Volume 84,
Number 2, June 2003, pp. 242-261)
SOCIAL VULNERABILITY INDICATORS
20 SOCIAL VULNERABILITY ASSESSMENT TOOLS FOR CLIMATE CHANGE AND DRR PROGRAMMING
Last but not least, non-linearity and feedback loops should be borne in mind during the selection of the
indicators. For instance, in Serbia, the number of NGOs per 1,000 inhabitants (proxy of civic engagement) was
the highest in the most deprived municipalities. In other words, NGOs most probably have to step in where
the Government fails to deliver services. In a similar vein, we found13
the highest level of social exclusion in
Serbian municipalities with the highest and lowest voter turnouts.
In Uzbekistan, the share of women in higher education (a proxy for gender equality) is the highest in the
deprived region of Karakalpakstan, and the lowest in Tashkent, reflecting the structure of the education
system - girl-dominated medical and pedagogical universities in Karakalpakstan and a mixture of institutions
inTashkent.Therefore, the initial list of indicators, once prepared, needs to be reviewed by asking the following
questions: What does this indicator mean at the local level and can I get it? How it is related to vulnerability?
Why?
In this process, weights can also be assigned to the variables in case that some variables are deemed more
important than others. For example, this approach was taken in the UNDP study of social vulnerability in
Georgia, where a combination of quantitative data (Household Budget Survey by GEOSTAT extended to 500
additional households in each target group) and qualitative data (focus groups and in-depth interviews with
representatives) was used. In that case, the results of the focus groups and interviews helped design the set
of indicators and their weights.
The choice of a particular qualitative research method will depend on the assessment of its strengths and
weaknesses in each particular case. For example, in-depth interviews require more time, but they provide in-
depth knowledge of the research topic. Focus groups take less time and can generate more ideas using group
dynamics. However, they can generate biased results due to group thinking and domination of high-status
individuals. The Delphi method avoids this bias, but at the cost of losing the group dynamics.
Furthermore, in line with guidelines developed by Bergstrand et al. (2015), it would be desirable to enlarge
the concept of community resilience to natural hazards with social capital variables. Some examples of such
variables include a sense of community, attachment to a place, sense of social support, civic participation,
size of one’s personal social network, etc. The amount of a community’s social capital should be positively
correlated to community resilience by providing a safety net that can help individuals cope with the disaster
and recover from it more quickly.
Several indicators of social vulnerability with their expected influence on social vulnerability are listed in
the following Table 2 based on previous research and models. However, it should be noted that the actual
influence is context-dependent, i.e. that it should be assessed in every individual study. Additionally, the list
should not be taken as an exhaustive list of all possible indicators, but merely as a list of examples intended to
improve understanding of the matter.
13
Supra 2
SOCIAL VULNERABILITY INDICATORS
SOCIAL VULNERABILITY ASSESSMENT TOOLS FOR CLIMATE CHANGE AND DRR PROGRAMMING 21
GROUP INDICATORS
EXPECTED
INFLUENCE
increases social
vulnerability
decreases social
vulnerability
Socioeconomic
GDP per capita
Average monthly salary
Unemployment level
Number of socially dependent individuals/citizen
Occupation (profession and managerial level)
Occupation – open space (e.g., agriculture, construction)
Economic sector (e.g., resource extraction)
Demographics
Age (proportion of youth and elderly population)
Gender (female)
Education
Special needs/disability population
Vulnerable minorities
Immigrants
Rapid population growth
Family
structure
Single-parent households
Single-member households
Large families
SOCIAL VULNERABILITY INDICATORS
22 SOCIAL VULNERABILITY ASSESSMENT TOOLS FOR CLIMATE CHANGE AND DRR PROGRAMMING
GROUP INDICATORS
EXPECTED
INFLUENCE
increases social
vulnerability
decreases social
vulnerability
Medical services
Number of medical personnel per capita
Number of hospitals per capita
Average distance from nearest hospital
Urban Percentage of urban population
Renters Percentage of renters
Built
environment
vulnerability
Population density
Quality of infrastructure
Age of infrastructure
Average property value
Social
capital
Sense of community
Attachment to a place
Perceived level of social support
Civic participation
Particular indicators can be presented at several hierarchy levels. For example, in the figure below, taken
from UNDP study in Georgia, we can see how household resources (characteristics) can be analysed on some
domain levels with sub-domains and content indicators groups. For example, domain“Human resources”can
be measured through sub-domains “Education” (with “Educational attainment” and “Quality of education” as
content indicators),“Labor”and“Health”.
Source: Adapted from Cutter, S.L.; Boruff, B.J.; Shirley, W.L. (2003); Holand, I.S.; Lujala, P.; Rød, J.K. (2011); Holand,
I.S.; Lujala, P. (2013); Bergstrand, Kelly; Mayer, Brian; Brumback, Babette, Zhang, Yi (2015).
Table 2. List of Examples of Social Vulnerability Indicators
SOCIAL VULNERABILITY INDICATORS
SOCIAL VULNERABILITY ASSESSMENT TOOLS FOR CLIMATE CHANGE AND DRR PROGRAMMING 23
DOMAIN SUB-DOMAIN CONTENT INDICATORS
Material resources
Financial resources
Income
Savings
Debts
Type of income
Physical resources
Land
Livestock
House/apartment
Durable goods
Quality of housing
Human resources
Education
Educational attainment
Quality of education
Labor
Employment
Type of employment
Health
Health status
Chronic illness
Social resources
Social network
Size
Status
Connection
Information & communication
Source of information
Means of communication
Community
Presence of associations
Variety of associations
Source: Gassmann, Berulava, Tokmazishvili et all. Economic and social vulnerability in Georgia
Table 3. Characteristics of household resources
SOCIAL VULNERABILITY INDICATORS
24 SOCIAL VULNERABILITY ASSESSMENT TOOLS FOR CLIMATE CHANGE AND DRR PROGRAMMING
An example of the list of indicators with their definitions and data sources that have been used in UNDP study
in the City of Skopje is shown in the Table 4 below. This case provides an example of the specification of social
vulnerability indicators according to their importance in a particular context and availability of data sources.
For example, the percentage of Roma population as a vulnerable minority was identified as an indicator that
increases social vulnerability.
CHARACTERISTICS
INDICATOR
INPUT DATA
AND THEIR SOURCE
HIGHER VALUES OF
INDICATORS
CONTRIBUTE TO
DEMOGRAPHIC CHARACTERISTICS
1
Rapid population growth: Average annual
rate of population growth in the municipality
The former Yugoslav
Republic of Macedonia
Statistical Office
biannual population
estimates by
municipality and
authors’estimates for
some of the Skopje
municipalities
Increased social
vulnerability
2
Young population: % share of the population
on age under 6 years in the total population
of the municipality
Increased social
vulnerability
3
Elderly population: % share of the population
on age 65 years and plus in the total
population of the municipality
Increased social
vulnerability
4
Ethnicity: % share of the Roma population in
the total population of the municipality
The former Yugoslav
Republic of Macedonia
2002 Population and
Housing Census
Increased social
vulnerability
5
Special needs population: % share of the
population with disabilities in the total
population of the municipality
Administrative data,
Ministry for labor and
social policy
Increased social
vulnerability
ECONOMIC
6
Employment: number of registered
unemployed persons (active and passive
job seekers) per 100 persons of working age
(15-64)
Administrative data,
The former Yugoslav
Republic of Macedonia
National Employment
Agency
Increased social
vulnerability
SOCIAL VULNERABILITY INDICATORS
SOCIAL VULNERABILITY ASSESSMENT TOOLS FOR CLIMATE CHANGE AND DRR PROGRAMMING 25
CHARACTERISTICS
INDICATOR
INPUT DATA
AND THEIR SOURCE
HIGHER VALUES
OF
INDICATORS
CONTRIBUTE TO
LIVING CONDITIONS
7
Housing conditions, water supply
system: % of households with
piped water from a community
scheme
Authors’estimates based on data
on registered users from the public
water supply and sewage company,
data from the 2002 Population and
Housing Census and information
published on municipal web portals
and in their Environmental Local
Action Plans
Reduction
of the social
vulnerability
8
Housing conditions, sewage
disposal system: % of households
with a piped system connected to
a public sewage disposal system
Reduction
of the social
vulnerability
9
Living environment, access
to medical services: doctors-
physicians, number of general
practitioners per 10,000 residents
Administrative data from the Public
Health Institute Center for Public
Health - Skopje
Reduction
of the social
vulnerability
Source: Socio-Economic Vulnerability Assessment of the Population in the Ten Municipalities of the City of Skopje
in relation with Disaster Risks and Climate Change (National Consultant: MSc Katerina Kostadinova-Daskalovska).
Table 4. List of Indicators Including Their Definitions and Data Sources
Since the indicators of social vulnerability are highly country-specific, it is
recommended that SVA process engage local experts to participate in the
qualitative research. Thus, the development of indicators should include
desk research, qualitative research involving local experts and a population
survey (as feasible).
Another example is from the Croatian study. In order to determine the vulnerability levels of the respective
communities (municipalities/cities) within one area (at the county or national level), all the results derived
from the respective vulnerability assessments were compared with the common denominator – in this
particular case, seven respective communities (villages, municipalities, cities) were compared with the
higher level territorial unit i.e. a county. Similarly, all the counties can be compared at the national level i.e.
at the country/state level.
SOCIAL VULNERABILITY INDICATORS
26 SOCIAL VULNERABILITY ASSESSMENT TOOLS FOR CLIMATE CHANGE AND DRR PROGRAMMING
CSVP COMPARABILITY TABLE COMMUNITIES 1-7
CSV PROFILE
AGE(V)
GENDER(V)
EDUCATION(V)
MINORITY(V)
INCOME(V)
DISSABILITY
(V)
RESULT
CSVP
Community 1 + + + + + + 0 +6 H
Community 2 - + + + + + -1 +5 H
Community 3 - - + + + + -2 +4 M
Community 4 - - - + + + -3 +3 M
Community 5 - - - - + + -4 +2 M
Community 6 - - - - - + -5 +1 L
Community 7 - - - - - - -6 0 L
Table 5. Values of Vulnerability Indicators
Source: Comparable Social Vulnerability Profiling – CSVP Case Study: Croatia (2015)
Comparable Social Vulnerability Profiling (CSVP) tested in Croatia in fact presents a very simplified and
user friendly method that can be implemented even at the local level without the need for expert support
wherefore it basically provides a foundation for future project planning (see Annex 4 for more details on the
methodology).
Therefore, the CSVP methodology relies on the following two important pillars: data simplicity and
comparability.The aim of the method is to present a systematic and logical process to determine vulnerability
data disaggregation, which is easily understandable and essentially of a rather simplified nature, meaning
that no weighting was added to the indicators.
In order to address the problem of vulnerability data that were scattered, inconsistent and in need of
systematization, the CSVP opted to use the census data as they are collected systematically and then
professionally analyzed by the Croatian Bureau of Statistics.
SOCIAL VULNERABILITY INDICATORS
SOCIAL VULNERABILITY ASSESSMENT TOOLS FOR CLIMATE CHANGE AND DRR PROGRAMMING 27
Furthermore, these data are temporally consistent (the Census is conducted every ten years), easy to use
and in that sense, fully adaptable to the needs of this social vulnerability methodology. Furthermore, census
based data collection/analysis has to be: a) related to some sort of geographic scale (level of municipality/
city/county) sufficient to identify demographic differences determining the location of vulnerable population
groups; and b) flexible and, most importantly, applicable in different phases of the disaster cycle and different
event types, depending on how the readily accessible components best fit the user’s needs.
Still, the use of such census based data (in this case CSVP) may have some limitations. One of the limitations is
the rapidly changing composition of an area in the past few years.This can be caused by rapid and large-scale
migration or triggered by population relocation due to extreme natural disasters. In that context, the census
data, having a 10-year temporal span, can be considered outdated.
Another problem arising from the use of census data is that the census firstly registers the people’s permanent
residence and not their temporary residence. Secondly, the census registers the people by where they live, not
necessarily by where they work so that the question of commuters also presents a limitation in the process.
However, as already noted, even though it understood census data limitations, the CSVP opted to use census
data since it had no other option and the data served the purpose.
SOCIAL VULNERABILITY INDICATORS
28 SOCIAL VULNERABILITY ASSESSMENT TOOLS FOR CLIMATE CHANGE AND DRR PROGRAMMING
In this phase of the SVA, primary data (in most cases collected through surveys) and secondary data (in most
cases these would be the census data or other data collected by the public administration) are collected. F2F/
field surveys (CAPI or paper-pencil), telephone surveys (CATI), or web-based (online) surveys can be used as a
data collection method.
The choice of the particular data collection method will depend on the available budget (field surveys being
the most expensive and online surveys the least expensive in most cases), time constraints (field surveys being
the most time-consuming) and sampling issues (phone connection coverage, Internet connection coverage).
Whichever is chosen, it is preferable to use automated methods of data entry based on online platforms.
For example, in case of field surveys, it would be preferable to use laptops or tablets with a wireless connection
in order to be able to directly enter the collected data into a database. Similarly, a telephone survey should
preferably involve direct data entry (computer-assisted telephone interviewing).
All variables should be defined at the highest possible measurement level. For example, the interval
measurement level should be used whenever possible, i.e. variable levels should be collapsed into classes
only when necessary (when a variable is of an ordinal nature, or when some data are deemed personal by
the respondents). If response classes (ordinal variables) are used, the number of classes should be as high
as possible (i.e., the data should be as precise as possible) in order to be able to proceed with a meaningful
quantitative analysis (principal component analysis).
For instance, if age categories (classes) are used, they should be as wide as possible. The variables should
be standardized (e.g., z-values) and subjected to the principal component analysis in order to check their
dimensionality and avoid redundancy, and to produce the composite social vulnerability index score for every
geographic unit.
Geographic units can be divided into several groups (e.g., low-risk, medium-risk, high-risk) depending on
the value of the index. Comparability across the studies can be ensured by using percentiles as cut-off lines.
For example, low-risk units can be classified as those below the 20th percentile, medium- risk units as those
between the 20th and 80th percentiles, and high-risk units as those scoring at the 80th percentile or more.
When conducting the principal component analysis, it is customary to select factors with Eigenvalues higher
than one, to exclude outliers (e.g., z-values larger than five), and to substitute the means of the variables for
the missing values. Additionally, the factor solution can be validated through use of scree plots and/or parallel
analysis.
The extracted factors should be rotated using orthogonal rotation, such as Varimax rotation. After the final
factor solution, scores are calculated, indicating the level of social vulnerability of a geographic unit at issue.
The factors need to be theoretically interpreted before adding factor scores in order to produce the composite
index of social vulnerability.
INDEX CALCULATION AND APPLICATION
SOCIAL VULNERABILITY INDICATORS
SOCIAL VULNERABILITY ASSESSMENT TOOLS FOR CLIMATE CHANGE AND DRR PROGRAMMING 29
Namely, the results/number of points of factors increasing social vulnerability should be given plus signs,
and the results/number of points of factors decreasing social vulnerability should be given minus signs.
It also needs to be noted that the number of geographic units should be sufficiently high to enable the
implementation of a meaningful and reliable principal component analysis. As a rule of thumb, the ratio of
sample size (number of units) and number of variables should be at least 5-10 (Cattell, 1978; Everitt, 1975).
As per mapping the results of a social vulnerability study, different tools and approaches can be used,
depending on their availability and the preferences of the authors of the study. For example, the simplest
method of map development that can be used for the project preparation phase is in fact the use of image
editing software (e.g., MS Paint) or any other free or licensed software tools.
For example, an online map-making tool Mapchart.net provides the possibility of subdividing a country into
administrative units of different levels and painting them in different colors (the background and the border
colors of the map can also be changed). The created map can be saved as an image and used in research
reports. Similar opportunities are provided by National Geographic Interactive, Scribble Maps, and other
tools14
.
There are also some other inexpensive, web based and open source GIS tools that can support geospatial
analysis of social vulnerability data and plotting data points of maps, such as R map-making packages and free
DevInfo. More experienced users can opt for the ArcGIS and/or GRASS GIS tools, but the most important thing
to note is that, no matter which map-making tool one chooses, it is in fact all about creating, manipulating
and visualizing the collected social vulnerability data, or, for that matter, any other data in a map.
No matter which GIS model is used, it is envisaged that social vulnerability visualization will be supported by
the provision of relevant geospatial information and its connection to the respective vulnerability indicators.
GIS data presented in such a manner can furthermore provide pointers for structured DRR/CCA reduction
prevention and preparedness planning and adequate disaster response.
14
For examples of social vulnerability mapping, see Annex 2.
The choice of the appropriate data collection method should be based on
local circumstances, budget constraints, and project goals.
SOCIAL VULNERABILITY INDICATORS
30 SOCIAL VULNERABILITY ASSESSMENT TOOLS FOR CLIMATE CHANGE AND DRR PROGRAMMING
Figure 2. Example of Social Vulnerability Index Mapping Created by MS Paint (CSVP Croatia)
Figure 3. Example of SV Index Mapping Created by Mapchart.net (Fictional Results)
Low
Medium low
Medium
Medium high
High
High
Medium
Low
SOCIAL VULNERABILITY INDICATORS
SOCIAL VULNERABILITY ASSESSMENT TOOLS FOR CLIMATE CHANGE AND DRR PROGRAMMING 31
INDEX VALIDATION
In this stage of the study, the validity of the index will be checked. This can be done in two ways. One involves
qualitative research (in-depth interviews, Delphi method, focus groups) with the key informants (local experts
and stakeholders) who will check the value of the index for the geographic units from their own perspective.
The selection of the qualitative method will have to take into account the same considerations as the ones
borne in mind during the development of the preliminary list of indicators. Validity can also be checked by
calculating correlation with the number of disaster declarations in the geographic unit, or another measure
of disaster frequency and severity, if available. After validation, the final list of indicators and final index scores
will be calculated.
INDEX CALCULATED. WHAT NEXT?
An index calculation disaggregation exercise should serve a well-defined purpose. The primary question to
answer is Why are we doing it? One major reason is (or can be) to provide better inputs into local policy
making. For that purpose, however, the index should be consistent in terms of inputs, outputs, and outcomes
(and ideally impact) - what exactly are we measuring?
It should be clearly understood (and communicated) in vulnerability debates that the index is the starting
point, not the end.The calculation of the index only makes sense if it is linked to a broader set of disaggregated
indicators for a more in-depth analysis and better argumentation of the underpinning assumptions, or linked
to qualitative tools, which help identify and test the solutions. The contextual linkages will then become
clearer and the information the index components provide (for example how a certain municipality or group
of people has reached its (non-)vulnerability level, where it lags behind, etc.) will be relevant from the policy
and practice perspectives.
The index can be used for a number of mutually non-exclusive purposes, including comparison, diagnostics,
and monitoring. The Buffalo Regional Institute’s Resilience Capacity Index (RCI)15
is an example of using the
index for comparison. RCI is a single statistic summarizing a region’s status on twelve factors hypothesized to
influence the ability of a region to bounce back from a future unknown stress. The index permits comparisons
across metropolitan regions and identification of strong and weak conditions relative to other metropolitan
regions.
The ARUP/Rockefeller Foundation’s City Resilience Index16
is an example of using the index as a diagnostic tool,
which gives cities a tool to understand their resilience, and shape urban planning, practice and investment.
Each city’s resilience profile is generated by assessing its current state against 12 goals and 52 indicators. This
provides a holistic overview of a city’s resilience across four key dimensions: People, Organization, Place, and
Knowledge. Index can be used for monitoring through repeating calculations.
15
http://brr.berkeley.edu/rci/
16
http://www.cityresilienceindex.org/
CONCLUSIONS AND RECOMMENDATIONS
32 SOCIAL VULNERABILITY ASSESSMENT TOOLS FOR CLIMATE CHANGE AND DRR PROGRAMMING
Disaster statistics in the past twenty years show a higher percentage of women, children and other socially
vulnerable groups among disaster victims. There is no question that socially vulnerable people are more
exposed to and affected by the impacts of climate change and disasters. For that reason, recognition and
understanding of the social vulnerability of various groups at the local, regional and country levels can
significantly reduce damages and losses and provide the most appropriate interventions for adaptations and
risk management.
Social vulnerability is most commonly defined as “the differential capacity of groups and individuals to deal
with hazards, based on their positions within physical and social worlds” (Dow, 1992), or as “the inability to
take effective measures to insure against losses”(Bogard, 1989).
Although there are dozens of social vulnerability methodologies used worldwide, they are not systematically
integrated into the overall process of climate and disaster risk management. There are a number of
methodological issues in defining and mapping the socially vulnerable population among the overall
population.
Almost all SVA methodologies use parameters, such as household income, gender, age, disability, language,
literacy or family status, but still there is a significant problem with data availability (i.e. census, pre- and post-
disaster studies, public surveys, etc.). In many countries or their regions, the data do not exist, are outdated
or of poor quality. Some of the social vulnerability parameters, such as level of education, age, gender etc.,
are collected at the individual level, while others, such as infrastructure quality and urban/rural division, are
collected at the community level.
The UNDP pilot projects referred to in this Guide addressed various climate-induced threats and impacts,
targeting the most vulnerable communities at the country and provincial levels, and focusing on building
resilience and ensuring sustainable development. Some of them used census data (Macedonia, Croatia), some
used data obtained through surveys (Kyrgyzstan and Georgia, for example), while others only used the data
obtained through screening and quantification of potential risks in a particular area (Rioni Basin in Georgia
and the Nepal, Peru and Uganda study).
In conclusion, a study of social vulnerability should provide a valid and reliable list of indicators that can
classify geographic units of various sizes and levels by their vulnerability to specific natural hazards. Such a
study should comprise the following three main stages: 1) indicator development, 2) index calculation and
application, and 3) index validation.
The preliminary list of indicators based on the local context and on the screening of the baseline situation
should be developed in the first stage.This can be done by desk research, in-depth interviews, Delphi-method,
focus groups, etc. The so-called Social Vulnerability Index (SoVI) can serve as a good starting point.
In the second stage – index calculation and application – the SVA study will take primary data (mainly from
surveys)and/orsecondarydata(inmostcasescensusdataorotherdatacollectedbythepublicadministration).
CONCLUSIONS AND RECOMMENDATIONS
SOCIAL VULNERABILITY ASSESSMENT TOOLS FOR CLIMATE CHANGE AND DRR PROGRAMMING 33
The variables used in the study should be standardized and subjected to a principal component analysis in
order to check their dimensionality and avoid redundancy. A composite social vulnerability index score for
every geographic unit should be produced in result. Geographic units can be divided into several groups (e.g.,
low-risk, medium-risk, high-risk), depending on the value of the index.
In the third and final stage, a validity check of the index will be carried out either through qualitative research
with the key informants (such as local experts and stakeholders), or by calculating correlations with the
number of disaster declarations in the geographic unit, or another available measure of disaster frequency
and severity. After validation, the final list of indicators and final index scores is to be calculated. The final data
should be provided in numerical form, as well as through mapping (i.e. visual representation).
ANNEX 1
34 SOCIAL VULNERABILITY ASSESSMENT TOOLS FOR CLIMATE CHANGE AND DRR PROGRAMMING
The purpose of this Annex is to present indicative timelines so that UNDP project managers can plan their
activities in order to conduct social vulnerability studies. This Annex outlines indicative timelines which are
tentative, depend on the country, level of capacity, data availability, type of hazard, etc. It can also be assumed
that timelines and study budgets are interdependent.
SVA INDICATIVE TIMELINES
SIZE
INDICATORS
DEVELOPMENT
INDEX
CALCULATION
INDEX
VALIDATION
TOTAL
DURATION
City/municipality
Desk research
(1 month)
1 month - 2 months
County
Desk research
(2 months)
1 month - 3 months
State
Desk research
(3 months)
1 month - 4 months
Figure 4. Indicative Timeline for Conducting a Simplified SVA
The above Figure 4 presents the most simplified version of a SVA when its implementation does not include
qualitative research in Stage 1 (indicator development) and Stage 3 (index validation). The timeline changes
and reflects the size of the geographic area (city, state, region) targeted by the SVA.
INDICATORS
DEVELOPMENT
1 MONTH 1 MONTH
INDEX
CALCULATIONS
ANNEX 1
SOCIAL VULNERABILITY ASSESSMENT TOOLS FOR CLIMATE CHANGE AND DRR PROGRAMMING 35
INDICATORS
DEVELOPMENT
INDEX
CALCULATIONS
1 MONTH 1 MONTH 1 MONTH
INDEX
VALIDATION
LEVEL OF
RESEARCH
INDICATORS DEVELOPMENT
INDEX
CALCULATION
INDEX
VALIDATION
TOTAL
City/
municipality
1. Desk research (1 month)
2. In-depth interviews (10
interviews) (1 month) or
Focus groups (1 month) or
Delphi method (1 month)
1 month 1 month 4 months
County
1. Desk research (2 months)
2. In-depth interviews (10
interviews) (1 month) or
Focus groups (1 month) or
Delphi method (1 month)
1 month 1 month 5 months
State
1. Desk research (3 months)
2. In-depth interviews (10
interviews) (1 month) or
Focus groups (1 month) or
Delphi method (1 month)
1 month 1 month 6 months
Figure 5. Indicative Timeline for Conducting a Mid-Level Complexity SVA
The above Figure 5 presents the mid-level complexity version of a SVA, the implementation of which
includes qualitative research in Stage 1 (indicator development) and correlational validation in Stage 3 (index
validation). The timeline changes and reflects the size of the geographic area (city, state, region) targeted by
the SVA.
ANNEX 1
36 SOCIAL VULNERABILITY ASSESSMENT TOOLS FOR CLIMATE CHANGE AND DRR PROGRAMMING
The above Figure 6 presents the complex version of a SVA, the implementation of which involves qualitative
research in Stage 1 (indicator development) and qualitative validation in Stage 3 (index validation). The
timeline changes and reflects the size of the geographic area (city, state, region) targeted by the SVA.
Figure 6. Indicative Timeline for Conducting a Complex SVA
INDICATORS
DEVELOPMENT
INDEX
CALCULATIONS
2 MONTHS 1 MONTH 1 MONTH
INDEX
VALIDATION
LEVEL OF
RESEARCH
INDICATORS DEVELOPMENT
INDEX
CALCULATION
INDEX
VALIDATION
TOTAL
City/
municipality
1. Desk research (1 month)
2. In-depth interviews (10
interviews) (1 month) or
Focus groups (1 month) or
Delphi method (1 month)
1 month 1 month 5 months
County
1. Desk research (2 months)
2. In-depth interviews (10
interviews) (1 month) or
Focus groups (1 month) or
Delphi method (1 month)
1 month 1 month 6 months
State
1. Desk research (3 months)
2. In-depth interviews (10
interviews) (1 month) or
Focus groups (1 month) or
Delphi method (1 month)
1 month 1 month 7 months
ANNEX 2
SOCIAL VULNERABILITY ASSESSMENT TOOLS FOR CLIMATE CHANGE AND DRR PROGRAMMING 37
17
Costs needed to manage the entire process were not included in this estimation.
Costs of the study17
vary significantly from one country to another. Costs related to the market research and
public opinion polling are estimated for mid-range countries of the ESOMAR Global Prices Study, such as
Croatia, Serbia, Romania, Bulgaria, Ukraine, etc. The price levels are higher in more developed nations and
lower in less developed countries.
Countries with the highest price levels, such as Switzerland, the UK, Sweden, Germany, Denmark, France and
the Netherlands, probably have about 50% higher prices than those listed in Table 6 below.
Estimated costs are higher if an additional survey research needs to be performed to collect the data that
cannot be collected from official statistics, or if the data are outdated/unreliable. The estimated survey
research costs are listed in Annex 2.
TheresponsibilitiesforthespecificstagesoftheresearchshouldbedividedbetweentheSVAexpert/consultant
and the market research/public opinion company. Namely, it is recommended that the company should be
responsible for the survey research, as well as for qualitative research (in-depth interviews, focus groups,
Delphi method), whereas the SVA expert/consultant should perform the desk research, index calculation and
validation.
The SVA expert/consultant should also assist the company in developing its part of the research (interview
guide, focus group guide, etc.). The costs of the expert/consultant are calculated on the premise of a $200
daily fee (other expenses excluded). It is expected that version one (seeTable 6 below) shall require 30 expert’s
working days, version two 45 working days, and version three 60 working days.
SVA COST ESTIMATES
SIZE INDICATOR DEVELOPMENT
INDEX
CALCULATION
INDEX
VALIDATION
TOTAL
COSTS
City/
municipality
Desk research 4000 2000 - 6000
County Desk research 4000 2000 - 6000
State Desk research 4000 2000 - 6000
Table 6. SVA Costs without Qualitative Research in Stage 1 and without Stage 3 (in USD)
ANNEX 2
38 SOCIAL VULNERABILITY ASSESSMENT TOOLS FOR CLIMATE CHANGE AND DRR PROGRAMMING
Table 7. SVA Costs with Qualitative Research in Stage 1 and Correlational Validation in Stage 3 (in USD)
LEVEL OF
RESEARCH
INDICATORS DEVELOPMENT
INDEX
CALCULATION
INDEX
VALIDATION
TOTAL
City/
municipality
1. Desk research 4000
2. In-depth interviews (10 interviews)
(2000) or
Focus groups (2000) or
Delphi method (1000)
3000 2000
10000 –
11000
County
1. Desk research 4000
2. In-depth interviews (10 interviews)
(2000) or
Focus groups (2000) or
Delphi method (1000)
3000 2000
10000 –
11000
State
1. Desk research 4000
2. In-depth interviews (10 interviews)
(2000) or
Focus groups (2000) or
Delphi method (1000)
3000 2000
10000 –
11000
Table 8. SVA Costs with Qualitative Research in Stage 1 and Qualitative Research Validation in Stage 3 (in USD)
LEVEL OF
RESEARCH
INDICATORS DEVELOPMENT
INDEX
CALCULATION
INDEX
VALIDATION
TOTAL
City/
municipality
1. Desk research (4000)
2. In-depth interviews (10 interviews)
(2000) or
Focus groups (2000) or
Delphi method (1000)
3000 2000
13000 –
15000
County
1. Desk research (4000)
2. In-depth interviews (10 interviews)
(2000) or
Focus groups (2000) or
Delphi method (1000)
3000 2000
7000 -
11000
State
1. Desk research (4000)
2. In-depth interviews (10 interviews)
(2000) or
Focus groups (2000) or
Delphi method (1000)
3000 2000
7000 -
11000
ANNEX 2
SOCIAL VULNERABILITY ASSESSMENT TOOLS FOR CLIMATE CHANGE AND DRR PROGRAMMING 39
Type/Sample Size N=500 N=1000 N=2000
Online 1500 - 2000 3000 – 4000 6000 – 8000
CATI 2000 – 2500 4000 – 5000 8000 – 10000
F2F 3000 – 3500 6000 – 7000 12000 – 14000
Table 9. Estimated Survey Costs in USD (Data Collection, Average Duration 15 Minutes)
Note: These market research and public opinion polling costs are estimated (according to the ESOMAR Global
Prices Study) for mid-range countries, such as Croatia, Serbia, Romania, Bulgaria, Ukraine, etc.
The price levels are higher in more developed countries and lower in less developed countries.
Countries with the highest price levels, such as Switzerland, the UK, Sweden, Germany, Denmark, France and
the Netherlands, probably have about 50% higher prices than those listed in the above Table.
ANNEX 3
40 SOCIAL VULNERABILITY ASSESSMENT TOOLS FOR CLIMATE CHANGE AND DRR PROGRAMMING
The SVA expert/consultant shall:
1.	 Conduct desk research
2.	 Develop social vulnerability indicators based on the desk research and qualitative and (possibly) 	
	 quantitative research conducted by a market research/public opinion company
3.	 Assist the market research/public opinion company in developing interview/focus group/Delphi 	
	 method guides for the pilot research and validation research
4.	 Assist the market research/public opinion company in developing a survey questionnaire (in case a 	
	 survey will be conducted)
5.	 Calculate social vulnerability indexes, map the results and prepare the research report
OUTLINE OF THE TERMS OF REFERENCE (DELIVERABLES)
The market research/public opinion company shall:
1.	 Develop interview/focus group/Delphi method guides for pilot research and validation research in 	
	 cooperation with the expert/consultant
2.	 Conduct focus groups/interviews, Delphi method research and prepare the data transcripts
3.	 Develop a survey questionnaire in cooperation with the expert/consultant (in case a survey will be 	
	conducted)
4.	 Conduct a survey and deliver the survey research data in the appropriate form (in case a survey will 	
	 be conducted)
ANNEX 4
SOCIAL VULNERABILITY ASSESSMENT TOOLS FOR CLIMATE CHANGE AND DRR PROGRAMMING 41
COMPARABLE SOCIAL VULNERABILITY PROFILING (CSVP) –
CASE STUDY IN CROATIA
Comparable Social Vulnerability Profiling (CSVP) tested in Croatia in 2015 presents a very simplified and
user friendly method that can be implemented even at the local level without the need for expert support
wherefore it basically provides a foundation for future project planning. The CSVP methodology relies on two
important pillars: data simplicity and comparability.
The CSVP opted to use the census data as they are collected systematically and then professionally analyzed by
the Croatian Bureau of Statistics. Furthermore, these data are temporally consistent (the Census is conducted
every ten years), easy to use and in that sense, fully adaptable to the needs of this social vulnerability
methodology.
Furthermore, census based data collection/analysis has to be: a) related to some sort of geographic scale
(level of municipality/city/county) sufficient to identify demographic differences determining the location
of vulnerable population groups; and b) flexible and, most importantly, applicable in different phases of the
disaster cycle and different event types, depending on how the readily accessible components best fit the
user’s needs.
In order to determine the vulnerability levels of the respective communities (municipalities/cities) within one
area (at the county or national level), all the results derived from the respective vulnerability assessments were
compared with the common denominator – in this particular case, seven respective communities (villages,
municipalities, cities) were compared with the higher level territorial unit i.e. a county.
Selection of CSVP Variables
Selected variables comprising CSVP indicators were restricted to quantifiable indicators. Furthermore, the
CSVP was limited exclusively to vulnerability indicators so that no hazard indicators were included in the
study. In line with the 2011 Census data, six vulnerability indicators were included: Age, Gender, Disability/
Dependency, Income, Minorities and Education.
The CSVP does not apply weights to vulnerability indicators, therefore the six presented indicators are
considered to be independent and equally important variables. The reasoning behind this decision is that
standardization in terms of the weighting and aggregation of indicators is a subjective process and different
methods of weighting and aggregation may lead to conflicting results.
Moreover, even though any single one of the given indicators in isolation does not have to make a person
vulnerable, a combination of these indicators, or the relationship between the indicators, may render an
individual highly vulnerable18
. As such a process would call for a more comprehensive study, the CSVP does
not explore these effects of combinations of particular indicator values compared with other combinations.
18
Dwyer et al., 2004
ANNEX 4
42 SOCIAL VULNERABILITY ASSESSMENT TOOLS FOR CLIMATE CHANGE AND DRR PROGRAMMING
The CSVP uses the experiences of SoVI – the Social Vulnerability Indicator (analyzing 11 key variables from the
U.S. Census)19
but it is still closer to Social Vulnerability Profiling (SVP), which is similar to SoVI but uses fewer
variables. Furthermore, the CSVP, which applies the same methodology as SVP, is performed by obtaining the
relevant census information for each of the indicator variables for the project area at the appropriate level of
the spatial scale.
Once the data have been assembled, they can be summarized using basic percentages and proportions to
compare and contrast areas. As opposed to the SoVI, it does not employ a statistical procedure to generate
vulnerability dimensions. The method provides a simpler and more straightforward way of characterizing
socially vulnerable populations than the SoVI20
. Therefore, this paper presents the CSVP variables, derived
from the 2011 Census in Croatia, in total figures and in percentages, thus creating a background for simplified
comparable analysis.
Each of the six vulnerability indicators with associated increased vulnerability namely population under 15
and over 65 years of age, female population, population without secondary education, vulnerable minorities,
population without income and disabled/dependent population is marked with a plus sign “+“ and colored
red as that group is considered more vulnerable to natural disasters.
On the other hand, population between 15 and 65 years of age, male population, population with secondary
or higher education, majority population-majorities, population with income and population without a
disability/dependency is marked with a minus sign “-” and colored green as that group is considered less
vulnerable to natural disasters.
The share of the CSVP vulnerable population group in the total population is then calculated in the following
manner:
19
http://webra.cas.sc.edu/hvri/products/soci.aspx
20
Social vulnerability to natural hazards – Sue Tapsell, Simon McCarthy, Hazel Faulkner, Megan Alexander – Flood Hazard Research Centre
(FHRC), Middlesex University
CSVP variable (CSVPv) =
Total number of vulnerable group
Total number of population
X 100%
Once all the vulnerability variables are mathematically calculated they are all included in one overall table
representing the Comparable Social Vulnerability Profile of the respective municipality/city/county.This CSVP
“ID-card”is the foundation for all the comparisons that will follow in step two. In this calculation segment, once
all the vulnerability variables are calculated and presented in overall vulnerability tables, the calculated figures
can be compared head-to-head between the respective municipalities, cities and counties. Comparisons
can also be made between the above mentioned categories as long all the vulnerability variables can be
compared.
As mentioned, vulnerability variables are presented as a share of the respective category in the total
population. Only variables recognized as increasing the level of vulnerability are being compared (marked
with the plus sign“+“and colored red).
SOCIAL VULNERABILITY ASSESSMENT TOOLS FOR CLIMATE CHANGE AND DRR PROGRAMMING 43
Theresultofthiscomparisonispresentedforeachvulnerabilitycategoryrespectively(e.g.aspecificcommunity
can have higher vulnerability in terms of the AGE variable and lower vulnerability in the EDUCATION variable).
And finally, as there are six vulnerability categories represented without weighting, meaning that they are all
of equal value, overall comparison is conducted in the following manner: a community having 4, 5 or 6 higher
vulnerability categories is recognized as more vulnerable (as opposed to a community with 1 or 2 higher
vulnerability categories, which is recognized as less vulnerable). In case more than one of the compared
communities have three vulnerability categories, all of them are recognized as equally vulnerable.
And finally, in order to determine the vulnerability levels between the respective communities (municipalities/
cities) within one area (at the county or national level), all the results derived from the respective vulnerability
tables need to be compared against a common denominator - either a county or the state. Each respective
community vulnerability variable is then compared with the reference vulnerability variable. If the respective
community vulnerability variable is higher than the reference vulnerability variable, it is colored red. In the
opposite case, it is colored green, meaning that the vulnerability of the community is lower than that of its
reference point (county/state) with respect to that particular variable..
Vulnerability variables colored red (higher than the reference vulnerability) are then added up and presented
by a value ranging from zero to“plus”six (0 to +6). This field is also colored red.
Vulnerability variables colored green (lower than the reference vulnerability) are then added up and presented
by a value ranging from zero to“minus”six (0 to -6). This field is also colored green.
Overall community (municipality/city) vulnerability when cross-referenced to the common denominator
(county/state) is determined in the following manner:
•	 Communities with zero or one (0 or 1) higher vulnerability variables (colored red and marked with a 	
	 plus sign) are recognized as“low vulnerability communities”and colored green
•	 Communities with two (2) higher vulnerability variables (colored red and marked with a plus sign) 	
	 are recognized as“medium-low vulnerability communities”and colored light-green
•	 Communities with three (3) higher vulnerability variables (colored red and marked with a plus sign) 	
	 are recognized as“medium vulnerability communities”and colored yellow
•	 Communities with four (4) higher vulnerability variables (colored red and marked with a plus sign) 	
	 are recognized as“medium-high vulnerability communities”and colored orange
•	 Communities with five or six (5 or 6) higher vulnerability variables (colored red and marked with a 	
	 plus sign) are recognized as“high vulnerability communities”and colored red
The final result of this calculation method is presented inTable 10 below where all the cities and municipalities
in a Croatian county were analyzed by using the county level as the common denominator.
ANNEX 4
ANNEX 4
44 SOCIAL VULNERABILITY ASSESSMENT TOOLS FOR CLIMATE CHANGE AND DRR PROGRAMMING
Table 10. CSVP Vulnerability Table – Final Result
Source: Comparable Social Vulnerability Profiling – CSVP Case Study: Croatia (2015)
CSVP Comparability Table Lika-Senj County
CSV Profile
Age
(v)
Gender
(v)
Education
(v)
Minority
(v)
Income
(v)
Disability
(v)
RESULT CSVP
Lika-Senj 43.96% 50.23% 57.67% 14.76% 29.34% 20.65% REFERENCE
Lovinac 50.55% 48.16% 61.47% 16.48% 23.04% 18.67% -3 +3 M
Brinje 40.69% 50.58% 67.69% 6.54% 35.04% 25.49% -2 +4 M-H
Donji Lapac 38.76% 49.69% 57.31% 80.97% 18.22% 18.84% -5 +1 L
Gospić 37.23 50.33% 56.43% 6.02% 30.83% 20.21% -4 +2 M-L
Karlobag 40.13% 50.49% 54.42% 4.14% 24.54% 23.45% -4 +2 M-L
Novalja 37.1% 49.3% 52.01% 3.38% 30.74% 14.14% -5 +1 L
Otočac 37.49% 49.99% 42.11% 7.83% 32.51% 20.09% -5 +1 L
Perušić 46.1% 49.7% 67.32% 8.91% 25.44% 25.36% -3 +3 M
Plitvička J. 37.34% 51.13% 57.42% 28.17% 30.76% 18.39% -3 +3 M
Senj 34.88% 50.61% 52.98% 2.3% 27.67% 16.42% -5 +1 L
Udbina 42.74% 50.43% 63.98% 52.35% 22.41% 26.31% -2 +4 M-H
Vrhovine 40.19% 50.76% 57.06% 80.96% 21.87% 14.12% -4 +2 M-L
Low HighMedium
Medium
low
Medium
high
SOCIAL VULNERABILITY ASSESSMENT TOOLS FOR CLIMATE CHANGE AND DRR PROGRAMMING 45
REFERENCES
Bergstrand, Kelly; Mayer, Brian; Brumback, Babette, Zhang, Yi (2015). Assessing the Relationship Between
Social Vulnerability and Community Resilience to Hazards. Social Indicators Research, 122: 391-409.
Bogard,W.C. (1989). Bringing social theory to hazards research: conditions and consequences of the mitigation
of environmental hazards. Sociological Perspectives, 31: 147-168.
CAMP Alatoo: Testing of Climate Risk Assessment Methodology in Kyrgyzstan (2013)
Cattell, R.B. (1978). The Scientific Use of Factor Analysis. New York: Plenum.
Chattopadhyay, Sandip; Dasgupta, Ranjan (2015). Demographic and Socioeconomic Impact on Risk Attitudes
of the Indian Investors – An Empirical Study. Asian Economic and Financial Review, 5(4):601-623.
Cutter, S.L.; Boruff, B.J.; Shirley, W.L. (2003). Social Vulnerability to Environmental Hazards. Social Science
Quarterly, 84(2): 242-261.
Comparable Social Vulnerability Profiling – CSVP Case Study: Croatia (2015).
Dohmen, T., A. Falk, D. Huffman, U. Sunde, J. Schupp and G. G. Wagner. (2005). Individual Risk Attitudes: New
Evidence from a Large, Representative, Experimentally-Validated Survey. Discussion Papers of DIW Berlin 511,
DIW Berlin, German Institute for Economic Research.
Douglas, Mary; Wildavsky, Aaron (1982). Risk and Culture: An Essay on the Selection of Technological and
Environmental Dangers. Berkeley and Los Angeles: University of California Press.
Dow, K. (1992). Exploring Differences in Our Common Future(s): The Meaning of Vulnerability to Global
Environmental Change. Geoforum, 23: 417-436.
Emrich, C. T. 2005. Social Vulnerability in US Metropolitan Areas: Improvements in Hazard Vulnerability
Assessment. PhD dissertation, University of South Carolina, Columbia, SC.
Everitt, B.S. (1975). Multivariate Analysis: The Need for Data, and Other Problems. British Journal of Psychiatry,
126: 237-240.
Gassmann, F., Berulava, G.,Tokmazishvili, M. (2013): Economic and SocialVulnerability in Georgia UNDP.Harris,
Christine R.; Jenkins, Michael; Glaser, Dale (2006). Gender Differences in Risk Assessment:Why doWomenTake
Fewer Risks than Men? Judgment and Decision Making, 1(1): 48-63.
Hartog, Joop; Ferrer-i-Carbonell, Ada; Jonker, Nicole (2002). Linking Measured Risk Aversion to Individual
Characteristics. Kyklos, 55(1): 3-26.
Holand, I.S.; Lujala, P.; Rød, J.K. (2011). Social vulnerability assessment for Norway: A quantitative approach,
NorskGeografiskTidsskrift - Norwegian Journal of Geography, 65:1-17.
Holand, I.S.; Lujala, P. (2013). Replicating and Adapting an Index of Social Vulnerability to a New Context: A
Comparison Study for Norway. The Professional Geographer, 65(2): 312–328.
46 SOCIAL VULNERABILITY ASSESSMENT TOOLS FOR CLIMATE CHANGE AND DRR PROGRAMMING
REFERENCES
Kim, De-Yeong; Park, Junsu (2010). Cultural differences in risk: The group facilitation effect. Judgment and
Decision Making, 5(5): 380-390.
Lau, Lai-Yin; Ranyard, Rob (2005). Chinese and English Probabilistic Thinking and Risk Taking in Gambling.
Journal of Cross-Cultural Psychology, 36(5): 621-627.
Nelson, Judy (2012). Are Women Really More Risk-Averse than Men? Global Development and Environment
Institute Working Paper No. 12-05. Medford (MA): Tufts University.
Nieboer, Jeroen (2013). Risk taking in diverse groups: Gender matters. CeDEx Discussion Paper Series,
Discussion Paper No. 2013-06. Nottingham: University of Nottingham.
Oulahen, Greg, Mortsch, Linda, Tang, Kathy, Harford, Deborah (2015). Unequal Vulnerability to Flood Hazards:
“GroundTruthing”a SocialVulnerability Index of Five Municipalities in MetroVancouver, Canada. Annals of the
Association of American Geographers, 105(3): 473–495.
Park, Yoonkyung; Pradhan, Ananta Man Singh; Kim, Ungtae; Kim, Yun-Tae, and Kim, Sangdan (2016).
Development and Application of Urban Landslide Vulnerability Assessment Methodology Reflecting Social
and Economic Variables. Advances in Meteorology.
Shupp, R.S.; Williams, A.W. (2008). Risk preference differentials of small groups and individuals. The Economic
Journal, 118(525): 258-283.
Straus, Susan G.; Parker, Andrew M.; Dembosky, Jacob W. (2009). The Group Matters A Review of the Effects of
Group Interaction on Processes and Outcomes in Analytic Teams (Working Paper). RAND – National Security
Research Division.
SOCIAL VULNERABILITY ASSESSMENT TOOLS FOR CLIMATE CHANGE AND DRR PROGRAMMING 47
UNDP Istanbul Regional Hub
Key Plaza, Abide-I Hurriyet Cad. Istiklal Sk. No:11,
34381, Sisli, Istanbul, TURKEY
For more information: www.undp.org/
Copyright 2017, UNDP. Cover Photo by: UNDP Serbia

More Related Content

What's hot

Gis Project Proposal
Gis Project ProposalGis Project Proposal
Gis Project Proposallarsonk
 
MONITORING PENGELOLAAN LINGKUNGAN HIDUP
MONITORING PENGELOLAAN LINGKUNGAN HIDUPMONITORING PENGELOLAAN LINGKUNGAN HIDUP
MONITORING PENGELOLAAN LINGKUNGAN HIDUP
sukarja wirajaya
 
Kp 07 2010 standar penggambaran
Kp 07 2010 standar penggambaranKp 07 2010 standar penggambaran
Kp 07 2010 standar penggambaranArizki_Hidayat
 
Pengukuran Hidrografi (Dimas bayu)
Pengukuran Hidrografi (Dimas bayu)Pengukuran Hidrografi (Dimas bayu)
Pengukuran Hidrografi (Dimas bayu)
afifsalim12
 
Applications of Arc GIS
Applications of Arc GISApplications of Arc GIS
Applications of Arc GIS
ExtraPDFs
 
Image enhancement and interpretation
Image enhancement and interpretationImage enhancement and interpretation
Image enhancement and interpretationDocumentStory
 
Problemas con numeros racionales.1
Problemas con numeros racionales.1 Problemas con numeros racionales.1
Problemas con numeros racionales.1
Miguel Acero
 
Remote Sensing error sources
Remote Sensing error sourcesRemote Sensing error sources
Remote Sensing error sourcesGilbert Okoth
 
Data collection and input overview
Data collection and input overviewData collection and input overview
Data collection and input overview
srinivas2036
 
KULIAH(4&5) HITUNGAN PONDASI.UTS .pptx
KULIAH(4&5) HITUNGAN PONDASI.UTS .pptxKULIAH(4&5) HITUNGAN PONDASI.UTS .pptx
KULIAH(4&5) HITUNGAN PONDASI.UTS .pptx
TediHermawan5
 
Mer 3.1 pendahuluan
Mer 3.1 pendahuluanMer 3.1 pendahuluan
Mer 3.1 pendahuluan
Angelina Ester
 
04 Dasar-dasar QGIS dan Plugin
04 Dasar-dasar QGIS dan Plugin04 Dasar-dasar QGIS dan Plugin
04 Dasar-dasar QGIS dan Plugin
OpenStreetMap Indonesia
 
ILWIS Manual, ILWIS Practical, ILWIS Guide, Onidex Geo-Spatial Solutions (ilw...
ILWIS Manual, ILWIS Practical, ILWIS Guide, Onidex Geo-Spatial Solutions (ilw...ILWIS Manual, ILWIS Practical, ILWIS Guide, Onidex Geo-Spatial Solutions (ilw...
ILWIS Manual, ILWIS Practical, ILWIS Guide, Onidex Geo-Spatial Solutions (ilw...
Oluwasegun Oluwaseun Onibudo
 
History of gis
History of gisHistory of gis
History of gis
Ehtisham Wajid
 
Croping citra satelit menggunakan global mapper versi 14
Croping citra satelit menggunakan global mapper versi 14Croping citra satelit menggunakan global mapper versi 14
Croping citra satelit menggunakan global mapper versi 14
National Cheng Kung University
 
03 r1 -_kapasitas_jalan_bebas_hambatan
03 r1 -_kapasitas_jalan_bebas_hambatan03 r1 -_kapasitas_jalan_bebas_hambatan
03 r1 -_kapasitas_jalan_bebas_hambatan
a_agung_kartika
 
QGIS training class 1
QGIS training class 1QGIS training class 1
QGIS training class 1
Hiroaki Sengoku
 
Contoh Pengerjaan Windrose
Contoh Pengerjaan WindroseContoh Pengerjaan Windrose
Contoh Pengerjaan Windrose
Nyak Nisa Ul Khairani
 

What's hot (20)

Gis Project Proposal
Gis Project ProposalGis Project Proposal
Gis Project Proposal
 
MONITORING PENGELOLAAN LINGKUNGAN HIDUP
MONITORING PENGELOLAAN LINGKUNGAN HIDUPMONITORING PENGELOLAAN LINGKUNGAN HIDUP
MONITORING PENGELOLAAN LINGKUNGAN HIDUP
 
Kp 07 2010 standar penggambaran
Kp 07 2010 standar penggambaranKp 07 2010 standar penggambaran
Kp 07 2010 standar penggambaran
 
rs and gis
rs and gisrs and gis
rs and gis
 
Pengukuran Hidrografi (Dimas bayu)
Pengukuran Hidrografi (Dimas bayu)Pengukuran Hidrografi (Dimas bayu)
Pengukuran Hidrografi (Dimas bayu)
 
Applications of Arc GIS
Applications of Arc GISApplications of Arc GIS
Applications of Arc GIS
 
Tugas Manajemen Survei dan Pemetaan
Tugas Manajemen Survei dan PemetaanTugas Manajemen Survei dan Pemetaan
Tugas Manajemen Survei dan Pemetaan
 
Image enhancement and interpretation
Image enhancement and interpretationImage enhancement and interpretation
Image enhancement and interpretation
 
Problemas con numeros racionales.1
Problemas con numeros racionales.1 Problemas con numeros racionales.1
Problemas con numeros racionales.1
 
Remote Sensing error sources
Remote Sensing error sourcesRemote Sensing error sources
Remote Sensing error sources
 
Data collection and input overview
Data collection and input overviewData collection and input overview
Data collection and input overview
 
KULIAH(4&5) HITUNGAN PONDASI.UTS .pptx
KULIAH(4&5) HITUNGAN PONDASI.UTS .pptxKULIAH(4&5) HITUNGAN PONDASI.UTS .pptx
KULIAH(4&5) HITUNGAN PONDASI.UTS .pptx
 
Mer 3.1 pendahuluan
Mer 3.1 pendahuluanMer 3.1 pendahuluan
Mer 3.1 pendahuluan
 
04 Dasar-dasar QGIS dan Plugin
04 Dasar-dasar QGIS dan Plugin04 Dasar-dasar QGIS dan Plugin
04 Dasar-dasar QGIS dan Plugin
 
ILWIS Manual, ILWIS Practical, ILWIS Guide, Onidex Geo-Spatial Solutions (ilw...
ILWIS Manual, ILWIS Practical, ILWIS Guide, Onidex Geo-Spatial Solutions (ilw...ILWIS Manual, ILWIS Practical, ILWIS Guide, Onidex Geo-Spatial Solutions (ilw...
ILWIS Manual, ILWIS Practical, ILWIS Guide, Onidex Geo-Spatial Solutions (ilw...
 
History of gis
History of gisHistory of gis
History of gis
 
Croping citra satelit menggunakan global mapper versi 14
Croping citra satelit menggunakan global mapper versi 14Croping citra satelit menggunakan global mapper versi 14
Croping citra satelit menggunakan global mapper versi 14
 
03 r1 -_kapasitas_jalan_bebas_hambatan
03 r1 -_kapasitas_jalan_bebas_hambatan03 r1 -_kapasitas_jalan_bebas_hambatan
03 r1 -_kapasitas_jalan_bebas_hambatan
 
QGIS training class 1
QGIS training class 1QGIS training class 1
QGIS training class 1
 
Contoh Pengerjaan Windrose
Contoh Pengerjaan WindroseContoh Pengerjaan Windrose
Contoh Pengerjaan Windrose
 

Similar to Social Vulnerability Assessment Tools for Climate Change and DRR Programming

Rand rr2637
Rand rr2637Rand rr2637
Rand rr2637
JA Larson
 
20090712 commodities in the if study undp exeuctive summarywith covers
20090712 commodities in the if study undp exeuctive summarywith covers20090712 commodities in the if study undp exeuctive summarywith covers
20090712 commodities in the if study undp exeuctive summarywith coversLichia Saner-Yiu
 
Global-Photovoltaic-Power-Potential-by-Country.pdf
Global-Photovoltaic-Power-Potential-by-Country.pdfGlobal-Photovoltaic-Power-Potential-by-Country.pdf
Global-Photovoltaic-Power-Potential-by-Country.pdf
SimonBAmadisT
 
Comprehensive Multi-year Plan - Universal Immunization Program Reaching Every...
Comprehensive Multi-year Plan - Universal Immunization Program Reaching Every...Comprehensive Multi-year Plan - Universal Immunization Program Reaching Every...
Comprehensive Multi-year Plan - Universal Immunization Program Reaching Every...
ITSU - Immunization Technical Support Unit
 
Rand rr2504z1.appendixes
Rand rr2504z1.appendixesRand rr2504z1.appendixes
Rand rr2504z1.appendixes
BookStoreLib
 
GAD-harmonized-gad-guidelines-2nd_ed_0 (1).pdf
GAD-harmonized-gad-guidelines-2nd_ed_0 (1).pdfGAD-harmonized-gad-guidelines-2nd_ed_0 (1).pdf
GAD-harmonized-gad-guidelines-2nd_ed_0 (1).pdf
JzaninnaSolBagtas
 
Comunis Project report
 Comunis Project report  Comunis Project report
IUCRC_EconImpactFeasibilityReport_FinalFinal
IUCRC_EconImpactFeasibilityReport_FinalFinalIUCRC_EconImpactFeasibilityReport_FinalFinal
IUCRC_EconImpactFeasibilityReport_FinalFinalJay Lee
 
Rand rr3242
Rand rr3242Rand rr3242
Rand rr3242
BookStoreLib
 
Rand rr3242 (1)
Rand rr3242 (1)Rand rr3242 (1)
Rand rr3242 (1)
BookStoreLib
 
Prediction of economical recession with the signal approach, and the turkey case
Prediction of economical recession with the signal approach, and the turkey casePrediction of economical recession with the signal approach, and the turkey case
Prediction of economical recession with the signal approach, and the turkey caseDeniz Özgür Tiryaki
 
Statistics and indicators for the post-2015 development agenda
Statistics and indicators for the post-2015 development agendaStatistics and indicators for the post-2015 development agenda
Statistics and indicators for the post-2015 development agenda
Department of Economic and Social Affairs (UN DESA)
 
Annual Report on Evaluation
Annual Report on EvaluationAnnual Report on Evaluation
Annual Report on Evaluation
Dr Lendy Spires
 
HUMAN DEVELOPMENT IMPACT-Trade policy toolkit
HUMAN DEVELOPMENT IMPACT-Trade policy toolkitHUMAN DEVELOPMENT IMPACT-Trade policy toolkit
HUMAN DEVELOPMENT IMPACT-Trade policy toolkitYumiko Yamamoto
 
ICTs_for_Child_Protection_Case_Management_Research_HealthEnabled
ICTs_for_Child_Protection_Case_Management_Research_HealthEnabledICTs_for_Child_Protection_Case_Management_Research_HealthEnabled
ICTs_for_Child_Protection_Case_Management_Research_HealthEnabledwcphilbrick
 

Similar to Social Vulnerability Assessment Tools for Climate Change and DRR Programming (20)

Rand rr2637
Rand rr2637Rand rr2637
Rand rr2637
 
20090712 commodities in the if study undp exeuctive summarywith covers
20090712 commodities in the if study undp exeuctive summarywith covers20090712 commodities in the if study undp exeuctive summarywith covers
20090712 commodities in the if study undp exeuctive summarywith covers
 
EvalInvStrats_web
EvalInvStrats_webEvalInvStrats_web
EvalInvStrats_web
 
Global-Photovoltaic-Power-Potential-by-Country.pdf
Global-Photovoltaic-Power-Potential-by-Country.pdfGlobal-Photovoltaic-Power-Potential-by-Country.pdf
Global-Photovoltaic-Power-Potential-by-Country.pdf
 
Comprehensive Multi-year Plan - Universal Immunization Program Reaching Every...
Comprehensive Multi-year Plan - Universal Immunization Program Reaching Every...Comprehensive Multi-year Plan - Universal Immunization Program Reaching Every...
Comprehensive Multi-year Plan - Universal Immunization Program Reaching Every...
 
Rand rr2504z1.appendixes
Rand rr2504z1.appendixesRand rr2504z1.appendixes
Rand rr2504z1.appendixes
 
GAD-harmonized-gad-guidelines-2nd_ed_0 (1).pdf
GAD-harmonized-gad-guidelines-2nd_ed_0 (1).pdfGAD-harmonized-gad-guidelines-2nd_ed_0 (1).pdf
GAD-harmonized-gad-guidelines-2nd_ed_0 (1).pdf
 
Comunis Project report
 Comunis Project report  Comunis Project report
Comunis Project report
 
Thesis
ThesisThesis
Thesis
 
IUCRC_EconImpactFeasibilityReport_FinalFinal
IUCRC_EconImpactFeasibilityReport_FinalFinalIUCRC_EconImpactFeasibilityReport_FinalFinal
IUCRC_EconImpactFeasibilityReport_FinalFinal
 
P la w
P la wP la w
P la w
 
Rand rr3242
Rand rr3242Rand rr3242
Rand rr3242
 
Rand rr3242 (1)
Rand rr3242 (1)Rand rr3242 (1)
Rand rr3242 (1)
 
Prediction of economical recession with the signal approach, and the turkey case
Prediction of economical recession with the signal approach, and the turkey casePrediction of economical recession with the signal approach, and the turkey case
Prediction of economical recession with the signal approach, and the turkey case
 
Gender_TCB_Guide
Gender_TCB_GuideGender_TCB_Guide
Gender_TCB_Guide
 
Statistics and indicators for the post-2015 development agenda
Statistics and indicators for the post-2015 development agendaStatistics and indicators for the post-2015 development agenda
Statistics and indicators for the post-2015 development agenda
 
Evaluation
EvaluationEvaluation
Evaluation
 
Annual Report on Evaluation
Annual Report on EvaluationAnnual Report on Evaluation
Annual Report on Evaluation
 
HUMAN DEVELOPMENT IMPACT-Trade policy toolkit
HUMAN DEVELOPMENT IMPACT-Trade policy toolkitHUMAN DEVELOPMENT IMPACT-Trade policy toolkit
HUMAN DEVELOPMENT IMPACT-Trade policy toolkit
 
ICTs_for_Child_Protection_Case_Management_Research_HealthEnabled
ICTs_for_Child_Protection_Case_Management_Research_HealthEnabledICTs_for_Child_Protection_Case_Management_Research_HealthEnabled
ICTs_for_Child_Protection_Case_Management_Research_HealthEnabled
 

More from UNDP Climate

Adaptation Innovation Marketplace
Adaptation Innovation Marketplace Adaptation Innovation Marketplace
Adaptation Innovation Marketplace
UNDP Climate
 
UNDP Climate Change Adaptation Impact
UNDP Climate Change Adaptation ImpactUNDP Climate Change Adaptation Impact
UNDP Climate Change Adaptation Impact
UNDP Climate
 
Coordinating NDCs and NAPs - Addressing agricultural resilience in long term ...
Coordinating NDCs and NAPs - Addressing agricultural resilience in long term ...Coordinating NDCs and NAPs - Addressing agricultural resilience in long term ...
Coordinating NDCs and NAPs - Addressing agricultural resilience in long term ...
UNDP Climate
 
NAP-Ag - Addressing agricultural resilience in long term climate planning ins...
NAP-Ag - Addressing agricultural resilience in long term climate planning ins...NAP-Ag - Addressing agricultural resilience in long term climate planning ins...
NAP-Ag - Addressing agricultural resilience in long term climate planning ins...
UNDP Climate
 
Uganda - Addressing agricultural resilience in long term climate planning ins...
Uganda - Addressing agricultural resilience in long term climate planning ins...Uganda - Addressing agricultural resilience in long term climate planning ins...
Uganda - Addressing agricultural resilience in long term climate planning ins...
UNDP Climate
 
Nap Ciudades Uruguay
Nap Ciudades UruguayNap Ciudades Uruguay
Nap Ciudades Uruguay
UNDP Climate
 
Climate Change Adaptation in the Arab States
Climate Change Adaptation in the Arab StatesClimate Change Adaptation in the Arab States
Climate Change Adaptation in the Arab States
UNDP Climate
 
National Adaptation Plans in Uruguay - A Sectoral Approach
National Adaptation Plans in Uruguay - A Sectoral ApproachNational Adaptation Plans in Uruguay - A Sectoral Approach
National Adaptation Plans in Uruguay - A Sectoral Approach
UNDP Climate
 
Country Experiences Malawi and Nepal - National Adaptation Plans under the UN...
Country Experiences Malawi and Nepal - National Adaptation Plans under the UN...Country Experiences Malawi and Nepal - National Adaptation Plans under the UN...
Country Experiences Malawi and Nepal - National Adaptation Plans under the UN...
UNDP Climate
 
UNFCCC Overview of Process to Formulate and Implement NAPs - National Adaptat...
UNFCCC Overview of Process to Formulate and Implement NAPs - National Adaptat...UNFCCC Overview of Process to Formulate and Implement NAPs - National Adaptat...
UNFCCC Overview of Process to Formulate and Implement NAPs - National Adaptat...
UNDP Climate
 
Climate Finance - National Adaptation Plans under the UNFCCC Process - Webinar
Climate Finance - National Adaptation Plans under the UNFCCC Process - WebinarClimate Finance - National Adaptation Plans under the UNFCCC Process - Webinar
Climate Finance - National Adaptation Plans under the UNFCCC Process - Webinar
UNDP Climate
 
UNDP-FAO Integrating Agriculture in National Adaptation Plans Highlights
UNDP-FAO Integrating Agriculture in National Adaptation Plans HighlightsUNDP-FAO Integrating Agriculture in National Adaptation Plans Highlights
UNDP-FAO Integrating Agriculture in National Adaptation Plans Highlights
UNDP Climate
 
Uruguay Case Study - NAP-Ag Programme
Uruguay Case Study - NAP-Ag ProgrammeUruguay Case Study - NAP-Ag Programme
Uruguay Case Study - NAP-Ag Programme
UNDP Climate
 
FAO-UNDP Integrating Agriculture in National Adaptation Plans programme (NAP-...
FAO-UNDP Integrating Agriculture in National Adaptation Plans programme (NAP-...FAO-UNDP Integrating Agriculture in National Adaptation Plans programme (NAP-...
FAO-UNDP Integrating Agriculture in National Adaptation Plans programme (NAP-...
UNDP Climate
 
Kenya Case Study - FAO-UNDP Integrating Agriculture in National Adaptation Pl...
Kenya Case Study - FAO-UNDP Integrating Agriculture in National Adaptation Pl...Kenya Case Study - FAO-UNDP Integrating Agriculture in National Adaptation Pl...
Kenya Case Study - FAO-UNDP Integrating Agriculture in National Adaptation Pl...
UNDP Climate
 
Thailand UNDP-GIZ workshop on CBA - Appraisal outcomes
Thailand UNDP-GIZ workshop on CBA - Appraisal outcomesThailand UNDP-GIZ workshop on CBA - Appraisal outcomes
Thailand UNDP-GIZ workshop on CBA - Appraisal outcomes
UNDP Climate
 
Building Institutional Capacity in Thailand to Design and Implement Climate P...
Building Institutional Capacity in Thailand to Design and Implement Climate P...Building Institutional Capacity in Thailand to Design and Implement Climate P...
Building Institutional Capacity in Thailand to Design and Implement Climate P...
UNDP Climate
 
Thailand UNDP-GIZ workshop on CBA - Effective water management and sustainabl...
Thailand UNDP-GIZ workshop on CBA - Effective water management and sustainabl...Thailand UNDP-GIZ workshop on CBA - Effective water management and sustainabl...
Thailand UNDP-GIZ workshop on CBA - Effective water management and sustainabl...
UNDP Climate
 

More from UNDP Climate (20)

Adaptation Innovation Marketplace
Adaptation Innovation Marketplace Adaptation Innovation Marketplace
Adaptation Innovation Marketplace
 
UNDP Climate Change Adaptation Impact
UNDP Climate Change Adaptation ImpactUNDP Climate Change Adaptation Impact
UNDP Climate Change Adaptation Impact
 
Coordinating NDCs and NAPs - Addressing agricultural resilience in long term ...
Coordinating NDCs and NAPs - Addressing agricultural resilience in long term ...Coordinating NDCs and NAPs - Addressing agricultural resilience in long term ...
Coordinating NDCs and NAPs - Addressing agricultural resilience in long term ...
 
NAP-Ag - Addressing agricultural resilience in long term climate planning ins...
NAP-Ag - Addressing agricultural resilience in long term climate planning ins...NAP-Ag - Addressing agricultural resilience in long term climate planning ins...
NAP-Ag - Addressing agricultural resilience in long term climate planning ins...
 
Uganda - Addressing agricultural resilience in long term climate planning ins...
Uganda - Addressing agricultural resilience in long term climate planning ins...Uganda - Addressing agricultural resilience in long term climate planning ins...
Uganda - Addressing agricultural resilience in long term climate planning ins...
 
Nap Ciudades Uruguay
Nap Ciudades UruguayNap Ciudades Uruguay
Nap Ciudades Uruguay
 
Climate Change Adaptation in the Arab States
Climate Change Adaptation in the Arab StatesClimate Change Adaptation in the Arab States
Climate Change Adaptation in the Arab States
 
National Adaptation Plans in Uruguay - A Sectoral Approach
National Adaptation Plans in Uruguay - A Sectoral ApproachNational Adaptation Plans in Uruguay - A Sectoral Approach
National Adaptation Plans in Uruguay - A Sectoral Approach
 
Country Experiences Malawi and Nepal - National Adaptation Plans under the UN...
Country Experiences Malawi and Nepal - National Adaptation Plans under the UN...Country Experiences Malawi and Nepal - National Adaptation Plans under the UN...
Country Experiences Malawi and Nepal - National Adaptation Plans under the UN...
 
UNFCCC Overview of Process to Formulate and Implement NAPs - National Adaptat...
UNFCCC Overview of Process to Formulate and Implement NAPs - National Adaptat...UNFCCC Overview of Process to Formulate and Implement NAPs - National Adaptat...
UNFCCC Overview of Process to Formulate and Implement NAPs - National Adaptat...
 
Climate Finance - National Adaptation Plans under the UNFCCC Process - Webinar
Climate Finance - National Adaptation Plans under the UNFCCC Process - WebinarClimate Finance - National Adaptation Plans under the UNFCCC Process - Webinar
Climate Finance - National Adaptation Plans under the UNFCCC Process - Webinar
 
UNDP-FAO Integrating Agriculture in National Adaptation Plans Highlights
UNDP-FAO Integrating Agriculture in National Adaptation Plans HighlightsUNDP-FAO Integrating Agriculture in National Adaptation Plans Highlights
UNDP-FAO Integrating Agriculture in National Adaptation Plans Highlights
 
Uruguay Case Study - NAP-Ag Programme
Uruguay Case Study - NAP-Ag ProgrammeUruguay Case Study - NAP-Ag Programme
Uruguay Case Study - NAP-Ag Programme
 
FAO-UNDP Integrating Agriculture in National Adaptation Plans programme (NAP-...
FAO-UNDP Integrating Agriculture in National Adaptation Plans programme (NAP-...FAO-UNDP Integrating Agriculture in National Adaptation Plans programme (NAP-...
FAO-UNDP Integrating Agriculture in National Adaptation Plans programme (NAP-...
 
Kenya Case Study - FAO-UNDP Integrating Agriculture in National Adaptation Pl...
Kenya Case Study - FAO-UNDP Integrating Agriculture in National Adaptation Pl...Kenya Case Study - FAO-UNDP Integrating Agriculture in National Adaptation Pl...
Kenya Case Study - FAO-UNDP Integrating Agriculture in National Adaptation Pl...
 
Thailand UNDP-GIZ workshop on CBA - Appraisal outcomes
Thailand UNDP-GIZ workshop on CBA - Appraisal outcomesThailand UNDP-GIZ workshop on CBA - Appraisal outcomes
Thailand UNDP-GIZ workshop on CBA - Appraisal outcomes
 
Building Institutional Capacity in Thailand to Design and Implement Climate P...
Building Institutional Capacity in Thailand to Design and Implement Climate P...Building Institutional Capacity in Thailand to Design and Implement Climate P...
Building Institutional Capacity in Thailand to Design and Implement Climate P...
 
Building Institutional Capacity in Thailand to Design and Implement Climate P...
Building Institutional Capacity in Thailand to Design and Implement Climate P...Building Institutional Capacity in Thailand to Design and Implement Climate P...
Building Institutional Capacity in Thailand to Design and Implement Climate P...
 
Thailand UNDP-GIZ workshop on CBA - Effective water management and sustainabl...
Thailand UNDP-GIZ workshop on CBA - Effective water management and sustainabl...Thailand UNDP-GIZ workshop on CBA - Effective water management and sustainabl...
Thailand UNDP-GIZ workshop on CBA - Effective water management and sustainabl...
 

Recently uploaded

NHAI_Under_Implementation_01-05-2024.pdf
NHAI_Under_Implementation_01-05-2024.pdfNHAI_Under_Implementation_01-05-2024.pdf
NHAI_Under_Implementation_01-05-2024.pdf
AjayVejendla3
 
MHM Roundtable Slide Deck WHA Side-event May 28 2024.pptx
MHM Roundtable Slide Deck WHA Side-event May 28 2024.pptxMHM Roundtable Slide Deck WHA Side-event May 28 2024.pptx
MHM Roundtable Slide Deck WHA Side-event May 28 2024.pptx
ILC- UK
 
Transit-Oriented Development Study Working Group Meeting
Transit-Oriented Development Study Working Group MeetingTransit-Oriented Development Study Working Group Meeting
Transit-Oriented Development Study Working Group Meeting
Cuyahoga County Planning Commission
 
State crafting: Changes and challenges for managing the public finances
State crafting: Changes and challenges for managing the public financesState crafting: Changes and challenges for managing the public finances
State crafting: Changes and challenges for managing the public finances
ResolutionFoundation
 
PNRR MADRID GREENTECH FOR BROWN NETWORKS NETWORKS MUR_MUSA_TEBALDI.pdf
PNRR MADRID GREENTECH FOR BROWN NETWORKS NETWORKS MUR_MUSA_TEBALDI.pdfPNRR MADRID GREENTECH FOR BROWN NETWORKS NETWORKS MUR_MUSA_TEBALDI.pdf
PNRR MADRID GREENTECH FOR BROWN NETWORKS NETWORKS MUR_MUSA_TEBALDI.pdf
ClaudioTebaldi2
 
Get Government Grants and Assistance Program
Get Government Grants and Assistance ProgramGet Government Grants and Assistance Program
Get Government Grants and Assistance Program
Get Government Grants
 
Donate to charity during this holiday season
Donate to charity during this holiday seasonDonate to charity during this holiday season
Donate to charity during this holiday season
SERUDS INDIA
 
2024: The FAR - Federal Acquisition Regulations, Part 38
2024: The FAR - Federal Acquisition Regulations, Part 382024: The FAR - Federal Acquisition Regulations, Part 38
2024: The FAR - Federal Acquisition Regulations, Part 38
JSchaus & Associates
 
Opinions on EVs: Metro Atlanta Speaks 2023
Opinions on EVs: Metro Atlanta Speaks 2023Opinions on EVs: Metro Atlanta Speaks 2023
Opinions on EVs: Metro Atlanta Speaks 2023
ARCResearch
 
PD-1602-as-amended-by-RA-9287-Anti-Illegal-Gambling-Law.pptx
PD-1602-as-amended-by-RA-9287-Anti-Illegal-Gambling-Law.pptxPD-1602-as-amended-by-RA-9287-Anti-Illegal-Gambling-Law.pptx
PD-1602-as-amended-by-RA-9287-Anti-Illegal-Gambling-Law.pptx
RIDPRO11
 
ZGB - The Role of Generative AI in Government transformation.pdf
ZGB - The Role of Generative AI in Government transformation.pdfZGB - The Role of Generative AI in Government transformation.pdf
ZGB - The Role of Generative AI in Government transformation.pdf
Saeed Al Dhaheri
 
2024: The FAR - Federal Acquisition Regulations, Part 37
2024: The FAR - Federal Acquisition Regulations, Part 372024: The FAR - Federal Acquisition Regulations, Part 37
2024: The FAR - Federal Acquisition Regulations, Part 37
JSchaus & Associates
 
一比一原版(Adelaide毕业证)阿德莱德大学毕业证成绩单
一比一原版(Adelaide毕业证)阿德莱德大学毕业证成绩单一比一原版(Adelaide毕业证)阿德莱德大学毕业证成绩单
一比一原版(Adelaide毕业证)阿德莱德大学毕业证成绩单
ehbuaw
 
Understanding the Challenges of Street Children
Understanding the Challenges of Street ChildrenUnderstanding the Challenges of Street Children
Understanding the Challenges of Street Children
SERUDS INDIA
 
2024: The FAR - Federal Acquisition Regulations, Part 36
2024: The FAR - Federal Acquisition Regulations, Part 362024: The FAR - Federal Acquisition Regulations, Part 36
2024: The FAR - Federal Acquisition Regulations, Part 36
JSchaus & Associates
 
kupon sample qurban masjid indonesia terbaru.pptx
kupon sample qurban masjid indonesia terbaru.pptxkupon sample qurban masjid indonesia terbaru.pptx
kupon sample qurban masjid indonesia terbaru.pptx
viderakai
 
如何办理(uoit毕业证书)加拿大安大略理工大学毕业证文凭证书录取通知原版一模一样
如何办理(uoit毕业证书)加拿大安大略理工大学毕业证文凭证书录取通知原版一模一样如何办理(uoit毕业证书)加拿大安大略理工大学毕业证文凭证书录取通知原版一模一样
如何办理(uoit毕业证书)加拿大安大略理工大学毕业证文凭证书录取通知原版一模一样
850fcj96
 
快速制作(ocad毕业证书)加拿大安大略艺术设计学院毕业证本科学历雅思成绩单原版一模一样
快速制作(ocad毕业证书)加拿大安大略艺术设计学院毕业证本科学历雅思成绩单原版一模一样快速制作(ocad毕业证书)加拿大安大略艺术设计学院毕业证本科学历雅思成绩单原版一模一样
快速制作(ocad毕业证书)加拿大安大略艺术设计学院毕业证本科学历雅思成绩单原版一模一样
850fcj96
 
Russian anarchist and anti-war movement in the third year of full-scale war
Russian anarchist and anti-war movement in the third year of full-scale warRussian anarchist and anti-war movement in the third year of full-scale war
Russian anarchist and anti-war movement in the third year of full-scale war
Antti Rautiainen
 
The Role of a Process Server in real estate
The Role of a Process Server in real estateThe Role of a Process Server in real estate
The Role of a Process Server in real estate
oklahomajudicialproc1
 

Recently uploaded (20)

NHAI_Under_Implementation_01-05-2024.pdf
NHAI_Under_Implementation_01-05-2024.pdfNHAI_Under_Implementation_01-05-2024.pdf
NHAI_Under_Implementation_01-05-2024.pdf
 
MHM Roundtable Slide Deck WHA Side-event May 28 2024.pptx
MHM Roundtable Slide Deck WHA Side-event May 28 2024.pptxMHM Roundtable Slide Deck WHA Side-event May 28 2024.pptx
MHM Roundtable Slide Deck WHA Side-event May 28 2024.pptx
 
Transit-Oriented Development Study Working Group Meeting
Transit-Oriented Development Study Working Group MeetingTransit-Oriented Development Study Working Group Meeting
Transit-Oriented Development Study Working Group Meeting
 
State crafting: Changes and challenges for managing the public finances
State crafting: Changes and challenges for managing the public financesState crafting: Changes and challenges for managing the public finances
State crafting: Changes and challenges for managing the public finances
 
PNRR MADRID GREENTECH FOR BROWN NETWORKS NETWORKS MUR_MUSA_TEBALDI.pdf
PNRR MADRID GREENTECH FOR BROWN NETWORKS NETWORKS MUR_MUSA_TEBALDI.pdfPNRR MADRID GREENTECH FOR BROWN NETWORKS NETWORKS MUR_MUSA_TEBALDI.pdf
PNRR MADRID GREENTECH FOR BROWN NETWORKS NETWORKS MUR_MUSA_TEBALDI.pdf
 
Get Government Grants and Assistance Program
Get Government Grants and Assistance ProgramGet Government Grants and Assistance Program
Get Government Grants and Assistance Program
 
Donate to charity during this holiday season
Donate to charity during this holiday seasonDonate to charity during this holiday season
Donate to charity during this holiday season
 
2024: The FAR - Federal Acquisition Regulations, Part 38
2024: The FAR - Federal Acquisition Regulations, Part 382024: The FAR - Federal Acquisition Regulations, Part 38
2024: The FAR - Federal Acquisition Regulations, Part 38
 
Opinions on EVs: Metro Atlanta Speaks 2023
Opinions on EVs: Metro Atlanta Speaks 2023Opinions on EVs: Metro Atlanta Speaks 2023
Opinions on EVs: Metro Atlanta Speaks 2023
 
PD-1602-as-amended-by-RA-9287-Anti-Illegal-Gambling-Law.pptx
PD-1602-as-amended-by-RA-9287-Anti-Illegal-Gambling-Law.pptxPD-1602-as-amended-by-RA-9287-Anti-Illegal-Gambling-Law.pptx
PD-1602-as-amended-by-RA-9287-Anti-Illegal-Gambling-Law.pptx
 
ZGB - The Role of Generative AI in Government transformation.pdf
ZGB - The Role of Generative AI in Government transformation.pdfZGB - The Role of Generative AI in Government transformation.pdf
ZGB - The Role of Generative AI in Government transformation.pdf
 
2024: The FAR - Federal Acquisition Regulations, Part 37
2024: The FAR - Federal Acquisition Regulations, Part 372024: The FAR - Federal Acquisition Regulations, Part 37
2024: The FAR - Federal Acquisition Regulations, Part 37
 
一比一原版(Adelaide毕业证)阿德莱德大学毕业证成绩单
一比一原版(Adelaide毕业证)阿德莱德大学毕业证成绩单一比一原版(Adelaide毕业证)阿德莱德大学毕业证成绩单
一比一原版(Adelaide毕业证)阿德莱德大学毕业证成绩单
 
Understanding the Challenges of Street Children
Understanding the Challenges of Street ChildrenUnderstanding the Challenges of Street Children
Understanding the Challenges of Street Children
 
2024: The FAR - Federal Acquisition Regulations, Part 36
2024: The FAR - Federal Acquisition Regulations, Part 362024: The FAR - Federal Acquisition Regulations, Part 36
2024: The FAR - Federal Acquisition Regulations, Part 36
 
kupon sample qurban masjid indonesia terbaru.pptx
kupon sample qurban masjid indonesia terbaru.pptxkupon sample qurban masjid indonesia terbaru.pptx
kupon sample qurban masjid indonesia terbaru.pptx
 
如何办理(uoit毕业证书)加拿大安大略理工大学毕业证文凭证书录取通知原版一模一样
如何办理(uoit毕业证书)加拿大安大略理工大学毕业证文凭证书录取通知原版一模一样如何办理(uoit毕业证书)加拿大安大略理工大学毕业证文凭证书录取通知原版一模一样
如何办理(uoit毕业证书)加拿大安大略理工大学毕业证文凭证书录取通知原版一模一样
 
快速制作(ocad毕业证书)加拿大安大略艺术设计学院毕业证本科学历雅思成绩单原版一模一样
快速制作(ocad毕业证书)加拿大安大略艺术设计学院毕业证本科学历雅思成绩单原版一模一样快速制作(ocad毕业证书)加拿大安大略艺术设计学院毕业证本科学历雅思成绩单原版一模一样
快速制作(ocad毕业证书)加拿大安大略艺术设计学院毕业证本科学历雅思成绩单原版一模一样
 
Russian anarchist and anti-war movement in the third year of full-scale war
Russian anarchist and anti-war movement in the third year of full-scale warRussian anarchist and anti-war movement in the third year of full-scale war
Russian anarchist and anti-war movement in the third year of full-scale war
 
The Role of a Process Server in real estate
The Role of a Process Server in real estateThe Role of a Process Server in real estate
The Role of a Process Server in real estate
 

Social Vulnerability Assessment Tools for Climate Change and DRR Programming

  • 1. A GUIDE TO PRACTITIONERS United Nations Development Programme SOCIAL VULNERABILITY ASSESSMENT TOOLS FOR CLIMATE CHANGE AND DRR PROGRAMMING
  • 2. 2 SOCIAL VULNERABILITY ASSESSMENT TOOLS FOR CLIMATE CHANGE AND DRR PROGRAMMING
  • 3. SOCIAL VULNERABILITY ASSESSMENT TOOLS FOR CLIMATE CHANGE AND DRR PROGRAMMING 3 SOCIALVULNERABILITYASSESSMENTTOOLS FORCLIMATECHANGEANDDRRPROGRAMMING A GUIDE TO PRACTITIONERS September 2017
  • 4. 4 SOCIAL VULNERABILITY ASSESSMENT TOOLS FOR CLIMATE CHANGE AND DRR PROGRAMMING Publisher United Nations Development Programme Author: Krunoslav Katic Contributors: Mihail Peleah Zeljko Pavic Krunoslav Vukelic Reviewers: Katerina Kostadinova Daskalovska Yegor Volovik Project coordinators: Natalia Olofinskaya Armen Grigoryan Milena Kozomara Editor: Duska Tomanovic Design: Nenad Vasic Photo: UNDP Serbia Printed by: Number of copies: 300 ISBN: 978-92-95092-98-3 The views expressed in this publication are those of the author(s) and do not necessarily represent those of the United Nations, including UNDP, or UN Member States.
  • 5. Itbecameapparentduringmyworkinthefieldofdisasterriskreductionandclimatechange,particularlyinthe South East Europe, and specifically, while dealing with the issue of the respective national Risk Assessments, that the subject of social vulnerability was inadequately addressed. This Guide was thus developed to boost and support the capacities of disaster risk reduction and climate change practitioners at the local, national and international levels. It aims to provide a tool supporting UNDP staff and project managers in planning and implementing activities, projects and programs addressing social vulnerability. That said, I particularly wish to express my sincere gratitude to Ms. Natalia Olofinskaya, the Regional Technical Specialist – Adaptation to Climate Change, UNDP Istanbul Regional Hub, for her encouragement and guidance in preparing this Guide, and to Mr. Armen Grigoryan, the Climate Change, Disaster Resilience and Global Energy Policy Advisor, UNDP Istanbul Regional Hub, for providing me with the opportunity to embark on this project. I would also like to thank Mr. Željko Pavić, of the Department of Cultural Studies at the University of Osijek, Croatia, Mr. Krunoslav Vukelić, of the marketing research and public opinion polling company Audeo based in Osijek, Croatia and Mr. Mihail Peleah, a Programme Specialist, UNDP Istanbul Regional Hub, for providing substantive expert input to this Guide. Furthermore, my thanks go to peer reviewers Mrs. Katerina Kostadinova Daskalovska, an Independent Consultant and Operational Risk Manager, the former Yugoslav Republic of Macedonia and Mr. Yegor Volovik, a Portfolio Manager at UN Environment. Last but not least, I would also like to take this opportunity to thank the Disaster Risk Reduction and Climate Change staff at UNDP South East Europe Country Offices and the Disaster Risk Reduction experts and practitioners at local and national levels in South East Europe who have been very supportive of this endeavor. Krunoslav Katic ACKNOWLEDGEMENTS SOCIAL VULNERABILITY ASSESSMENT TOOLS FOR CLIMATE CHANGE AND DRR PROGRAMMING 5
  • 6. 6 SOCIAL VULNERABILITY ASSESSMENT TOOLS FOR CLIMATE CHANGE AND DRR PROGRAMMING
  • 7. CONTENTS SOCIAL VULNERABILITY ASSESSMENT TOOLS FOR CLIMATE CHANGE AND DRR PROGRAMMING 7 Background . . . . . . . . . . . . . . . . . . . . . . . . . . . . . . . . . . . . . . . . . . . . . . . . . . . . . . . . . . . . . . . . . . . . . . . . . . . . . . . . . . . . . . . . . . Social vulnerability overview . . . . . . . . . . . . . . . . . . . . . . . . . . . . . . . . . . . . . . . . . . . . . . . . . . . . . . . . . . . . . . . . . . . . . . . . . Overview of Social Vulnerability Assessment Methodologies and Tools Globally . . . . . . . . . . . . . . . . . . . . . . CCA/DRR Social Vulnerability Case Studies . . . . . . . . . . . . . . . . . . . . . . . . . . . . . . . . . . . . . . . . . . . . . . . . . . . . . . . . . . . Social vulnerability indicators . . . . . . . . . . . . . . . . . . . . . . . . . . . . . . . . . . . . . . . . . . . . . . . . . . . . . . . . . . . . . . . . . . . . . . . . Introduction . . . . . . . . . . . . . . . . . . . . . . . . . . . . . . . . . . . . . . . . . . . . . . . . . . . . . . . . . . . . . . . . . . . . . . . . . . . . . . . . . . . . . . . . . Development of Indicators . . . . . . . . . . . . . . . . . . . . . . . . . . . . . . . . . . . . . . . . . . . . . . . . . . . . . . . . . . . . . . . . . . . . . . . . . . . Index calculation and application . . . . . . . . . . . . . . . . . . . . . . . . . . . . . . . . . . . . . . . . . . . . . . . . . . . . . . . . . . . . . . . . . . . . Index validation . . . . . . . . . . . . . . . . . . . . . . . . . . . . . . . . . . . . . . . . . . . . . . . . . . . . . . . . . . . . . . . . . . . . . . . . . . . . . . . . . . . . . . Index calculated. What’s next? . . . . . . . . . . . . . . . . . . . . . . . . . . . . . . . . . . . . . . . . . . . . . . . . . . . . . . . . . . . . . . . . . . . . . . . . Conclusions and Recommendations . . . . . . . . . . . . . . . . . . . . . . . . . . . . . . . . . . . . . . . . . . . . . . . . . . . . . . . . . . . . . . . . . . Annex 1. SVA Indicative timelines . . . . . . . . . . . . . . . . . . . . . . . . . . . . . . . . . . . . . . . . . . . . . . . . . . . . . . . . . . . . . . . . . . . . . Annex 2. SVA Costs estimates . . . . . . . . . . . . . . . . . . . . . . . . . . . . . . . . . . . . . . . . . . . . . . . . . . . . . . . . . . . . . . . . . . . . . . . . . Annex 3. Outline of the Terms of Reference (Deliverables) . . . . . . . . . . . . . . . . . . . . . . . . . . . . . . . . . . . . . . . . . . . . . Annex 4. Comparable Social Vulnerability Profiling (CSVP) – Case study in Croatia . . . . . . . . . . . . . . . . . . . . . References . . . . . . . . . . . . . . . . . . . . . . . . . . . . . . . . . . . . . . . . . . . . . . . . . . . . . . . . . . . . . . . . . . . . . . . . . . . . . . . . . . . . . . . . . . . Table of Content Table 1 CCA/DRR Social Vulnerability Assessment Case Studies Implemented by UNDP . . . . . . . . . . . . . . Table 2 List of Examples of Social Vulnerability Indicators . . . . . . . . . . . . . . . . . . . . . . . . . . . . . . . . . . . . . . . . . . . . Table 3 Characteristics of Household Resources . . . . . . . . . . . . . . . . . . . . . . . . . . . . . . . . . . . . . . . . . . . . . . . . . . . . . . Table 4 List of Indicators Including Their Definitions and Data Sources . . . . . . . . . . . . . . . . . . . . . . . . . . . . . . . . Table 5 Values of Vulnerability Indicators . . . . . . . . . . . . . . . . . . . . . . . . . . . . . . . . . . . . . . . . . . . . . . . . . . . . . . . . . . . . . Table 6 SVA Costs without Qualitative Research in Stage 1 and without Stage 3 (in USD) . . . . . . . . . . . . . . Table 7 SVA Costs with Qualitative Research in Stage 1 and CorrelationalValidation in Stage 3 (in USD) . . . . . . Table 8SVACostswithQualitativeResearchinStage1andQualitativeResearchValidationinStage3(inUSD) . . . . . Table 9 Estimated Survey Costs in USD (Data Collection, Average Duration 15 Minutes) . . . . . . . . . . . . . . . Table 10 CSVP Vulnerability Table – Final Result . . . . . . . . . . . . . . . . . . . . . . . . . . . . . . . . . . . . . . . . . . . . . . . . . . . . . . . List of Tables Figure 1 Outline of an SVA Study . . . . . . . . . . . . . . . . . . . . . . . . . . . . . . . . . . . . . . . . . . . . . . . . . . . . . . . . . . . . . . . . . . . . . Figure 2 Example of Social Vulnerability Index Mapping Created by MS Paint (CSVP Croatia) . . . . . . . . . . Figure 3 Example of SV Index Mapping Created by Mapchart.net (Fictional Results) . . . . . . . . . . . . . . . . . . Figure 4 Indicative Timeline for Conducting a Simplified SVA . . . . . . . . . . . . . . . . . . . . . . . . . . . . . . . . . . . . . . . . Figure 5 Indicative Timeline for Conducting a Mid-Level Complexity SVA . . . . . . . . . . . . . . . . . . . . . . . . . . . . . Figure 6 Indicative Timeline for Conducting a Complex SVA . . . . . . . . . . . . . . . . . . . . . . . . . . . . . . . . . . . . . . . . . List of Figures 18 30 30 34 35 36 16 22 23 25 26 37 38 38 39 44 9 11 11 15 18 18 19 28 31 31 32 34 37 40 41 45
  • 8. ABBREVIATIONS 8 SOCIAL VULNERABILITY ASSESSMENT TOOLS FOR CLIMATE CHANGE AND DRR PROGRAMMING UBEVI Built Environment Index CAPI Computer Assisted Personal Interviewing CARE Cooperative for Assistance and Relief Everywhere CATI Computer Assisted Telephone Interviewing CCA Climate Change Adaptation CRM Climate Risk Management CSVP Comparable Social Vulnerability Profiling CVCA Climate Vulnerability Capacity Assessment DRR Disaster Risk Reduction ECIS Europe and the Commonwealth of Independent States F2F Face to Face GDP Gross Domestic Product GEOSTAT Geodesy Satellite GIS Geographic Information System HBS Household Budget Survey MCA Multi Criteria Analysis NGO Non Governmental Organization PROVIA Programme of Research on Climate Change Vulnerability, Impacts &Adaptation RCI Resilience Capacity Index SD Standard Deviation SEVI Socio-Economic Vulnerability Index SoVI Social Vulnerability Index SVA Social Vulnerability Analysis UNDP United Nations Development Programme
  • 9. BACKGROUND SOCIAL VULNERABILITY ASSESSMENT TOOLS FOR CLIMATE CHANGE AND DRR PROGRAMMING 9 In the past twenty years, disasters cost more than $2 trillion, killed over 1.3 million and affected more than 4.4 billion people, including a disproportionately high number of women, children and other vulnerable groups1 . Climate-relatedhazards,suchascyclones,droughtsandfloods,arebecomingincreasinglyfrequentandsevere as a result of changing climate. In this new context of volatility, communities and nations are facing increasing, multiple and interconnected risks that can reverse years - and sometimes decades - of development progress. Specific categories of the population (1) may face a higher risk of disasters or climate change, related to the place they are living (flood prone parts of the community, for example), crops they are growing (i.e. low cost, low yield seeds, not resilient to climate change, for example); (2) may have lower preparedness and coping capacity because they lack capitals to invest in adaptation and the decision making powers to affect public decisions on adaptation; (3) may have lower resilience/adaptation capacity because they lack access to economic and social support networks. Climate change adaptation and risk management interventions need to be planned, designed and targeted with the clear understanding of the social vulnerability profiles of various groups of beneficiaries. Numerous methodologies are used worldwide for assessing the impact of climate change and disasters on vulnerable population groups. Nevertheless, those social vulnerability methodologies are not systematically integrated into the overall process of climate and disaster risk management. Consequently, many studies that are meant to be “risk assessments” do not go beyond being “hazard assessments” as they lack standardized, comparable and quantifiable social dimensions of vulnerability. A number of issues and challenges arise in defining and mapping the socially vulnerable population within climate change adaptation and disaster risk assessment frameworks. The variety of parameters used to determinesocialvulnerabilityincludes,butisnotlimitedto,incomedisparity,gender,age,disability,language, literacy or family status. However, personal characteristics can be linked to vulnerability, but not define it. Group approach is widespread because it is easy to administer and use for targeting the population, but it largely ignores the internal heterogeneity of groups2 . Availability of data on social vulnerability (i.e. obtained from censuses, pre- and post-disaster studies, public surveys, etc.), and the level at which we conduct social vulnerability studies (individual, neighborhood, community, municipality, region, etc.) are critical issues in conducting social vulnerability assessments for climate change adaptation or disaster risk reduction programs. Finally, the tools for assessing social vulnerability have to be chosen for particular programmatic or investment decisions. 1 UNISDR (2013) Tackling future risks, economic losses and exposure 2 More about the human centered approach in UNDP’s 2011 Regional Human Development Report. Beyond Transition Towards Inclusive Societies, available at http://hdr.undp.org/en/content/beyond-transition .
  • 10. BACKGROUND 10 SOCIAL VULNERABILITY ASSESSMENT TOOLS FOR CLIMATE CHANGE AND DRR PROGRAMMING UNDP has been working on integrating issues of climate, disaster risk and energy at the country level, and focusing on building resilience and ensuring that development remains risk-informed and sustainable. Since 2008, UNDP has supported more than 140 countries in accessing over $2.3 billion in grant finance to develop and implement climate change initiatives3 . In the Europe and the Commonwealth of Independent States (ECIS) region, UNDP has been supporting a rich portfolio of project and policy initiatives addressing adaptation to climate change and disaster risk reduction. The UNDP projects in the region have addressed diverse climate-induced threats and impacts and targeted various adaptation and risk management objectives, ranging from improved resilience of agricultural livelihoods to reduced vulnerability of communities and economies to climate-induced natural disasters. These interventions are designed to target the most vulnerable people and communities and leave a legacy of inclusive gender-sensitive adaptation planning and risk reduction. The aim of this Guide is to first and foremost serve as a user friendly knowledge product on SocialVulnerability Assessment (SVA) approaches and tools.This Guide provides information about on-going and future planning and programming in the areas of climate change adaptation (CCA), climate risk management (CRM) and disaster risk reduction (DRR). As such, it is primarily designed for CCA and DRR practitioners in national governments, local level authorities dealing with DRR/CCA, professional community and development organizations (including UNDP Country Offices and projects) involved in the planning, design and/or implementation of CCA and DRR projects. Thus, the Guide aims to improve the quality of CCA and DRR project development and implementation through enhanced initiation, targeting and increased effectiveness of future interventions. 3 UNDP and Climate Change: Zero Carbon, Sustainable Development This guide should be taken only as an outline and a proposal that can assist project managers -DRR and CCA practitioners in developing social vulnerability studies dealing with climate change and disasters in specific countries.
  • 11. SOCIAL VULNERABILITY OVERVIEW SOCIAL VULNERABILITY ASSESSMENT TOOLS FOR CLIMATE CHANGE AND DRR PROGRAMMING 11 OVERVIEW OF SOCIAL VULNERABILITY ASSESSMENT METHODOLOGIES AND TOOLS USED GLOBALLY There are numerous operational definitions of social vulnerability to natural hazards, but it is most commonly defined as “the differential capacity of groups and individuals to deal with hazards, based on their positions within physical and social worlds”(Dow, 1992), or as“the inability to take effective measures to insure against losses”(Bogard, 1989). These differential capacities of groups and individuals are related to control over resources (or endowment with capital), risk exposure, awareness and management, and the ability to respond. Resources form the basis of an individual’s or community’s ability to be resilient. Diverse and abundant capitals reduce community vulnerability and exposure to risks—i.e. forests can increase protection from storms and floods, while a vibrant local economy can provide the necessary resources to cope when disaster strikes (or to invest in disaster prevention measures, such as river bank reinforcement). In addition, capitals are necessary for risk management and the ability to respond - education increases the skills and knowledge to understand community risks and increases the ability to develop and implement risk reduction strategies, while social capital facilitates coordination and cooperation so necessary for rapid response. Different communities and individuals are exposed to different risks of hazard, even within the same district or locality. For instance, many Roma communities live on the outskirts of towns, which may be more prone to flooding. Such exposure is not necessarily linked to the socioeconomic status of a community. However, in combination with access to resources and information, as well as visibility on the policymakers’ radar screen and ability to influence decision making, it can lead to different abilities to respond. Risk awareness and preparedness are the key elements for strengthening resilience, as they anticipate the potential impact of hazards. However, there are significant differences in the levels of awareness and preparedness of different groups and individuals. The reasons for these differences are multiple, but three stand out as the most important. The first regards different degrees of access to information, due both to the inaccessibility of information sources and lack of technologies. The second concerns the lack of skills and knowledge for preparedness planning. Last but not least, the third regards lack of resources for preparedness and response measures. This also includes human and social capital and the ability to mobilize people to respond when crisis strikes. It is impossible to directly measure social vulnerability because it includes so many aspects, described above, some of which (like the ability to mobilize the community) become visible only after a disaster happened. Like in many similar cases, we have to rely on measuring individual characteristics4 related to social vulnerability, which put people in a less vulnerable position (such as their socioeconomic status or social connections) or a more vulnerable position (disabilities or the community’s limited transport connectivity). When it comes to measuring social vulnerability, Cutter, Boruff and Shirley (2003) departed from the following broad groups of (often interplaying) characteristics of positions within physical and social worlds, assumed to be related to vulnerability/resilience: 4 It needs to be noted that many of these characteristics can be highly contextual.
  • 12. SOCIAL VULNERABILITY OVERVIEW 12 SOCIAL VULNERABILITY ASSESSMENT TOOLS FOR CLIMATE CHANGE AND DRR PROGRAMMING 1. Socioeconomic status (e.g. high-status groups should be more resilient to natural hazards and can recover more quickly), 2. Gender (e.g. women are likely to be more vulnerable due to family-care obligations and lower labor market position), 3. Race and ethnicity (e.g. language barriers that lead to lower resilience, especially when it comes to post-disaster funds), 4. Age (e.g. mobility concerns leading to lower resilience), 5. Commercial and industrial development (e.g. the value, quality and density of commercial and industrial buildings show the economic vitality of a community), 6. Employment loss (higher unemployment levels lead to additional pressure on the labor market in the post-disaster period), 7. Rural/urban (e.g. rural communities are more vulnerable economically due to single-resource economy, but urban communities are more vulnerable to evacuation problems), 8. Residential property (e.g. better-quality residential buildings lead to higher resilience), 9. Infrastructure and lifelines (e.g. loss of communications, such as bridges and transportation infrastructure, can result in a financial burden), 10. Renters5 (a higher number of renters can lead to lower resilience), 11. Occupation (e.g. some occupations, such as agriculture and other natural resource-based occupations, can be more impacted by a hazard), 12. Family structure (e.g. resilience can be lower in families with large numbers of dependents and single-parent families), 13. Education (higher education is linked to higher income and greater access to information), 14. Population growth (rapid population growth can lead to greater vulnerability due to lack of quality housing and urban systems), 15. Medical services (e.g. greater numbers of medical personnel and proximity to medical services lead to better resilience), 16. Social dependence (e.g. people relying on social services constitute vulnerable groups that may need additional assistance), and 17. Special needs population (e.g., institutionalized persons, homeless persons who can be more severely affected due to lack of access to information or lower visibility). 5 Persons who rent a house/apartment.
  • 13. SOCIAL VULNERABILITY OVERVIEW SOCIAL VULNERABILITY ASSESSMENT TOOLS FOR CLIMATE CHANGE AND DRR PROGRAMMING 13 These variables can be divided into two groups based on the data collection level. The first group consists of individual level variables (for example, education, age and gender) that are aggregated to produce community-level numbers. The second group comprises community-level variables, such as population growth, infrastructure quality and urban/rural division that need not be aggregated. By conducting a principal component analysis with normalized variables, these authors extracted eleven composite factors and used them to calculate the Social Vulnerability Index (SoVI) of US counties, without assigning weights to the factors. The Social Vulnerability Index was further developed by the Hazards and Vulnerability Research Institute at the University of South Carolina6 . Similarly, Oulahen et al. (2015) used the following five groups of indicators to calculate social vulnerability to floods in the City of Vancouver: 1. Ability to cope (age, gender), ethnicity (minority status, immigration), 2. Access to resources (income, property value, percentage of renters, education, unemployment, income from government transfers), 3. Household arrangement (single-parent households, single-member households), 4. Public transport (as the main family transportation mode), and 5. Built environment (quality of housing, age of construction, population density, dwelling in 5+ stories apartments). The authors also used the principal component analysis to extract the component factors and create an additive model7 of the Social Vulnerability Index, a flexible tool appropriate for modelling multivariate data. The areas were classified according to the standard deviation (SD) from the mean. The vulnerability scores/ areas were classified into five categories (quintiles): high (>1.5SD), medium-high (0.5 to 1.5SD), medium (–0.5 to 0.5SD), medium-low (–1.5 to 0.5SD) and low (<–1.5SD). The Index (SoVI) was validated through focus groups with local practitioners working on the development of natural hazard plans in the local municipalities.The practitioners were asked to indicate whether indexes/area maps corresponded to the local reality when it came to flood hazards. 6 The list of variables that comprise the Index can be found on the Institute’s website (http://artsandsciences.sc.edu/geog/hvri/ sovi%C2%AE-0), together with detailed methodological explanations. 7 https://en.wikipedia.org/wiki/Additive_model
  • 14. SOCIAL VULNERABILITY OVERVIEW 14 SOCIAL VULNERABILITY ASSESSMENT TOOLS FOR CLIMATE CHANGE AND DRR PROGRAMMING Park et al. (2016) constructed a socio-economic vulnerability index that is specific to landslide hazards. They used the following three sub-indexes relating to different issues of vulnerability/disaster risk: 1. Demographic and social index (age distribution; number of workers who may be exposed to disasters, population density, foreigner ratio, education level, housing type), 2. Secondary damage triggering index (number of public offices, road area ratio, number of electronic supply facilities, school area ratio, commercial and industrial area ratio), and 3. Preparation and response index (disasters frequency, Internet penetration rate, number of disaster prevention facilities, perceived safety, number of medical doctors, and financial independence of the borough). The authors assigned weights to the sub-indexes, as well to the variables that comprise sub-indexes, through interviews with the key informants. In their research in Norway, Holand, Lujala and Rød (2011) also used the basic methodological approach delineated in Cutter, Boruff and Shirley (2003). They, however, consider “the social vulnerability concept to consist of two distinct parts: socioeconomic vulnerability characterized by aspects such as living conditions and population structure; and built environment vulnerability, measured by factors such as population density, the quality and magnitude of infrastructure, and the number of exit routes.” Principal factor analysis revealed a four-factor solution when it comes to the Socio-Economic Vulnerability Index (SEVI) and a three- factor solution when it comes to the Built Environment Index (BEVI). Even though most studies use unweighted indexes of social vulnerability to hazards, Oulahen et al. (2015) point out the necessity of variable weighting, preferably by using the knowledge and experience of the local stakeholders. For example, Emrich (2005) used the Delphi method with local experts in order to assign variable weights.
  • 15. SOCIAL VULNERABILITY OVERVIEW SOCIAL VULNERABILITY ASSESSMENT TOOLS FOR CLIMATE CHANGE AND DRR PROGRAMMING 15 CCA/DRR SOCIAL VULNERABILITY CASE STUDIES STUDY LOCATION DATA COLLECTION METHODS SHORT EXPLANATION OF METHODOLOGY Comparable Social Vulnerability Profiling – CSVP (Case study: Croatia) Croatia, 2015 Census 2011, Croatian Bureau of Statistics The calculation of six equally valued variables/indicators (without ponders) for several Croatian cities, municipalities and counties was followed by their comparative analysis. The final step involved comparing the vulnerability tables against the common denominator - either the county or the state. Economic and social vulnerability in Georgia Georgia, 2013 Household Budget Survey by GEOSTAT on regular sample + 500 households from each target group. In-depth interviews and focus groups discussions with representatives from these 3 target groups The regular HBS questionnaire was supplemented by a special module on vulnerability. A qualitative analysis was implemented at the beginning of the research, involving in-depth interviews with the key stakeholders, in order to design the appropriate special module and another qualitative analysis was performed after the initial analysis of the survey results, through focus groups comprising participants from the three target groups. Disaster Risk Reduction and Climate Change The former Yugoslav Republic of Macedonia (South-East Region), 2013 2002 National census After collecting useful data about the South-East Region, a set of indicators and indexes of socioeconomic vulnerability was designed in accordance with the national policies and strategies. The team then constructed an index of vulnerability based on the existing theoretical models.
  • 16. SOCIAL VULNERABILITY OVERVIEW 16 SOCIAL VULNERABILITY ASSESSMENT TOOLS FOR CLIMATE CHANGE AND DRR PROGRAMMING STUDY LOCATION DATA COLLECTION METHODS SHORT EXPLANATION OF METHODOLOGY Socio-Economic Assessment of Flood Risk in Rioni Basin Georgia (Rioni Basin), 2014 Flood risk scoring in a form of Multi Criteria Analysis (MCA) Flood risk screening and quantification by social, agricultural and environmental drivers in communities or municipalities in order to indicate the riskiest areas in the region. The next step involved the identification and estimate of economic damages. Guidance on Ecosystem Considerations into Climate Change Vulnerability and Impact Assessment to Inform Ecosystem-based Adaptation Nepal, Peru and Uganda, 2015 Several methodologies, such as CARE’s CVCA, PROVIA guidance. No data collection from primary sources. The CVCA (Climate Vulnerability Capacity Assessment) methodology of vulnerability and adaptive capacity was used to analyze the communities, households and individuals, i.e. at the local level. The PROVIA model was used for larger-scale assessments. Testing of Climate Risk Assessment Methodology Kyrgyzstan, 2013 Focus groups (each with eight participants) and house interviews (54 persons). Comparative analysis of the experts’ and respondents’ opinions The respondents were asked about their perceptions of changes in the frequency of climate-related hazards (avalanches, prolonged winter, livestock diseases, landslides, etc.) and indications of climate change (more frequent snowfalls, heavy rains, etc.). A comparative analysis identified some differences in opinion on these issues among the experts and the local population. Table 1. CCA/DRR Social Vulnerability Assessment case studies implemented by UNDP TheexamplesintheaboveTable1showthatsocialvulnerabilityandothertypesofvulnerabilityofsomespecificgroups were calculated only on the basis of official census data and other secondary sources. In the Croatian case study, there werenorespondentsatall–socialvulnerabilitywasmeasuredonlybasedonthedatafromthelastcensus.Arguably,the mostdetailedSVAstudywasconductedinGeorgiawhereGEOSTAT’sHouseholdBudgetSurvey(HBS)wasexpandedto includeaspecialmodule(infact,asetofspecificquestions)thatmeasuredvulnerability.
  • 17. SOCIAL VULNERABILITY OVERVIEW SOCIAL VULNERABILITY ASSESSMENT TOOLS FOR CLIMATE CHANGE AND DRR PROGRAMMING 17 The key stakeholders were interviewed before the Survey in order to design the most appropriate module. After the analysisoftheHBSprimaryresultscoveringthethreetargetgroups,interviewswereheldwiththefocusgroupstoclarify specific issues.The main issue arising with respect to the formerYugoslav Republic of Macedonia study is that it used thedatafromthelatestavailablenationalcensus(11yearsold),whichwerethusprobablyoutdated.Thecasestudythat included three countries on three different continents - Nepal, Peru and Uganda - employed different concepts (such asCARE,PROVIA,etc.)inordertounderstandsocialvulnerabilityatthelocalandlarger-scalelevels,butdidnotuseany primarydataobtainedfromsurveys,interviews,focus-groupsorbyothermethods. As noted, these quantitative approaches to measuring social vulnerability are based on assumptions and models, and on simplification of a complex reality. In reality, we do not face“known knows”and a deterministic relationship, but rather“known unknowns”and“unknown unknowns”, or complicated and complex domains in terms of the Cynefin Framework8 . Complicated problems may contain multiple right answers, and, although there is a clear relationship between cause and effect, not everyone can see it. In general, good practice, as opposed to best practice, is more appropriateforproblemsinthecomplicateddomain. For instance, information for risk awareness can be provided through different channels - TV, radio, newspapers, social networks, by word of mouth, etc. - which can have different capacity to reach different groups and which are perceived differently. In case of complex problems, cause-and-effect relationships are not discernible in real time, only retrospectively.Tryingtosolveacomplexproblembybestpracticesorgoodpracticesresultsinitreturninginadifferent form;however,surprisinglysimplesolutionsemergetocomplexproblems. This calls for using qualitative methods to complement quantitative studies. For instance, UNDP successfully employed the micro-narratives technique9 in a number of cases, ranging from Green Economy in Belarus toWomen’s Entrepreneurship in Tajikistan10 and Roma poverty from a human development perspective (UNDP BRC, 2011)11 . Essentially,theapproachinvolvescollectingstories(narratives)andaskingtherespondentstotagthemaccordingtoa numberofcriteria.Thiscanhelpbetterunderstandthemeaningofvulnerabilitycriteria. The approach can also be used for identifying solutions by asking the following question:“How do we create more stories like this one and fewer stories like that one?”For instance, in the case ofTajikistan, we found out that the major obstacle for women’s entrepreneurship lay in their lack of self-confidence, not in high interest rates (as many had suggested). In case of Belarus, we found out that the Government information campaign had zero effect on behavior change,whileexamplesofneighborshadhugeimpact. Overview of the previous research indicates that there is a wide range of indicators that are being used in social vulnerability analyses. However, the methods for calculating the social vulnerability indexes are relatively similar in most situations. 9 http://cognitive-edge.com/sensemaker/#sensemaker-cases 8 Cynefin Framework Introduction, available at http://cognitive-edge.com/videos/cynefin-framework-introduction/ 11 http://www.eurasia.undp.org/content/rbec/en/home/library/roma/roma-poverty-human-development-perspective.html. 10 https://www.unpei.org/sites/default/files/e_library_documents/Women%20Empowerment%20in%20Tajikistan_0.pdf
  • 18. SOCIAL VULNERABILITY INDICATORS 18 SOCIAL VULNERABILITY ASSESSMENT TOOLS FOR CLIMATE CHANGE AND DRR PROGRAMMING A study of social vulnerability should develop a valid and reliable list of indicators and measure them in order to classify geographic units of various sizes and levels according to their vulnerability to the specific natural hazards or climate risks. Different sets of indicators should be applied to different types of natural hazards (for example floods, earthquakes, landslides, droughts, etc.) in situations where it is deemed that social vulnerability to these hazards is different in specific cases. However, the same sets of indicators can be applied to the geographic units regardless of their size (e.g., local self-government units of different levels) by aggregating the values of the social vulnerability indicators. At the end, the study should produce a map with the classification of geographic units according to their level of social vulnerability. • Putting in place / agreeing on a conceptual framework for measurement • Indicator development • Index calculation and application • Index validation • Index use These stages are shown in Figure 1 below INTRODUCTION Figure 1. Outline of the SVA study PILOT QUALITATIVE RESEARCH INDICATOR DEVELOPMENT WITHOUT PILOT QUALITATIVE RESEARCH INDEX CALCULATION AND APPLICATION INDEX VALIDATION QUANTITATIVE VALIDATION INDICATOR DEVELOPMENT QUALITATIVE VALIDATION
  • 19. SOCIAL VULNERABILITY INDICATORS SOCIAL VULNERABILITY ASSESSMENT TOOLS FOR CLIMATE CHANGE AND DRR PROGRAMMING 19 DEVELOPMENT OF INDICATORS In this stage of the study, a preliminary list of indicators suited to the local context and data availability should be developed. The starting point should be the list of indicators comprised by the so-called Social Vulnerability Index – SoVI12 . For example, this Index was used in the UNDP study on disaster risks and climate change in the former Yugoslav Republic of Macedonia, with indicators selected after a comprehensive review of the country’s legislation, national and regional policies and strategies and academic literature on the issue. However, this Index should probably be extended to include items related to social networks, and other possible aspects of social vulnerability not present in the Index. The preliminary list of indicators can be developed with or without performing a pilot qualitative study. The simplest way would involve desk research, wherein researchers would develop the list based on prior studies, as well as theoretical and practical knowledge. However, a desk research does not fully ensure that the list will be valid and well-suited to local circumstances. Thus, several types of qualitative analysis (in-depth interviews, Delphi method, focus groups) with the key informants (local experts and stakeholders), i.e. a pilot qualitative study, can be performed in order to produce the preliminary list of indicators to be used in the subsequent phases of the study. It is very important to note here that the list of indicators should be developed having in mind the local availability of data, and possibilities to repeat the research in the future. Namely, only indicators that are available for geographic units and can be expected to be available in the future should be included. It should be mentioned that indicators can have different meanings at the individual, community, regional and country levels. Moreover, tools available for data collection can have certain limitations related to the level of disaggregation. For instance, GDP per capita is a good indicator of the quality of life or human development opportunities. Spatially disaggregated GDP data, estimated by using the production method, measure the gross value added generated in a specific territory and its sources – but not necessarily its purpose (on what the income has been spent). Because sub-national jurisdictions may benefit from large inter-regional transfers by the central government (which are not reflected in sub-national gross value added data and the GDP estimates based on the production method), sub-national per capita GDP data can be poor measures of sub-national living standards and development prospects. GDP data are typically available at the regional level, but not at the provincial or municipal levels. Household surveys are an important tool for collecting various social vulnerability data (for instance, such a survey was used in the Georgia Social Vulnerability Study), but they also have their limitations. In most cases, household surveys operate at the level of households, not individuals, hence income and expenditures are average for all household members and mask intra-household inequalities. Because of their design, these surveys are representative at the country level. 12 Susan L. Cutter; Bryan J. Boruff; W. Lynn Shirley,“Social Vulnerability to Environmental Hazards,”Social Science Quarterly, Volume 84, Number 2, June 2003, pp. 242-261)
  • 20. SOCIAL VULNERABILITY INDICATORS 20 SOCIAL VULNERABILITY ASSESSMENT TOOLS FOR CLIMATE CHANGE AND DRR PROGRAMMING Last but not least, non-linearity and feedback loops should be borne in mind during the selection of the indicators. For instance, in Serbia, the number of NGOs per 1,000 inhabitants (proxy of civic engagement) was the highest in the most deprived municipalities. In other words, NGOs most probably have to step in where the Government fails to deliver services. In a similar vein, we found13 the highest level of social exclusion in Serbian municipalities with the highest and lowest voter turnouts. In Uzbekistan, the share of women in higher education (a proxy for gender equality) is the highest in the deprived region of Karakalpakstan, and the lowest in Tashkent, reflecting the structure of the education system - girl-dominated medical and pedagogical universities in Karakalpakstan and a mixture of institutions inTashkent.Therefore, the initial list of indicators, once prepared, needs to be reviewed by asking the following questions: What does this indicator mean at the local level and can I get it? How it is related to vulnerability? Why? In this process, weights can also be assigned to the variables in case that some variables are deemed more important than others. For example, this approach was taken in the UNDP study of social vulnerability in Georgia, where a combination of quantitative data (Household Budget Survey by GEOSTAT extended to 500 additional households in each target group) and qualitative data (focus groups and in-depth interviews with representatives) was used. In that case, the results of the focus groups and interviews helped design the set of indicators and their weights. The choice of a particular qualitative research method will depend on the assessment of its strengths and weaknesses in each particular case. For example, in-depth interviews require more time, but they provide in- depth knowledge of the research topic. Focus groups take less time and can generate more ideas using group dynamics. However, they can generate biased results due to group thinking and domination of high-status individuals. The Delphi method avoids this bias, but at the cost of losing the group dynamics. Furthermore, in line with guidelines developed by Bergstrand et al. (2015), it would be desirable to enlarge the concept of community resilience to natural hazards with social capital variables. Some examples of such variables include a sense of community, attachment to a place, sense of social support, civic participation, size of one’s personal social network, etc. The amount of a community’s social capital should be positively correlated to community resilience by providing a safety net that can help individuals cope with the disaster and recover from it more quickly. Several indicators of social vulnerability with their expected influence on social vulnerability are listed in the following Table 2 based on previous research and models. However, it should be noted that the actual influence is context-dependent, i.e. that it should be assessed in every individual study. Additionally, the list should not be taken as an exhaustive list of all possible indicators, but merely as a list of examples intended to improve understanding of the matter. 13 Supra 2
  • 21. SOCIAL VULNERABILITY INDICATORS SOCIAL VULNERABILITY ASSESSMENT TOOLS FOR CLIMATE CHANGE AND DRR PROGRAMMING 21 GROUP INDICATORS EXPECTED INFLUENCE increases social vulnerability decreases social vulnerability Socioeconomic GDP per capita Average monthly salary Unemployment level Number of socially dependent individuals/citizen Occupation (profession and managerial level) Occupation – open space (e.g., agriculture, construction) Economic sector (e.g., resource extraction) Demographics Age (proportion of youth and elderly population) Gender (female) Education Special needs/disability population Vulnerable minorities Immigrants Rapid population growth Family structure Single-parent households Single-member households Large families
  • 22. SOCIAL VULNERABILITY INDICATORS 22 SOCIAL VULNERABILITY ASSESSMENT TOOLS FOR CLIMATE CHANGE AND DRR PROGRAMMING GROUP INDICATORS EXPECTED INFLUENCE increases social vulnerability decreases social vulnerability Medical services Number of medical personnel per capita Number of hospitals per capita Average distance from nearest hospital Urban Percentage of urban population Renters Percentage of renters Built environment vulnerability Population density Quality of infrastructure Age of infrastructure Average property value Social capital Sense of community Attachment to a place Perceived level of social support Civic participation Particular indicators can be presented at several hierarchy levels. For example, in the figure below, taken from UNDP study in Georgia, we can see how household resources (characteristics) can be analysed on some domain levels with sub-domains and content indicators groups. For example, domain“Human resources”can be measured through sub-domains “Education” (with “Educational attainment” and “Quality of education” as content indicators),“Labor”and“Health”. Source: Adapted from Cutter, S.L.; Boruff, B.J.; Shirley, W.L. (2003); Holand, I.S.; Lujala, P.; Rød, J.K. (2011); Holand, I.S.; Lujala, P. (2013); Bergstrand, Kelly; Mayer, Brian; Brumback, Babette, Zhang, Yi (2015). Table 2. List of Examples of Social Vulnerability Indicators
  • 23. SOCIAL VULNERABILITY INDICATORS SOCIAL VULNERABILITY ASSESSMENT TOOLS FOR CLIMATE CHANGE AND DRR PROGRAMMING 23 DOMAIN SUB-DOMAIN CONTENT INDICATORS Material resources Financial resources Income Savings Debts Type of income Physical resources Land Livestock House/apartment Durable goods Quality of housing Human resources Education Educational attainment Quality of education Labor Employment Type of employment Health Health status Chronic illness Social resources Social network Size Status Connection Information & communication Source of information Means of communication Community Presence of associations Variety of associations Source: Gassmann, Berulava, Tokmazishvili et all. Economic and social vulnerability in Georgia Table 3. Characteristics of household resources
  • 24. SOCIAL VULNERABILITY INDICATORS 24 SOCIAL VULNERABILITY ASSESSMENT TOOLS FOR CLIMATE CHANGE AND DRR PROGRAMMING An example of the list of indicators with their definitions and data sources that have been used in UNDP study in the City of Skopje is shown in the Table 4 below. This case provides an example of the specification of social vulnerability indicators according to their importance in a particular context and availability of data sources. For example, the percentage of Roma population as a vulnerable minority was identified as an indicator that increases social vulnerability. CHARACTERISTICS INDICATOR INPUT DATA AND THEIR SOURCE HIGHER VALUES OF INDICATORS CONTRIBUTE TO DEMOGRAPHIC CHARACTERISTICS 1 Rapid population growth: Average annual rate of population growth in the municipality The former Yugoslav Republic of Macedonia Statistical Office biannual population estimates by municipality and authors’estimates for some of the Skopje municipalities Increased social vulnerability 2 Young population: % share of the population on age under 6 years in the total population of the municipality Increased social vulnerability 3 Elderly population: % share of the population on age 65 years and plus in the total population of the municipality Increased social vulnerability 4 Ethnicity: % share of the Roma population in the total population of the municipality The former Yugoslav Republic of Macedonia 2002 Population and Housing Census Increased social vulnerability 5 Special needs population: % share of the population with disabilities in the total population of the municipality Administrative data, Ministry for labor and social policy Increased social vulnerability ECONOMIC 6 Employment: number of registered unemployed persons (active and passive job seekers) per 100 persons of working age (15-64) Administrative data, The former Yugoslav Republic of Macedonia National Employment Agency Increased social vulnerability
  • 25. SOCIAL VULNERABILITY INDICATORS SOCIAL VULNERABILITY ASSESSMENT TOOLS FOR CLIMATE CHANGE AND DRR PROGRAMMING 25 CHARACTERISTICS INDICATOR INPUT DATA AND THEIR SOURCE HIGHER VALUES OF INDICATORS CONTRIBUTE TO LIVING CONDITIONS 7 Housing conditions, water supply system: % of households with piped water from a community scheme Authors’estimates based on data on registered users from the public water supply and sewage company, data from the 2002 Population and Housing Census and information published on municipal web portals and in their Environmental Local Action Plans Reduction of the social vulnerability 8 Housing conditions, sewage disposal system: % of households with a piped system connected to a public sewage disposal system Reduction of the social vulnerability 9 Living environment, access to medical services: doctors- physicians, number of general practitioners per 10,000 residents Administrative data from the Public Health Institute Center for Public Health - Skopje Reduction of the social vulnerability Source: Socio-Economic Vulnerability Assessment of the Population in the Ten Municipalities of the City of Skopje in relation with Disaster Risks and Climate Change (National Consultant: MSc Katerina Kostadinova-Daskalovska). Table 4. List of Indicators Including Their Definitions and Data Sources Since the indicators of social vulnerability are highly country-specific, it is recommended that SVA process engage local experts to participate in the qualitative research. Thus, the development of indicators should include desk research, qualitative research involving local experts and a population survey (as feasible). Another example is from the Croatian study. In order to determine the vulnerability levels of the respective communities (municipalities/cities) within one area (at the county or national level), all the results derived from the respective vulnerability assessments were compared with the common denominator – in this particular case, seven respective communities (villages, municipalities, cities) were compared with the higher level territorial unit i.e. a county. Similarly, all the counties can be compared at the national level i.e. at the country/state level.
  • 26. SOCIAL VULNERABILITY INDICATORS 26 SOCIAL VULNERABILITY ASSESSMENT TOOLS FOR CLIMATE CHANGE AND DRR PROGRAMMING CSVP COMPARABILITY TABLE COMMUNITIES 1-7 CSV PROFILE AGE(V) GENDER(V) EDUCATION(V) MINORITY(V) INCOME(V) DISSABILITY (V) RESULT CSVP Community 1 + + + + + + 0 +6 H Community 2 - + + + + + -1 +5 H Community 3 - - + + + + -2 +4 M Community 4 - - - + + + -3 +3 M Community 5 - - - - + + -4 +2 M Community 6 - - - - - + -5 +1 L Community 7 - - - - - - -6 0 L Table 5. Values of Vulnerability Indicators Source: Comparable Social Vulnerability Profiling – CSVP Case Study: Croatia (2015) Comparable Social Vulnerability Profiling (CSVP) tested in Croatia in fact presents a very simplified and user friendly method that can be implemented even at the local level without the need for expert support wherefore it basically provides a foundation for future project planning (see Annex 4 for more details on the methodology). Therefore, the CSVP methodology relies on the following two important pillars: data simplicity and comparability.The aim of the method is to present a systematic and logical process to determine vulnerability data disaggregation, which is easily understandable and essentially of a rather simplified nature, meaning that no weighting was added to the indicators. In order to address the problem of vulnerability data that were scattered, inconsistent and in need of systematization, the CSVP opted to use the census data as they are collected systematically and then professionally analyzed by the Croatian Bureau of Statistics.
  • 27. SOCIAL VULNERABILITY INDICATORS SOCIAL VULNERABILITY ASSESSMENT TOOLS FOR CLIMATE CHANGE AND DRR PROGRAMMING 27 Furthermore, these data are temporally consistent (the Census is conducted every ten years), easy to use and in that sense, fully adaptable to the needs of this social vulnerability methodology. Furthermore, census based data collection/analysis has to be: a) related to some sort of geographic scale (level of municipality/ city/county) sufficient to identify demographic differences determining the location of vulnerable population groups; and b) flexible and, most importantly, applicable in different phases of the disaster cycle and different event types, depending on how the readily accessible components best fit the user’s needs. Still, the use of such census based data (in this case CSVP) may have some limitations. One of the limitations is the rapidly changing composition of an area in the past few years.This can be caused by rapid and large-scale migration or triggered by population relocation due to extreme natural disasters. In that context, the census data, having a 10-year temporal span, can be considered outdated. Another problem arising from the use of census data is that the census firstly registers the people’s permanent residence and not their temporary residence. Secondly, the census registers the people by where they live, not necessarily by where they work so that the question of commuters also presents a limitation in the process. However, as already noted, even though it understood census data limitations, the CSVP opted to use census data since it had no other option and the data served the purpose.
  • 28. SOCIAL VULNERABILITY INDICATORS 28 SOCIAL VULNERABILITY ASSESSMENT TOOLS FOR CLIMATE CHANGE AND DRR PROGRAMMING In this phase of the SVA, primary data (in most cases collected through surveys) and secondary data (in most cases these would be the census data or other data collected by the public administration) are collected. F2F/ field surveys (CAPI or paper-pencil), telephone surveys (CATI), or web-based (online) surveys can be used as a data collection method. The choice of the particular data collection method will depend on the available budget (field surveys being the most expensive and online surveys the least expensive in most cases), time constraints (field surveys being the most time-consuming) and sampling issues (phone connection coverage, Internet connection coverage). Whichever is chosen, it is preferable to use automated methods of data entry based on online platforms. For example, in case of field surveys, it would be preferable to use laptops or tablets with a wireless connection in order to be able to directly enter the collected data into a database. Similarly, a telephone survey should preferably involve direct data entry (computer-assisted telephone interviewing). All variables should be defined at the highest possible measurement level. For example, the interval measurement level should be used whenever possible, i.e. variable levels should be collapsed into classes only when necessary (when a variable is of an ordinal nature, or when some data are deemed personal by the respondents). If response classes (ordinal variables) are used, the number of classes should be as high as possible (i.e., the data should be as precise as possible) in order to be able to proceed with a meaningful quantitative analysis (principal component analysis). For instance, if age categories (classes) are used, they should be as wide as possible. The variables should be standardized (e.g., z-values) and subjected to the principal component analysis in order to check their dimensionality and avoid redundancy, and to produce the composite social vulnerability index score for every geographic unit. Geographic units can be divided into several groups (e.g., low-risk, medium-risk, high-risk) depending on the value of the index. Comparability across the studies can be ensured by using percentiles as cut-off lines. For example, low-risk units can be classified as those below the 20th percentile, medium- risk units as those between the 20th and 80th percentiles, and high-risk units as those scoring at the 80th percentile or more. When conducting the principal component analysis, it is customary to select factors with Eigenvalues higher than one, to exclude outliers (e.g., z-values larger than five), and to substitute the means of the variables for the missing values. Additionally, the factor solution can be validated through use of scree plots and/or parallel analysis. The extracted factors should be rotated using orthogonal rotation, such as Varimax rotation. After the final factor solution, scores are calculated, indicating the level of social vulnerability of a geographic unit at issue. The factors need to be theoretically interpreted before adding factor scores in order to produce the composite index of social vulnerability. INDEX CALCULATION AND APPLICATION
  • 29. SOCIAL VULNERABILITY INDICATORS SOCIAL VULNERABILITY ASSESSMENT TOOLS FOR CLIMATE CHANGE AND DRR PROGRAMMING 29 Namely, the results/number of points of factors increasing social vulnerability should be given plus signs, and the results/number of points of factors decreasing social vulnerability should be given minus signs. It also needs to be noted that the number of geographic units should be sufficiently high to enable the implementation of a meaningful and reliable principal component analysis. As a rule of thumb, the ratio of sample size (number of units) and number of variables should be at least 5-10 (Cattell, 1978; Everitt, 1975). As per mapping the results of a social vulnerability study, different tools and approaches can be used, depending on their availability and the preferences of the authors of the study. For example, the simplest method of map development that can be used for the project preparation phase is in fact the use of image editing software (e.g., MS Paint) or any other free or licensed software tools. For example, an online map-making tool Mapchart.net provides the possibility of subdividing a country into administrative units of different levels and painting them in different colors (the background and the border colors of the map can also be changed). The created map can be saved as an image and used in research reports. Similar opportunities are provided by National Geographic Interactive, Scribble Maps, and other tools14 . There are also some other inexpensive, web based and open source GIS tools that can support geospatial analysis of social vulnerability data and plotting data points of maps, such as R map-making packages and free DevInfo. More experienced users can opt for the ArcGIS and/or GRASS GIS tools, but the most important thing to note is that, no matter which map-making tool one chooses, it is in fact all about creating, manipulating and visualizing the collected social vulnerability data, or, for that matter, any other data in a map. No matter which GIS model is used, it is envisaged that social vulnerability visualization will be supported by the provision of relevant geospatial information and its connection to the respective vulnerability indicators. GIS data presented in such a manner can furthermore provide pointers for structured DRR/CCA reduction prevention and preparedness planning and adequate disaster response. 14 For examples of social vulnerability mapping, see Annex 2. The choice of the appropriate data collection method should be based on local circumstances, budget constraints, and project goals.
  • 30. SOCIAL VULNERABILITY INDICATORS 30 SOCIAL VULNERABILITY ASSESSMENT TOOLS FOR CLIMATE CHANGE AND DRR PROGRAMMING Figure 2. Example of Social Vulnerability Index Mapping Created by MS Paint (CSVP Croatia) Figure 3. Example of SV Index Mapping Created by Mapchart.net (Fictional Results) Low Medium low Medium Medium high High High Medium Low
  • 31. SOCIAL VULNERABILITY INDICATORS SOCIAL VULNERABILITY ASSESSMENT TOOLS FOR CLIMATE CHANGE AND DRR PROGRAMMING 31 INDEX VALIDATION In this stage of the study, the validity of the index will be checked. This can be done in two ways. One involves qualitative research (in-depth interviews, Delphi method, focus groups) with the key informants (local experts and stakeholders) who will check the value of the index for the geographic units from their own perspective. The selection of the qualitative method will have to take into account the same considerations as the ones borne in mind during the development of the preliminary list of indicators. Validity can also be checked by calculating correlation with the number of disaster declarations in the geographic unit, or another measure of disaster frequency and severity, if available. After validation, the final list of indicators and final index scores will be calculated. INDEX CALCULATED. WHAT NEXT? An index calculation disaggregation exercise should serve a well-defined purpose. The primary question to answer is Why are we doing it? One major reason is (or can be) to provide better inputs into local policy making. For that purpose, however, the index should be consistent in terms of inputs, outputs, and outcomes (and ideally impact) - what exactly are we measuring? It should be clearly understood (and communicated) in vulnerability debates that the index is the starting point, not the end.The calculation of the index only makes sense if it is linked to a broader set of disaggregated indicators for a more in-depth analysis and better argumentation of the underpinning assumptions, or linked to qualitative tools, which help identify and test the solutions. The contextual linkages will then become clearer and the information the index components provide (for example how a certain municipality or group of people has reached its (non-)vulnerability level, where it lags behind, etc.) will be relevant from the policy and practice perspectives. The index can be used for a number of mutually non-exclusive purposes, including comparison, diagnostics, and monitoring. The Buffalo Regional Institute’s Resilience Capacity Index (RCI)15 is an example of using the index for comparison. RCI is a single statistic summarizing a region’s status on twelve factors hypothesized to influence the ability of a region to bounce back from a future unknown stress. The index permits comparisons across metropolitan regions and identification of strong and weak conditions relative to other metropolitan regions. The ARUP/Rockefeller Foundation’s City Resilience Index16 is an example of using the index as a diagnostic tool, which gives cities a tool to understand their resilience, and shape urban planning, practice and investment. Each city’s resilience profile is generated by assessing its current state against 12 goals and 52 indicators. This provides a holistic overview of a city’s resilience across four key dimensions: People, Organization, Place, and Knowledge. Index can be used for monitoring through repeating calculations. 15 http://brr.berkeley.edu/rci/ 16 http://www.cityresilienceindex.org/
  • 32. CONCLUSIONS AND RECOMMENDATIONS 32 SOCIAL VULNERABILITY ASSESSMENT TOOLS FOR CLIMATE CHANGE AND DRR PROGRAMMING Disaster statistics in the past twenty years show a higher percentage of women, children and other socially vulnerable groups among disaster victims. There is no question that socially vulnerable people are more exposed to and affected by the impacts of climate change and disasters. For that reason, recognition and understanding of the social vulnerability of various groups at the local, regional and country levels can significantly reduce damages and losses and provide the most appropriate interventions for adaptations and risk management. Social vulnerability is most commonly defined as “the differential capacity of groups and individuals to deal with hazards, based on their positions within physical and social worlds” (Dow, 1992), or as “the inability to take effective measures to insure against losses”(Bogard, 1989). Although there are dozens of social vulnerability methodologies used worldwide, they are not systematically integrated into the overall process of climate and disaster risk management. There are a number of methodological issues in defining and mapping the socially vulnerable population among the overall population. Almost all SVA methodologies use parameters, such as household income, gender, age, disability, language, literacy or family status, but still there is a significant problem with data availability (i.e. census, pre- and post- disaster studies, public surveys, etc.). In many countries or their regions, the data do not exist, are outdated or of poor quality. Some of the social vulnerability parameters, such as level of education, age, gender etc., are collected at the individual level, while others, such as infrastructure quality and urban/rural division, are collected at the community level. The UNDP pilot projects referred to in this Guide addressed various climate-induced threats and impacts, targeting the most vulnerable communities at the country and provincial levels, and focusing on building resilience and ensuring sustainable development. Some of them used census data (Macedonia, Croatia), some used data obtained through surveys (Kyrgyzstan and Georgia, for example), while others only used the data obtained through screening and quantification of potential risks in a particular area (Rioni Basin in Georgia and the Nepal, Peru and Uganda study). In conclusion, a study of social vulnerability should provide a valid and reliable list of indicators that can classify geographic units of various sizes and levels by their vulnerability to specific natural hazards. Such a study should comprise the following three main stages: 1) indicator development, 2) index calculation and application, and 3) index validation. The preliminary list of indicators based on the local context and on the screening of the baseline situation should be developed in the first stage.This can be done by desk research, in-depth interviews, Delphi-method, focus groups, etc. The so-called Social Vulnerability Index (SoVI) can serve as a good starting point. In the second stage – index calculation and application – the SVA study will take primary data (mainly from surveys)and/orsecondarydata(inmostcasescensusdataorotherdatacollectedbythepublicadministration). CONCLUSIONS AND RECOMMENDATIONS
  • 33. CONCLUSIONS AND RECOMMENDATIONS SOCIAL VULNERABILITY ASSESSMENT TOOLS FOR CLIMATE CHANGE AND DRR PROGRAMMING 33 The variables used in the study should be standardized and subjected to a principal component analysis in order to check their dimensionality and avoid redundancy. A composite social vulnerability index score for every geographic unit should be produced in result. Geographic units can be divided into several groups (e.g., low-risk, medium-risk, high-risk), depending on the value of the index. In the third and final stage, a validity check of the index will be carried out either through qualitative research with the key informants (such as local experts and stakeholders), or by calculating correlations with the number of disaster declarations in the geographic unit, or another available measure of disaster frequency and severity. After validation, the final list of indicators and final index scores is to be calculated. The final data should be provided in numerical form, as well as through mapping (i.e. visual representation).
  • 34. ANNEX 1 34 SOCIAL VULNERABILITY ASSESSMENT TOOLS FOR CLIMATE CHANGE AND DRR PROGRAMMING The purpose of this Annex is to present indicative timelines so that UNDP project managers can plan their activities in order to conduct social vulnerability studies. This Annex outlines indicative timelines which are tentative, depend on the country, level of capacity, data availability, type of hazard, etc. It can also be assumed that timelines and study budgets are interdependent. SVA INDICATIVE TIMELINES SIZE INDICATORS DEVELOPMENT INDEX CALCULATION INDEX VALIDATION TOTAL DURATION City/municipality Desk research (1 month) 1 month - 2 months County Desk research (2 months) 1 month - 3 months State Desk research (3 months) 1 month - 4 months Figure 4. Indicative Timeline for Conducting a Simplified SVA The above Figure 4 presents the most simplified version of a SVA when its implementation does not include qualitative research in Stage 1 (indicator development) and Stage 3 (index validation). The timeline changes and reflects the size of the geographic area (city, state, region) targeted by the SVA. INDICATORS DEVELOPMENT 1 MONTH 1 MONTH INDEX CALCULATIONS
  • 35. ANNEX 1 SOCIAL VULNERABILITY ASSESSMENT TOOLS FOR CLIMATE CHANGE AND DRR PROGRAMMING 35 INDICATORS DEVELOPMENT INDEX CALCULATIONS 1 MONTH 1 MONTH 1 MONTH INDEX VALIDATION LEVEL OF RESEARCH INDICATORS DEVELOPMENT INDEX CALCULATION INDEX VALIDATION TOTAL City/ municipality 1. Desk research (1 month) 2. In-depth interviews (10 interviews) (1 month) or Focus groups (1 month) or Delphi method (1 month) 1 month 1 month 4 months County 1. Desk research (2 months) 2. In-depth interviews (10 interviews) (1 month) or Focus groups (1 month) or Delphi method (1 month) 1 month 1 month 5 months State 1. Desk research (3 months) 2. In-depth interviews (10 interviews) (1 month) or Focus groups (1 month) or Delphi method (1 month) 1 month 1 month 6 months Figure 5. Indicative Timeline for Conducting a Mid-Level Complexity SVA The above Figure 5 presents the mid-level complexity version of a SVA, the implementation of which includes qualitative research in Stage 1 (indicator development) and correlational validation in Stage 3 (index validation). The timeline changes and reflects the size of the geographic area (city, state, region) targeted by the SVA.
  • 36. ANNEX 1 36 SOCIAL VULNERABILITY ASSESSMENT TOOLS FOR CLIMATE CHANGE AND DRR PROGRAMMING The above Figure 6 presents the complex version of a SVA, the implementation of which involves qualitative research in Stage 1 (indicator development) and qualitative validation in Stage 3 (index validation). The timeline changes and reflects the size of the geographic area (city, state, region) targeted by the SVA. Figure 6. Indicative Timeline for Conducting a Complex SVA INDICATORS DEVELOPMENT INDEX CALCULATIONS 2 MONTHS 1 MONTH 1 MONTH INDEX VALIDATION LEVEL OF RESEARCH INDICATORS DEVELOPMENT INDEX CALCULATION INDEX VALIDATION TOTAL City/ municipality 1. Desk research (1 month) 2. In-depth interviews (10 interviews) (1 month) or Focus groups (1 month) or Delphi method (1 month) 1 month 1 month 5 months County 1. Desk research (2 months) 2. In-depth interviews (10 interviews) (1 month) or Focus groups (1 month) or Delphi method (1 month) 1 month 1 month 6 months State 1. Desk research (3 months) 2. In-depth interviews (10 interviews) (1 month) or Focus groups (1 month) or Delphi method (1 month) 1 month 1 month 7 months
  • 37. ANNEX 2 SOCIAL VULNERABILITY ASSESSMENT TOOLS FOR CLIMATE CHANGE AND DRR PROGRAMMING 37 17 Costs needed to manage the entire process were not included in this estimation. Costs of the study17 vary significantly from one country to another. Costs related to the market research and public opinion polling are estimated for mid-range countries of the ESOMAR Global Prices Study, such as Croatia, Serbia, Romania, Bulgaria, Ukraine, etc. The price levels are higher in more developed nations and lower in less developed countries. Countries with the highest price levels, such as Switzerland, the UK, Sweden, Germany, Denmark, France and the Netherlands, probably have about 50% higher prices than those listed in Table 6 below. Estimated costs are higher if an additional survey research needs to be performed to collect the data that cannot be collected from official statistics, or if the data are outdated/unreliable. The estimated survey research costs are listed in Annex 2. TheresponsibilitiesforthespecificstagesoftheresearchshouldbedividedbetweentheSVAexpert/consultant and the market research/public opinion company. Namely, it is recommended that the company should be responsible for the survey research, as well as for qualitative research (in-depth interviews, focus groups, Delphi method), whereas the SVA expert/consultant should perform the desk research, index calculation and validation. The SVA expert/consultant should also assist the company in developing its part of the research (interview guide, focus group guide, etc.). The costs of the expert/consultant are calculated on the premise of a $200 daily fee (other expenses excluded). It is expected that version one (seeTable 6 below) shall require 30 expert’s working days, version two 45 working days, and version three 60 working days. SVA COST ESTIMATES SIZE INDICATOR DEVELOPMENT INDEX CALCULATION INDEX VALIDATION TOTAL COSTS City/ municipality Desk research 4000 2000 - 6000 County Desk research 4000 2000 - 6000 State Desk research 4000 2000 - 6000 Table 6. SVA Costs without Qualitative Research in Stage 1 and without Stage 3 (in USD)
  • 38. ANNEX 2 38 SOCIAL VULNERABILITY ASSESSMENT TOOLS FOR CLIMATE CHANGE AND DRR PROGRAMMING Table 7. SVA Costs with Qualitative Research in Stage 1 and Correlational Validation in Stage 3 (in USD) LEVEL OF RESEARCH INDICATORS DEVELOPMENT INDEX CALCULATION INDEX VALIDATION TOTAL City/ municipality 1. Desk research 4000 2. In-depth interviews (10 interviews) (2000) or Focus groups (2000) or Delphi method (1000) 3000 2000 10000 – 11000 County 1. Desk research 4000 2. In-depth interviews (10 interviews) (2000) or Focus groups (2000) or Delphi method (1000) 3000 2000 10000 – 11000 State 1. Desk research 4000 2. In-depth interviews (10 interviews) (2000) or Focus groups (2000) or Delphi method (1000) 3000 2000 10000 – 11000 Table 8. SVA Costs with Qualitative Research in Stage 1 and Qualitative Research Validation in Stage 3 (in USD) LEVEL OF RESEARCH INDICATORS DEVELOPMENT INDEX CALCULATION INDEX VALIDATION TOTAL City/ municipality 1. Desk research (4000) 2. In-depth interviews (10 interviews) (2000) or Focus groups (2000) or Delphi method (1000) 3000 2000 13000 – 15000 County 1. Desk research (4000) 2. In-depth interviews (10 interviews) (2000) or Focus groups (2000) or Delphi method (1000) 3000 2000 7000 - 11000 State 1. Desk research (4000) 2. In-depth interviews (10 interviews) (2000) or Focus groups (2000) or Delphi method (1000) 3000 2000 7000 - 11000
  • 39. ANNEX 2 SOCIAL VULNERABILITY ASSESSMENT TOOLS FOR CLIMATE CHANGE AND DRR PROGRAMMING 39 Type/Sample Size N=500 N=1000 N=2000 Online 1500 - 2000 3000 – 4000 6000 – 8000 CATI 2000 – 2500 4000 – 5000 8000 – 10000 F2F 3000 – 3500 6000 – 7000 12000 – 14000 Table 9. Estimated Survey Costs in USD (Data Collection, Average Duration 15 Minutes) Note: These market research and public opinion polling costs are estimated (according to the ESOMAR Global Prices Study) for mid-range countries, such as Croatia, Serbia, Romania, Bulgaria, Ukraine, etc. The price levels are higher in more developed countries and lower in less developed countries. Countries with the highest price levels, such as Switzerland, the UK, Sweden, Germany, Denmark, France and the Netherlands, probably have about 50% higher prices than those listed in the above Table.
  • 40. ANNEX 3 40 SOCIAL VULNERABILITY ASSESSMENT TOOLS FOR CLIMATE CHANGE AND DRR PROGRAMMING The SVA expert/consultant shall: 1. Conduct desk research 2. Develop social vulnerability indicators based on the desk research and qualitative and (possibly) quantitative research conducted by a market research/public opinion company 3. Assist the market research/public opinion company in developing interview/focus group/Delphi method guides for the pilot research and validation research 4. Assist the market research/public opinion company in developing a survey questionnaire (in case a survey will be conducted) 5. Calculate social vulnerability indexes, map the results and prepare the research report OUTLINE OF THE TERMS OF REFERENCE (DELIVERABLES) The market research/public opinion company shall: 1. Develop interview/focus group/Delphi method guides for pilot research and validation research in cooperation with the expert/consultant 2. Conduct focus groups/interviews, Delphi method research and prepare the data transcripts 3. Develop a survey questionnaire in cooperation with the expert/consultant (in case a survey will be conducted) 4. Conduct a survey and deliver the survey research data in the appropriate form (in case a survey will be conducted)
  • 41. ANNEX 4 SOCIAL VULNERABILITY ASSESSMENT TOOLS FOR CLIMATE CHANGE AND DRR PROGRAMMING 41 COMPARABLE SOCIAL VULNERABILITY PROFILING (CSVP) – CASE STUDY IN CROATIA Comparable Social Vulnerability Profiling (CSVP) tested in Croatia in 2015 presents a very simplified and user friendly method that can be implemented even at the local level without the need for expert support wherefore it basically provides a foundation for future project planning. The CSVP methodology relies on two important pillars: data simplicity and comparability. The CSVP opted to use the census data as they are collected systematically and then professionally analyzed by the Croatian Bureau of Statistics. Furthermore, these data are temporally consistent (the Census is conducted every ten years), easy to use and in that sense, fully adaptable to the needs of this social vulnerability methodology. Furthermore, census based data collection/analysis has to be: a) related to some sort of geographic scale (level of municipality/city/county) sufficient to identify demographic differences determining the location of vulnerable population groups; and b) flexible and, most importantly, applicable in different phases of the disaster cycle and different event types, depending on how the readily accessible components best fit the user’s needs. In order to determine the vulnerability levels of the respective communities (municipalities/cities) within one area (at the county or national level), all the results derived from the respective vulnerability assessments were compared with the common denominator – in this particular case, seven respective communities (villages, municipalities, cities) were compared with the higher level territorial unit i.e. a county. Selection of CSVP Variables Selected variables comprising CSVP indicators were restricted to quantifiable indicators. Furthermore, the CSVP was limited exclusively to vulnerability indicators so that no hazard indicators were included in the study. In line with the 2011 Census data, six vulnerability indicators were included: Age, Gender, Disability/ Dependency, Income, Minorities and Education. The CSVP does not apply weights to vulnerability indicators, therefore the six presented indicators are considered to be independent and equally important variables. The reasoning behind this decision is that standardization in terms of the weighting and aggregation of indicators is a subjective process and different methods of weighting and aggregation may lead to conflicting results. Moreover, even though any single one of the given indicators in isolation does not have to make a person vulnerable, a combination of these indicators, or the relationship between the indicators, may render an individual highly vulnerable18 . As such a process would call for a more comprehensive study, the CSVP does not explore these effects of combinations of particular indicator values compared with other combinations. 18 Dwyer et al., 2004
  • 42. ANNEX 4 42 SOCIAL VULNERABILITY ASSESSMENT TOOLS FOR CLIMATE CHANGE AND DRR PROGRAMMING The CSVP uses the experiences of SoVI – the Social Vulnerability Indicator (analyzing 11 key variables from the U.S. Census)19 but it is still closer to Social Vulnerability Profiling (SVP), which is similar to SoVI but uses fewer variables. Furthermore, the CSVP, which applies the same methodology as SVP, is performed by obtaining the relevant census information for each of the indicator variables for the project area at the appropriate level of the spatial scale. Once the data have been assembled, they can be summarized using basic percentages and proportions to compare and contrast areas. As opposed to the SoVI, it does not employ a statistical procedure to generate vulnerability dimensions. The method provides a simpler and more straightforward way of characterizing socially vulnerable populations than the SoVI20 . Therefore, this paper presents the CSVP variables, derived from the 2011 Census in Croatia, in total figures and in percentages, thus creating a background for simplified comparable analysis. Each of the six vulnerability indicators with associated increased vulnerability namely population under 15 and over 65 years of age, female population, population without secondary education, vulnerable minorities, population without income and disabled/dependent population is marked with a plus sign “+“ and colored red as that group is considered more vulnerable to natural disasters. On the other hand, population between 15 and 65 years of age, male population, population with secondary or higher education, majority population-majorities, population with income and population without a disability/dependency is marked with a minus sign “-” and colored green as that group is considered less vulnerable to natural disasters. The share of the CSVP vulnerable population group in the total population is then calculated in the following manner: 19 http://webra.cas.sc.edu/hvri/products/soci.aspx 20 Social vulnerability to natural hazards – Sue Tapsell, Simon McCarthy, Hazel Faulkner, Megan Alexander – Flood Hazard Research Centre (FHRC), Middlesex University CSVP variable (CSVPv) = Total number of vulnerable group Total number of population X 100% Once all the vulnerability variables are mathematically calculated they are all included in one overall table representing the Comparable Social Vulnerability Profile of the respective municipality/city/county.This CSVP “ID-card”is the foundation for all the comparisons that will follow in step two. In this calculation segment, once all the vulnerability variables are calculated and presented in overall vulnerability tables, the calculated figures can be compared head-to-head between the respective municipalities, cities and counties. Comparisons can also be made between the above mentioned categories as long all the vulnerability variables can be compared. As mentioned, vulnerability variables are presented as a share of the respective category in the total population. Only variables recognized as increasing the level of vulnerability are being compared (marked with the plus sign“+“and colored red).
  • 43. SOCIAL VULNERABILITY ASSESSMENT TOOLS FOR CLIMATE CHANGE AND DRR PROGRAMMING 43 Theresultofthiscomparisonispresentedforeachvulnerabilitycategoryrespectively(e.g.aspecificcommunity can have higher vulnerability in terms of the AGE variable and lower vulnerability in the EDUCATION variable). And finally, as there are six vulnerability categories represented without weighting, meaning that they are all of equal value, overall comparison is conducted in the following manner: a community having 4, 5 or 6 higher vulnerability categories is recognized as more vulnerable (as opposed to a community with 1 or 2 higher vulnerability categories, which is recognized as less vulnerable). In case more than one of the compared communities have three vulnerability categories, all of them are recognized as equally vulnerable. And finally, in order to determine the vulnerability levels between the respective communities (municipalities/ cities) within one area (at the county or national level), all the results derived from the respective vulnerability tables need to be compared against a common denominator - either a county or the state. Each respective community vulnerability variable is then compared with the reference vulnerability variable. If the respective community vulnerability variable is higher than the reference vulnerability variable, it is colored red. In the opposite case, it is colored green, meaning that the vulnerability of the community is lower than that of its reference point (county/state) with respect to that particular variable.. Vulnerability variables colored red (higher than the reference vulnerability) are then added up and presented by a value ranging from zero to“plus”six (0 to +6). This field is also colored red. Vulnerability variables colored green (lower than the reference vulnerability) are then added up and presented by a value ranging from zero to“minus”six (0 to -6). This field is also colored green. Overall community (municipality/city) vulnerability when cross-referenced to the common denominator (county/state) is determined in the following manner: • Communities with zero or one (0 or 1) higher vulnerability variables (colored red and marked with a plus sign) are recognized as“low vulnerability communities”and colored green • Communities with two (2) higher vulnerability variables (colored red and marked with a plus sign) are recognized as“medium-low vulnerability communities”and colored light-green • Communities with three (3) higher vulnerability variables (colored red and marked with a plus sign) are recognized as“medium vulnerability communities”and colored yellow • Communities with four (4) higher vulnerability variables (colored red and marked with a plus sign) are recognized as“medium-high vulnerability communities”and colored orange • Communities with five or six (5 or 6) higher vulnerability variables (colored red and marked with a plus sign) are recognized as“high vulnerability communities”and colored red The final result of this calculation method is presented inTable 10 below where all the cities and municipalities in a Croatian county were analyzed by using the county level as the common denominator. ANNEX 4
  • 44. ANNEX 4 44 SOCIAL VULNERABILITY ASSESSMENT TOOLS FOR CLIMATE CHANGE AND DRR PROGRAMMING Table 10. CSVP Vulnerability Table – Final Result Source: Comparable Social Vulnerability Profiling – CSVP Case Study: Croatia (2015) CSVP Comparability Table Lika-Senj County CSV Profile Age (v) Gender (v) Education (v) Minority (v) Income (v) Disability (v) RESULT CSVP Lika-Senj 43.96% 50.23% 57.67% 14.76% 29.34% 20.65% REFERENCE Lovinac 50.55% 48.16% 61.47% 16.48% 23.04% 18.67% -3 +3 M Brinje 40.69% 50.58% 67.69% 6.54% 35.04% 25.49% -2 +4 M-H Donji Lapac 38.76% 49.69% 57.31% 80.97% 18.22% 18.84% -5 +1 L Gospić 37.23 50.33% 56.43% 6.02% 30.83% 20.21% -4 +2 M-L Karlobag 40.13% 50.49% 54.42% 4.14% 24.54% 23.45% -4 +2 M-L Novalja 37.1% 49.3% 52.01% 3.38% 30.74% 14.14% -5 +1 L Otočac 37.49% 49.99% 42.11% 7.83% 32.51% 20.09% -5 +1 L Perušić 46.1% 49.7% 67.32% 8.91% 25.44% 25.36% -3 +3 M Plitvička J. 37.34% 51.13% 57.42% 28.17% 30.76% 18.39% -3 +3 M Senj 34.88% 50.61% 52.98% 2.3% 27.67% 16.42% -5 +1 L Udbina 42.74% 50.43% 63.98% 52.35% 22.41% 26.31% -2 +4 M-H Vrhovine 40.19% 50.76% 57.06% 80.96% 21.87% 14.12% -4 +2 M-L Low HighMedium Medium low Medium high
  • 45. SOCIAL VULNERABILITY ASSESSMENT TOOLS FOR CLIMATE CHANGE AND DRR PROGRAMMING 45 REFERENCES Bergstrand, Kelly; Mayer, Brian; Brumback, Babette, Zhang, Yi (2015). Assessing the Relationship Between Social Vulnerability and Community Resilience to Hazards. Social Indicators Research, 122: 391-409. Bogard,W.C. (1989). Bringing social theory to hazards research: conditions and consequences of the mitigation of environmental hazards. Sociological Perspectives, 31: 147-168. CAMP Alatoo: Testing of Climate Risk Assessment Methodology in Kyrgyzstan (2013) Cattell, R.B. (1978). The Scientific Use of Factor Analysis. New York: Plenum. Chattopadhyay, Sandip; Dasgupta, Ranjan (2015). Demographic and Socioeconomic Impact on Risk Attitudes of the Indian Investors – An Empirical Study. Asian Economic and Financial Review, 5(4):601-623. Cutter, S.L.; Boruff, B.J.; Shirley, W.L. (2003). Social Vulnerability to Environmental Hazards. Social Science Quarterly, 84(2): 242-261. Comparable Social Vulnerability Profiling – CSVP Case Study: Croatia (2015). Dohmen, T., A. Falk, D. Huffman, U. Sunde, J. Schupp and G. G. Wagner. (2005). Individual Risk Attitudes: New Evidence from a Large, Representative, Experimentally-Validated Survey. Discussion Papers of DIW Berlin 511, DIW Berlin, German Institute for Economic Research. Douglas, Mary; Wildavsky, Aaron (1982). Risk and Culture: An Essay on the Selection of Technological and Environmental Dangers. Berkeley and Los Angeles: University of California Press. Dow, K. (1992). Exploring Differences in Our Common Future(s): The Meaning of Vulnerability to Global Environmental Change. Geoforum, 23: 417-436. Emrich, C. T. 2005. Social Vulnerability in US Metropolitan Areas: Improvements in Hazard Vulnerability Assessment. PhD dissertation, University of South Carolina, Columbia, SC. Everitt, B.S. (1975). Multivariate Analysis: The Need for Data, and Other Problems. British Journal of Psychiatry, 126: 237-240. Gassmann, F., Berulava, G.,Tokmazishvili, M. (2013): Economic and SocialVulnerability in Georgia UNDP.Harris, Christine R.; Jenkins, Michael; Glaser, Dale (2006). Gender Differences in Risk Assessment:Why doWomenTake Fewer Risks than Men? Judgment and Decision Making, 1(1): 48-63. Hartog, Joop; Ferrer-i-Carbonell, Ada; Jonker, Nicole (2002). Linking Measured Risk Aversion to Individual Characteristics. Kyklos, 55(1): 3-26. Holand, I.S.; Lujala, P.; Rød, J.K. (2011). Social vulnerability assessment for Norway: A quantitative approach, NorskGeografiskTidsskrift - Norwegian Journal of Geography, 65:1-17. Holand, I.S.; Lujala, P. (2013). Replicating and Adapting an Index of Social Vulnerability to a New Context: A Comparison Study for Norway. The Professional Geographer, 65(2): 312–328.
  • 46. 46 SOCIAL VULNERABILITY ASSESSMENT TOOLS FOR CLIMATE CHANGE AND DRR PROGRAMMING REFERENCES Kim, De-Yeong; Park, Junsu (2010). Cultural differences in risk: The group facilitation effect. Judgment and Decision Making, 5(5): 380-390. Lau, Lai-Yin; Ranyard, Rob (2005). Chinese and English Probabilistic Thinking and Risk Taking in Gambling. Journal of Cross-Cultural Psychology, 36(5): 621-627. Nelson, Judy (2012). Are Women Really More Risk-Averse than Men? Global Development and Environment Institute Working Paper No. 12-05. Medford (MA): Tufts University. Nieboer, Jeroen (2013). Risk taking in diverse groups: Gender matters. CeDEx Discussion Paper Series, Discussion Paper No. 2013-06. Nottingham: University of Nottingham. Oulahen, Greg, Mortsch, Linda, Tang, Kathy, Harford, Deborah (2015). Unequal Vulnerability to Flood Hazards: “GroundTruthing”a SocialVulnerability Index of Five Municipalities in MetroVancouver, Canada. Annals of the Association of American Geographers, 105(3): 473–495. Park, Yoonkyung; Pradhan, Ananta Man Singh; Kim, Ungtae; Kim, Yun-Tae, and Kim, Sangdan (2016). Development and Application of Urban Landslide Vulnerability Assessment Methodology Reflecting Social and Economic Variables. Advances in Meteorology. Shupp, R.S.; Williams, A.W. (2008). Risk preference differentials of small groups and individuals. The Economic Journal, 118(525): 258-283. Straus, Susan G.; Parker, Andrew M.; Dembosky, Jacob W. (2009). The Group Matters A Review of the Effects of Group Interaction on Processes and Outcomes in Analytic Teams (Working Paper). RAND – National Security Research Division.
  • 47. SOCIAL VULNERABILITY ASSESSMENT TOOLS FOR CLIMATE CHANGE AND DRR PROGRAMMING 47
  • 48. UNDP Istanbul Regional Hub Key Plaza, Abide-I Hurriyet Cad. Istiklal Sk. No:11, 34381, Sisli, Istanbul, TURKEY For more information: www.undp.org/ Copyright 2017, UNDP. Cover Photo by: UNDP Serbia