Download as PDF, PPTX

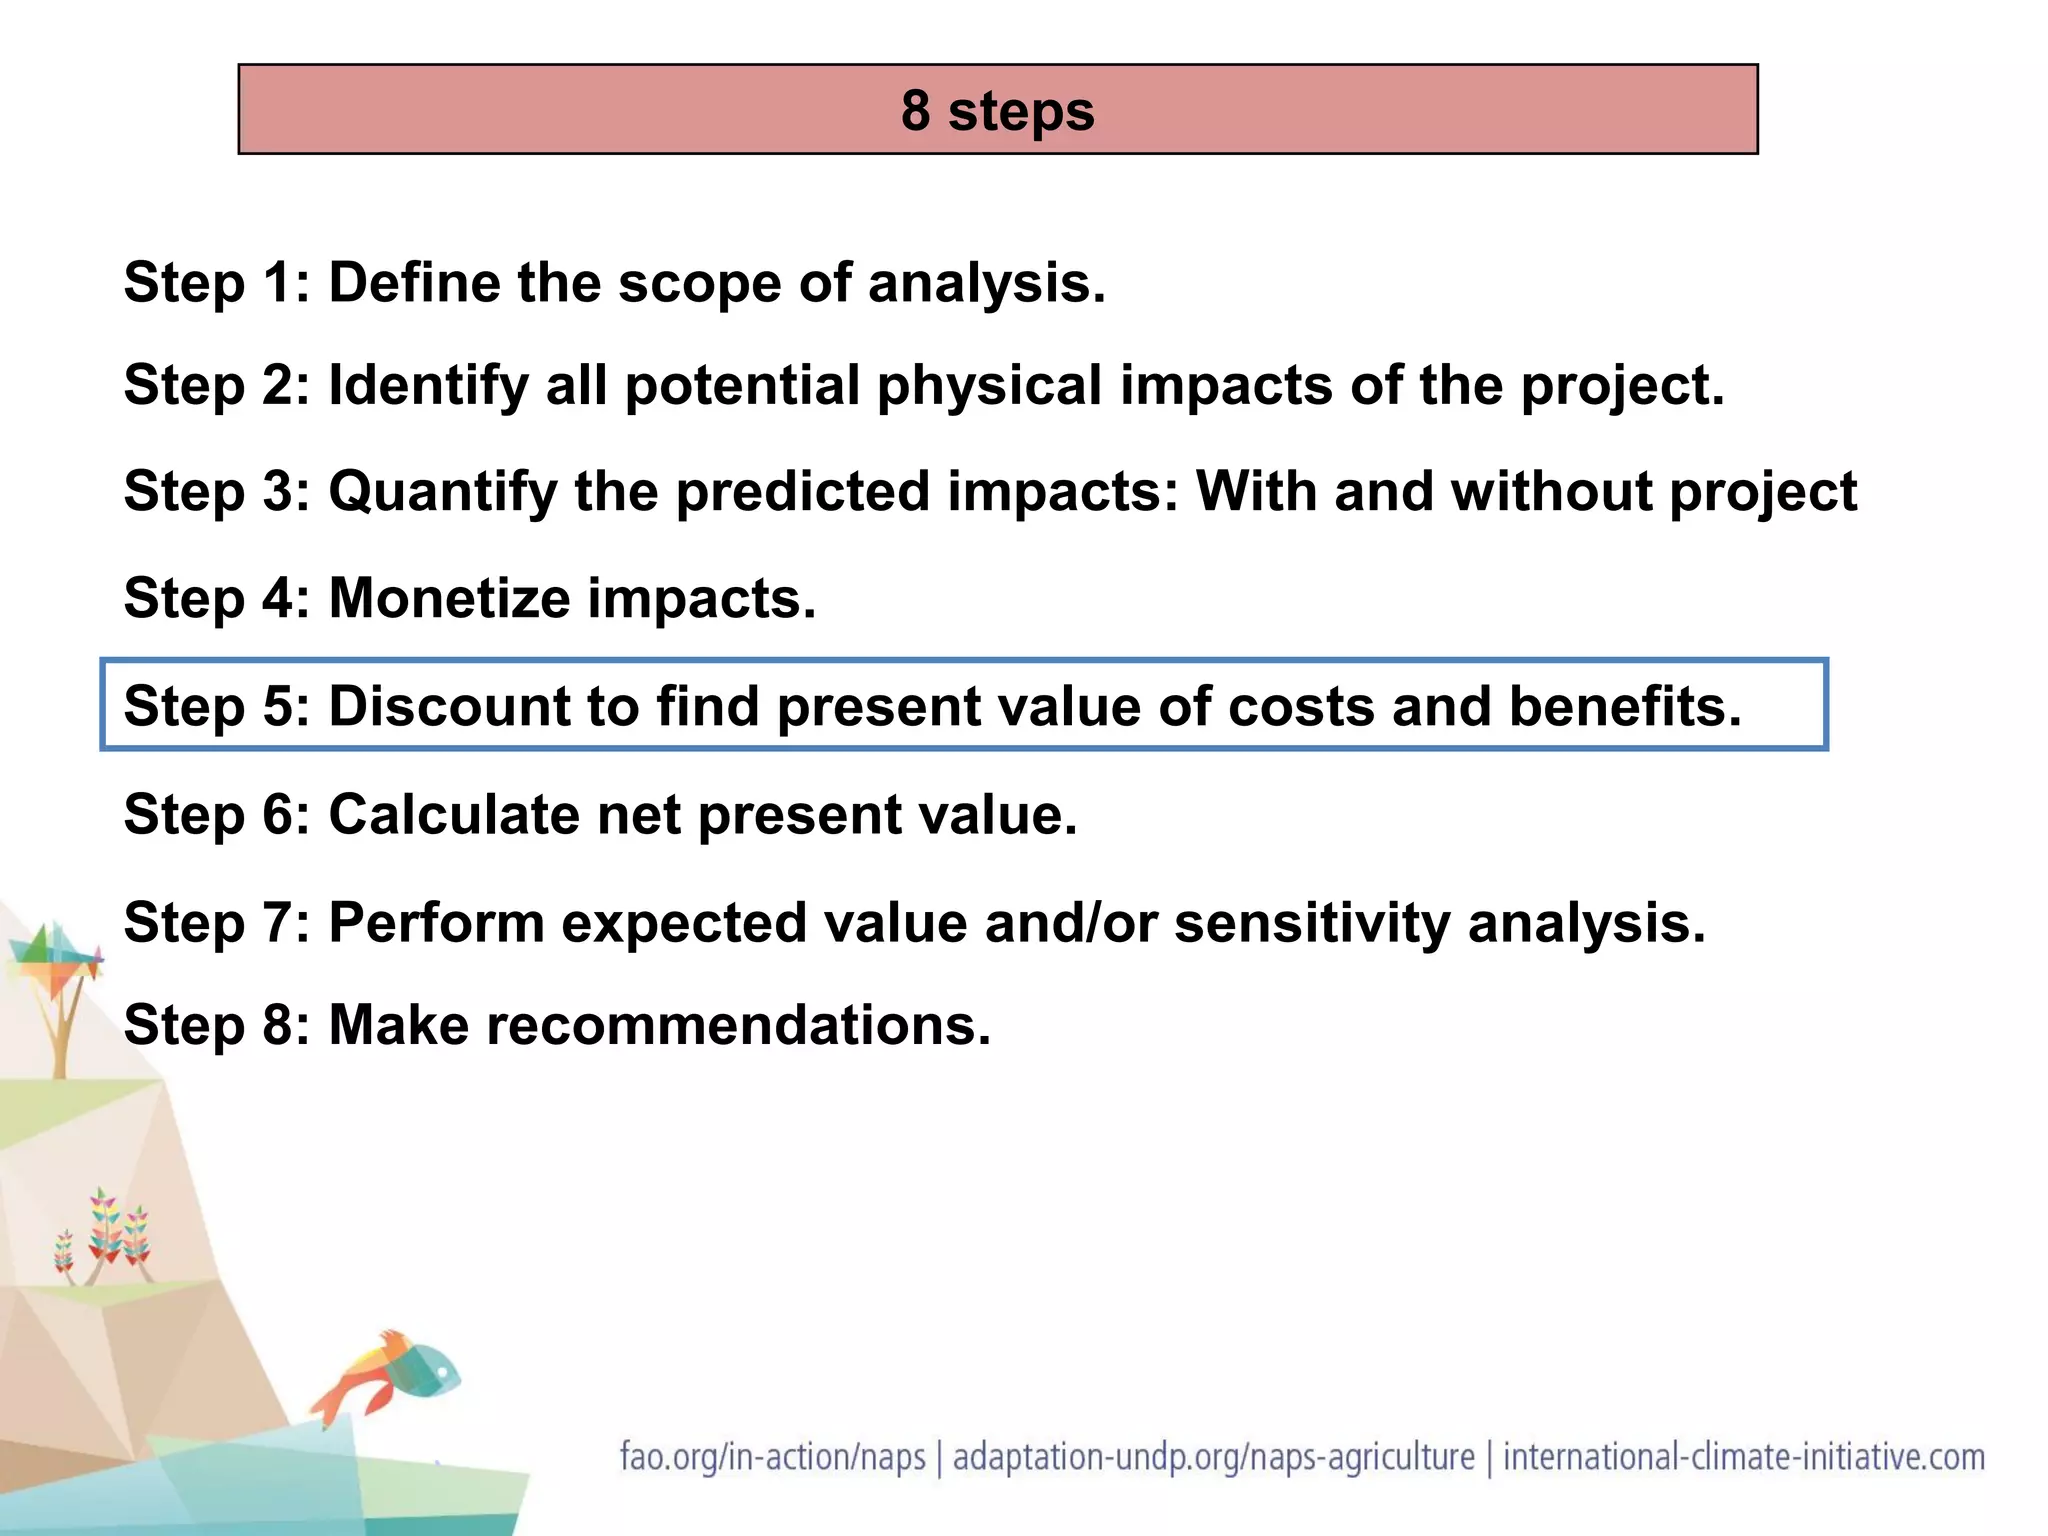
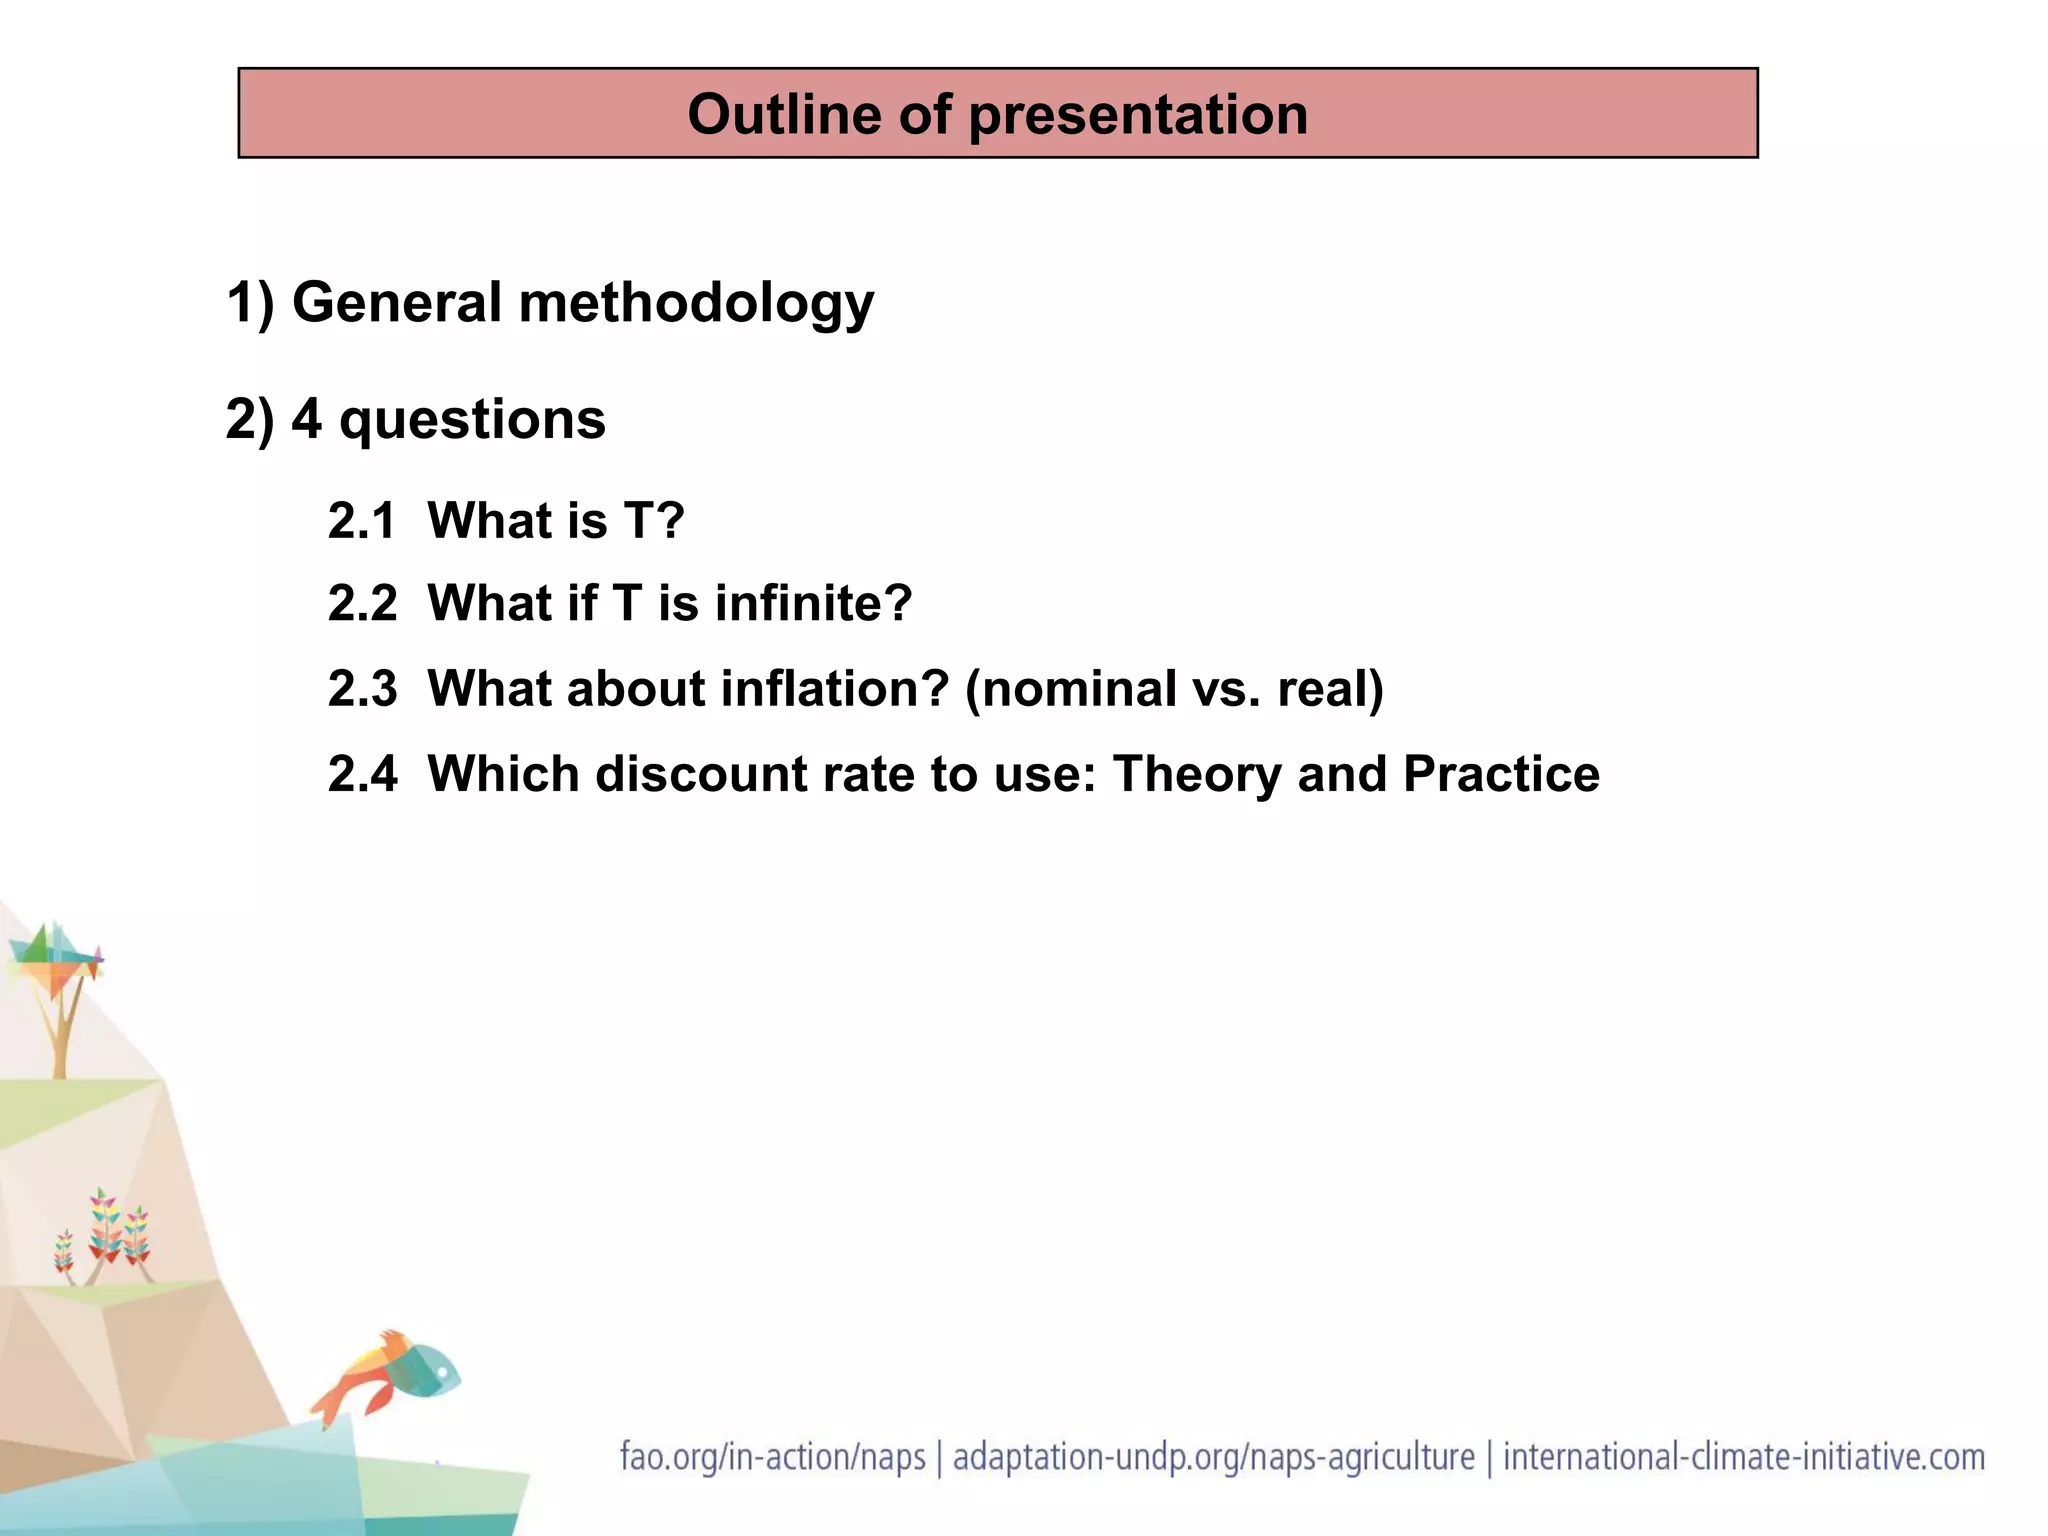
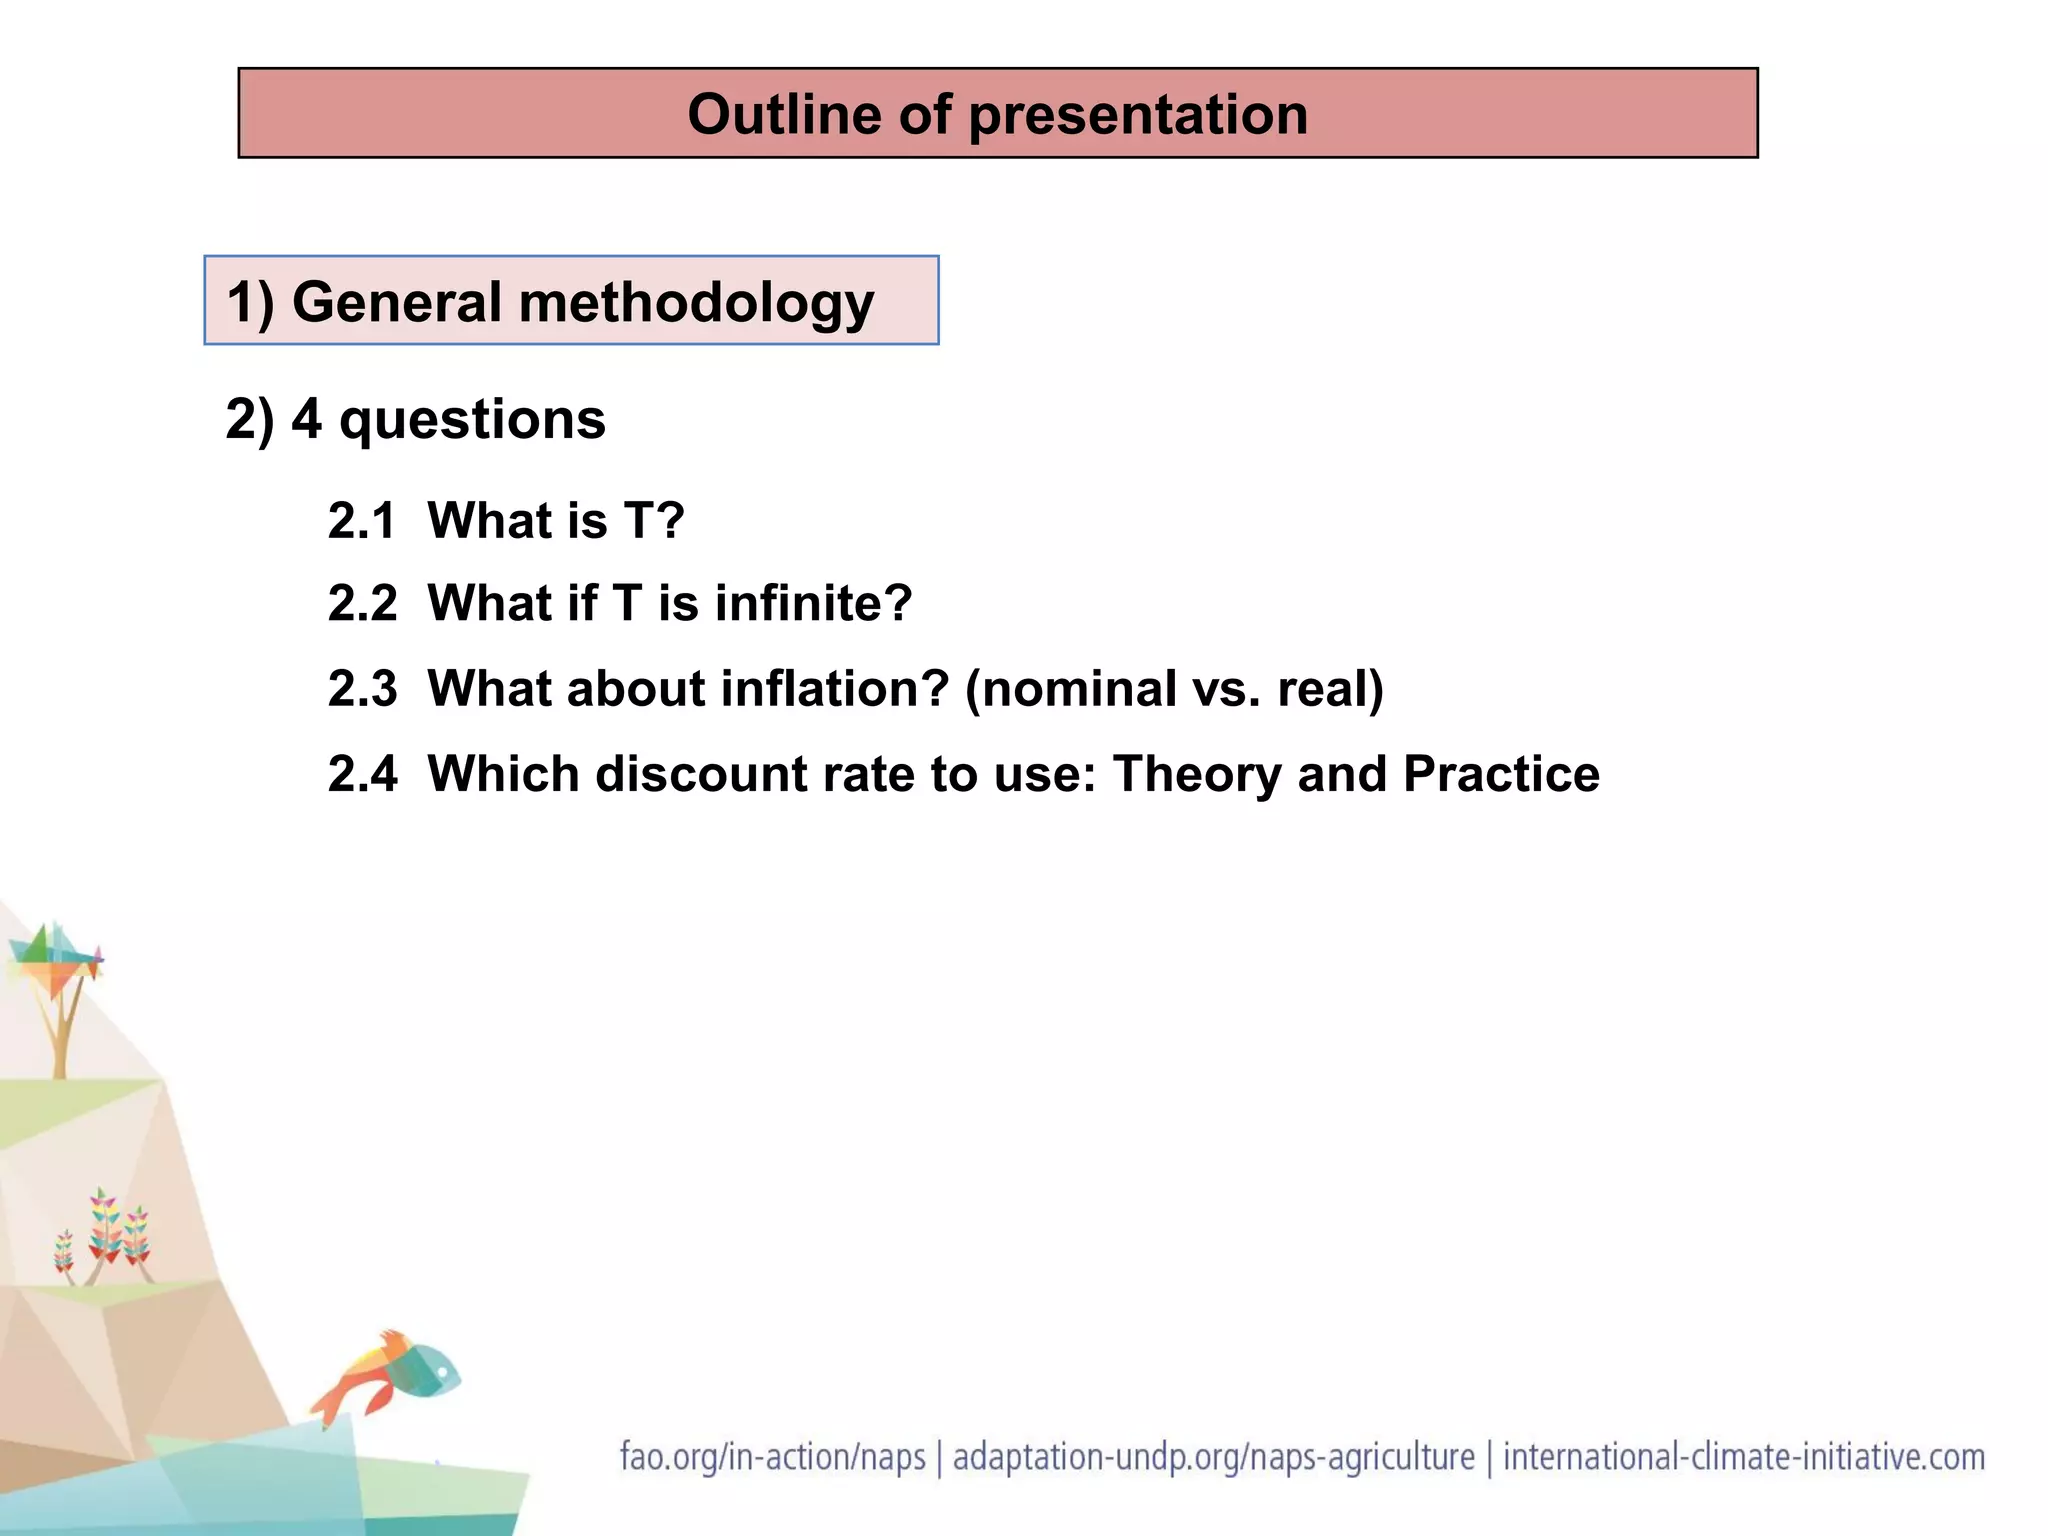
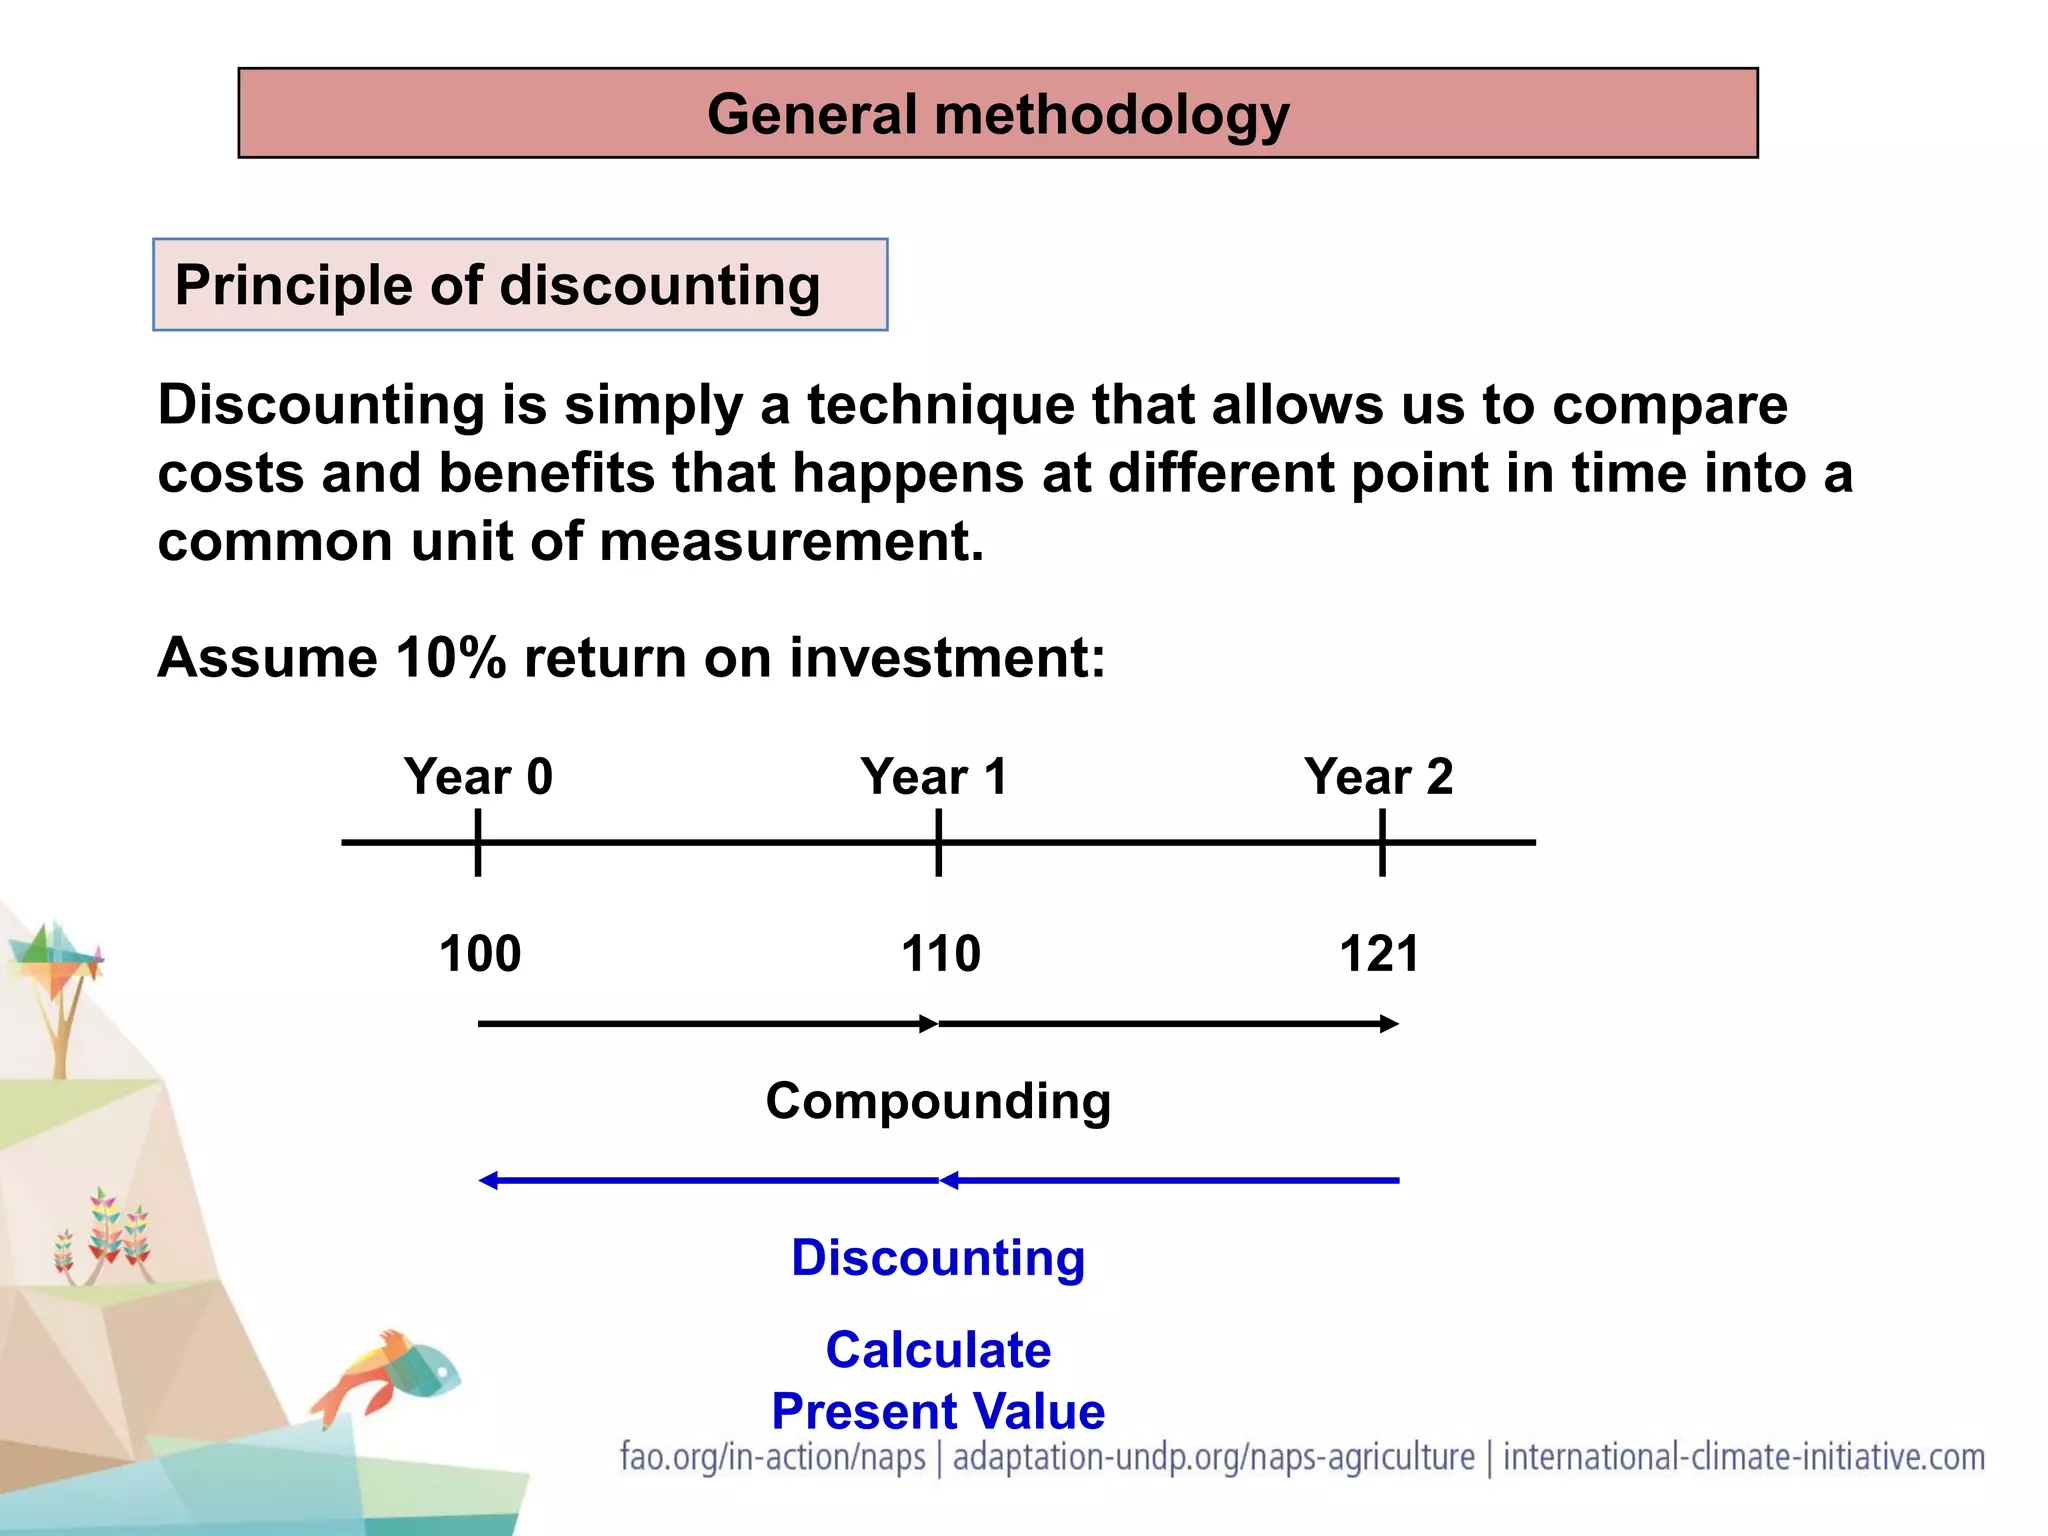
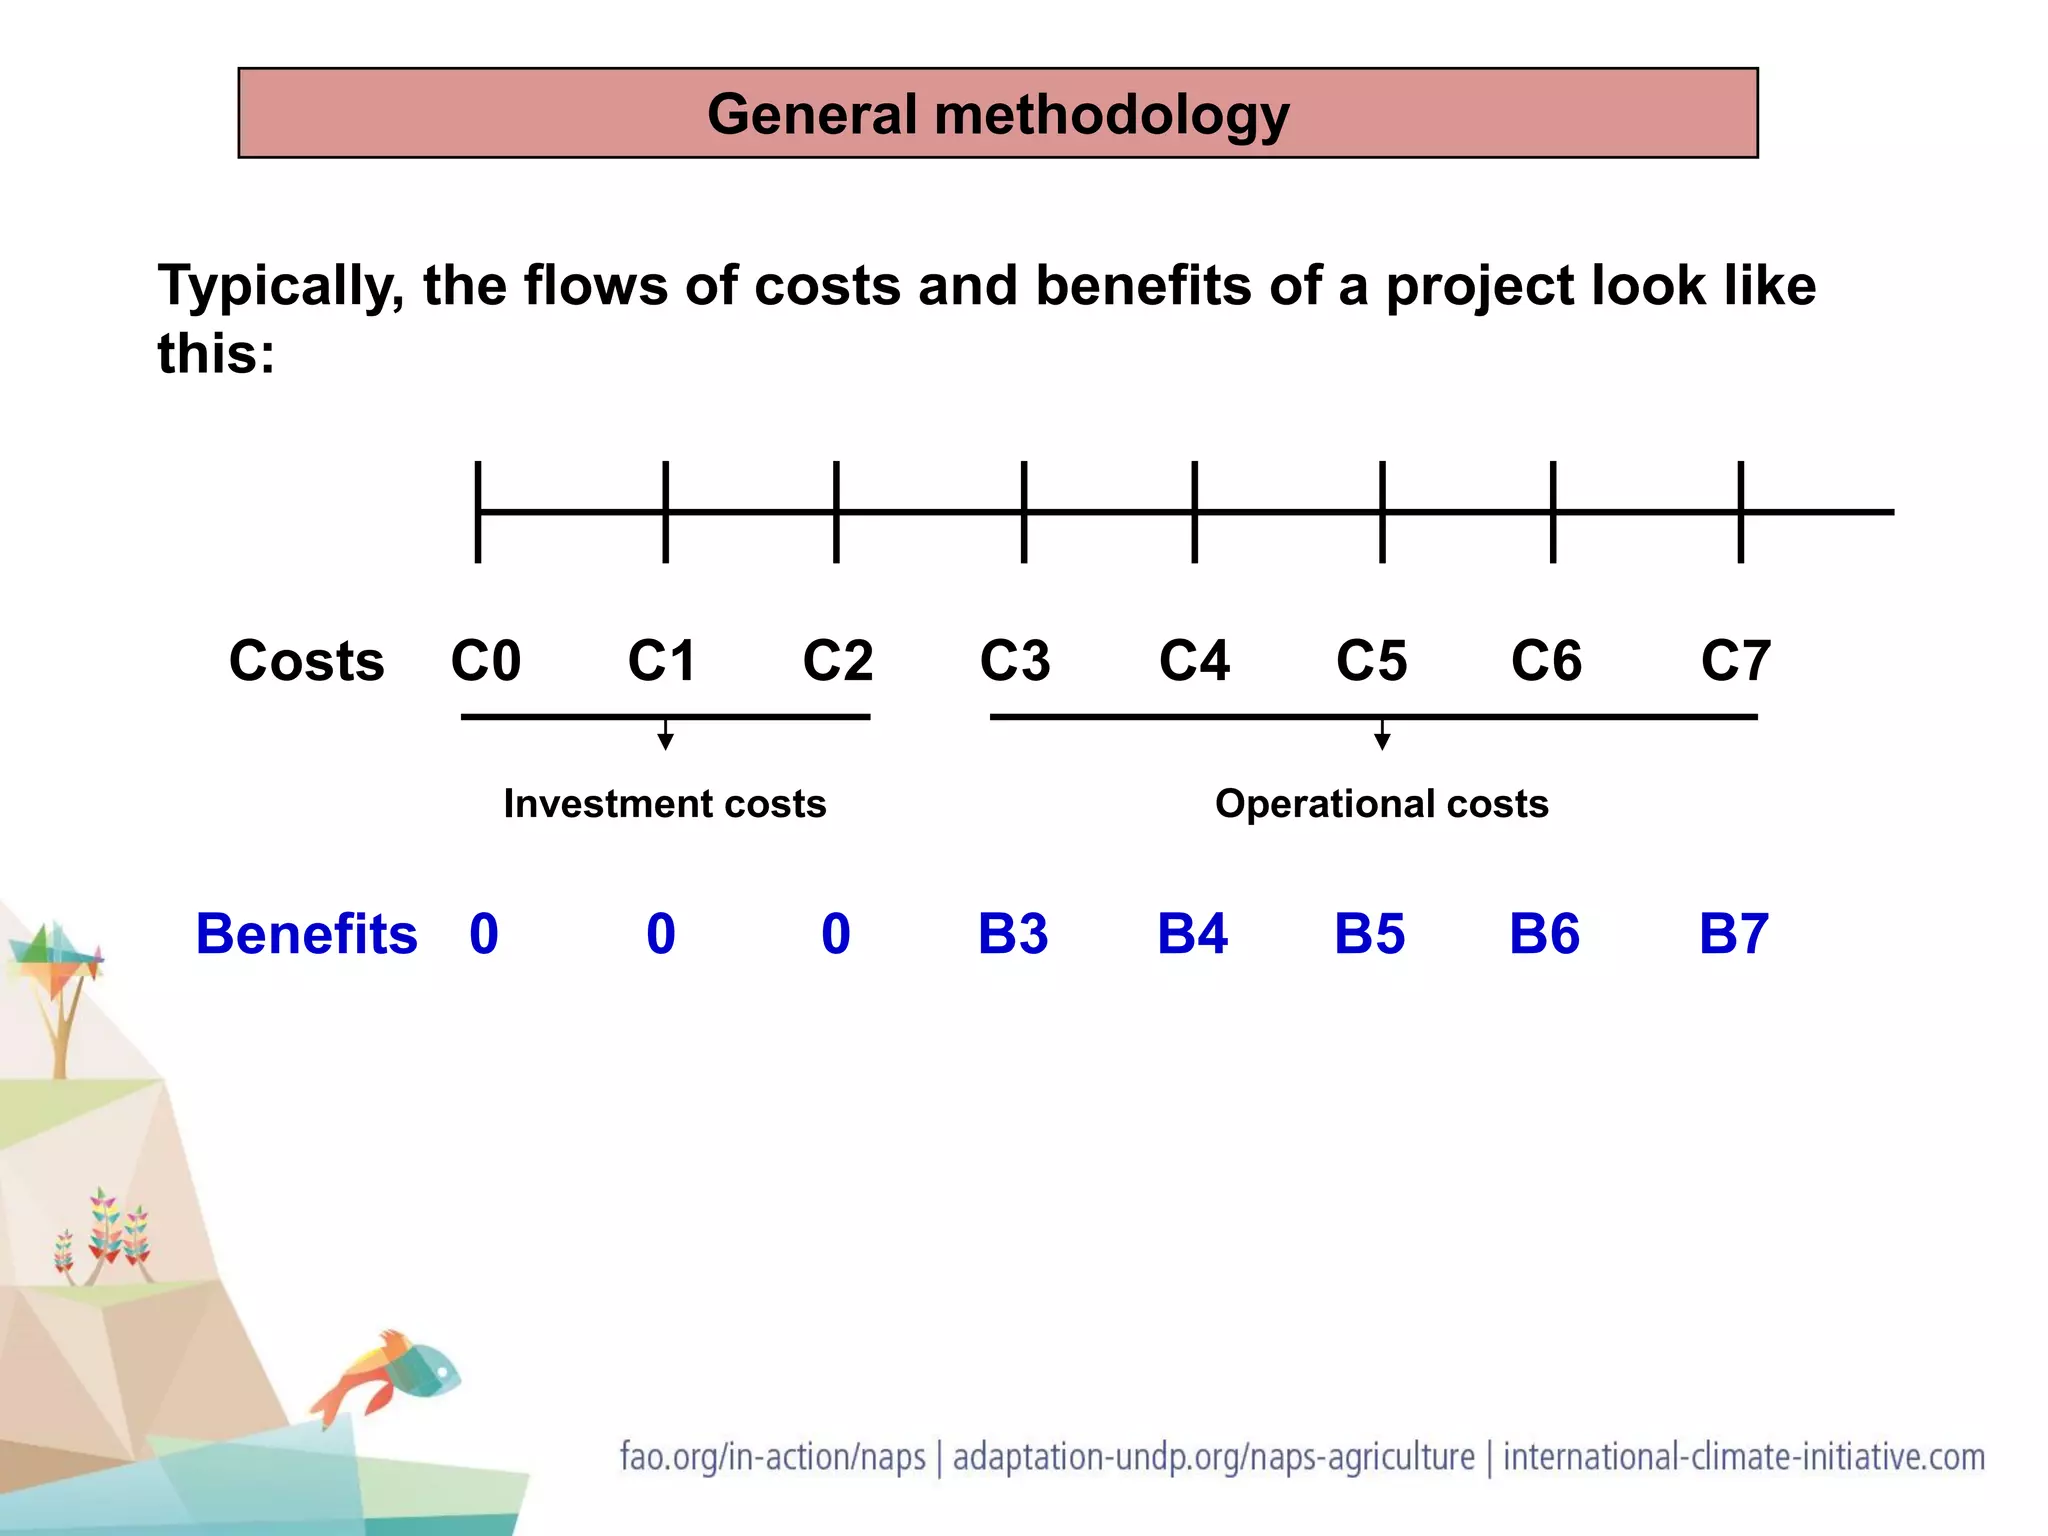
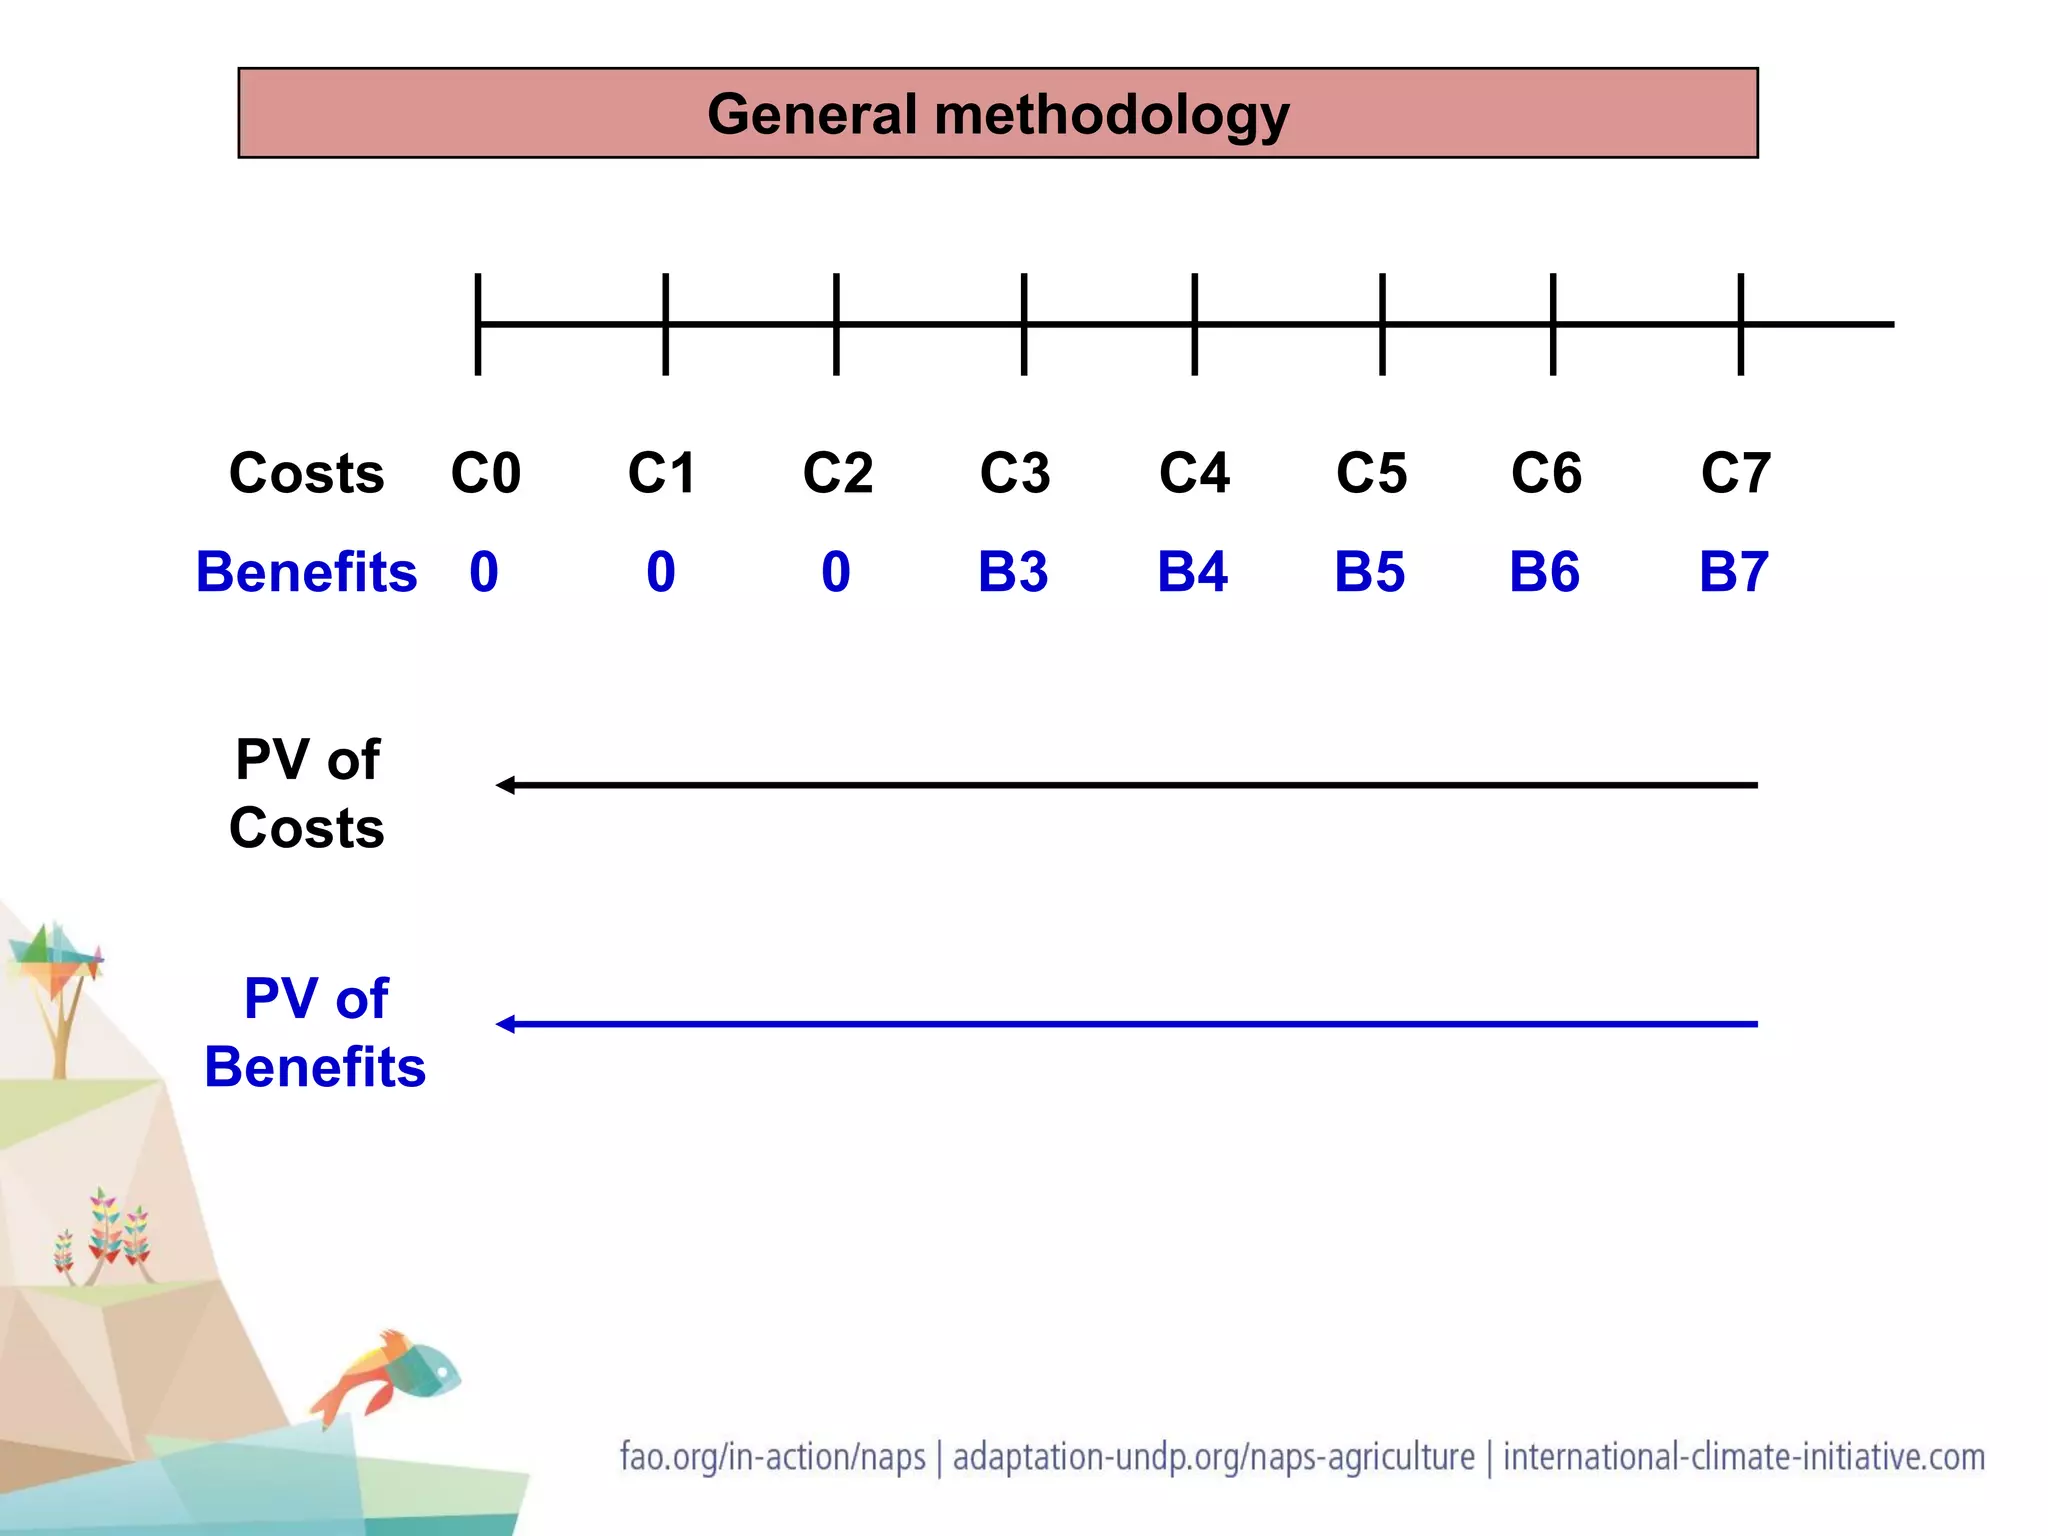
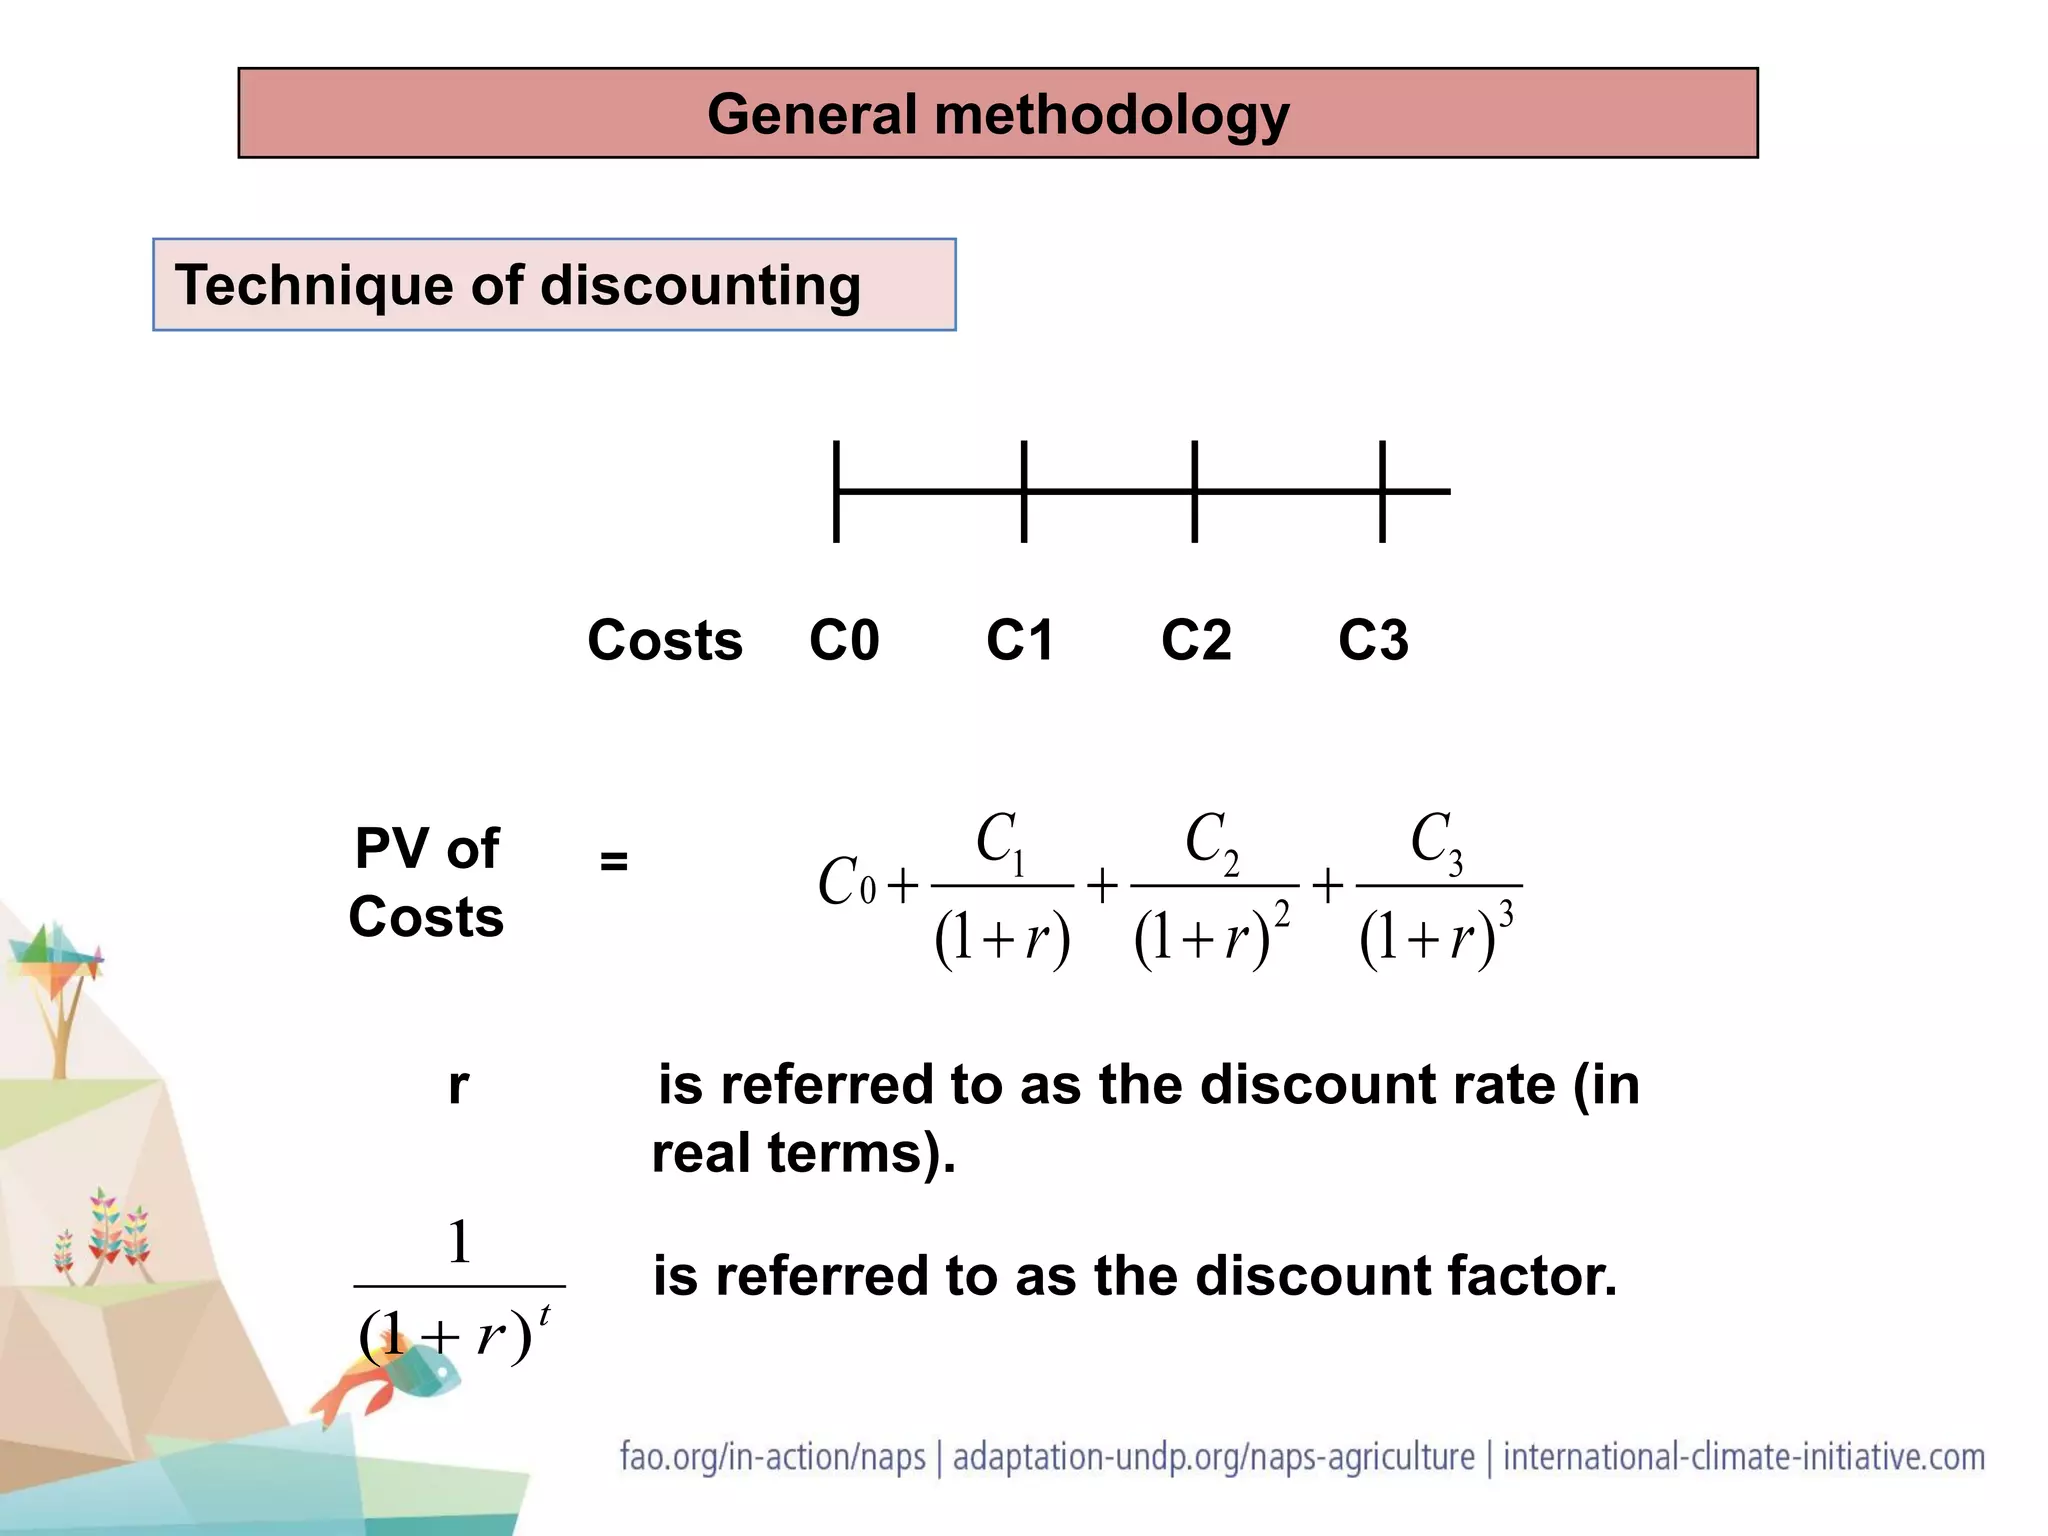
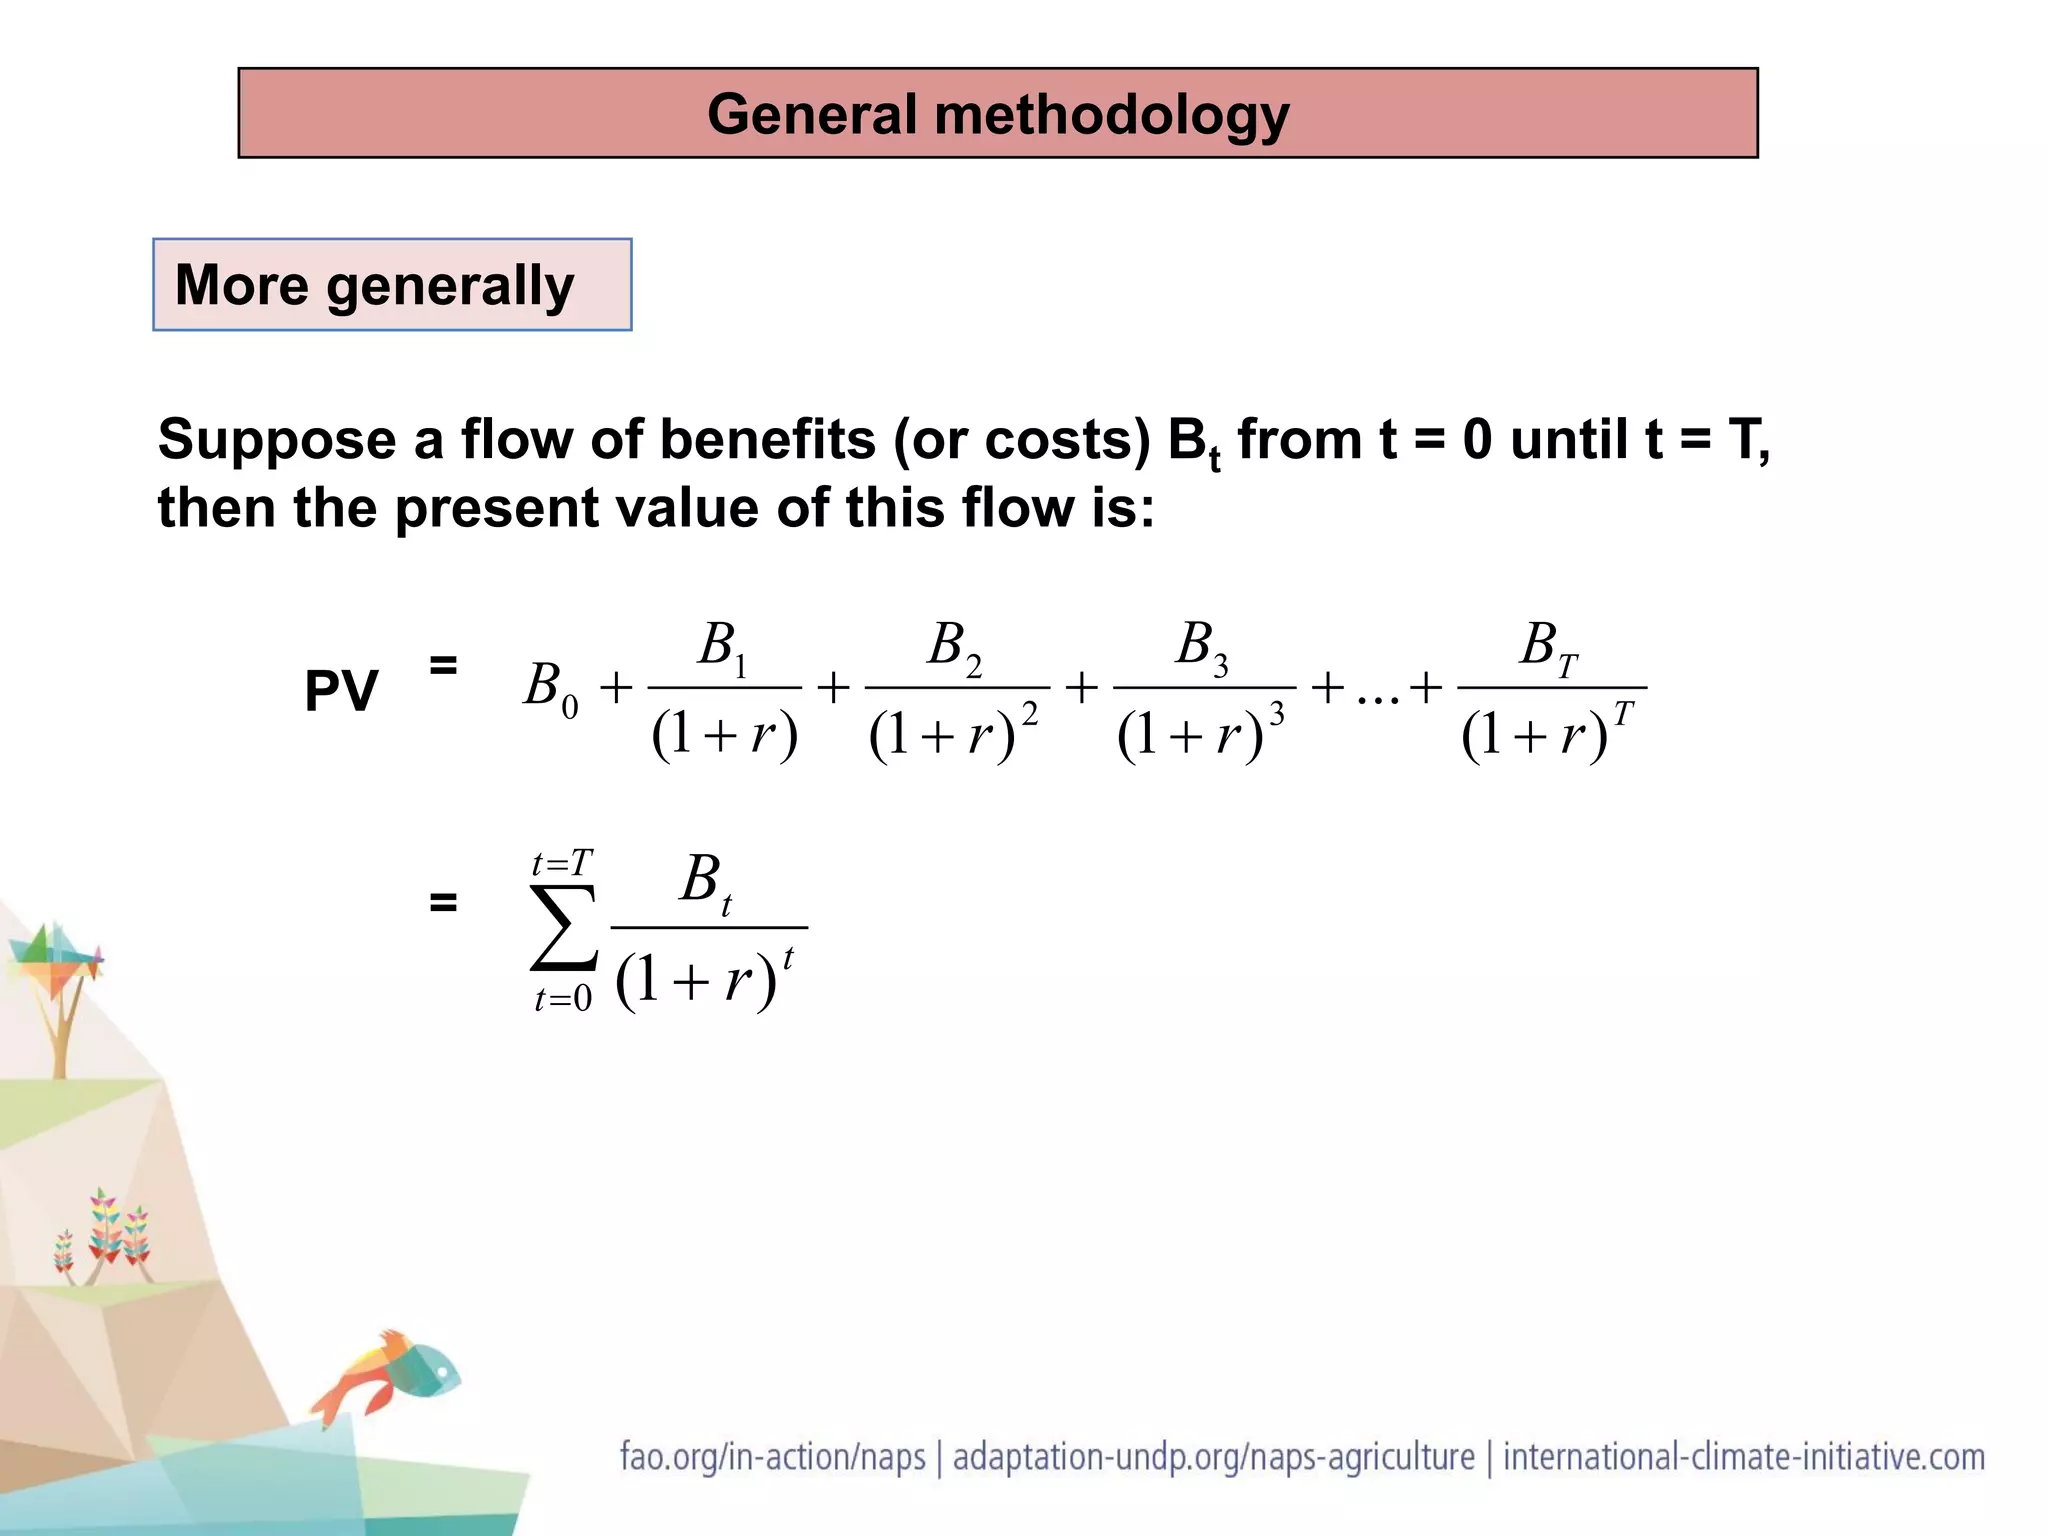
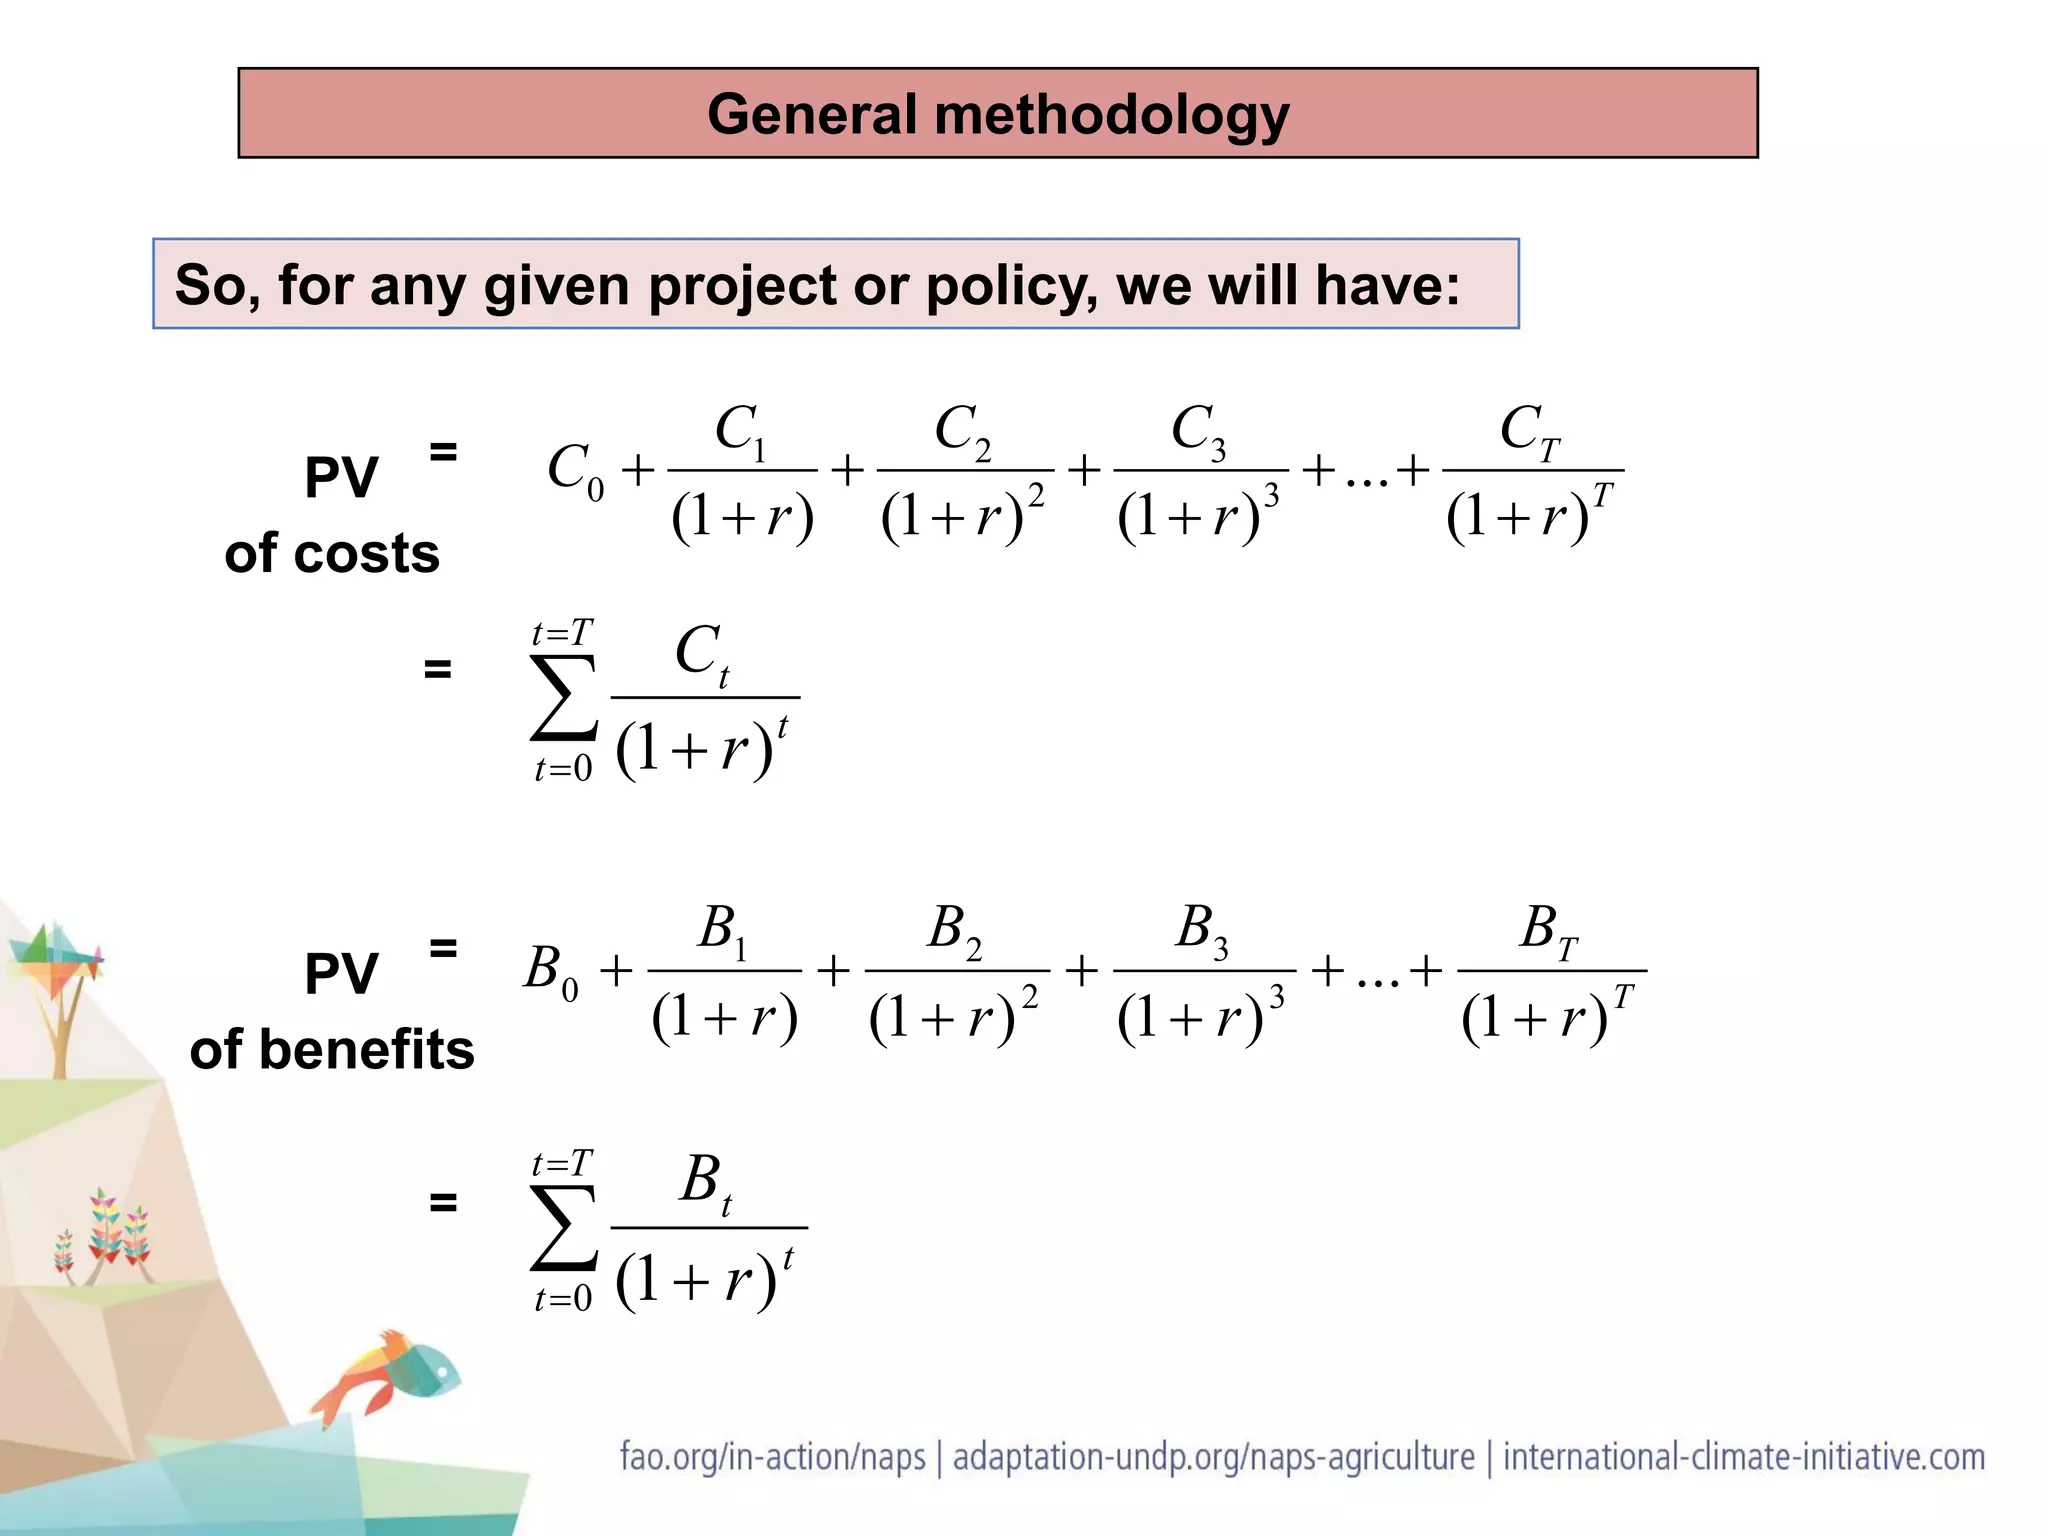
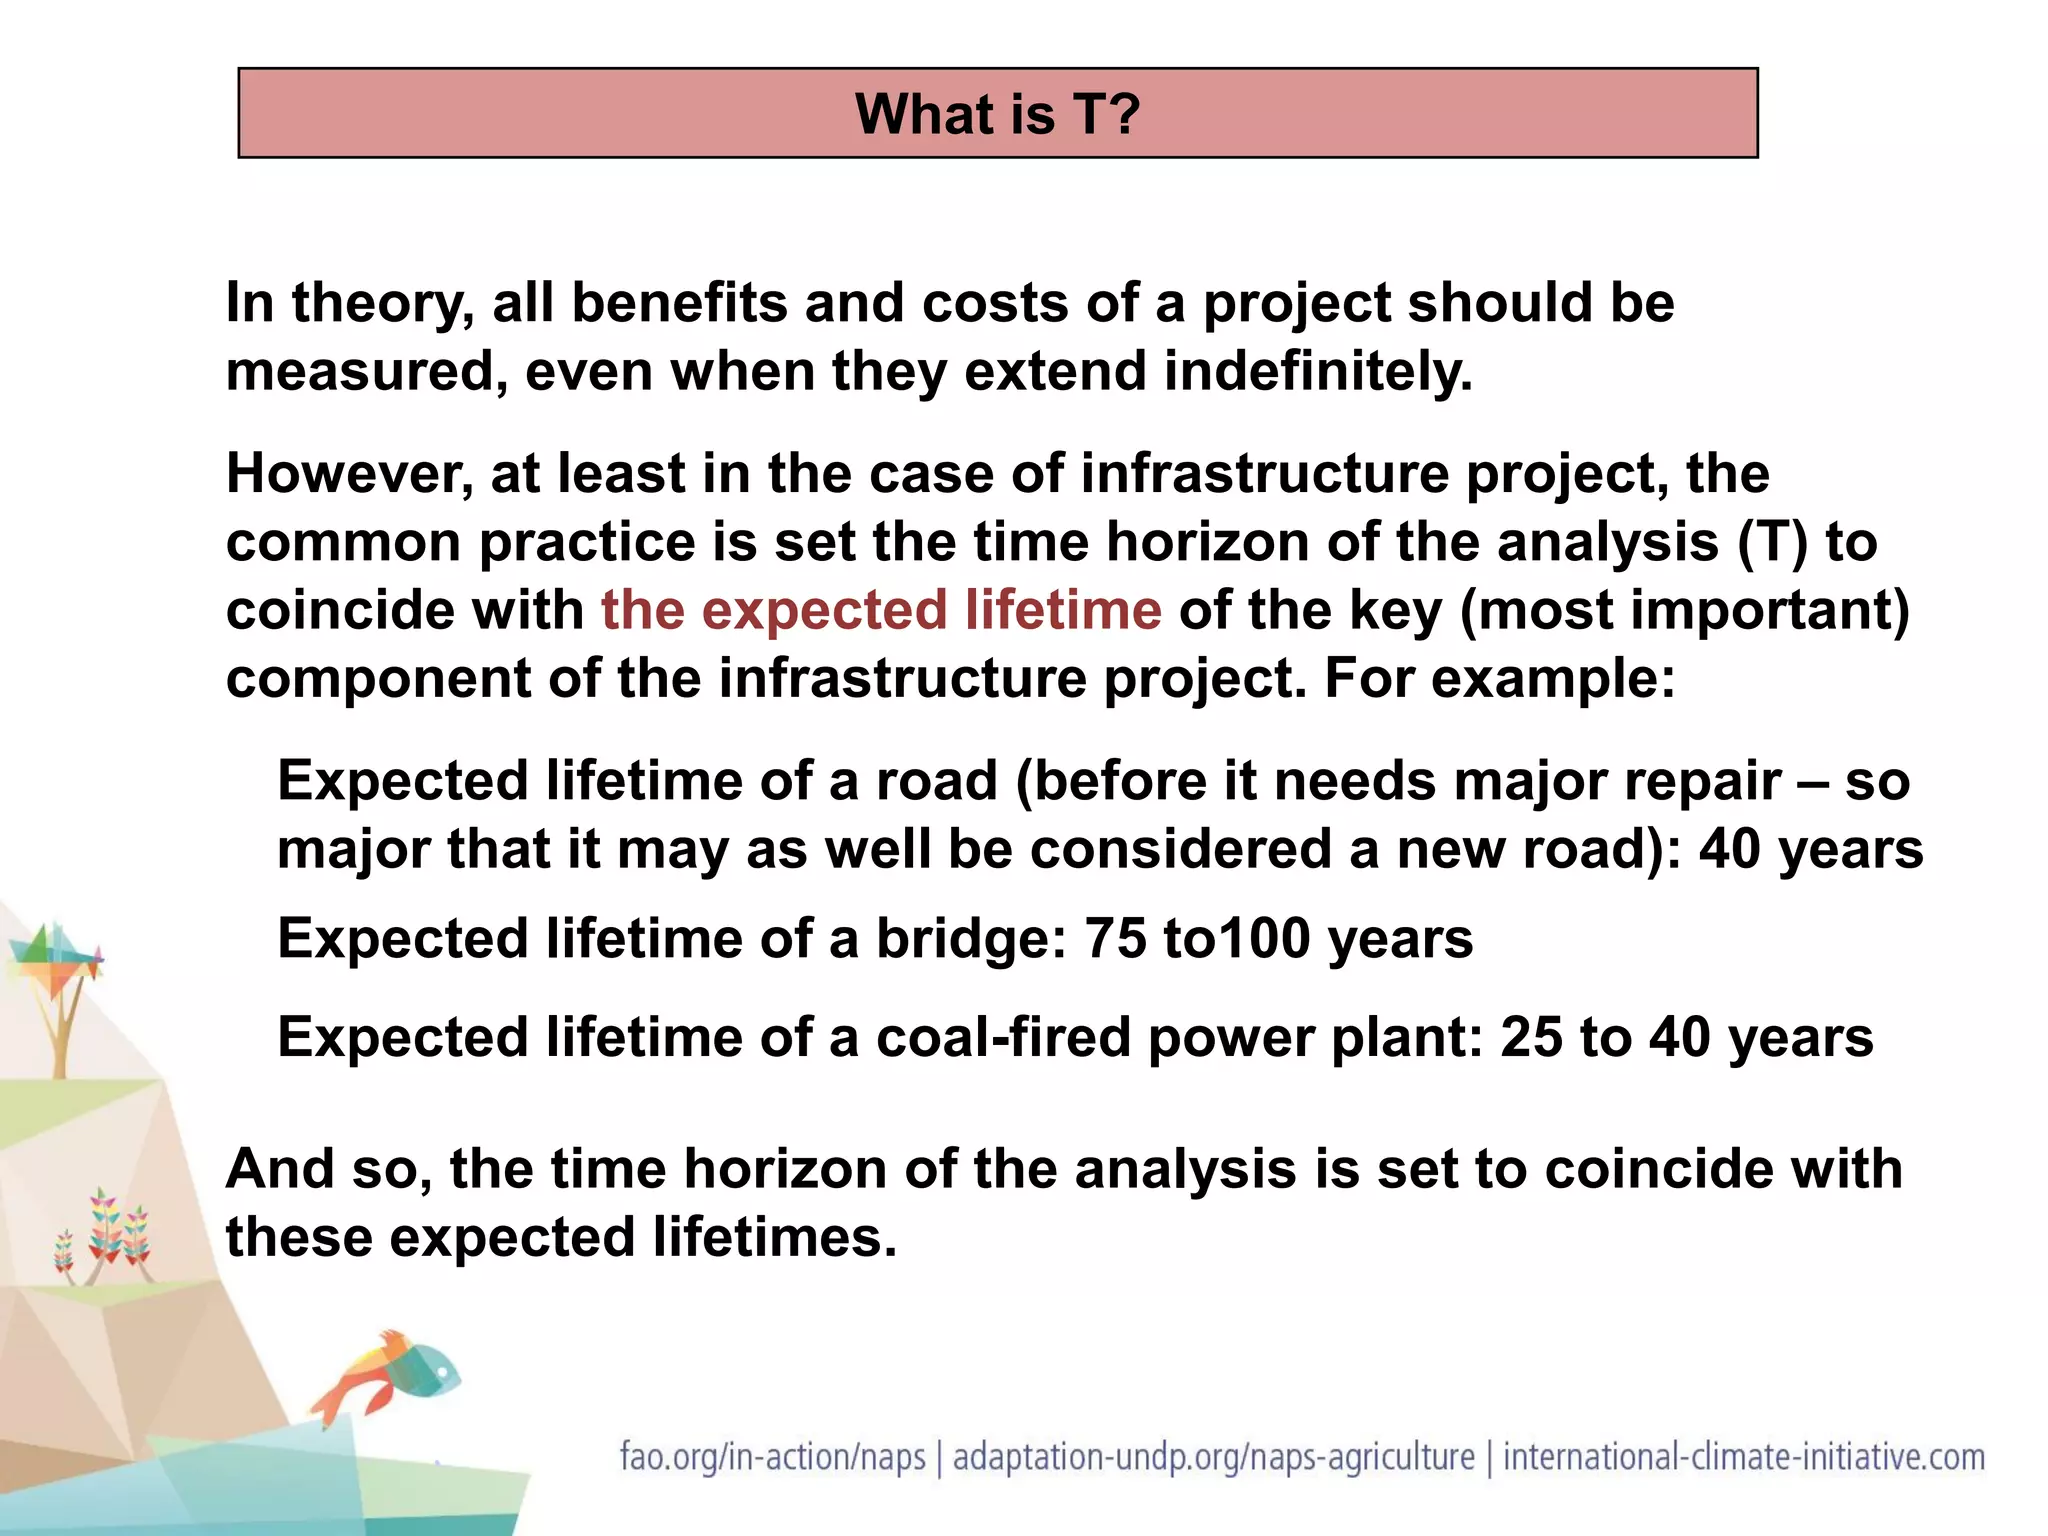
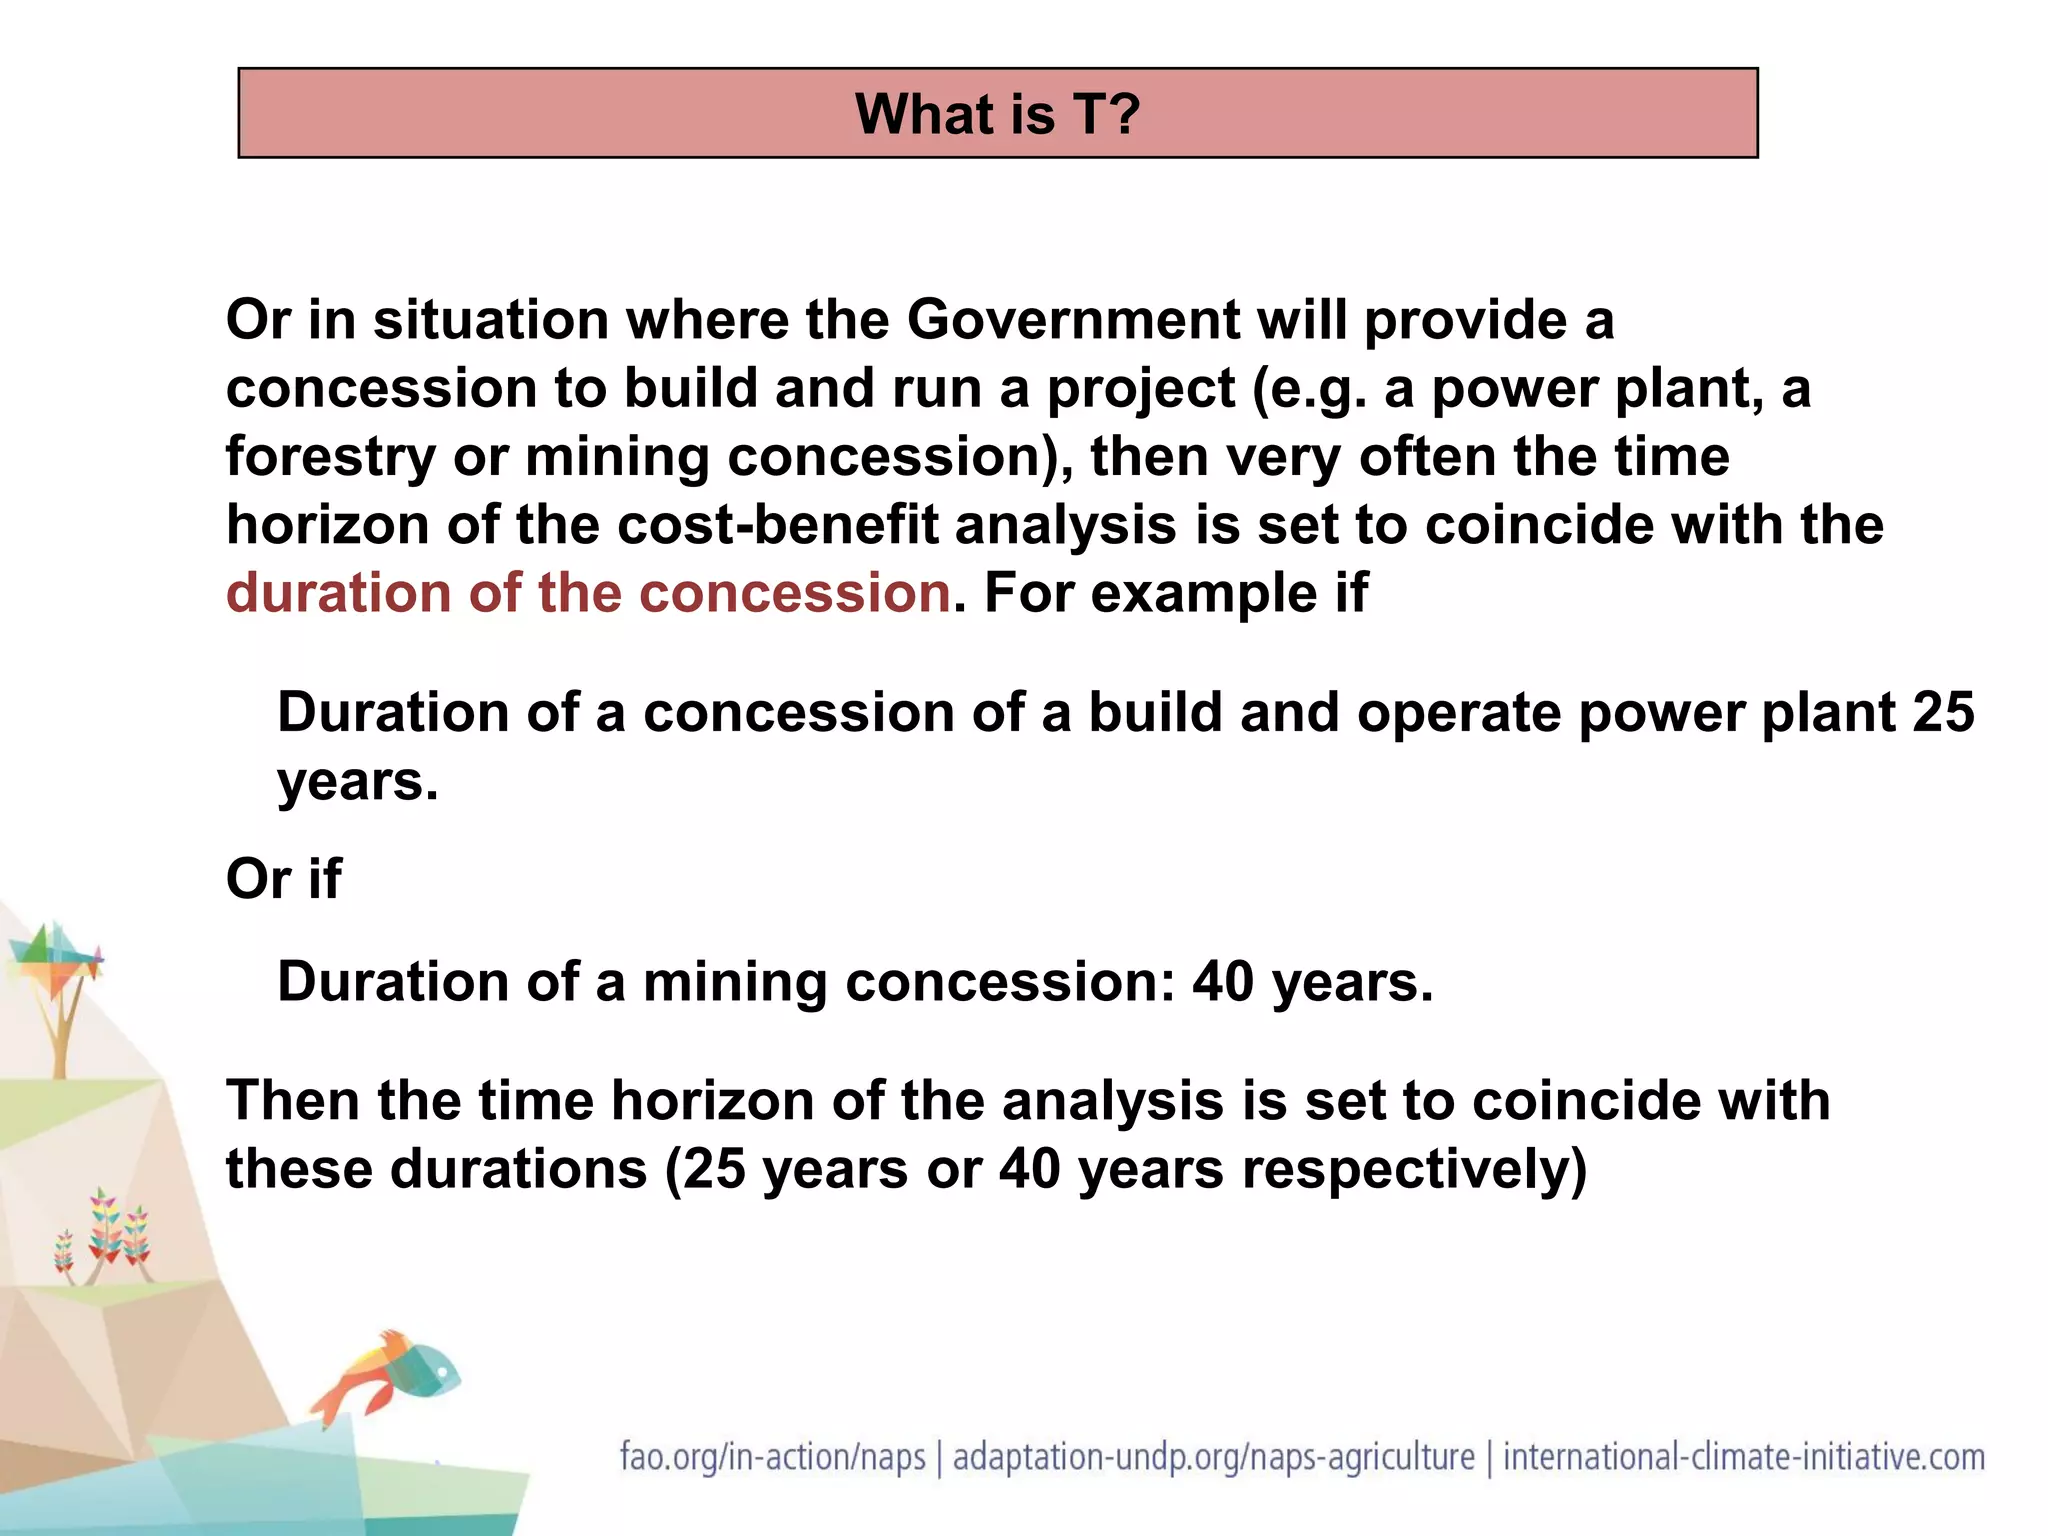
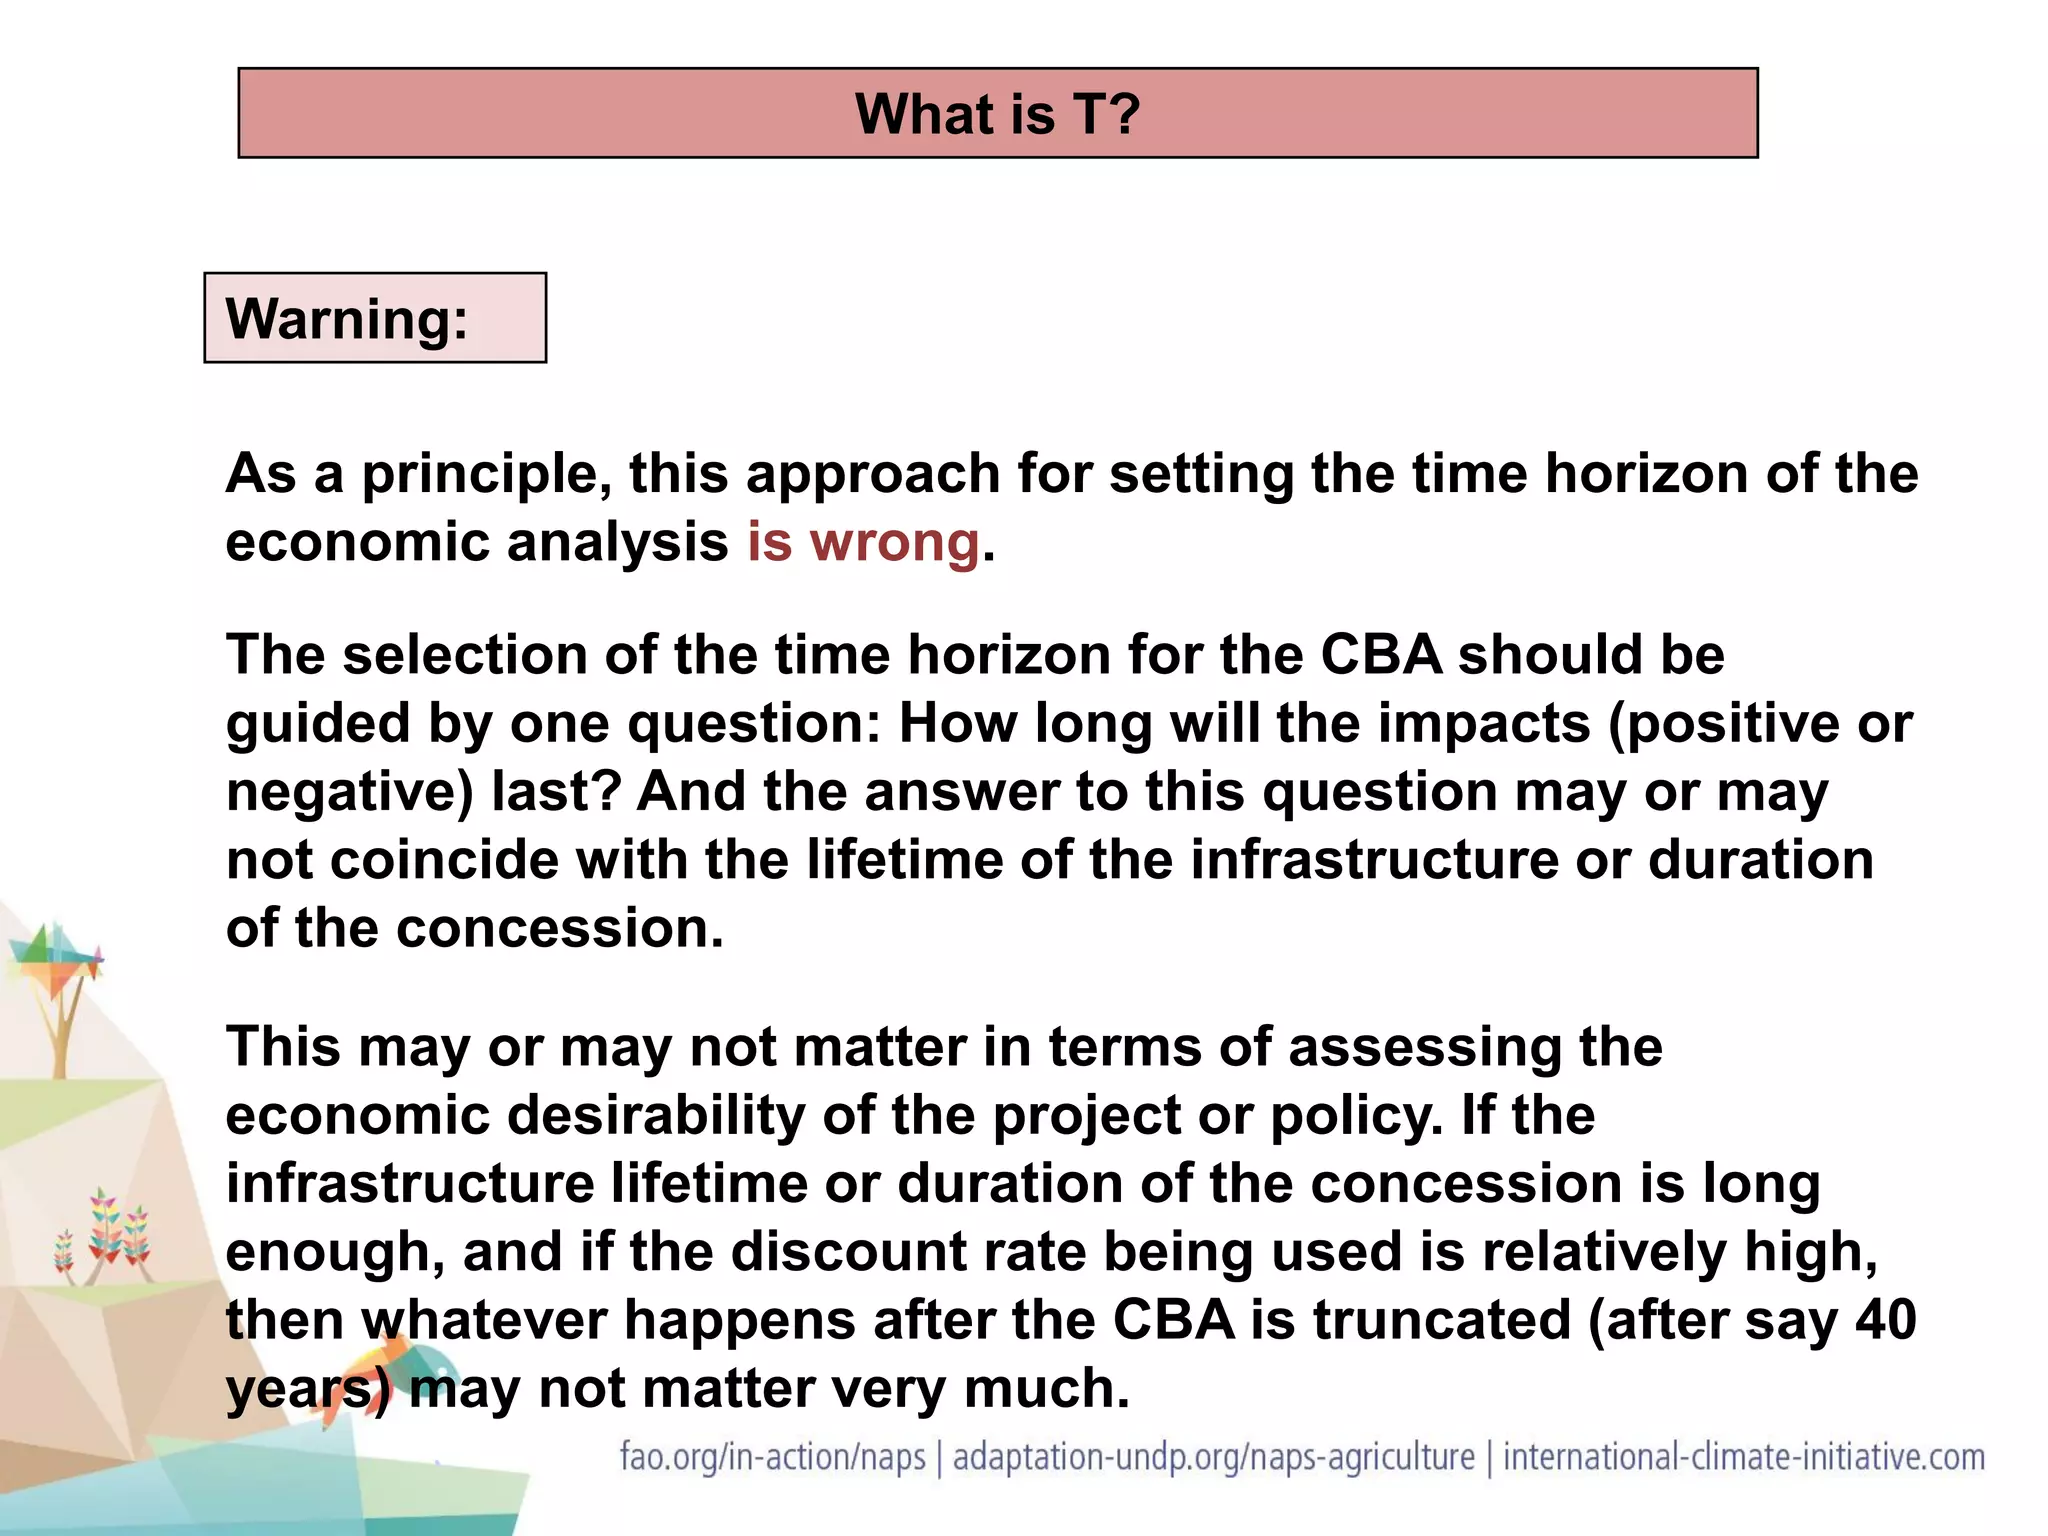
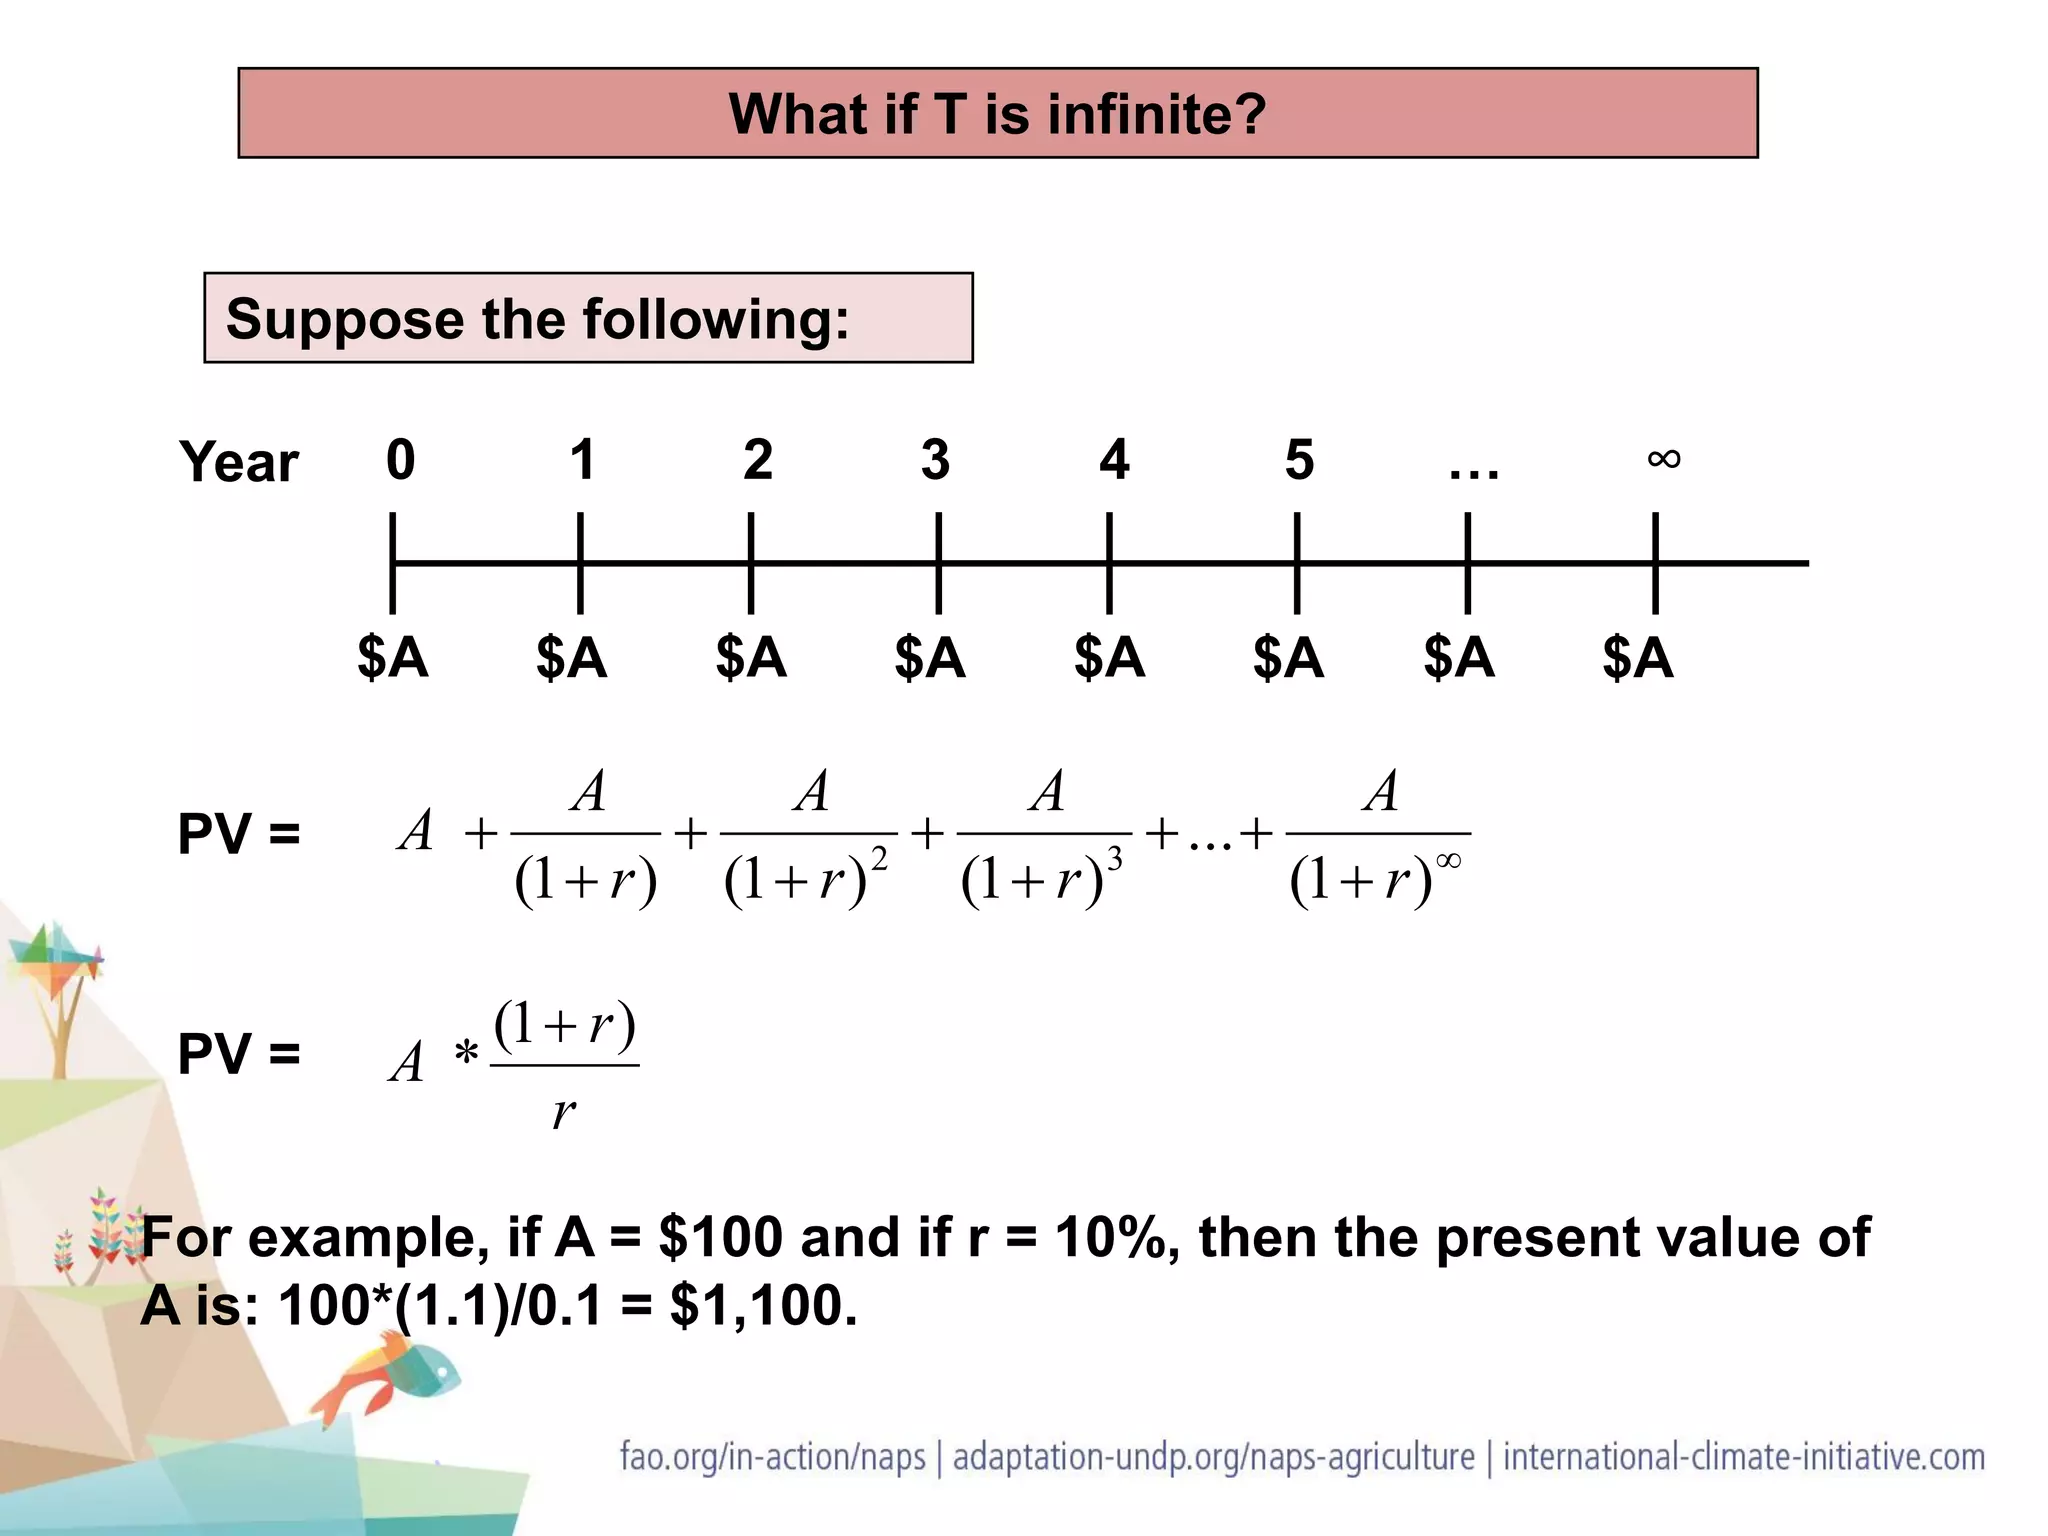
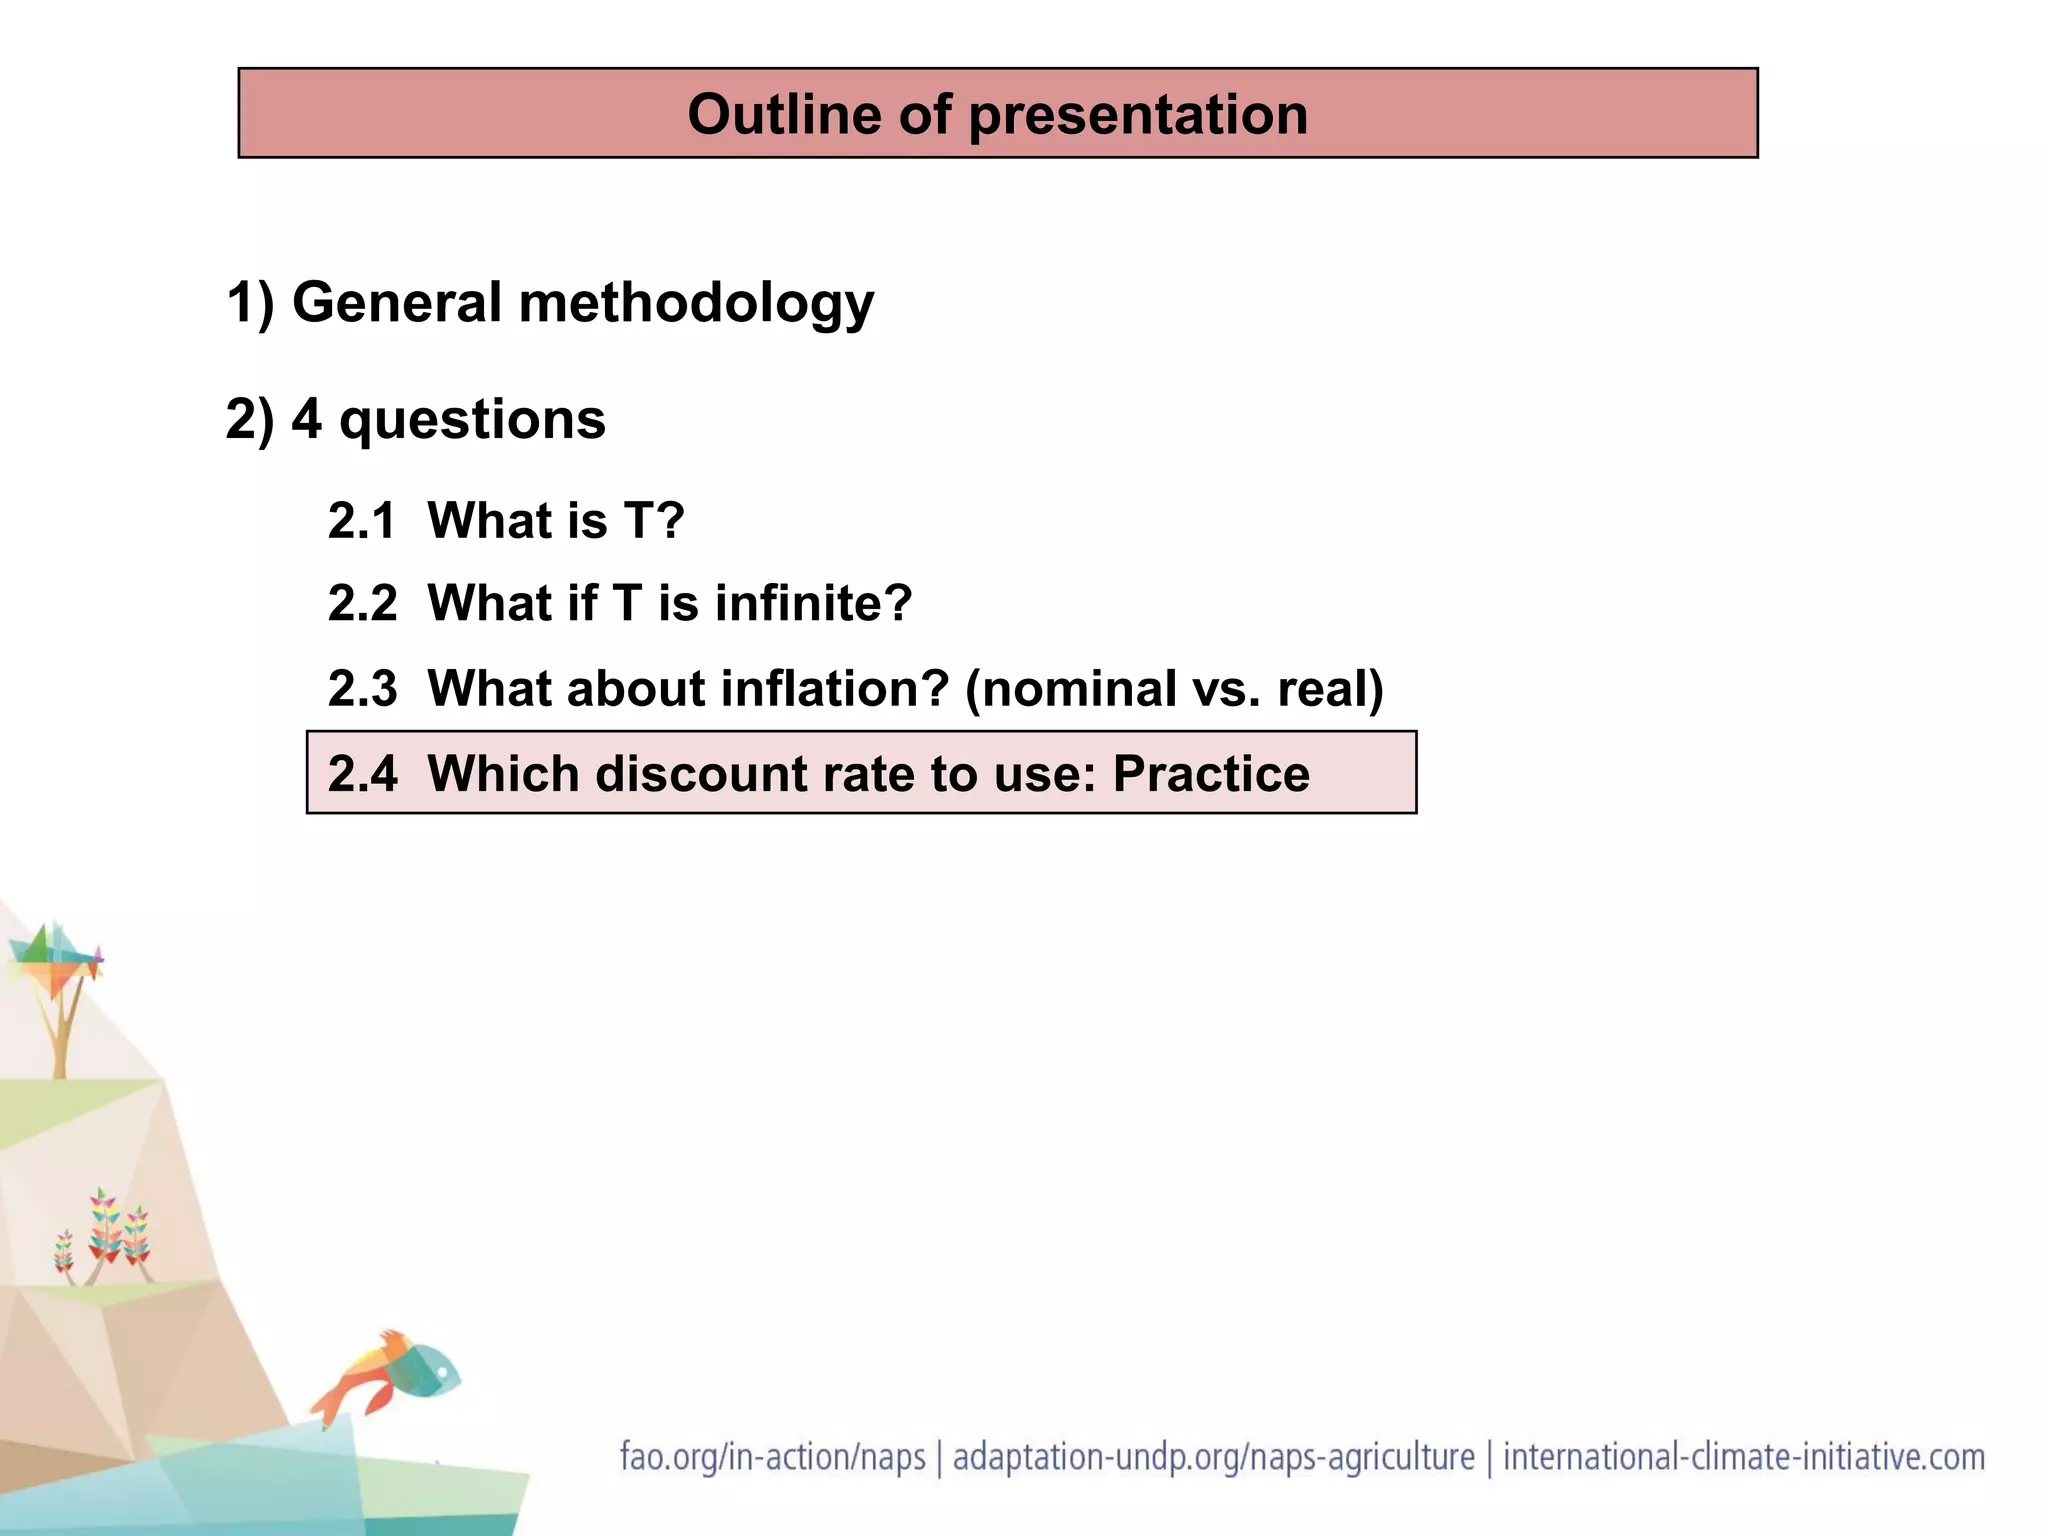
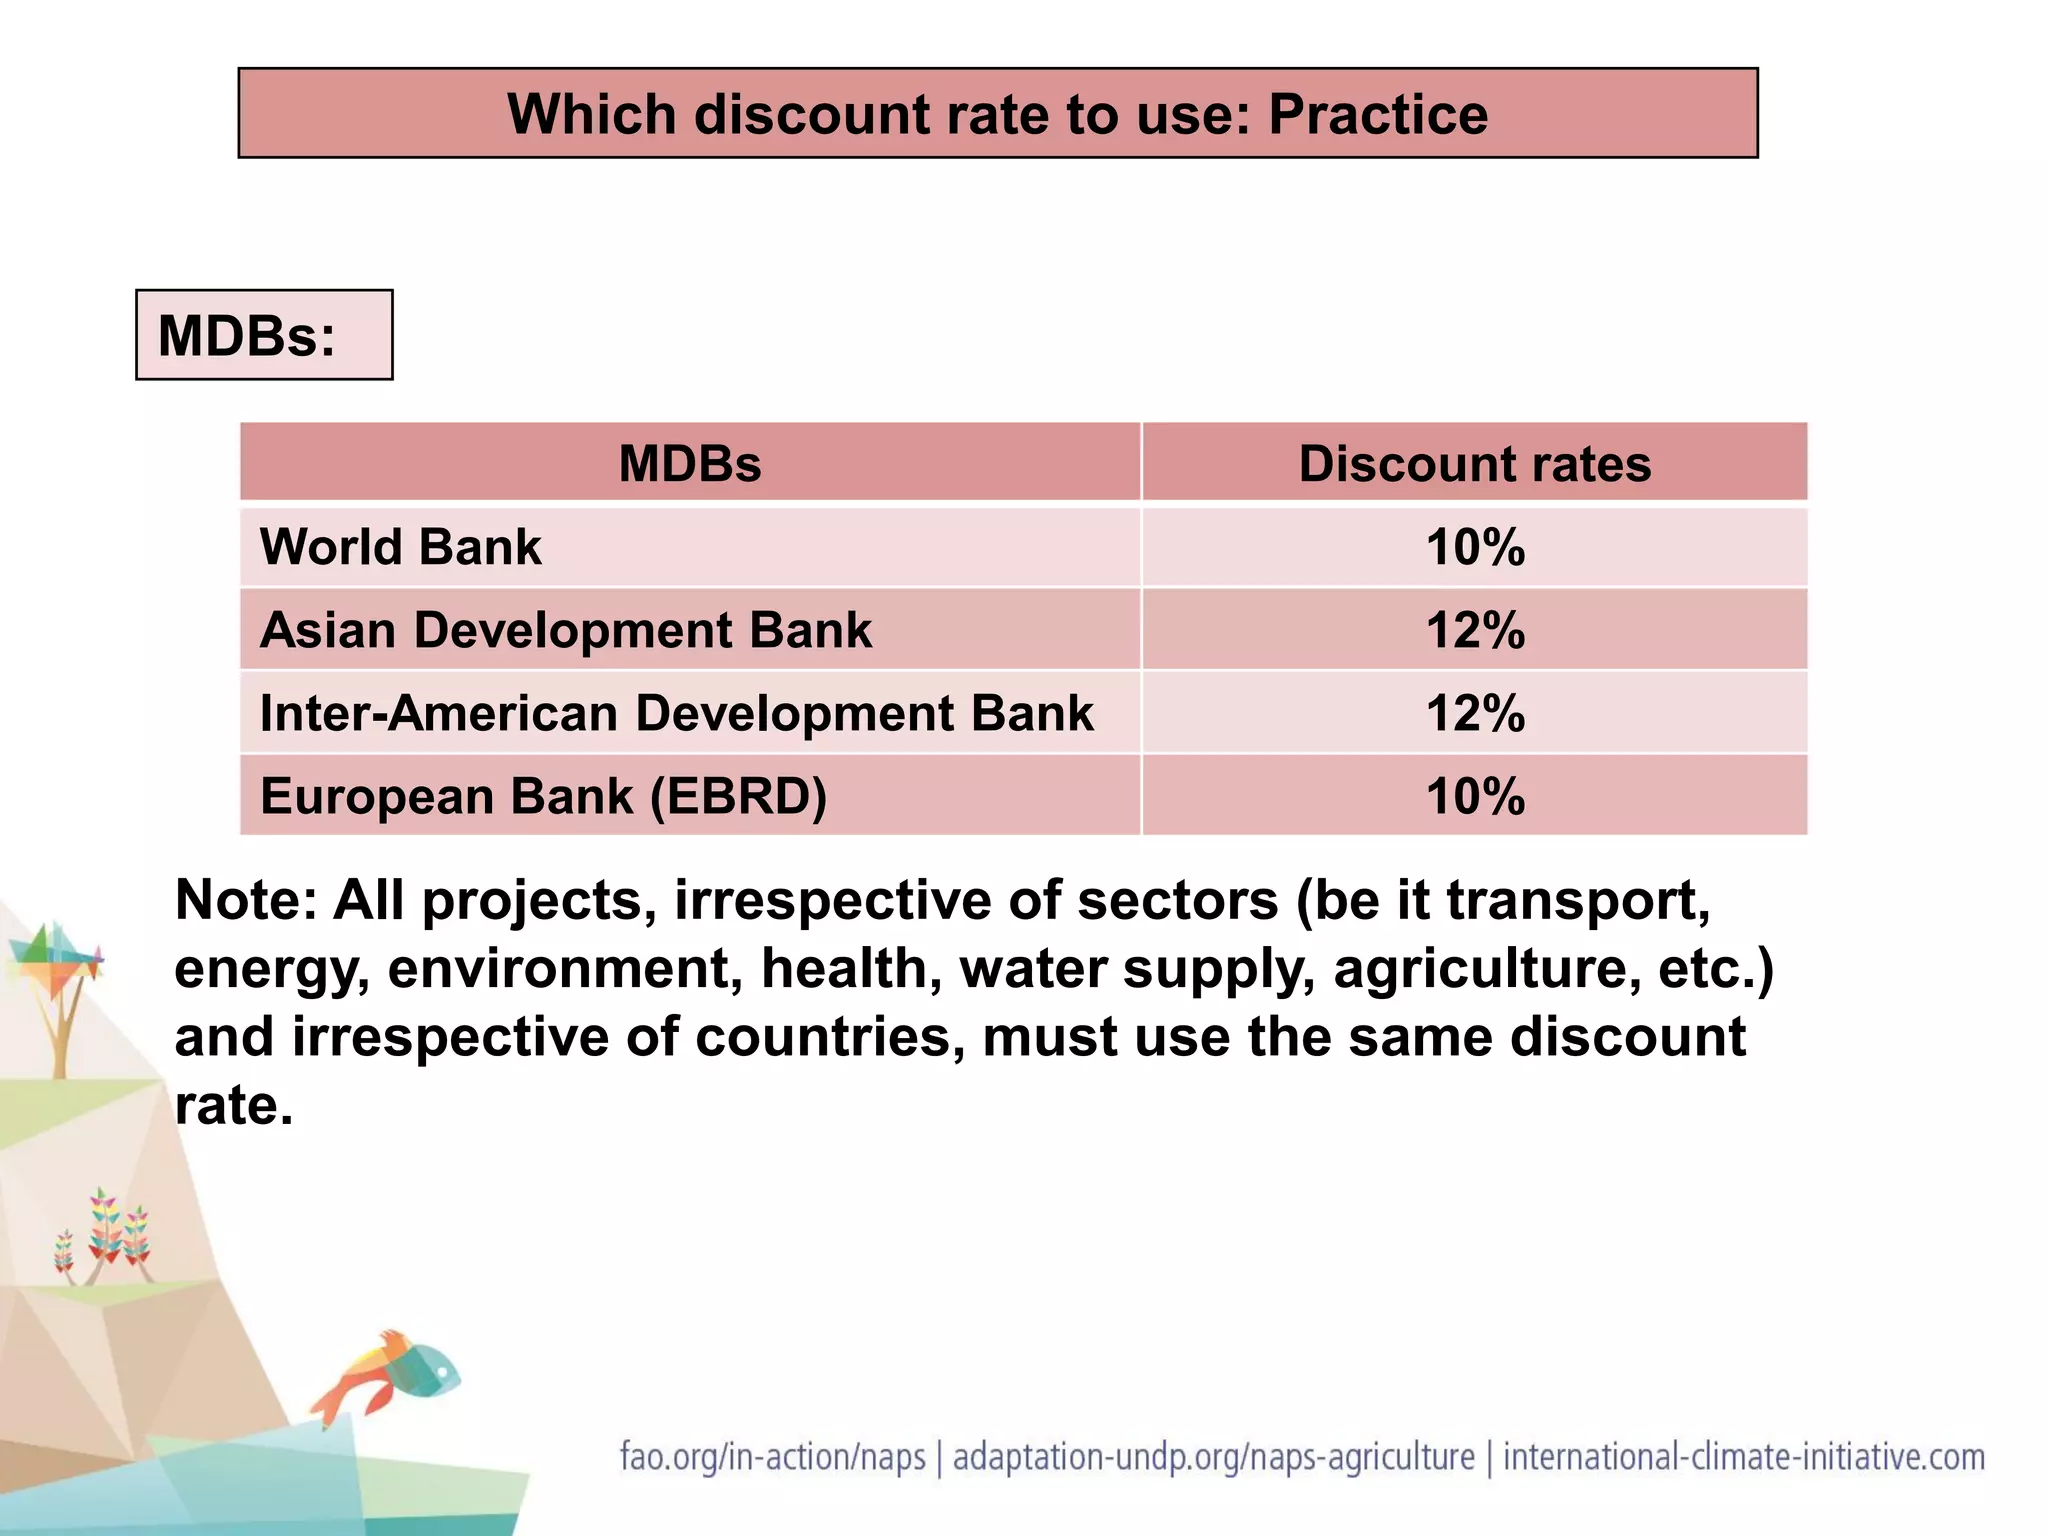
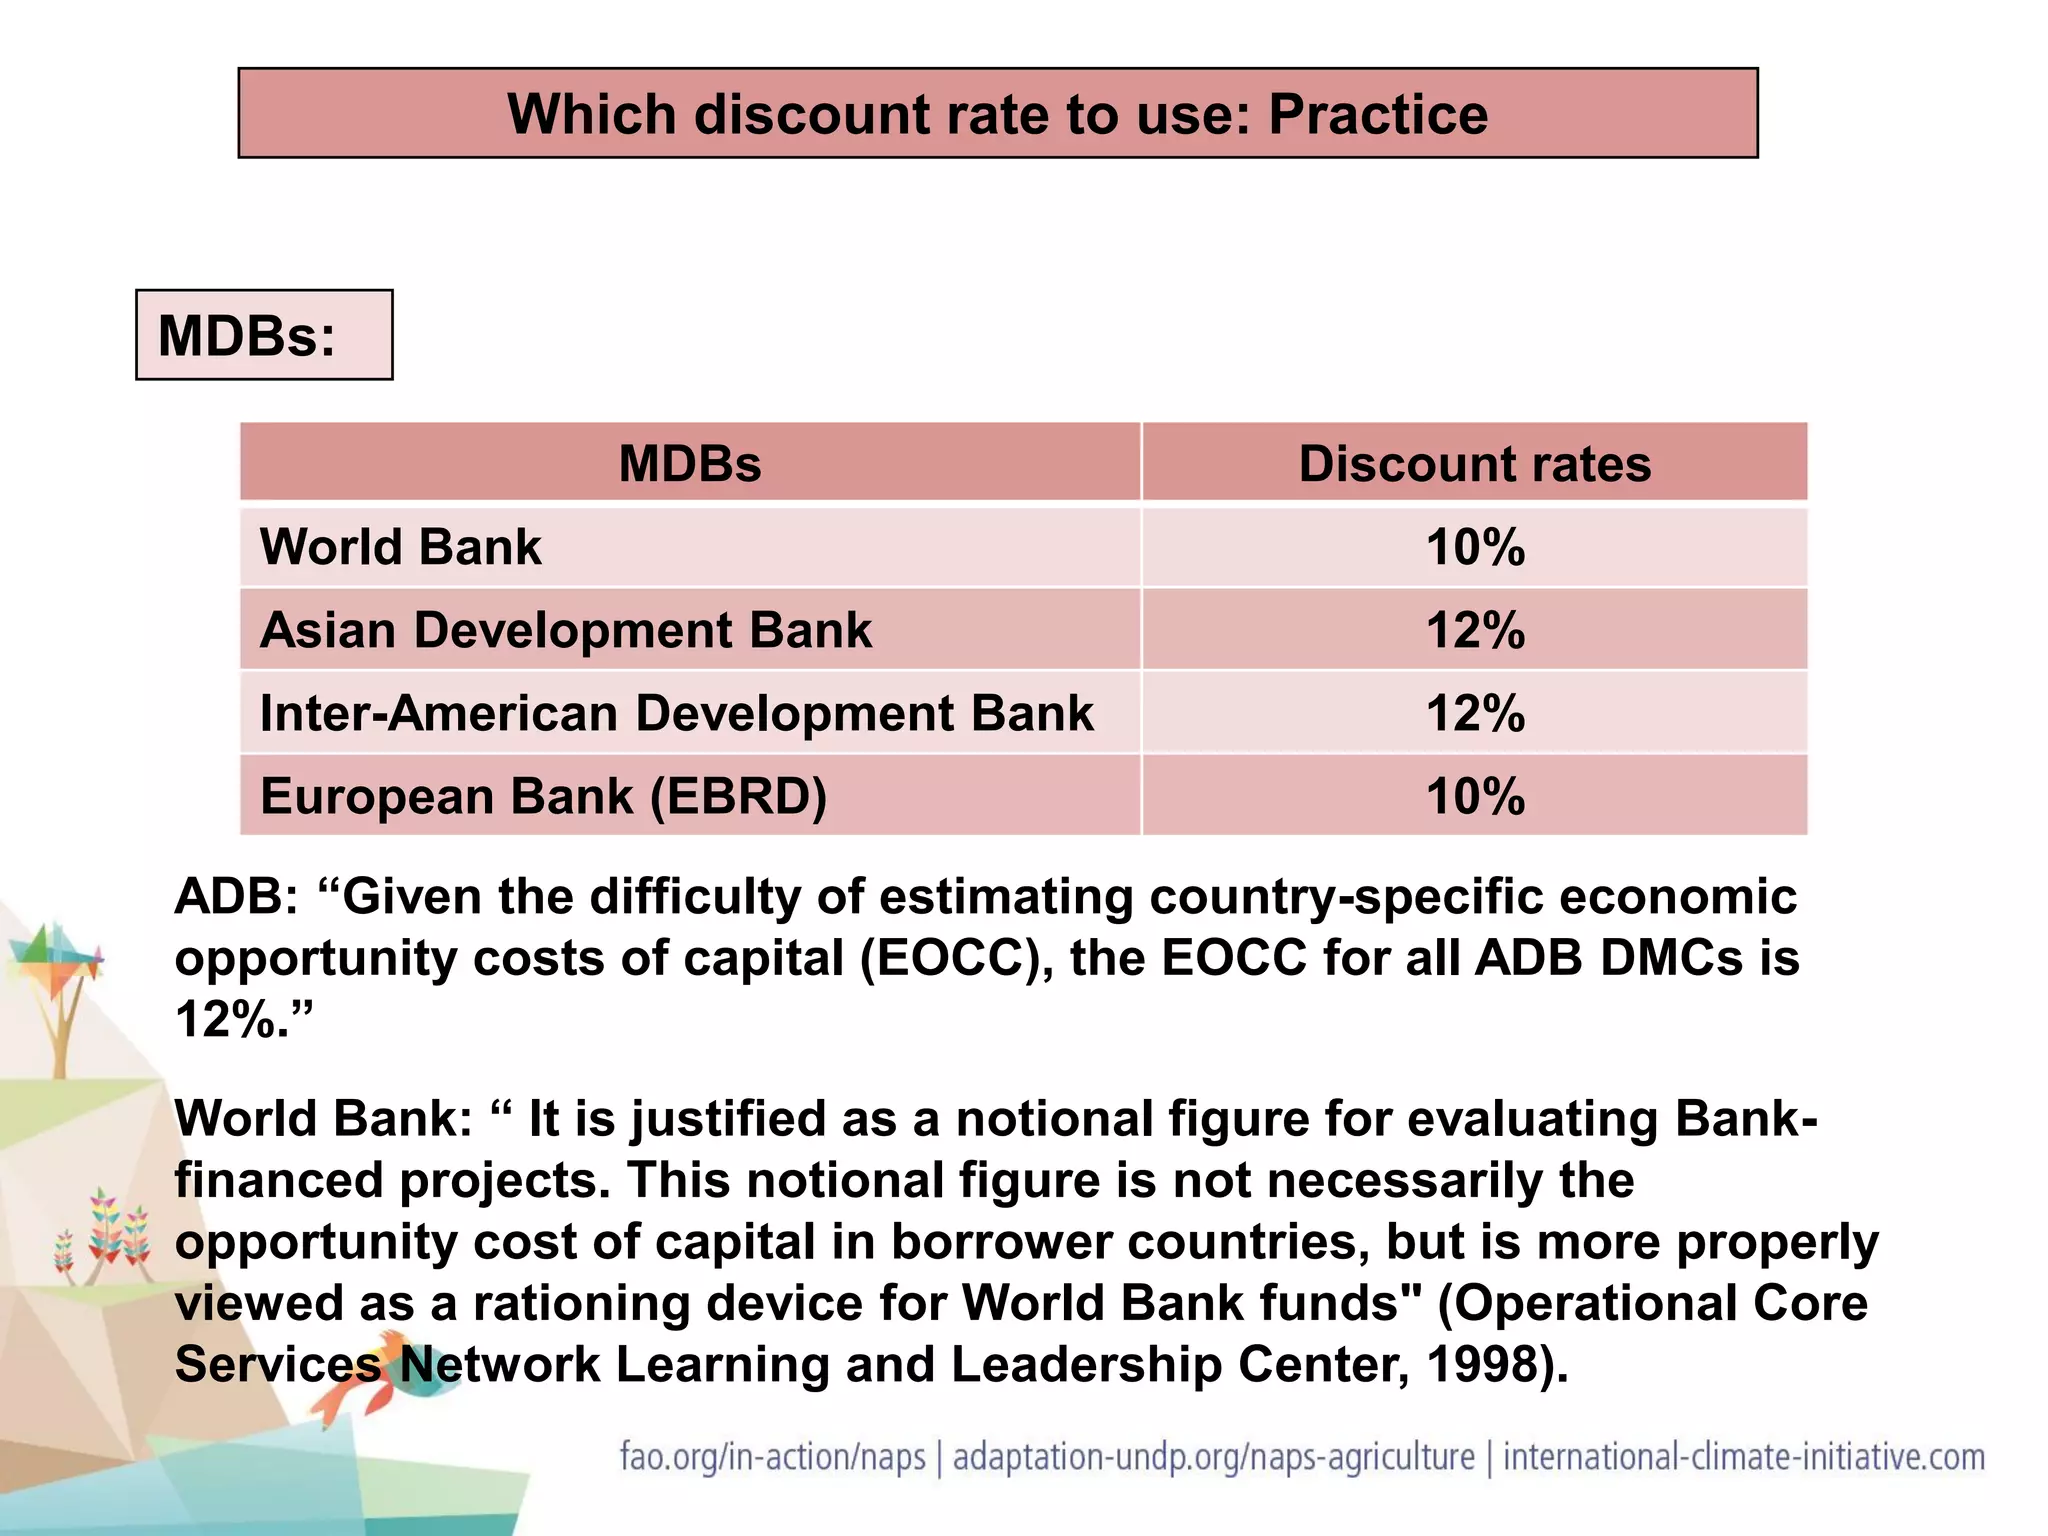
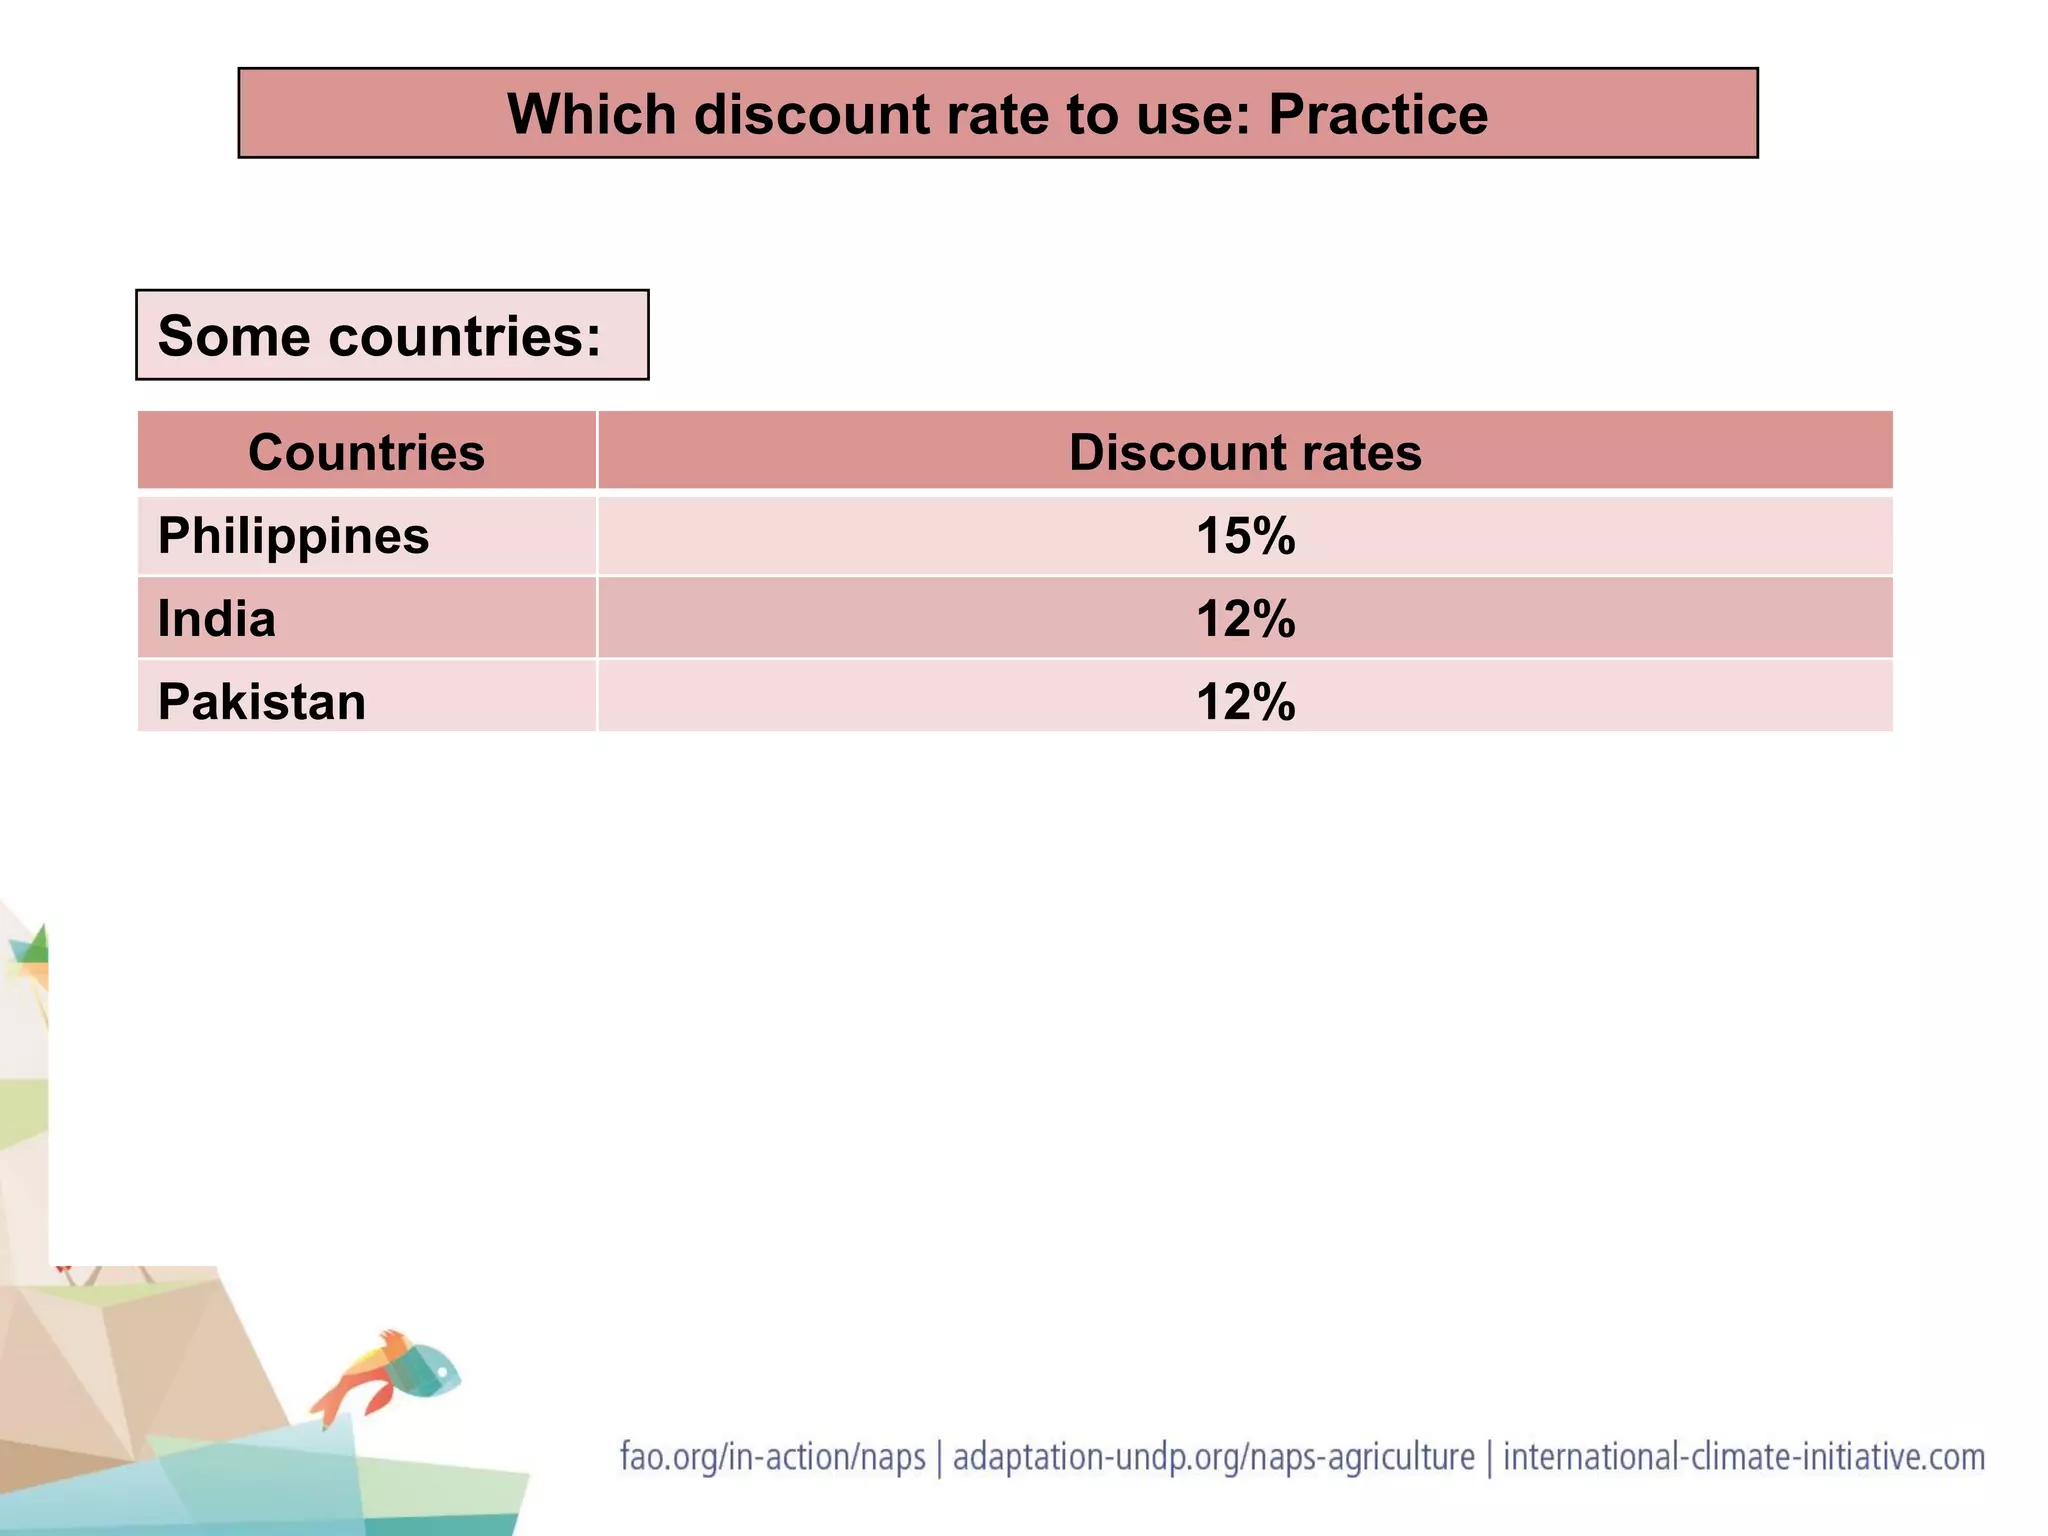
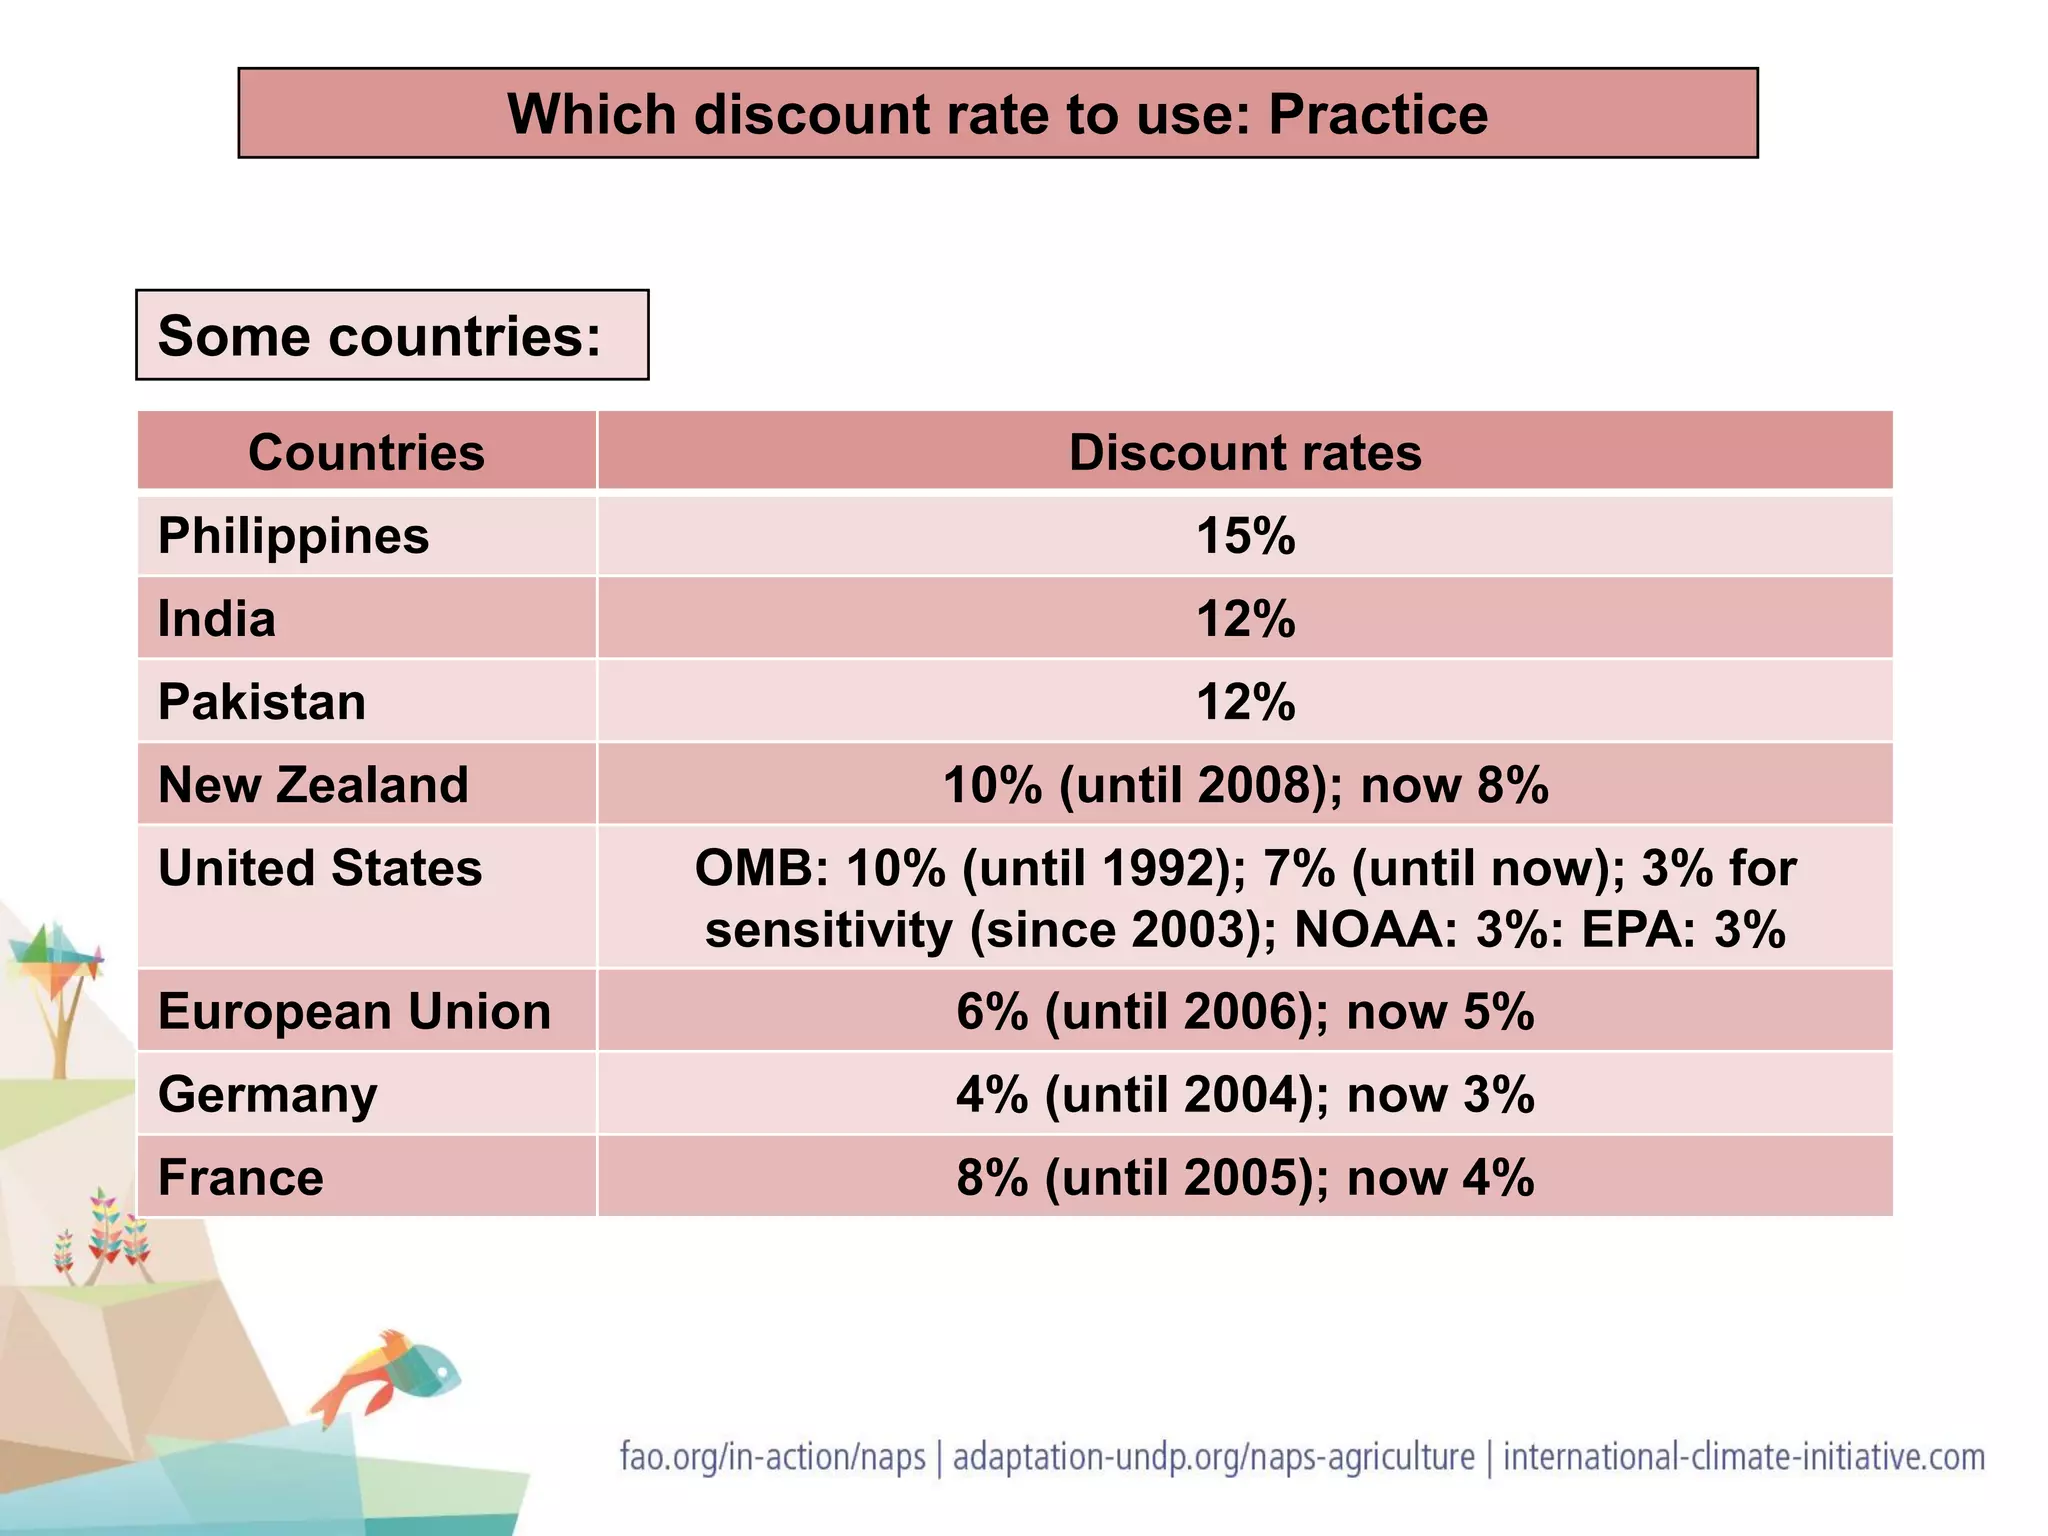


The document outlines a presentation on the methodology of cost-benefit analysis (CBA), detailing eight key steps including discounting and monetizing impacts to assess a project's viability. It emphasizes the importance of selecting an appropriate time horizon for analysis based on the expected duration of project impacts rather than just the infrastructure's lifespan. Additionally, the presentation discusses various discount rates used by multiple development banks and countries, illustrating the complexities of inflation consideration in CBA.


