Download to read offline


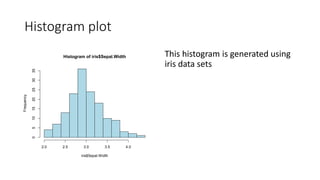
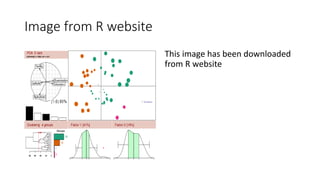
This document contains a histogram plot of iris sepal width data generated using the R and ReporteRs packages, along with an image downloaded from the R website. The histogram shows the frequency of iris sepal widths ranging from 2.0 to 4.0.